






Abstract
1 Background
1.1 DESCRIPTION OF THE PROBLEM
Corruption and inefficient allocation of resources in service delivery are widespread in low and middle income countries (Pande & Olken, 2011). There is increasing evidence that corruption holds back countries' economic development and erodes their citizens' quality of life (Mauro, 1995; Svensson, 2005; Singer, 2013). Millions of people around the world encounter administrative corruption in their daily interactions with public services. Using a 0-100 scale on perceived levels of public sector corruption, only a third of the 176 countries covered in the Transparency International Corruption Index 2012 scored above 50. The World Bank Institute estimates that total bribes in a year amount to about one trillion USD (Rose-Ackerman, 2004), making corruption account for around three per cent of world GDP (Svensson, 2005). Bribes are used to influence the actions of public officials, usually to prevent them from performing their duties. For instance, under the presidency of Fujimori in Peru, there is direct evidence in the form of signed receipts that politicians and judges received bribes ranging from 3,000 to 50,000 USD and the media received as much as 1.5 million USD per month for turning a blind eye to government malfeasance (McMillan & Zoido, 2004).
In many countries, corruption is widespread throughout the public sector, not only among high level public officials. . Gorodnichenko and Sabirianova (2007) estimate the aggregate amount of bribes collected by low and medium level public officials in Ukraine to be between 460 and 580 million USD, about one per cent of its GDP. Administrative corruption imposes a heavy burden on citizens' and firms' time and resources. Olken and Barron (2009) estimate that 13 per cent of the cost of a truck driver's trip in Indonesia is allocated to pay bribes to police officials that they encounter on their journey. Svensson (2003) finds that bribes represent eight per cent of firms' production costs in Uganda.. Corruption creates discontent with public services, undermines trust in public institutions (Sacks & Larizza, 2012; Singer, 2013), and stifles business growth and investment. Khwaja and Mian (2005) find that politically connected firms receive substantially larger loans from government banks in spite of having a 50 per cent higher default rate.
Resources needed to improve equality of opportunities and provide services for citizens are lost every day as a result of corruption and inefficiency (World Bank, 2003), which in turn results in inadequate provision of key services. Often, it is the poor and the vulnerable who suffer the most from public sector corruption (Olken, 2006; Sukhtankar, 2011). A landmark study in Uganda found that only 13 per cent of the public funds that the central government had assigned to the school system reached the intended destination (Reinikka & Svensson, 2004, 2005, 2011). Similarly, leakages are also a problem in Tanzania, where elected officials are the recipients of more than half of the total amount of subsidised fertilizer's price vouchers (Pan & Christiaensen, 2012). In Indonesia, village officials hide their corruption by deflating quantities, that is, they claim to procure enough rock, sand, and gravel to build a road that is 20cm thick, but instead build a road that is only 10cm or 15cm thick. Since the roads they build are thinner than official engineering guidelines, they will not last nearly as long and will need to be replaced sooner (Olken, 2007; 2009). In India, the lack of monitoring and accountability has resulted in high levels of public sector absenteeism, with one quarter of all the teachers in public schools and more than a third of nurses and doctors being absent from their duties (Chaudhury et al., 2006). Corruption has also impacted on service delivery in Brazil. Municipalities where corruption in education has been detected have test scores that are 0.35 standard deviations lower than those without corruption, as well as higher rates of dropout and failure. Moreover, teachers in corrupt municipalities are 10.7 per cent less likely to receive pedagogical training and less likely to have a computer or science lab (Ferraz et al., 2012).
For this systematic review, we define corruption as dishonest or fraudulent conduct by those in power. A big issue in the literature is the difficulty in measuring corruption accurately (Pande & Olken, 2011). As a consequence, each study measures it in a different way, reflecting the multi-faceted nature of corruption (Campos & Pradhan, 2007). We will review corruption estimates from both the forensic economic literature (Zitzewitz, 2012) as well as measures based on perceptions of corruption. An example from the forensic economic literature is Olken's study, (2007), where he measures corruption by comparing an estimate of what the project actually cost to what was reported on an item-by-item basis.
We refer to service delivery as the process through which basic services, such as education, health, and security are delivered to communities. 1 We will define service delivery outcomes as access to and quality of the service. For example, if the goal of the intervention is to facilitate household access to clean water, the percentage of access to clean water and water quality is the outcome of interest. If the goal is to monitor school performance, children's tests scores is the desired outcome.
1.2 DESCRIPTION OF THE INTERVENTION
The idea that community members have incentives to monitor providers and demand better services (Stiglitz, 2002) led practitioners to believe that allowing communities to have monitoring power over providers could be beneficial for improving service delivery and reducing corruption in both the short and long term. In the short term, it could improve outcomes by identifying pockets of corruption and inefficiency in service delivery. In the long term it may contribute to changes in political norms and to establishing a transparent and accessible channel of communication for the community to provide feedback to providers and politicians on a regular basis.
This set the stage for a move to encourage governments in developing countries to become accountable to their own citizens, in an attempt to reform institutions from the bottom up. As a consequence, over the last two decades programs aimed at encouraging community monitoring have been introduced in countries spanning continents and cultures including Albania, Argentina, Brazil, Cambodia, Cameroon, Colombia, Kenya, India, Indonesia, Malawi, Philippines, South Africa, and Uganda, among others.
This idea was operationalised by the introduction of
The Association for the Empowerment of Workers and Farmers in India was the first organisation to introduce a social accountability initiative, through social audits in the early 1990s (Maru, 2010).
2
Association workers read out government accounts and expenditure records at community meetings, and then invited villagers to testify to any discrepancies between official records and the villagers' personal experience. Since then, a range of different community monitoring initiatives have been implemented. The four major categories of such interventions are information campaigns, scorecards/citizen report cards, social audits, and grievance redress mechanisms. These four sub-categories of community monitoring share two common elements: a clear objective of reducing corruption and improving service delivery, and using encouragement of the community to monitor service delivery as a key intervention instrument.
Table 1 below summarises the key components of these interventions.
Interventions Aimed to Increase Civic Participation in Monitoring Public Officials and Providers.
Information Campaigns are one of the most common interventions to encourage participation and interest in service delivery monitoring. They usually involve provision of information on the benefits of the service to be delivered (health, education, police, and so on) and the current state of the service in the community. The information could be provided door to door, in public gatherings aided by local leaders, through radio, newspapers or other means. Kefeer and Khemani (2011), for example, study the impact of having access to community radio programs on the benefits of educational attainment in Benin. Information campaigns can also include information on how to monitor providers. For example, Banerjee et al. (2010) conduct a randomised evaluation of three interventions to encourage beneficiaries' participation in India's educational system. Prior to conducting the interventions, information was provided on the state of educational performance. They then a) provided information on existing institutions, Village Education Committees (VECs), to monitor schools, b) trained community members in a testing tool for children, and c) trained volunteers to hold remedial reading camps for disadvantage children.
Scorecards 3 , often referred to as citizen report cards, are another way in which to encourage citizen to participate in monitoring service delivery. The rationale is that by giving citizens a voice, they will be encouraged to demand better services. For example, Björkman and Svensson (2009) analyse the impact of a scorecard community monitoring intervention on primary health care in Uganda. For the intervention, a non-governmental organisation (NGO) facilitated village and service provider staff meetings in which members of the communities discussed baseline information on the status of health service delivery relative to other providers and the government standard. Community members were also encouraged to develop a plan identifying key problems and steps that providers should take to improve health service delivery. An important difference between information campaigns and scorecards is that the latter can include an interaction between citizens and providers, while the former does not include a forum for such interaction.
Social Audits involve interactions not only between citizens and providers, but also with politicians, as for instance in Colombia's Citizens Visible Audit (CVA) (Molina, 2013b). As part of this program, infrastructure projects providing local public goods, such as water and sanitation infrastructure, schools and hospitals, included an additional CVA component. A social audit involves: dissemination of information through radio, newspapers and local TV about the CVA program in the neighbourhoods where the project takes place; introduction of the infrastructure project to the community in a public forum. Citizens are told about their rights and entitlements, including the activities they can do to monitor the project and the responsibilities of the executing firm. A group of interested beneficiaries is established and trained to carry out community monitoring activities; periodical public forums, bringing together local authorities, neighbours, and representatives from the firm carrying out the specific project. The state of the project is explained in detail to the community, who can voice concerns and recommendations. Commitments are made by the firm, the local government, and project supervisor to solve the problems that may arise during the project. These commitments are monitored by the community, the facilitators from the central government and the project supervisor. If the problem persists, administrative complaints are submitted to the Supreme Audit Body in the central administration; regular monitoring of the project by the beneficiary group and collection of information on whether commitments are being honoured and any other new problem that may arise; presentation of the finalised project to the community before making the final payment to the executing firm, and sharing of the audit results with all interested and concerned stakeholders.
Social Audits can also involve citizens as decision makers. In this case, citizens have the power to make actual decisions over the project. The extent of the decisions over which the community has control, however, varies. An example of a CMI where citizens had decision power is the Kecamatan Development Program (KDP) in Indonesia (Olken, 2007). This program funded projects in about 15,000 villages each year. Each village received an average of 8800 USD, which was often used to surface existing dirt roads. To control the use of funds, checks were built into KDP. First, funds were paid to village “implementation teams” in three instalments. To receive the second and third payments, the teams had to make accountability reports at an open village meeting. Second, each project had a four per cent chance of being audited by an independent government agency. The study introduced two anti-corruption strategies: enhancing community participation and increasing government audits. To enhance community monitoring, invitations to the community meetings were randomly distributed throughout the village. It is important to note the community decides how to allocate the funds before monitoring the project, which differentiates it from studies on CMIs describe above. 4
Grievance redress mechanisms (GRMs) provide people with opportunities to use information to influence service delivery. GRMs capture different mechanisms that provide citizens with opportunities to use information redress to influence service delivery and give feedback on government programs and services. Such mechanisms include complaint hotlines, informal dispute resolution mechanisms, and courts (Ringold et al., 2012).
1.3 HOW THE INTERVENTION MIGHT WORK
Figure 1 presents a stylised theory of change of a typical community monitoring program, clarifying the mechanisms through which the program is expected to have an impact on corruption and service delivery. A typical CMI begins by attempting to make the project or service that it aims to monitor salient in the community. This is usually done though a communication campaign (building block 1) using as many mediums as possible, such as radio, newspapers, door to door campaigns, and local TV. The campaign's primary objective is to increase citizen knowledge of (a) the performance of the service to be monitored and/or (b) the importance of the service or project for the community.
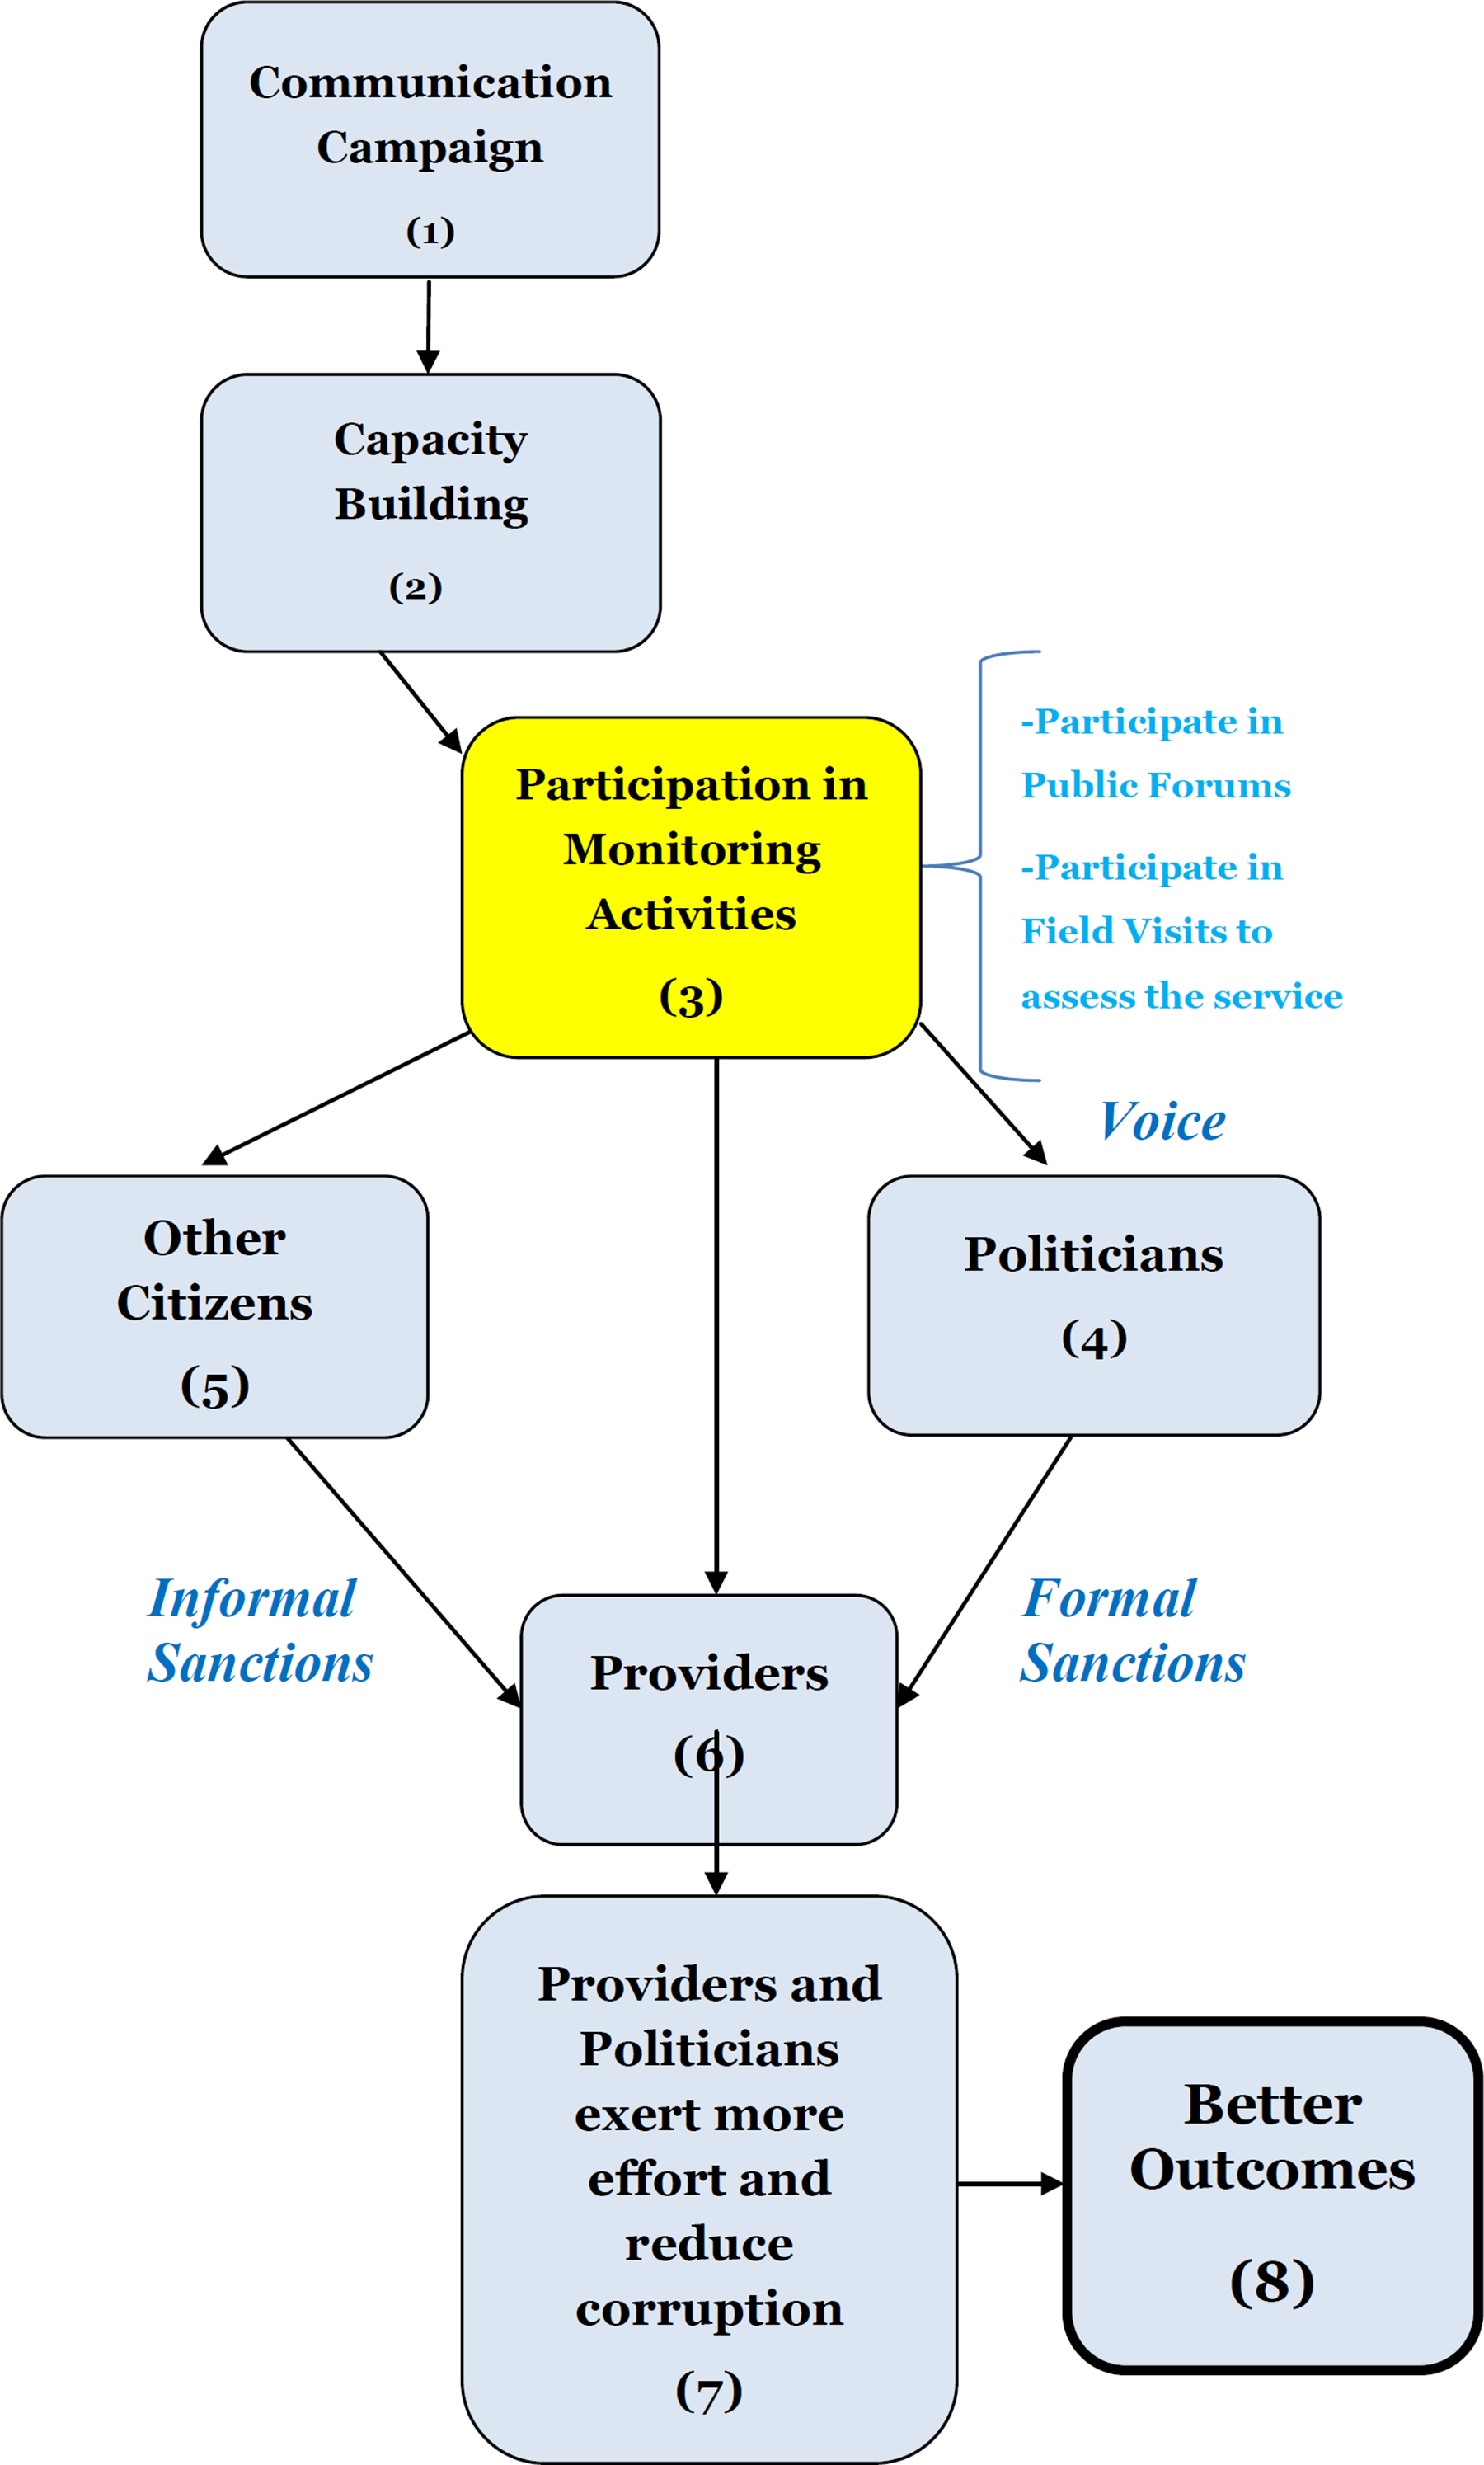
Theory of Change for Community Monitoring
Equipped with this information, citizens can engage in different activities. For instance, they might change their private actions, or contact fellow community members to collectively pressure providers and politicians to improve the quality of the service through monitoring activities. To encourage citizens to monitor service providers, CMIs usually include activities to build the capacity of beneficiaries to monitor providers. For instance the CVA in Colombia provides information about the contractual obligations of the provider, ways for citizens to detect problems and to whom inquiries about the project should be directed to.
Empowered with information from building block 1 and/or 2, citizens are expected to solve the collective action problem and invest their time and effort to participate in monitoring service delivery (building block 3). Participation in monitoring activities could take many forms, depending on the specific CMI. For instance, social audits have public forums and scorecards and can include meetings between providers and citizens. Participation in the CMI will be influenced by the strength of the community to act collectively. For example, communities with a history of grassroots participation are expected to organise more rapidly and more efficiently. As an organised group, citizens can take turns to visit the place where the service or project takes place (for example, a school, construction site or hospital) and collect information on its problems (for example absenteeism, use of low quality inputs in the construction process, unresponsive front-line providers). Citizens can then contact providers (building block 6) and/or elected officials (building block 4) to file complains about the service and provide valuable information on the specific problems the service is facing. In addition, citizens are expected to share the information collected by monitoring providers with their fellow neighbours that did not take part in monitoring activities (building block 5), to increase visibility of the community monitoring intervention and put pressure on providers and politicians. Finally, the independence and strength of the local media is assumed to impact upon the visibility of the project (Reinikka & Svensson, 2005; Ringold et al., 2012).
Citizens' participation in the program reduces the cost of monitoring front-line providers for politicians and managers. Citizens' monitoring activities also increase both visibility and citizens' ability to recognise whether elected officials are making an effort to reduce corruption and improve service delivery. As a result, there is a greater incentive for politicians and policymakers to achieve better results and to put more pressure on providers to improve service delivery (building block 7). The threat of formal sanctions by politicians and/or informal sanctions by citizens are assumed to motivate service providers in to exerting greater effort (building block 7).
While the description above fits different type of CMI interventions, there are some features that are specific to each intervention. Below we describe two additional components of social audits and scorecards respectively. Scorecards have an added accountability mechanism through which citizens meet with service providers to discuss how to improve the service. This face-to-face interaction introduces intrinsic motivation arguments for the service providers, which may contribute to improving their performance. This will be moderated by whether it is credible for a given community to establish an informal system of rewards and sanctions. Additionally, the meeting could result in new ideas for providers and citizens on how to use and manage the service in a more efficient way.
Social Audits also have an additional component in the form of public forums, where representatives from the local government, the executing firm, the central government, and the community are present. It allows citizens to make their voice heard by local officials and providers, and reduces the time and effort citizens would need to invest to get an appointment with these officials. The public forums also reduce the cost for central government representatives to be heard by local officials. Finally, it reduces the cost of local officials to take actions to solve problems that arise during the construction of the infrastructure projects, such as lack of planning, lack of resources to finish the project, and acts of corruption. The symbolic act of the public forum may also signal to politicians and providers the importance of performing well on this project, as citizens are paying extra attention.
There are several empirical implications from this overall theory of change: CMIs will increase the quantity and the degree to which citizens are involved in monitoring service providers. As a result of the CMIs, politician and providers will exert more effort and improve their performance in relation to service delivery. CMIs will reduce the probability of corruption. CMIs will improve access and quality of the service provided.
There are several assumptions underlying this theory of change, which must hold in order for it to accurately describe the process through which a CMI impacts on service delivery. Citizens need to participate in monitoring activities and politicians and providers need to be accountable. For citizens to participate, they need to have adequate information on how to monitor the project, be able to pay the opportunity cost of participation and coordinate their actions to monitor the project. Finally, they should believe the program has the potential to be successful. In the case of providers and politicians, they need to gain popularity, increased salary and/or social recognition for their responsiveness. If these assumptions are not met, the underlying program theory of the CMI breaks down and this may prevent CMIs from having an impact on service delivery. In particular, whether or not they hold true can can affect citizens' decision on whether to monitor government activity and the governments' willingness to facilitate citizen engagement and become more accountable. Below we present the bottlenecks as well as the empirical implications.
One potential concern with CMIs is that citizens will fail to participate in monitoring activities (building block 3). We have identified six potential bottlenecks 5 that could prevent citizens from participating in monitoring activities, which in turn reduces the potential impact of the program (see Table 2). In particular, if community monitoring activities are not carried out, or carried out by only a few citizens, their ability to uncover problems and put pressure on the government to provide accountability can be significantly reduced.
Bottlenecks preventing citizens from participating in monitoring activities
Under this heading we present potential reasons for a lack of responsiveness on the part of the politicians and providers. The literature cites many reasons why politicians and providers may not be accountable to their citizens (building block 4 and 6). Below we identify three potential bottlenecks.
1.4 WHY IT IS IMPORTANT TO DO THIS REVIEW
Community monitoring interventions have gained widespread acceptance as a tool to improve transparency and accountability by all the major players in the practitioners' world, that is, governments, NGOs, and the donor community. Increasing citizen participation in government decision making and policy formulation is the main objective behind the Open Government Partnership (OGP), a global consortium of governments. Through OGP, more than 50 countries around the world have already agreed upon different goals related to transparency and citizen participation. Moreover, international aid agencies increasingly require development projects to include ‘beneficiary participation’ components. Over the last decade the World Bank alone has channelled 85 billion USD to local participatory development (Mansuri & Rao, 2012).
The United Nations have set increasing citizen participation as their main strategy to achieve good governance and human rights (UN, 2008), and NGOs with a focus on increasing government accountability through citizen participation continue to expand around the globe, managing increasing amounts of resources. For instance, Transparency International has an annual budget of 36 million USD, which they use to advocate for increasing citizen engagement as a necessary step for development (Transparency International, 2013). Other examples of NGOs are Twaweza and the Affiliated Network for Social Accountability (ANSA). Twaweza engages in building citizen capacity to monitor governments and foster their accountability across East Africa and has an annual budget of 17 million USD. ANSA is currently operating in East Asia and the Pacific, South Asia, Africa, Middle East and at the global level to support civil society organisations in their efforts to monitor governments in service delivery and to build demand for public accountability.
Finally, through the newly created Global Partnership for Social Accountability (GPSA) a coalition of donors, governments and civil society organisations aim to improve development results by supporting capacity building for enhanced citizen feedback and participation to monitor service delivery. GPSA aims to reach overall funding of 75 to 125 million USD over the next seven years. To date, 15 countries have joined the GPSA: Bangladesh, Belarus, Colombia, Dominican Republic, Honduras, Indonesia, Kyrgyzstan, Malawi, Moldova, Mongolia, Mozambique, Philippines, Senegal, Tajikistan and Tunisia.
From a theoretical perspective, as we highlighted above, there are no clear predictions as to what should be the impact of these programs. Some authors have found reasons to expect CMIs to have a positive effect on improving service delivery and reducing corruption (Stiglitz, 2002), but others have argued that successful implementation of CMIs might prove more difficult than expected (Bardhan, 2002; Bardhan and Mookherjee, 2006; Olken, 2007; Molina, 2013a). While a number of empirical studies have been conducted in recent years, we still lack a clear picture on the impact of community monitoring programs.
Thus, whether CMIs actually affect the behaviour of beneficiaries, providers and politicians and in turn reduce corruption and improve access to and quality of service delivery is still an open empirical question. Reports from USAID acknowledge that the lack of systematic evidence limits our ability to make precise claims regarding the relationship between CMIs, corruption and service delivery outcomes (Brinkerhoff & Azfar, 2008). In addition, we still know little about the mechanisms through which these interventions have an impact (or lack thereof).
There are, however, several non-systematic reviews on related issues. Mansuri and Rao (2012) review the evidence on the effectiveness of local participatory programs on an array of outcomes, including service delivery. The study focuses mostly on large-scale interventions such as Community Driven Development (CDD), and Community Driven Reconstruction (CDR). They find that, on average, results are below the expectations of these programs, and suggest the reason for this may be a failure to build cohesive and resilient organisations to pressure the government. In particular, they argue that both local and national contexts may be key factors in determining effectiveness, in part because not all communities have a stock of social capital that can be readily harnessed though a participatory intervention. Finally, they argue that induced participatory interventions work best when they are supported by a responsive state and when local accountability institutions are robust.
Moreover, Hanna et al. (2011) and Pande and Olken (2011) review studies of interventions aimed at reducing corruption. However, they do not provide comprehensive reviews of the literature on effects of community monitoring and use narrative methods of synthesis rather than meta-analysis. Ringold et al. (2012) review the effects of CMIs on human development, and while it is relatively comprehensive, it is a narrative review rather than a systematic review. It identifies some key impediments to the successful implementation of CMIs: a) information asymmetries between citizens and providers, b) individuals may not use the opportunity to influence service providers, c) providers that are not amenable to change, and d) fragmented civil society and weak media.
Similarly, Devarajan et al. (2011) review interventions aimed at strengthening the role of civil society in service delivery and government accountability, focusing on Sub-Saharan Africa. The review, which is not systematic, finds preliminary evidence of the positive effects of building organic participation and building on existing political and civil society structures, on service delivery and government accountability. The findings are mediated by the local context, as in communities where clientelism and rent-seeking were widespread, civic participation failed to have an impact on service delivery and government accountability.
Gaventa and Barret (2012) perform a meta-case study of 100 interventions aimed at increasing citizen engagement in service delivery. The search for literature was limited to the studies undertaken by the Institute of Development Studies between 2000 and 2011. For the 828 outcomes from the 100 reviewed case studies, only 153 came from interventions where the final goal was to strengthen the responsiveness and accountability of the state to provide services. Results indicate that 55 per cent of those 153 outcomes were positive and 45 percent were negative. Negative results are associated with failure of citizens to participate, due in part to fear of backlash against those who speak out and a sense of tokenism in the participation mechanism.
Finally, high quality primary studies find what at first appears to be contradicting evidence regarding the effect of CMIs on service delivery outcomes. Björkman and Svensson (2009) find that community scorecards in Uganda significantly increased the quality and quantity of primary health care provision. Banerjee et al. (2010), however, find the opposite result when testing the effect of an information campaign in India. They report that neither giving citizens information on how to use existing institutions to monitor schools nor training them in a testing tool to monitor children's learning had any statistical impact on children's learning performance.
To date, no systematic reviews have been conducted on the effectiveness of CMIs for reducing corruption and improving service delivery outcomes and the inconclusiveness found in theoretical and empirical work described above highlights the need for systematic evidence on the subject. The existing reviews provide some suggestive evidence of the effects of CMI, but come to different conclusions, in an area that is hotly debated and of key policy importance. Our systematic review aims to shed light on this debate by providing a systematic and exhaustive literature search, together with a comprehensive and unbiased synthesis of the existing evidence.
2 Objectives of the review
Our systematic review aims to assess and synthesise the evidence on the effects of CMI interventions on access and quality of service delivery and corruption outcomes. We introduce a theoretical framework to understand the pathways of change of the CMIs interventions. Using this framework, we aim to uncover the facilitators and barriers for CMIs to successfully reduce corruption and improve access to and quality of service delivery. The review will systematically collect and synthesise evidence from high quality impact evaluations of CMIs. Outcomes will be synthesised along the causal chain, from intermediate outcomes such as participation in the monitoring activities through to public officials and providers' responsiveness, to final outcomes such as corruption and access to and quality of the services provided.
The review aims to answer the following questions: What are the effects of CMIs on access and quality of service delivery, and corruption outcomes in LMICs, relative to no formal community monitoring or CMIs with less community representation? What are the mechanisms through which CMIs have an effect (or lack thereof) on improving service delivery outcomes and reducing corruption? Do factors such as region, income level or length of exposure moderate the effects of CMI on intermediate and final outcomes?
3 Methods
Our review will strive to answer these questions by synthesising evidence from both quantitative and qualitative studies. The review will follow Campbell and Cochrane Collaboration approaches to systematic reviewing (Higgins & Green, 2011; Shadish & Myers, 2004; Shemilt et al., 2008). The review is also informed by theory-based impact evaluation (White, 2009), using the theory of change (Figure 1) as the framework for the review, to guide the types of studies to be included, data collection and analysis. To ensure the review is adequately oriented towards both reporting effects and explaining the reasons for them, we will synthesise effects along the causal chain, including qualitative evidence where appropriate, using the effectiveness plus approach (Snilstveit, 2012; Snilstveit et al., 2012). For the quantitative synthesis we will use meta-analysis to pool study effects where studies are judged to be sufficiently similar to do so.
1.1 CRITERIA FOR INCLUDING STUDIE S IN THE REVIEW [PICOS]
1.1.1 Participants
The review will include CMIs in either low or middle income countries at the time that the intervention was carried out. To assess whether a country is low, middle or high income we will follow the World Bank classification method. For example, for interventions carried out in 2011, to qualify as a low income group gross national income (GNI) per capita should be 1,025 USD or less; middle income, 1,026 USD – 12,475 USD; and high income, 12,476 USD or more. We will include all CMIs in low and middle income countries. The review will exclude CMIs in high income countries. For studies to be included, they will need to collect and report on data at the individual or at the community level. Interventions targeting particular disadvantaged groups, or studies that conduct analysis across disadvantaged groups, will be included in the review.
This inclusion criterion will be used for both quantitative and qualitative studies.
1.1.2 Interventions
We will include community monitoring interventions where the community is given the opportunity to participate in the process of monitoring service delivery, where monitoring means being able to observe and assess providers' performance and provide feedback to providers and politicians. To be included interventions need to: have a clear objective of reducing corruption and improving service delivery; use encouragement of the community to monitor service delivery as a key intervention instrument; fall into one of the following four intervention categories: information campaigns, scorecards/citizen report cards, social audits and grievance redress mechanism.
These interventions have a common theory of change that exactly addresses our objective of interest: whether programs that encourage community monitoring reduce corruption and improve access to and quality of service delivery. Detailed descriptions of these interventions are provided below:
Information Campaigns usually involves information on the benefits of the service to be delivered (health, education, police, etc.) and the current state of the service in the community. The information could be provided door to door, in public gatherings aided by local leaders, through radio, newspapers and other means. Kefeer and Khemani (2011), for example, study the impact of having access to community radio programs on the benefits of educational attainment in Benin. Information campaigns may also include information on how to monitor providers.
Scorecards, often referred as citizen report cards, are another way in which to encourage citizen to participate in monitoring service delivery. The intervention takes the form of a quantitative survey that assesses users' satisfaction and experiences with various dimensions of service delivery. It often involves a meeting between the recipients of services and providers to discuss the findings of the survey and to develop a follow-up plan (Ringold et al., 2012). For instance, Björkman and Svensson (2009), analyze the impact of a scorecard community monitoring intervention on primary health care in Uganda. A non-governmental organization (NGO) distributed a quantitative survey (?) and facilitated village and service provider's staff meetings in which members of the communities discussed the results. Community members were also encouraged to develop a plan identifying key problems and steps that providers should take to improve health service delivery. An important difference between information campaigns and scorecards is that the latter can include an interaction between citizens and providers, while the former does not include a forum for such interaction.
Social Audits involves group of citizens collecting information on the implementation of particular public services in relation to expected standards. This allow citizens receiving a specific service to examine and cross-check the information the provider makes available during a mandatory public hearing against information collected from users of the service (Ringold et al., 2012). During the public hearing all relevant stakeholders are present, including citizens, providers, and politicians.
Grievance redress mechanisms (GRMs) provide people with opportunities to use information to influence service delivery. GRMs capture different mechanisms that provide citizens with opportunities to use information redress to influence service delivery and give feedback on government programs and services. Such mechanisms include complaint hotlines, informal dispute resolution mechanisms, and courts (Ringold et al., 2012).
Other interventions may include community monitoring as part of a different intervention. For instance, Community Driven Development Interventions (CDDs), Community Driven Reconstruction Interventions (CDRs), participatory budgeting, and school based management will only be included if they have a clear community monitoring component. In that case, depending on the monitoring component, we will classify them as information campaigns, scorecards, social audits or grievance redress mechanism. The study from Olken (2007) in Indonesia is a case in point. The monitoring program, in this case the social audit, is embedded in a larger intervention, a CDD. We include this type of interventions in our review.
However, there are other CDDs and CDRs where there is no monitoring component. For instance, Casey et al. (2012), who study the impact of a CDR program in Sierra Leona, will be excluded from our review. The reason is that the theory of change for these types of interventions is completely different than for CMIs. Even further, the objectives of these interventions are also different. A similar argument could be made about participative budgeting and school based management. As a result, we will also exclude those interventions from our review when there is no community monitoring component.
Access to information laws provide a legal framework for the public provision of information (Ringold et al., 2012). There are many laws that can potentially improve citizens' abilities to monitor service delivery, for instance, voting rights, laws that allow schools or hospitals to have user groups, the creation of the ombudsman figure, among many others. The theory of change for these interventions is different from the one we develop for CMIs and studies assessing such interventions on their own will be excluded. Such interventions are not defined as community monitoring unless they include an additional component aimed at encouraging community monitoring. For instance, studies assessing the impact of information campaigns which aim to induce citizens to monitor the implementation of such laws fall under our definition of community monitoring, and thus will be included in the review.
These criteria will be used for both quantitative and qualitative studies.
1.1.3 Comparisons: Treatment and Comparison Groups
Even for identical interventions we could have different estimands and/or different counterfactuals. We will include interventions that estimate the impact among the following groups: Community Monitoring Interventions (CMI) as the treatment condition and no formal process of monitoring as the counterfactual. For example, see Björkman and Svensson (2009). CMIs where there is an encouragement for community to participate in monitoring as the treatment condition and CMI with no encouragement as the counterfactual. For example, see Olken (2007).
1.1.4 Outcomes
We will include studies assessing the effects of CMI on the following primary outcomes to address review question (1):
Corruption Outcomes
As we argued above, a big issue in the literature is the difficulty in measuring corruption accurately (Pande & Olken, 2011). In this review we will synthesise two types of corruption measures, forensic estimates and perception measures. Below we provide specific examples:
Forensic Economic Estimates: This refers to the application of economics to the detection and quantification of behaviour (Zitzewitz, 2012), in this case, corruption. In Olken (2007) corruption is measured by comparing the researcher's estimate of what the project actually costs8 to what the village reported it spent on the project on an item by item basis.
Perception Measures: An imperfect way to deal with the fact that it is very difficult to detect and measure the extent of corruption, is to rely on citizen's perception measures of corruption.
For impacts on service delivery we will look at two types of outcome: access and quality of the service. Below we provide specific examples:
Service delivery Outcomes
Access to Service: We will use the percentage of the population that has access to the service to measure this outcome. For example, if the CMI involves an infrastructure program to facilitate household access to clean water, the percentage of the population that has access to clean water will be the primary variable of interest.
Quality of Services: We will use measures of:
Improvement in prevalence condition. For example, Björkman and Svensson (2009) capture the effect of the CMI on infant weight. Additional measures in the health care sector could be mortality rates as well as disease prevalence in general. In Banerjee et al. (2010), there is information on student's reading ability. Additionally, information on test scores would be in this category. For CMIs in the police sector, the outcome indicator could be victimisation rates for each type of crime. In infrastructure projects, we will look at different outcomes depending on whether it is a school, a hospital, or a water and sanitation program. In the last case we could measure the quality of the water that reaches households, as well as whether the service is working all the time or has interruptions. Finally, in Molina (2013b) the author looks at satisfaction with project performance as a measure of the impact of the social audit.
Average waiting time to get the service. This is important for health care interventions as well as those in the security sector. See Björkman and Svensson (2009).
Studies that include at least one of these outcomes will be included in the systematic review. Among those included studies, we will collect and analyse data on a range of intermediate outcomes to address question (2). This means that any study that has an intermediate outcome should also include at least one of the primary outcomes. Below we specify the intermediate outcomes of interest for this review.
These outcomes include changes in behaviour induced by the intervention, such as whether participants contribute to monitoring of the service or project and the behaviour and performance of providers and politicians. These intermediate outcomes are ‘primary’ because they are the most immediate to the final outcomes on the program theory. Below we provide specific examples that follow the logic of the theory of change presented above:
Citizen's Participation in Monitoring Activities: This could be measured by the percentage of citizens that contribute to the monitoring process. If measures of intensity of participation are available, we will also collect them. In the context of the social audit in Colombia this would be the percentage of citizens that spend any time monitoring the project. The more time they spend, the higher the intensity of participation.
Providers' Performance: This outcome could be measured in several ways. Traditionally, absenteeism rates are computed if a direct measure of effort and quality of their performance is not available.
Politicians' Performance: This outcome, though important, is very difficult to measure. We are only aware of Molina (2013b) who measures citizen's perceptions of politicians' performance in an infrastructure project.
1.1.5 Study types
To address review questions 1, 2 and 3, studies eligible for inclusion in the effectiveness synthesis include impact evaluations based on experimental design (where randomised assignment to the intervention is made at the individual or cluster level), quasi-experimental designs (including controlled before and after (CBA) studies with contemporaneous data collection and with two or more control and intervention sites, regression discontinuity designs and interrupted time series studies (ITSs)) and ex-post observational studies with non-treated comparison groups and adequate control for confounding.
For quasi-experimental studies and observational designs with comparison groups, eligible studies must use adequate methods of analysis to match participants with non-participants, or statistical methods to account for confounding and sample selection bias. Appropriate methods of analysis to match participants and non-participants include propensity score matching (PSM) and covariate matching. Appropriate methods of analysis to control for confounding and selection bias include multivariate regression analysis using difference-indifferences (DID) estimation, instrumental variables (IV) or Heckman sample-selection correction models.
Studies that do not control for confounding using these methods, such as those based on reflexive comparison groups (pre-test post-test with no non-intervention comparison group), will be excluded.
Studies eligible for inclusion in the synthesis of evidence answering question (2) includes not only quantitative studies with the criteria mention above but also any qualitative studies of the interventions evaluated in the effectiveness studies. Additionally, we will include background project documentation, project completion reports and process evaluations studying these interventions. For such study, we will evaluate their quality, filtering out studies of particularly low quality (Noyes et al., 2011). For this we will use the Critical Appraisal Skills Programme checklist (CASP, 2006), using the tool developed in Appendix C.
1.2 SEARCH METHODS FOR IDENTIFICATION OF STUDIES
1.2.1 Electronic searches
We will perform searches in indexes such as Social Science Citation Index, JSTOR, International Bibliography of Social Science, EconLit, Citas Latinoamericanas en Ciencias Sociales y Humanidades (CLASE), Plataforma Open Access de Revistas Científicas Electrónicas Españolas y Latinoamericanas (e-Revist@as), Red de Revistas Científicas de América Latina y el Caribe, España y Porgugal (REDALyC), African Journals Online (AJOL), Scopus, the British Library for Development Studies (BLDS), PAIS (Public Affairs Information Service), WPSA (Worldwide Political Science Abstracts), IPSA (International Political Science Abstracts), CIAO (Columbia International Affairs Online), ABI/Inform (Ebsco), ELDIS, CAIRN and Google Scholar.
These databases cover a wide range of journals, including those from low – middle income countries that may be overlooked in global indexes. Initial searches will be based on keywords derived from our research questions. All searches will be stored to ensure replicability.
We will search using a combination of the group of keywords presented in the Table 3. The combination within each group is given by the Boolean operator OR, and between groups by AND.
Bottlenecks causing a lack of responsiveness from politicians and service providers
Search keywords
Keywords will be translated to Spanish, French, and Portuguese.
The search strategy will be adapted to the particularities of each database. In particular, we will use the operators NEAR between the group one and two, and ∼ (similar) before every keyword, depending on the maximum number of keywords and where possible in a search engine. We will limit the searches to low or middle income countries. We will use ENDNOTE to record searches, and collect and organise references
1.2.2 Other Searches
We will try to avoid the bias against unpublished and non-English literature by searching in Google, Google Scholar, REPEC-IDEAS, NBER, Global Development Network, Networked Digital Library of Theses and Dissertations Index to Theses, 3ie database and the ProQuest dissertation database using the set of keywords described above.
We will also search using the following additional methods: Screening the references of included studies and existing reviews for eligible studies. Running citation searches of all included studies using Social Sciences Citation Index, Scopus and Google Scholar. Searching in conference programs and websites of key institutions; such as the World Bank, UNDP Governance Projects, Asian Development Bank, African Development Bank, Inter-American Development Bank, Open Government Partnership, Research centres and networks, as JPAL, MIT, IEN, Institute of Development Studies; International, Economic Commission for Latin America (ECLAC), Centro Interamericano para el Desarrollo del Conocimiento en la Formación Profesional (CINTERFOR), regional, national and local non-governmental organizations. Outreaching to subject-matter experts, and practitioners. Contacting authors and obtaining sister articles and documents related to the interventions in included studies, following the effectiveness plus approach. As we will follow an effectiveness plus approach we will be searching for sister articles, process evaluations and project documents for the qualitative studies. We will search for sibling articles following Booth (2011), doing a citation tracking of all included studies to identify any sister papers/ qualitative studies, and conducting targeted searches at implementing agencies websites, Google and databases using the intervention name.
1.3 DATA COLLECTION AND ANALYSIS
1.3.1 Selection of studies
Two independent review authors will perform the searches and screen the first stage results against the inclusion/exclusion criteria. A third author will supervise the process and solve any discrepancies. A record will be kept of all decisions.
1.3.2 Data extraction and management
We will extract information on the study type, authors, date, publication status, type of publication and language. We will also collect information about the intervention, country and area, dates of the intervention, available information, type of intervention, research design, outcomes reported, information transmission, capacity building, interaction between community and service providers, and the community's power to make decisions.
Two reviewers will independently code and extract the data from the selected studies and those selected will be coded as specified in the appendix. Again, this process will be supervised by a third author. A coding sheet with a description of the data collected is included in the appendix.
1.3.3 Assessment of risk of bias in included studies10
Studies will be critically appraised according to the likely risk of bias based on: quality of attribution methods (addressing confounding and sample selection bias); the extent of spillovers to services and projects in comparison groups; outcome and analysis reporting bias; and other sources of bias.
'Low risk of bias' studies are those in which clear measurement of and control for confounding was made, including selection bias, where intervention and comparison groups were described adequately (in respect of the nature of the interventions being received) and risks of spillovers or contamination were small, and where reporting biases and other sources of bias were unlikely.
Studies will be identified as at ‘medium risk of bias’ where there were threats to validity of the attribution methodology, or there were likely risks of spillovers or contamination, arising from inadequate description of intervention or comparison groups or reporting biases suspected.
‘High risk of bias studies’ are all others, including those where comparison groups are not matched or differences in covariates are not accounted for in multivariate analysis, or where there is evidence for spillovers or contamination to comparison groups from the same communities, and reporting biases are evident. Our evaluation criteria are presented in Appendix B. At the same time, we will also critically appraise the confidence we have in whether the study deserves to be in each risk of bias category, that is, low, medium and high risk of bias. For some studies it will be clear they have a given risk of bias. For others, crucial information for deciding on where they belong on our scale will be missing or not clear. In this case, we may be uncertain of whether we have classified them correctly. In order to account for this, for each study we will also include a measure of the certainty we have in our risk of bias assessment. In particular, we will use a discrete measure: low, medium and high uncertainty.
Following de Vibe et al. (2012) and Waddington et al. (2013) we will present a summary of the quality assessment of the included studies using a traffic light scheme graph to differentiate study quality across the four different components of our risk of bias assessment tool.
For review question (2), we will include a subset of the quantitative studies included in the review of question (1), and specifically, those that measure not only primary outcomes but also intermediate outcomes. To classify their level of quality we will also use the same criteria described above but we will focus in the identification strategy of the intermediate outcome under consideration.
For qualitative studies, we will evaluate their quality using an adapted version of the Critical Appraisal Skills Programme checklist (CASP, 2006), making judgments on the adequacy of reporting, data collection, presentation, analysis and conclusions drawn. The checklist is included in Appendix C. We will filter out studies of particularly low quality at this stage (Noyes et al., 2011) and studies where questions 1-5 are assessed as “No” will be excluded from the review and from further appraisal. .
The remaining studies will be classified as being either of high or low quality. The results of the quality appraisal will be reported in the review and we will conduct a sensitivity analysis to assess how sensitive our findings are to the removal of studies of different quality (Noyes et al., 2011).
As above, following de Vibe et al. (2012) and Waddington et al. (2013), we will present a summary assessment of the quality of the included studies using a traffic light scheme graph.
1.3.4 Measures of treatment effect 11
We will extract comparable effect size estimates from included studies, together with 95 per cent confidence intervals. Where possible, we will calculate standardised mean differences (SMDs) for continuous outcome variables, and risk ratios (RRs) for dichotomous outcome variables. Treatment effects will be calculated as the ratio of, or difference between, treated and control observations in a consistent way, such that outcome measures are comparable across studies. Thus, a SMD greater than zero (RR greater than 1) will indicate an increase in the outcome of interest due to the intervention as compared to the comparison. A SMD less than zero (RR between 0 and 1) will indicate a reduction under the intervention as compared to the comparison. A SMD equal to (or insignificantly different from) zero (RR equal to 1) will indicate no change in outcome over the comparison. Whether these relative changes represent positive or negative impacts will depend on meaning of the outcome in the context of the program being evaluated. For example, while positive impacts on service delivery will be measured as values greater than 1, positive impacts of CMIs on – in this case, reductions in – corruption will be measured as values less than 1.
We will only include one effect estimate per study in a single meta-analysis. We will follow the statistical transformations for calculating risk ratios and standardised mean differences from matching-based and regression studies provided in IDCG (2012).
For clustered designs, the assessment of the unit of analysis error will be based on whether the unit of analysis is different from the unit of treatment assignment. If this is the case, the review should assess whether the authors take clustering into account in the analysis (for example using multilevel model, variance components analysis, cluster level fixed effects, and so on).
As noted in IDCG (2012), for those studies with relevant risk of unit of analysis error, corrections may be applied to the standard errors and confidence intervals of those studies. Adjusted standard errors for those studies with relevant risk of unit of analysis error can be estimated as follows:
Most quasi-experimental studies used in impact evaluation in economics and political science do not report the information required to calculate standardised mean differences. Where sufficient data are not available to calculate effect sizes, we will contact primary authors to obtain this. Where primary authors are unable to provide relevant information, we will calculate response ratios which offer greater possibilities for estimation. Response ratios measure the proportional change in an outcome in the situation in the intervention group relative to that in the comparison group, giving a similar interpretation to a risk ratio 12 .
Borenstein et al. (2011) define this as R= Xt / Xc, where R is the response ratio effect size, Xt is the mean outcome in the treatment group and Xc is the mean outcome in the comparison group. The response ratio provides a measure of the relative change in an outcome caused by an intervention. In other words, the response ratio quantifies the proportionate change that results from an intervention. This systematic review may include different study designs that assess the impact on different measures of the same outcome. For example, studies using a difference-in-differences approach would provide the impact of the program on the growth rate of the outcome. Other studies that use a propensity score matching approach would provide the impact of the program on the level of the outcome. Since the response ratio measures the proportional change in an outcome of an intervention, it does not seem unreasonable to combine the response ratios of studies measuring impacts of an intervention on levels with studies assessing impacts on growth rates of outcomes 13 .
We will also perform sensitivity analysis to assess whether these imputations significantly affect pooled effect size estimates.
We will report tests for heterogeneity of effects across studies, using the I2 statistic and by reporting the between studies variance component (τ2) to provide an overall estimate of the amount of variability in the distribution of the true effect sizes (Borenstein et al., 2011).
For dependent effect sizes, where multiple outcome measures are reported by sub-group or when the impact of the program on multiple outcomes measuring the same outcome category are reported, we will combine groups from the same study prior to meta-analysis, in order to avoid accusations of results-related choices. Where studies report multiple effects due to subgroups of participants or, for example, follow up period, we will synthesize effects prior to meta-analysis. We will calculate the sample-weighted average effect sizes, using appropriate formulae to recalculate variances, making necessary covariance assumptions if necessary (Borenstein et al., 2011; Higgins & Green, 2011, Chapter 16). Where multiple outcomes are reported from alternate specifications, we will select the specification according to likely lowest risk of bias in attributing impact.
Additionally, we will study whether published and unpublished results tend to differ significantly, as a test for publication bias. Because statistical significance is often regarded as a requirement for publication, one symptom of publication bias is an unusually large number of published p-values just below the 0.05 threshold (Gerber & Malhotra, 2008a, 2008b). Another symptom is larger reported effects among studies with smaller samples; because smaller studies tend to have larger standard errors, their estimated effects need to be larger in order to achieve significance at the p < 0.05 level. We will test for possible publication bias using funnel plots and Egger et al.'s (1997) test. Given the inherent subjectivity in assessing funnel plot asymmetry, we will assess sensitivity of meta-analyses using ‘trim and fill’ (Duval & Tweedie, 2000) regardless of whether funnel plots suggest asymmetry. 15
1.4 DATA SYNTHESIS
The review will synthesise quantitative data on effectiveness to assess whether the intervention of interest works to improve service delivery outcomes and reduce corruption (objectives question 1), and mixed (quantitative and qualitative) data on intermediate outcomes to explain the mechanisms (objectives question 2). Finally, we will conduct moderator analyses to assess which factors moderate effects on intermediate and final outcomes (objective question 3).
1.4.1 Review question (1): Effectiveness synthesis
If meta-analysis is feasible, we will synthesise evidence on effects using meta-analysis. Following Wilson et al (2011) our a-priori rule for conducting meta-analysis requires two or more studies, each with a computable effect size of a common outcomes construct (potentially measured in different ways), and similar comparison condition.
Assuming meta-analysis is feasible we will use a random effects model, estimated using Stata software and effect sizes will be reported using forest plots (Stata Corporation, College Station, TX, USA). By accounting for the possibility of different effect sizes across studies in this way, random effects meta-analysis produces a pooled effect size with greater uncertainty attached to it, in terms of wider confidence intervals than a fixed effect model.
Our preliminary search for literature found many papers that would qualify for inclusion in our review. As a result, we expect to have enough studies to perform meta-analysis. We anticipate running an aggregated meta-analysis for all types of interventions for each primary outcome (5). Then, we will decompose into 20 meta-analyses provided that we have available studies for all CMIs: information campaigns, scorecards, social audits, and grievance redress mechanisms.
One potential problem with traditional meta-analysis is that it makes two unwarranted assumptions: a) associated bias of each included study is zero, b) uncertainty about bias being equal to zero is also zero. To account for differential quality among studies, we will run parametric meta-analysis for different degrees of quality among studies as well as uncertainty about the bias associated to each study, in the spirit of Gerber and Green (2012) bayesian framework.
1.4.2 Review question (2): CMIs Mechanisms synthesis
For the synthesis of evidence relating to question 2, we will use both qualitative and quantitative approaches.
For quantitative studies measuring intermediate and final outcomes, we anticipate being able to synthesise using meta-analyses. Again, our a priori decision rule for performing meta-analysis following Wilson et al (2011) would be as follows: two or more studies, each with a computable effect size of a common intermediate and final outcomes construct (potentially measured in different ways), and similar comparison condition. For these cases, random effects meta-analysis will be employed. If the criteria above are fulfilled, we anticipate three meta-analyses of primary intermediate outcomes and another 12 meta-analyses when decomposing them by the four types of CMIs. Additionally, contingent on having enough studies and acknowledging small sample limitations, we will perform multivariable regression to test how these intermediate outcomes affect primary ones.
To synthesise qualitative studies we will differentiate evidence coming from qualitative studies and from background project documents. However, for both we will follow a narrative approach, where themes will be based on the links and assumptions in the theory of change model. The studies will come from contacting authors of included quantitative studies, as well as obtaining sister articles (qualitative studies associated with the included impact evaluations), project documents, process evaluations and other types of monitoring and evaluation documents related to the interventions in the included studies. This will allow us to have more contextual understanding of the theory of change for each CMI. The scope of this component of the review is closely related to the effectiveness question and a preliminary review of the evidence suggests that the included studies are likely to be descriptive studies.
Finally, we focus on the barriers and facilitators of citizens' participation in community monitoring and on politicians' and providers' accountability. We will use the competing theories laid out in section 1.3 to study the mediating effect of several outcomes on intermediate ones, that is, citizens' attitudes and beliefs, information gaps, institutional strength, and so on. 16 For the synthesis of evidence, we will use both qualitative and quantitative studies. In this case, to synthesise both quantitative and qualitative studies we will follow a narrative approach, where themes will be based on the links and assumptions in the theory of change model describe above. Though we anticipate we will not have many studies measuring these outcomes, we believe is crucial to highlight knowledge gaps in the research agenda that will be useful for both academics and practitioners.
1.4.3 Review question (3): Moderator analyses
For the synthesis of evidence relating to question 3, we will use a quantitative approach. We will investigate whether findings differ according to key contextual factors, including geographical region and income level. Again, our a priori decision rule for performing meta-analysis following Wilson et al (2011) would be as follows: two or more studies. We will investigate geographical and income variation by pooling all CMIs together to reduce the number of meta-analyses. In addition, we will investigate differences within each intervention where possible. In the case of information campaigns those with and without capacity building component where information on how to monitor providers is disseminated. For scorecards and social audits, whether they involve facilitated meetings with providers and politicians. And for all CMIs whether citizens act not only as monitors but also as decision makers in the project. Finally, we will study whether length of exposure (measured as length of CMI program implementation, and length of post-implementation follow-up period) has any impact on the effectiveness of the CMIs.
1.4.4 Integrated synthesis (review questions 1, 2 and 3)
We use the program theory (Figure 1) as a framework for integrating the findings from synthesis of review questions (1), (2) and (3) with the aim of providing an integrated narrative synthesis along the causal chain addressing the objectives of the review.
1.4.5 Sensitivity Analysis
We will perform several sensitivity analyses in our review, including: type of counterfactual, e.g. CMI not encouraged or no CMI at all, randomized vs. non-randomized studies; relevant differences in impact measure (measure of treatment effect e.g., average treatment effect (ATE) vs. intention to treat (ITT) vs. average treatment on the treated (ATT) vs. compliers average treatment effects (CATE)), traditional versus meta-analyses that take into account the risk of bias and the uncertainty about the risk of bias.
2 Timeline
3 Acknowledgements
Many academics and practitioners have read this protocol and gave us relevant feedback. In particular, we want to thank Bénédicte de la Brière, Seollee Park and Vincenzo Di Maro for thoughtful comments on a previous version of the protocol. Additionally, we would like to thank reviewers from 3ie and IDCG. The usual disclaimer applies.
Footnotes
Appendices
6 Contribution of Authors
Content: Ezequiel Molina. He is a PhD candidate in Political Economy at Princeton University, where he has devoted the last three years to study these topics in detail. Systematic review methods: Ezequiel Molina and Ana Pacheco have attended a Systematic Review Training in Dhaka, Bangladesh (December 10-14, 2012). Ezequiel has taken PhD level courses on methodology and meta-analysis research. Andre Rius, an expert in systematic review, will also be part of the team. Statistical analysis: Ana Pacheco, Guillermo Cruces, Leonardo Gasparini, and Ezequiel Molina have extensive training in statistical methods. In addition, several research assistants will provide statistical and analytical support to the team. Information retrieval: Ana Pacheco will lead this section. Ana has worked as an editorial assistant for Económica, the journal of Economics at the UNLP, and as such she had to maintain the series at different indexes. Andres Rius has experience in information retrieval in the context of a systematic review and will support the team in this area. Additionally, several research assistants will provide support to Ana and the team. The research assistants are Malena Arcidiácono, María Noelia Garbero, Joaquín Serrano, Nicolás Badaracco, Juan Francisco Chiste, Marco Cobanera, Ivana Benzaquen, Jessica Braco, Luis Morano, Agustín Casarini y Lucas Longo. Policy Influence: Ana Pacheco and Ezequiel Molina will be in charge of this area. Ana will work on dissemination activities and coordinate the non-technical report which will be prepared by CIPPEC. Ezequiel will meet with the stakeholders in Washington DC and have skype calls with stakeholders elsewhere to disseminate the findings and receive timely feedback.
7 Declarations of Interest
There are no known conflicts of interest that the team is currently aware of. The team has not been part of any organization that has implemented projects in this area, nor has any interests in promoting particular findings due to personal relationships with individuals or organizations who will benefit from these.
Ezequiel Molina has conducted research on community monitoring in Colombia (Community Visible Audits) as part of his dissertation work. He studied the effects of the program on corruption as well as political influence of the community over policy making.
8 Sources of Support
1
For the purpose of this review, service delivery involves not only services, but also construction of necessary infrastructure to carry out those services. As a result, we will talk indistinctly between service delivery and project performance.
2
The word ‘audit’ is derived from Latin, which means ‘to hear‘. In ancient times, emperors used to recruit persons designated as auditors to get feedback about the activities undertaken by the kings in their kingdoms. These auditors used to go to public places to listen to citizens' opinions on various matters, like behaviour of employees, incidence of tax and image of local officials (Centre for Good Governance, 2005).
3
Scorecards for health services were pioneered in Malawi in the early 2000s by Care International. This intervention followed the spirit of individual “citizen report cards,” which were first introduced in Bangalore, India in 1993. The citizen report card revealed low levels of public satisfaction with the performance of service providers. The findings were widely publicized through the media, which created pressure among public officials to organize workshops and meeting with local civic groups and NGOs. Increased public awareness on government inefficiencies and other related concerns triggered the formation of more than 100 civic groups in different parts of India, as well as the launch of many campaigns for transparent public management (Bhatnagar, Dewan, Torres & Kanungo, 2003).
4
Furthermore, because these initiatives are put in place as a result of weak government presence, monitoring involves monitoring peers, which is different to traditional CMIs. When analysing the data, we will run sensitivity analysis to understand its importance in the intermediate and final outcomes.
5
The term botlenecks has been used in the literature (Lieberman et al, 2013) to refer to constrains that limit the effectiveness of community monitoring programs.
6
In order to give salience to information behavioural economist uses an array of instruments to catch citizens' attention. We are not aware of any CMIs where these incentives were embedded in the theory of change and properly assessed its impact. This appears to be a knowledge gap for CMIs.
7
In some parts of the world the state fails completely to provide services and to monitor illegal private service provision. Even under these environments, when citizens can choose providers overall providers' performance may increase.
8
The cost is determined by the quantity of materials used and estimate of material prices and wages paid on the project.
9
The resulting group of keywords includes a limited number of possible outcomes, detected in the preliminary search of papers, and some search terms which are not specific. These terms were included as a security net, and potentially we will expand the list to include other terms as we proceed with the search.
10
11
This section draws heavily on Waddington, Snilstveit, Vojtkova and Hombrados (2012), IDCG (Campbell International Development Coordinating Group), Protocol and Review Guidelines as well as Hombrados, Snilstveit, Vojtkova,  .
.
12
The use of response ratios to combine study results is subject to some limitations. highlight that this effect size is only meaningful when the outcome is measured on a true ratio scale that has a natural zero point (though is unlikely to be equal to zero in practice). This condition holds for the outcomes measured here (percentage of citizens with access to services, disease prevalence, percentage of missing funds, mortality rates, citizen's perceptions, among others).
13
On the other hand it would not be meaningful to combine standardized mean differences or mean differences of studies measuring impact in corruption levels with studies measuring impact on growth rate of corruption. Indeed, the mean differences approaches might require included studies to use not only the same outcome but also the same measure of outcome, preventing the aggregation of results of studies that use study designs based on panel data (cross-sectional before versus after) and those based on cross-sectional data only.
14
A broader concept of publication bias will include not only published results, but also working papers as being affected by the same syndrome. Since we do not have access to those results which authors decided not to put on paper or circulate in the academic community (so-called file drawer problems), we will not be able to test for that type of publication bias.
15
16
See the coding tool for more examples.
18
If a quasi-randomized assignment approach is used (e.g. alphabetical order), you must be sure that the process truly generates groupings equivalent to random assignment, to score “Yes” on this criteria. In order to assess the validity of the quasi-randomization process, the most important aspect is whether the assignment process might generate a correlation between participation status and other factors (e.g. gender, socio-economic status) determining outcomes; you may consider covariate balance in determining this (see question 2).
19
Even in the context of RCTs, when randomisation is successful and carried out over sufficiently large assignment units, it is possible that small differences between groups remain for some covariates. In these cases, study authors should use appropriate multivariate methods to correcting for these differences.
20
If the research has serious concerns with the validity of the randomisation process or the group equivalence completely fails, we recommend to assess the risk of bias of the study using the relevant questions for the appropriate methods of analysis (cross-sectional regressions, difference-in-difference, etc) rather than the RCTs questions.
21
22
If the instrument is the random assignment of the treatment, the reviewer should also assess the quality and success of the randomisation procedure in part a).
23
An instrument is exogenous when it only affects the outcome of interest through affecting participation in the programme. Although when more than one instrument is available, statistical tests provide guidance on exogeneity (see background document), the assessment of exogeneity should be in any case done qualitatively. Indeed, complete exogeneity of the instrument is only feasible using randomised assignment in the context of an RCT with imperfect compliance, or an instrument identified in the context of a natural experiment.
24
Accounting for and matching on all relevant characteristics is usually only feasible when the programme allocation rule is known and there are no errors of targeting. It is unlikely that studies not based on randomisation or regression discontinuity can score “YES” on this criterion.
25
There are different ways in which covariates can be taken into account. Differences across groups in observable characteristics can be taken into account as covariates in the framework of a regression analysis or can be assessed by testing equality of means between groups. Differences in unobservable characteristics can be taken into account through the use of instrumental variables (see also question 1.d) or proxy variables in the framework of a regression analysis, or using a fixed effects or difference-in-differences model if the only characteristics which are unobserved are time-invariant.
26
Knowing allocation rules for the programme – or even whether the non-participants were individuals that refused to participate in the programme, as opposed to individuals that were not given the opportunity to participate in the programme – can help in the assessment of whether the covariates accounted for in the regression capture all the relevant characteristics that explain differences between treatment and comparison.
27
Matching strategies are sometimes complemented with difference-in-difference regression estimation methods. This combination approach is superior since it only uses in the estimation the common support region of the sample size, reducing the likelihood of existence of time-variant unobservable differences across groups affecting outcome of interest and removing biases arising from time-invariant unobservable characteristics.
28
The Hausman test explores endogeneity in the framework of regression by comparing whether the OLS and the IV approaches yield significantly different estimations. However, it plays a different role in the different methods of analysis. While in the OLS regression framework the Hausman test mainly explores endogeneity and therefore is related with the validity of the method, in IV approaches it explores whether the author has chosen the best available strategy for addressing causal attribution (since in the absence of endogeneity OLS yields more precise estimators) and therefore is more related with analysis reporting bias.
29
Contamination, that is differential receipt of other interventions affecting outcome of interest in the control or comparison group, is potentially an important threat to the correct interpretation of study results and should be addressed via PICO and study coding.
30
‘Common methods’ refers to the use of the most credible method of analysis to address attribution given the data available.
31
A comprehensive assessment of the existence of ‘data mining’ is not feasible particularly in quasi-experimental designs where most studies do not have protocols and replication seems the only possible mechanism to examine rigorously the existence of data mining.
32
For PSM and covariate matching, score “YES” if: where over 10% of participants fail to be matched, sensitivity analysis is used to re-estimate results using different matching methods (Kernel Matching techniques). For matching with replacement, no single observation in the control group is matched with a large number of observations in the treatment group. Where not reported, score “UNCLEAR”. Otherwise, score “NO”. For IV (including Heckman) models, score “YES” if: the authors test and report the results of a Hausman test for exogeneity ≤ 0 (p < 0.05 is required to reject the null hypothesis of exogeneity), the coefficient of the selectivity correction term (Rho) is significantly different from zero (p<0.05) (Heckman approach). Where not reported, score “UNCLEAR”. Otherwise, score “NO”. For studies using multivariate regression analysis, score “YES” if: authors conduct appropriate specification tests (e.g. reporting results of multicollinearity test, testing robustness of results to the inclusion of additional variables, etc). Where not reported or not convincing, score “UNCLEAR”. Otherwise, Score “NO”.
33
All interventions may create expectations (placebo effects), which might confound causal mechanisms. In social interventions, which usually require behaviour change from participants, expectations may form an important component of the intervention, so that isolating expectation effects from other mechanisms may be less relevant.