






Abstract
BACKGROUND
The Problem, Condition or Issue
Increasing class size is one of the key variables that policy makers can use to control spending on education. The average class size at the lower secondary level is 23 students in OECD countries, but there are significant differences, ranging from over 32 in Japan and Korea to 19 or below in Estonia, Iceland, Luxembourg, Slovenia and the United Kingdom (OECD, 2012). On the other hand, reducing class size to increase student achievement is an approach that has been tried, debated, and analysed for several decades. Between 2000 and 2009, many countries invested additional resources to decrease class size (OECD, 2012).
Despite the important policy and practice implications of the topic, the research literature on the educational effects of class-size differences has not been clear. A large part of the research on the effects of class size has found that smaller class sizes improve student achievement (for example Finn & Achilles, 1999; Konstantopoulos, 2009; Molnar et al., 1999; Schanzenbach, 2007). The consensus among many in education research that smaller classes are effective in improving student achievement has led to a policy of class size reductions in a number of U.S. states, the United Kingdom, and the Netherlands. This policy is disputed by those who argue that the effects of class size reduction are only modest and that there are other more cost-effective strategies for improving educational standards (Hattie, 2005; Hedges, Laine, & Greenwald, 1994; Rivkin, Hanushek, & Kain, 2005). There is no consensus in the literature as to whether class size reduction can pass a cost-benefit test (Dustmann, Rajah & van Soest, 2003; Dynarski, Hyman & Schanzenbach, 2011; Finn, Gerber & Boyd-Zaharias, 2005; Muenning & Woolf, 2007).
As it is costly to reduce class size, it is important to consider the types of students who might benefit most from smaller class sizes and to consider the timing, intensity, and duration of class size reduction as well. Low socioeconomic status is strongly associated with low school performance. Results from the Programme for International Student Assessment (PISA) point to the fact that most of the students who perform poorly in PISA are from socio-economically disadvantaged backgrounds (OECD, 2010). Across OECD countries, a student from a more socio-economically advantaged background outperforms a student from an average background by about one year's worth of education in reading, and by even more in comparison to students with low socio-economic background. Results from PISA also show that some students with low socioeconomic status excel in PISA, demonstrating that overcoming socio-economic barriers to academic achievement is indeed possible (OECD, 2010).
Smaller class size has been shown to be more beneficial for students from socioeconomically disadvantaged backgrounds (Biddle & Berliner, 2002). Evidence from the Tennessee STAR randomised controlled trial showed that minority students, students living in poverty, and students who were educationally disadvantaged benefitted the most from reduced class size (Finn, 2002; Word et al. (1994). Further, evidence from the controlled, though not randomised, trial, the Wisconsin's Student Achievement Guarantee in Education (SAGE) program, showed that students from minority and low-income families benefitted the most from reduced class size (Molnar et al., 1999). Thus, rather than implementing costly universal class size reduction policies, it may be more economically efficient to target schools with high concentrations of socioeconomic disadvantaged students for class size reductions.
In the case of the timing of class size reduction, the question is: when does class size reduction have the largest effect? Ehrenberg, Brewer, Gamoran and Willms (2001) hypothesized that students educated in small classes during the early grades may be more likely to develop working habits and learning strategies that enable them to better take advantage of learning opportunities in later grades. According to Bascia and Fredua-Kwarteng (2008), researchers agree that class size reduction is most effective in the primary grades. That empirical research shows class size to be most effective in the early grades is also concluded by Biddle and Berliner (2002) and the evidence from both STAR and SAGE back this conclusion up (Finn, Gerber, Achilles, & Boyd-Zaharias, 2001; Smith, Molnar, & Zahorik, 2003). Of course, there is still the possibility that smaller classes may also be advantageous at later strategic points of transition, for example, in the first year of secondary education. Research evidence on this possibility is, however, needed.
For intensity, the question is: how small does a class have to be in order to optimize the advantage? For example, large gains are attainable when class size is below 20 students (Biddle & Berliner, 2002; Finn, 2002) but gains are also attainable if class size is not below 20 students (Angrist & Lavy, 2000; Borland, Howsen & Trawick, 2005; Fredrikson, Öckert & Oosterbeek, 2013; Schanzenbach, 2007). It has been argued that the impact of class size reduction of different sizes and from different baseline class sizes is reasonably stable and more or less linear when measured per student (Angrist & Pischke, 2009, see page 267; Schanzenbach, 2007). Other researchers argue that the effect of class size is not only nonlinear but also non-monotonic, implying that an optimal class size exists (Borland, Howsen & Trawick, 2005). Thus, the question of whether the size of reduction and initial class size matters for the magnitude of gain from small classes is still an open question.
Finally, researchers agree that the length of the intervention (number of years spent in small classes) is linked with the sustainability of benefits (Biddle & Berliner, 2002; Finn, 2002; Grissmer, 1999; Nye, Hedges & Konstantopoulos, 1999) whereas the evidence on whether more years spent in small classes leads to larger gains in academic achievement is mixed (Biddle & Berliner, 2002; Egelson, Harman, Hood & Achilles, 2002; Finn 2002; Kruger, 1999). How long a student should remain in a small class before eventually returning to a class of regular size is an unanswered question.
The Intervention
The intervention in this systematic review is a reduction in class size. What constitutes a reduced class size? This seemingly simple issue has confounded the understanding of outcomes of the research and it is one of the reasons there is disagreement about whether class size reduction works (Graue, Hatch, Rao & Oen, 2007).
Two terms are used to describe the intervention, class size and student-teacher ratio, and it is important to distinguish between these two terms. The first, class size, focuses on reducing group size and, hence, is operationalized as the number of students a teacher instructs in a classroom at a point in time. For this definition, a reduced number of students are assigned to a class in the belief that teachers will then develop an in-depth understanding of student learning needs through more focused interactions, better assessment, and fewer disciplinary problems. These mechanisms are based on the dynamics of a smaller group (Ehrenberg et al., 2001). The second term is student-teacher ratio and is often used as a proxy for class size, defined as a school's total student enrollment divided by the number of its full time teachers.
From this perspective, lowering the ratio of students to teachers provides enhanced opportunities for learning. The concept of using student-teacher ratios as a proxy for class size is based on a view of teachers as units of expertise and is less focused on the student-teacher relationship. Increasing the relative units of expertise available to students increases learning, but does not rely on particular teacher-student interactions (Graue et al., 2007).
Although class size and student-teacher ratio are related, they involve different assumptions about how a reduction changes the opportunities for students and teachers. In addition, the discrepancy between the two can vary depending on teachers' roles and the amount of time teachers spend in the classroom during the school day.
In this review, the intervention is class size reduction. Studies only considering average class size measured as student-teacher ratio at school level (or higher levels) will not be eligible. Neither will studies where the intervention is the assignment of an extra teacher (or teaching assistants or other adults) to a class be eligible. The assignment of additional teachers (or teaching assistants or other adults) to a classroom is not the same as reducing the size of the class, and this review focuses exclusively on the effects of class size in the sense of number of students in a classroom.
How the Intervention Might Work
Smaller classes allow teachers to adapt their instruction to the needs of individual students. For example, teachers' instruction can be more easily adapted to the development of the individual students. The concept of adaptive education refers to instruction that is adapted to meet the individual needs and abilities of students (Houtveen, Booij, de Jong & van de Grift, 1999). With adaptive education, some students receive more time, instruction, or help from the teacher than other students.
Research has shown that in smaller classes, teachers have more time and opportunity to give individual students the attention they need (Betts & Shkolnik, 1999; Blatchford & Mortimore, 1994; Bourke, 1986; Molnar et al., 1999; Molnar et al., 2000; Smith & Glass, 1980). Additional, less pressure may be placed upon the physical space and resources within the classroom. Both of these factors may be connected to less pupil misbehaviour and disciplinary problems detected in larger classes (Wilson, 2002).
In smaller classes, it is possible for students with low levels of ability to receive more attention from the teacher, with the result that not necessarily all students profit equally. More generally, teachers are able to devote more of their time to educational content (the tasks students must complete) and less to classroom management (for example, maintaining order) in smaller classes. An increased amount of time spend on task, contributes to enhanced academic achievement.
It has often been pointed out, however, that teachers do not necessarily change the way they teach when faced with smaller classes and therefore do not take advantage of all of the benefits offered by a smaller class size. Research suggests that such situations do indeed exist in practice (e.g. Blatchford & Mortimore, 1994; Shapson, Wright, Eason & Fitzgerald, 1980).
Anderson (2000) addressed the question of why reductions in class size should be expected to enhance student achievement and part of his theory was tested in Annevelink, Bosker and Doolaard (2004). To explain the relationship between class size and achievement, Anderson developed a causal model, which starts with reduced class size and ends with student achievement. Anderson noted that small classes would not, in and of themselves, solve all educational problems. The number of students in a classroom can have only an indirect effect on student achievement. As Zahorik (1999) states: “Class size, of course, cannot influence academic achievement directly. It must first influence what teachers and students do in the classroom before it can possibly affect student learning” (p. 50). In other words, what teachers do matters. Anderson's causal model of the effect of reduced class size on student achievement is depicted in Figure 1.
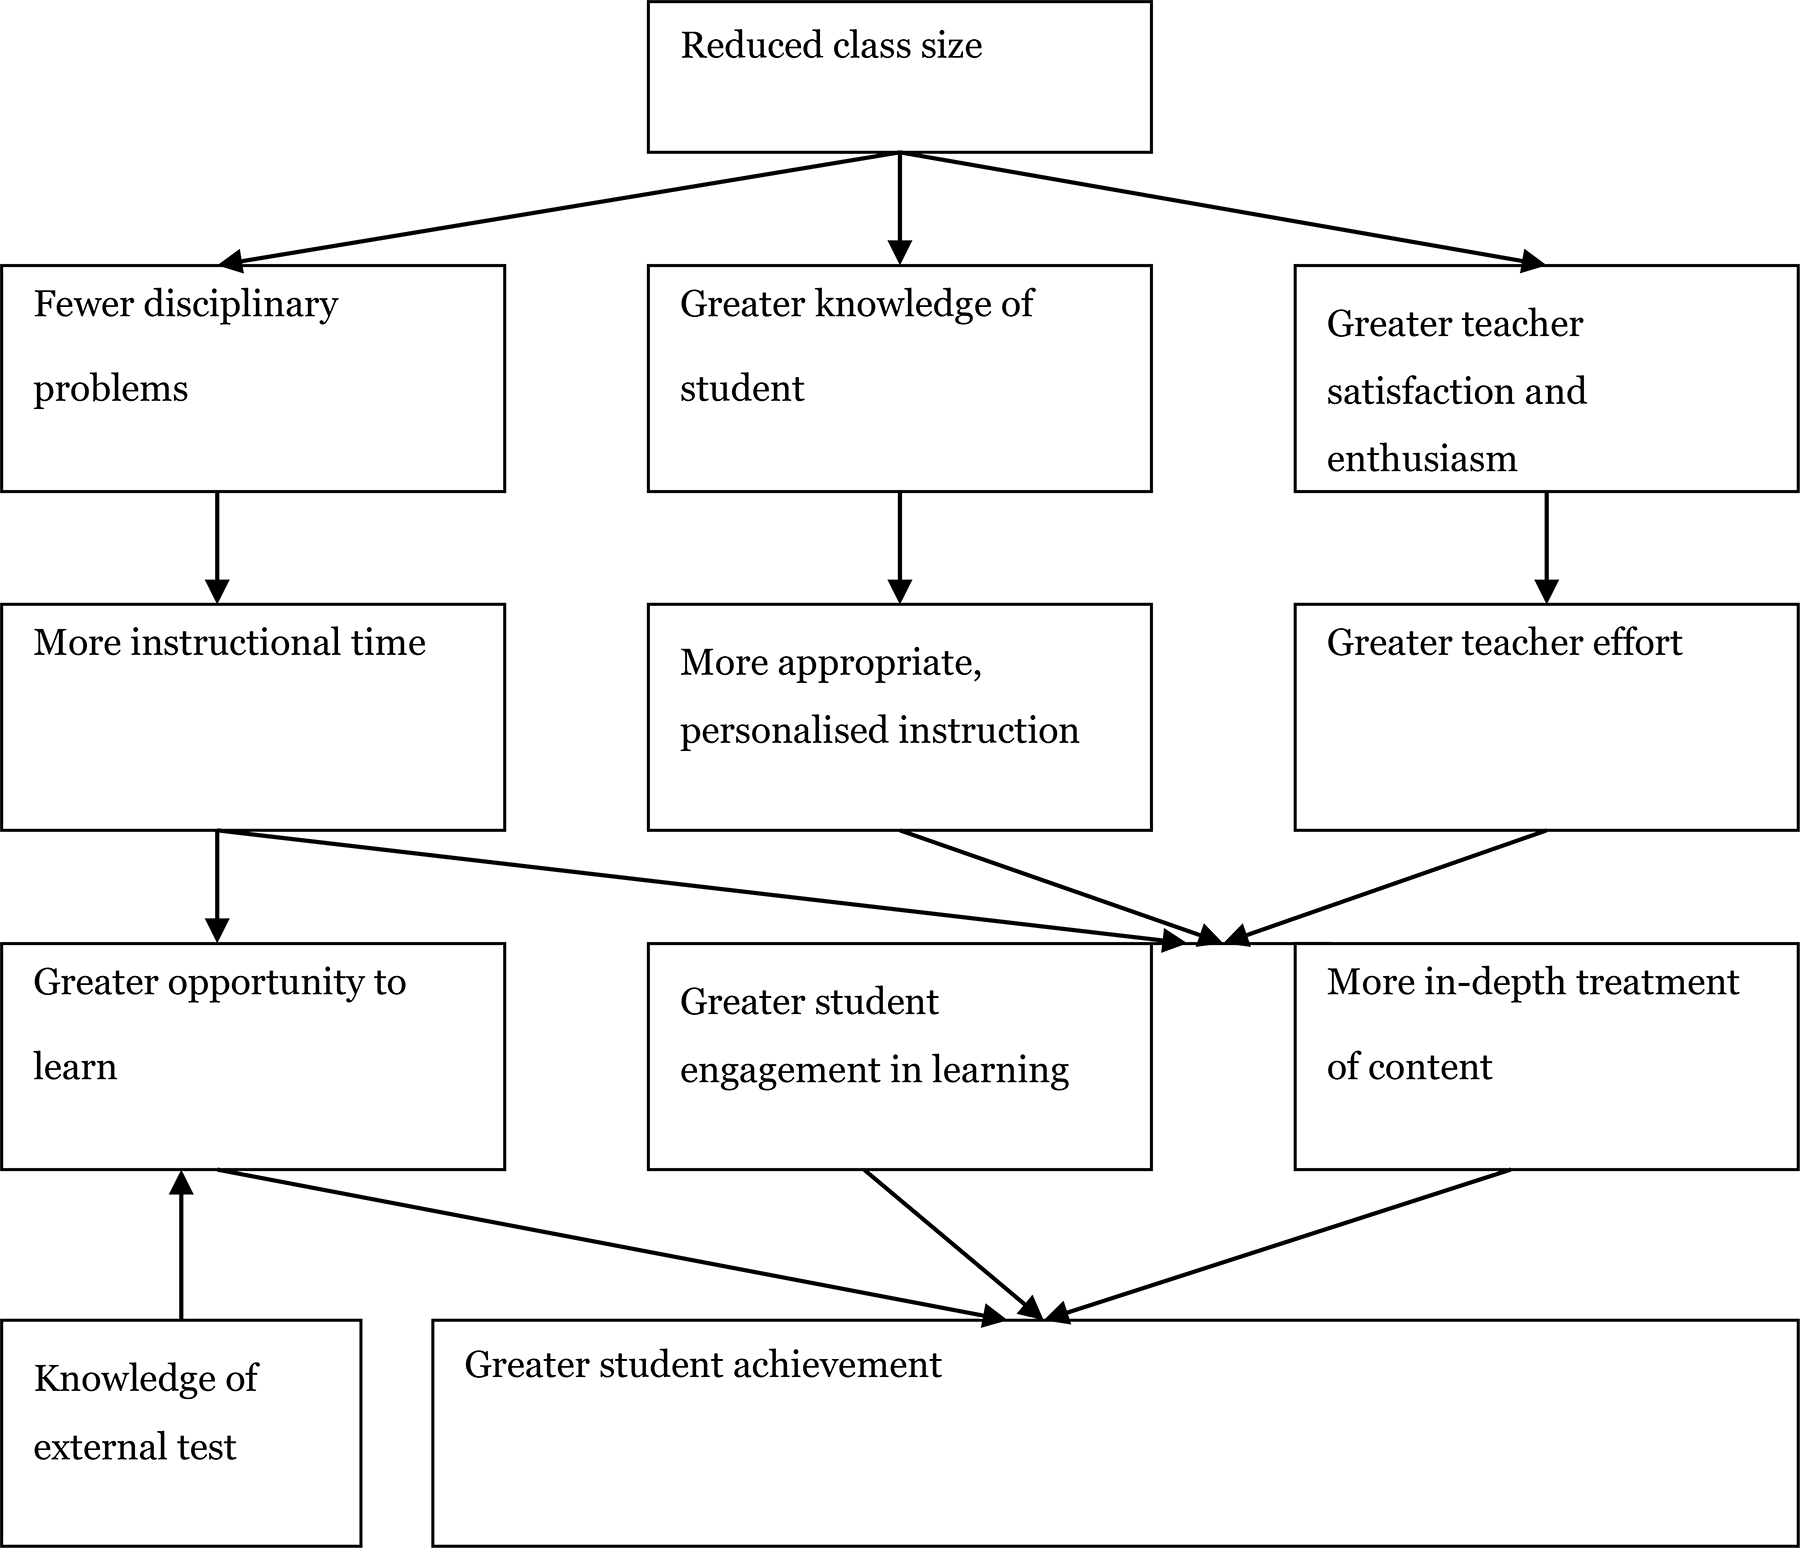
An explanation of the impact of class size on student achievement (Anderson, 2000)
Anderson's model predicts that a reduced class size will have direct positive effects on the following three variables: 1) Disciplinary problems, 2) Knowledge of student, and 3) Teacher satisfaction and enthusiasm. Each of these variables, in turn, begins a separate path. Fewer disciplinary problems are expected to lead to more instructional time, which in combination with teacher knowledge of the external test, produces greater opportunity to learn. In combination with more appropriate, personalised instruction and greater teacher effort, more instructional time potentially produces greater student engagement in learning as well as more in-depth treatment of content.
Greater knowledge of students is expected to provide more appropriate personalised instruction, and in combination with more instructional time and greater teacher effort, potentially produces greater student engagement in learning and more in-depth treatment of content.
Greater teacher satisfaction and enthusiasm are expected to result in greater teacher effort, which in combination with more instructional time and more appropriate, personalised instruction produces greater student engagement in learning and more in-depth treatment of content.
Finally greater student achievement is the expected result of a combination of the three variables: Greater opportunity to learn, greater student engagement in learning, and more in-depth treatment of content.
The path from greater knowledge of students through appropriate, personalised instruction and student engagement in learning to student achievement is tested in Annevelink et al. (2004) on students in Grade 1 in 46 Dutch schools in the school year 1999-2000. Personalised instruction is operationalised as the number of specific types of interactions. Teachers seeking to provide more personalised instruction are expected to provide fewer interactions directed at the organization and personal interactions, and more interactions directed at the task and praising interactions. These changes in interactions are expected to result in a situation where the student spends more time on task.
The level of student engagement is operationalised as the amount of time a student spends on task. Students who spend more time on task are expected to achieve higher learning results.
Smaller classes were related to more interactions of all kinds and more task-directed and praising interactions resulted in more time spent on task which in turn was related to higher student achievement as expected. Notice that more organizational or personal interactions in smaller classes were contrary to expectations whereas more task-directed interactions or praising interactions was consistent with expectations (Annevelink et al., 2004).
Why it is Important to do the Review
Class size is one of the most researched educational interventions in social science, yet there is no clear consensus on the effectiveness of small class sizes for improving student achievement. While one strand of class size research points to small and insignificant effects, another points to positive and significant effects.
The early meta-analysis by Glass and Smith (1979) analysed the outcomes of 77 studies including 725 comparisons between smaller and larger class sizes on student achievement. They concluded that a class size reduction had a positive effect on student achievement. Hedges and Stock (1983) reanalysed Glass and Smith's data using different statistical methods, but found very little difference in the average effect sizes across the two analysis methods.
However, the updated literature reviews by Hanushek (Hanushek, 1989; 1999; 2003) cast doubt on these findings. His reviews looked at 276 estimates of pupil-teacher ratios as a proxy for class size, and most of these estimates pointed to insignificant effects. Based on a vote counting method, Hanushek concluded that “there is no strong or consistent relationship between school resources and student performance” (Hanushek, 1987, p. 47). Krueger (2003), however, points out that Hanushek relies too much on a few studies, which reported many estimates from even smaller subsamples of the same dataset. Many of the 276 estimates were from the same dataset but estimated on several smaller subsamples, and these many small sample estimates are more likely to be insignificant. The vote counting method used in Hanushek's original literature review (Hanushek, 1989) is also criticised by Hedges et al. (1994), who offer a reanalysis of the data from Hanushek's reviews using more sophisticated synthesis methods. Hedges et al. (1994) used a combined significance test. 1 They tested two null hypotheses: 1) no positive relation between the resource and output and 2) no negative relation between the resource and output. The tests determine if the data are consistent with the null hypothesis in all studies or false in at least some of the studies. Further, Hedges et al. (1994) reported the median standardized regression coefficient. 2 The conclusion is that “it shows systematic positive relations between resource inputs and school outcomes” (Hedges et al., 1994, p. 5). Hence, dependent upon which synthesis method 3 is considered appropriate; conclusions based on the same evidence are quite different.
The divergent conclusions of the above-mentioned reviews are further based on non-experimental evidence, combining measurements from primary studies that have different specifications and assumptions. According to Grissmer (1999), the different specifications and assumptions, as well as the appropriateness of the specifications and assumptions, account for the inconsistency of the results of the primary studies.
The Tennessee STAR experiment provides rare evidence of the effect of class size from a randomized controlled trial (RCT). The STAR experiment was implemented in Tennessee in the 1980s, assigning kindergarten children to either normal sized classes (around 22 students) or small classes (around 15 students). The study ran for four years, until the assigned children reached third grade, but not even based on this kind of evidence do researchers agree about the conclusion.
According to Finn and Achilles (1990), Nye et al. (1999) and Krueger (1999), STAR results show that class size reduction increased student achievement. However, Hanushek (1999; 2003) questions these results because of attrition from the project, crossover between treatments, and selective test taking, which may have violated the initial randomization.
While the class size debate on what can be concluded based on the same evidence is acceptable and meaningful in the research community, it is probably of less help in guiding decision-makers and practitioners. If research is to inform practice, there must be an attempt to reach some agreement about what the research does and does not tell us about the effectiveness of interventions as well as what conclusions can be reasonably drawn from research. The researchers must reach a better understanding of questions such as: for who does class size reduction have an effect? When does class size reduction have an effect? How small does a class have to be in order to be advantageous?
The purpose of this review is to systematically uncover relevant studies in the literature that measure the effects of class size on academic achievement and synthesize the effects in a transparent manner.
OBJECTIVES
The purpose of this review is to systematically uncover relevant studies in the literature that measure the effects of class size on academic achievement. We will synthesize the effects in a transparent manner and, where possible, we will investigate the extent to which the effects differ among different groups of students such as high/low performers, high/low income families, or members of minority/non-minority groups, and whether timing, intensity, and duration have an impact on the magnitude of the effect.
METHODOLOGY
Title registration
The title for this systematic review was approved in The Campbell Collaboration on 9. October 2012.
Criteria for including and excluding studies
Types of study designs
The study designs eligible for inclusion are: Controlled trials: RCTs - randomized controlled trials QRCTs - quasi-randomized controlled trials where participants are allocated by, for example, alternate allocation, participant's birth date, date, case number or alphabetically NRCTs - non-randomized controlled trials where participants are allocated by other actions controlled by the researcher Non-randomized studies (NRS) where allocation is not controlled by the researcher and two or more groups of participants are compared. Participants are allocated by, for example, time differences, location differences, decision makers, policy rules or participant preferences.
We will include study designs that use a well-defined control group. The main control or comparison condition is students in classes with more students than in the treatment classes.
Non-randomised studies, where the reduction of class size has occurred in the course of usual decisions outside the researcher's control, must demonstrate pre-treatment group equivalence via matching, statistical controls, or evidence of equivalence on key risk variables and participant characteristics. These factors are outlined in section
Different studies use different types of data. Some use test score data on individual students and actual class-size data for each student. Others use individual student data but average class-size data for students in that grade in each school. Still others use average scores for students in a grade level within a school and average class size for students in that school. We will only include studies that use measures of class size and measures of outcome data at the individual or class level. We will exclude studies that rely on measures of class size as and measures of outcomes aggregated to a level higher than the class (e.g., school or school district).
Some studies do not have actual class size data and use the average student-teacher ratio within the school (or at higher levels, e.g. school districts). Studies only considering average class size measured as student-teacher ratio within a school (or at higher levels) will not be eligible.
Types of participants
The review will include children in grades kindergarten to 12 (or the equivalent in European countries) in general education. Studies that meet inclusion criteria will be accepted from all countries. We will exclude children in home-school, in pre-school programs, and in special education.
Types of interventions
The intervention in this review is a reduction in class size. The more precise class size is measured the more reliable the findings of a study will be.
Studies only considering the average class size measured as student-teacher ratio within a school (or at higher levels) will not be eligible. Neither will studies where the intervention is the assignment of an extra teacher (or teaching assistants or other adults) to a class be eligible. The assignment of additional teachers (or teaching assistants or other adults) to a classroom is not the same as reducing the size of the class, and this review focuses exclusively on the effects of reducing class size. We acknowledge that class size can change per subject or eventually vary during the day. The precision of the class size measure will be recorded.
Types of outcome measures
The primary focus is on measures of academic achievement. Academic achievement outcomes include reading and mathematics. Outcome measures must be standardised measures of academic achievement. The primary outcome variables are standardised literacy tests (e.g. reading, spelling and writing) and standardised numeracy tests (e.g. mathematical problem-solving, arithmetic and numerical reasoning, grade level math).
Some studies may report test results in other academic subjects and/or measures of global academic performance. The following effect sizes will also be coded as secondary outcomes when available: standardised test in other academic subjects at primary school level (e.g. in science or second language) and measures of global academic performance (e.g. Woodcock-Johnson III Tests of Achievement, Stanford Achievement Test (SAT), Grade Point Average).
In addition to the primary outcome, we will consider school completion rates as a secondary outcome.
Studies will only be included if they consider one or more of the primary outcomes.
Duration of follow-up
Time points for measures considered will be: 0 to 1 year follow up 1 to 2 year follow up More than 2 year follow up
Types of settings
The location of the intervention is classes, grades kindergarten to 12 (or the equivalent in European countries) in regular private, public or boarding schools. Home-schools will be excluded.
Search strategy
Electronic searches
Relevant studies will be identified through electronic searches of bibliographic databases, research networks, government policy databanks and internet search engines. The searches will include studies published from 1980 and forward (The search dates are restricted as the results of too old studies may not be valid today. On the other hand we want to include the STAR experiment which was implemented in Tennessee in the 1980s). No language limitation is applied in the searches.
The following bibliographic databases will be searched:
International databases
Campbell Collaboration Library searched through January 2010 Centre for Reviews and Dissemination Databases Econlit Education Research Complete EPPI-Centre Systematic Reviews ERIC Ideas / Economist online International Bibliography of the Social Sciences ProQuest dissertations & theses A&I PsycINFO Social Care Online Social Science Citation Abstract SocIndex
Nordic databases
Bibliotek.dk (provides access to the Danish national bibliography) Libris (the Swedish library service, providing access to 170 university and research libraries) Bibsys (the Norwegian library service for universities and university colleges)
Search terms
An example of the search strategy for ERIC searched on the EBSCO platform is listed below. The strategy will be modified for the different databases. Both subject headings and text words will be searched. class n2 size* DE “Class Size” OR DE “Classroom Environment” OR DE “Crowding” OR DE “Flexible Scheduling” OR DE “Small Classes” OR DE “Teacher Student Ratio” (Primary N1 School*) or (Elementary n1 school*) or (secondary n1 school*) or (middle n1 school*) or (Junior n1 high) or (DE “Middle Schools”) OR (DE “Elementary Schools”) OR (DE “Secondary Schools”) OR (DE “Junior High Schools”) learn* or develop* or perform* or achiev* or abilit* or outcome* Academic* N2 (performance* or achiev* or abilit* or outcome*) learn* or develop* or perform* or achiev* or abilit* or outcome* or improve* School N1 (performan* or achiev*) DE “Intellectual Development” Intellect* N2 develop* S5 OR S7 OR S8 OR S9 S1 OR S2 S3 AND S10 AND S11 S3 AND S6 AND S11 student* or pupil* S6 AND S14 S3 AND S11 AND S15 S13 AND S14
Searching other resources
Grey literature
Additional searches will be made by means of Google and Google Scholar and we will check the first 150 hits. OpenGrey (http://www.opengrey.eu/) will also be used to search for European grey literature. Copies of relevant documents will be made and we will record the exact URL and date of access for each relevant document.
In addition we will look into the following sites: What Works Clearinghouse - U.S. Department of Education, Dansk Clearinghouse for Uddannelsesforskning, edu.au.dk/clearinghouse/
European Educational Research Association (EERA), www.eera-ecer.eu/
American Educational Research Association (AERA), Social Science Research Network (SSRN) www.ssrn.com
Copies of relevant documents from Internet-based sources will be made. We will record the exact URL and date of access.
Hand searching
The top two most represented journals in the database search will be hand searched.
Snowballing
Reference lists of included studies and relevant reviews will be searched for potential new literature.
Personal contacts
Personal contacts with national and international researchers will be considered in order to identify unpublished reports and on-going studies.
Description of methods used in primary research
We expect that a certain amount of studies will be conducted without randomisation of participants, since there is not a firm tradition for RCTs in educational research. This stems, among other things, from some degree of scepticism towards randomisation of participants due to ethical concerns about random allocation of services.
The Tennessee STAR experiment is an exception and provides rare evidence of the effect of class size from a randomized controlled trial. The STAR experiment was implemented in Tennessee in the 1980s. A cohort of students and teachers at kindergarten through third grade were assigned at random to three types of class within the same school: a small class (around 17 students), a regular (typical) class (around 23 students), and a regular class with a teacher-aide. In fourth grade the students returned to regular classes and the experiment ended. All districts in the state were invited to participate. The sample included 128 small classes, 101 regular classes and 99 regular classes with an aide. A team based in the state originally conducted an evaluation (Word et al., 1990), but several other researchers have investigated the data as subsequent longitudinal outcome data for students in the original demonstration have been collected (for example Nye et al., 1999 and Hanushek, 1999).
An example of a controlled, though not randomised, trial is the Wisconsin's Student Achievement Guarantee in Education (SAGE) program. It was designed as a 5- year pilot project that began in the 1996-97 school year. The program requires that participating schools implement four different interventions, of which one is to reduce the pupil-teacher ratio within a classroom to 15 students per teacher beginning with kindergarten and first grade in the 1996-97 school year (second grade was added in 1997-98 and third grade in 1998-99). The SAGE evaluation is based on comparisons of achievement in the 30 schools that entered the program in the autumn of 1996 and a group of 14-17 preselected comparison schools with similar student and school characteristics. Achievement tests were administered in the SAGE and comparison schools at the beginning and end of the first grade (Molnar et al., 1999).
A widely used approach that tries to estimate the causal effect of class size follows the methodological development in Angrist and Lavy (2000). This method estimates the class size effect from cut-off rules in grade enrolment with a regression discontinuity design. As enrolment into a particular grade reaches the maximum class size, government regulations stipulate that schools create an additional class. If, for example, the class size maximum is 40, then enrolment of 40 students will result in one class while enrolment of 41 students will result in two classes of average size 20.5. Comparing student outcomes by small and large classes in schools with beginning-of-the-year enrolment near 40 students, Angrist and Lavy identify the effects of class size reductions.
Criteria for determination of independent findings
We will take into account the unit of analysis of the studies to determine to whether individuals were randomised in groups (i.e. cluster randomised trials), whether individuals may have undergone multiple interventions, whether there were multiple treatment groups and whether several studies are based on the same data source.
Cluster randomised trials
Cluster randomised trials included in this review will be checked for consistency in the unit of allocation and the unit of analysis, as statistical analysis errors can occur when they are different. When appropriate analytic methods have been used, we will meta-analyse effect estimates and their standard errors (Higgins & Green, 2011). In cases where study investigators have not applied appropriate analysis methods that control for clustering effects, we will estimate the intra-cluster correlation (Donner, Piaggio, & Villar, 2001) and correct standard errors.
Multiple interventions groups and multiple interventions per individuals
Studies with multiple intervention groups with different individuals will be included in this review. To avoid problems with dependence between effect sizes we will apply robust standard errors (Hedges, Tipton, & Johnson, 2010). However, simulation studies show that this method needs around 20-40 studies included in the data synthesis (Hedges et al., 2010). If this number cannot be reached we will use a synthetic effect size (the average) in order to avoid dependence between effect sizes. This method provides an unbiased estimate of the mean effect size parameter but overestimates the standard error. Random effects models applied when synthetic effect sizes are involved actually perform better in terms of standard errors than do fixed effects models (Hedges, 2007). However, tests of heterogeneity when synthetic effect sizes are included are rejected less often than nominal.
If pooling is not appropriate (e.g., the multiple interventions and/or control groups include the same individuals), only one intervention group will be coded and compared to the control group to avoid overlapping samples. The choice of which estimate to include will be based on our risk of bias assessment. We will choose the estimate that we judge to have the least risk of bias (primarily, selection bias and in case of equal scoring the incomplete data item will be used).
Multiple studies using the same sample of data
In some cases, several studies may have used the same sample of data. We will review all such studies, but in the meta-analysis we will only include one estimate of the effect from each sample of data. This will be done to avoid dependencies between the “observations” (i.e. the estimates of the effect) in the meta-analysis. The choice of which estimate to include will be based on our risk of bias assessment of the studies. We will choose the estimate from the study that we judge to have the least risk of bias (primarily, selection bias).
Multiple time points
When the results are measured at multiple time points, each outcome at each time point will be analysed in a separate meta-analysis with other comparable studies taking measurements at a similar time point. As a general guideline, these will be grouped together as follows: 1) 0 to 1 year follow up, 2) 1 to 2 year follow up and 3) More than 2 year follow up. However, should the studies provide viable reasons for an adjusted choice of relevant and meaningful duration intervals for the analysis of outcomes, we will adjust the grouping.
Multiple outcomes
When the primary studies report results of multiple outcomes (e.g. math and reading outcomes), each outcome will be analysed in a separate meta-analysis with other comparable outcomes.
Details of study coding categories
Selection of studies and data extraction
Under the supervision of review authors, two review team assistants will first independently screen titles and abstracts to exclude studies that are clearly irrelevant. Studies considered eligible by at least one assistant or studies were there is not enough information in the title and abstract to judge eligibility, will be retrieved in full text. The full texts will then be screened independently by two review team assistants under the supervision of the review authors. Any disagreement of eligibility will be resolved by the review authors. Exclusion reasons for studies that otherwise might be expected to be eligible will be documented and presented in an appendix.
The study inclusion criteria will be piloted by the review authors (see Appendix 1.1). The overall search and screening process will be illustrated in a flow-diagram. None of the review authors will be blind to the authors, institutions, or the journals responsible for the publication of the articles.
Two review authors will independently code and extract data from included studies. A coding sheet will be piloted on several studies and revised as necessary (see Appendix 1.2 and 1.3). Disagreements will be resolved by consulting a third review author with extensive content and methods expertise. Disagreements resolved by a third reviewer will be reported. Data and information will be extracted on: Available characteristics of participants, intervention characteristics and control conditions, research design, sample size, risk of bias and potential confounding factors, outcomes, and results. Extracted data will be stored electronically. Analysis will be conducted in RevMan5, SAS and Stata.
Assessment of risk of bias in included studies
We will assess the methodological quality of studies using a risk of bias model developed by Prof. Barnaby Reeves in association with the Cochrane Non-Randomised Studies Methods Group. 4 This model is an extension of the Cochrane Collaboration's risk of bias tool and covers risk of bias in non-randomised studies that have a well-defined control group.
The extended model is organised and follows the same steps as the risk of bias model according to the 2008-version of the Cochrane Hand book, chapter 8 (Higgins & Green, 2008). The extension to the model is explained in the three following points: The extended model specifically incorporates a formalised and structured approach for the assessment of selection bias in non-randomised studies by adding an explicit item about confounding. This is based on a list of confounders considered to be important and defined in the protocol for the review. The assessment of confounding is made using a worksheet where, for each confounder, it is marked whether the confounder was considered by the researchers, the precision with which it was measured, the imbalance between groups, and the care with which adjustment was carried out (see Appendix 1.3). This assessment will inform the final risk of bias score for confounding. Another feature of non-randomised studies that make them at high risk of bias is that they need not have a protocol in advance of starting the recruitment process. The item concerning selective reporting therefore also requires assessment of the extent to which analyses (and potentially, other choices) could have been manipulated to bias the findings reported, e.g., choice of method of model fitting, potential confounders considered / included. In addition, the model includes two separate yes/no items asking reviewers whether they think the researchers had a pre-specified protocol and analysis plan. Finally, the risk of bias assessment is refined, making it possible to discriminate between studies with varying degrees of risk. This refinement is achieved with the addition of a 5-point scale for certain items (see the following section, Risk of bias judgement items for details).
The refined assessment is pertinent when thinking of data synthesis as it operationalizes the identification of studies (especially in relation to non-randomised studies) with a very high risk of bias. The refinement increases transparency in assessment judgements and provides justification for not including a study with a very high risk of bias in the meta-analysis.
Risk of bias judgement items
The risk of bias model used in this review is based on nine items (see Appendix 1.3). The nine items refer to: Sequence generation, allocation concealment, confounders, blinding, incomplete outcome data, selective outcome reporting, other potential threats to validity, a priori protocol and a priory analysis plan.
Confounding
An important part of the risk of bias assessment of non-randomised studies is how the studies deal with confounding factors (see Appendix 1.3). Selection bias is understood as systematic baseline differences between groups and can therefore compromise comparability between groups. Baseline differences can be observable (e.g. age and gender) and unobservable (to the researcher; e.g. motivation). There is no single non-randomised study design that always deals adequately with the selection problem: Different designs represent different approaches to dealing with selection problems under different assumptions and require different types of data. There can be particularly great variations in how different designs deal with selection on unobservables. The “adequate” method depends on the model generating participation, i.e. assumptions about the nature of the process by which participants are selected into a program. A major difficulty in estimating causal effects of class size on student outcomes is the potential endogeneity of class size, stemming from the processes that match students with teachers, and schools. Not only do families choose neighbourhoods and schools, but principals and other administrators assign students to classrooms. Because these decision makers utilize information on students, teachers and schools, information that is often not available to researchers, the estimators are quite susceptible to biases from a number of sources.
The primary studies must at least demonstrate pre-treatment group equivalence via matching, statistical controls, or evidence of equivalence on key risk variables and participant characteristics. For this review, we have identified the following observable confounding factors to be most relevant: age and grade level, performance at baseline, gender, socioeconomic background and local education spending. In each study, we will assess whether these confounding factors have been considered, and in addition we will assess other confounding factors considered in the individual studies. Furthermore, we will assess how each study deals with unobservables.
Importance of pre-specified confounding factors
The motivation for focusing on age and grade level, performance at baseline, gender, socioeconomic background and local education spending is given below.
Generally development of cognitive functions relating to school performance and learning are age dependent, and furthermore systematic differences in performance level often refer to systematic differences in preconditions for further development and learning of both cognitive and social character (Piaget, 2001; Vygotsky, 1978).
Therefore, to be sure that an effect estimate is a result from a comparison of groups with no systematic baseline differences it is important to control for the students' grade level (or age) and their performance at baseline (e.g. reading level, math level).
With respect to gender it is well-known that there exist gender differences in school performance (Holmlund & Sund, 2005). Girls outperform boys with respect to reading and boys outperform boys with respect to mathematics (Stoet & Geary, 2013). Although part of the literature finds that these gender differences have vanished over time (Hyde, Fennema, & Lamon, 1990; Hyde & Linn, 1988), we find it important to include this potential confounder.
Students from more advantaged socioeconomic backgrounds on average begin school better prepared to learn and receive greater support from their parents during their schooling years (Ehrenberg et al., 2001). Further, there is evidence that class size may be negatively correlated with the student's socioeconomic backgrounds. For example, in a study of over 1,000 primary schools in Latin America, Willms and Somers (2001) found that the correlation between the pupil/teacher ratio in the school and the socioeconomic level of students in the school was about –.15. Moreover, Willms and Somers (2001) found that schools enrolling students from higher socioeconomic backgrounds tended to have better infrastructures, more instructional materials, and better libraries. The correlations of these variables with school-level socioeconomic status varied between .26 and .36.
Finally, as outlined in the background section, students with socio-economically disadvantaged backgrounds perform poorly in school tests (OECD, 2010).
Therefore, the accuracy of the estimated effects of class size will depend crucially on how well socioeconomic background is controlled for. Socioeconomic background factors are, e.g. parents' educational level, family income, minority background, etc.
Assessment
At least two review authors will independently assess the risk of bias for each included study. Disagreements will be sought by a third reviewer with content and statistical expertise. Disagreements resolved by a third reviewer will be reported. We will report the risk of bias assessment in risk of bias tables for each included study in the completed review.
Measures of treatment effect
We expect that academic achievement outcomes will mostly be continuous.
For continuous outcomes (such as any scales related to reading and mathematics), effects sizes with 95 % confidence intervals will be calculated, where means and standard deviations are available. If means and standard deviations are not available, we will calculate standardized mean differences (SMD) from F-ratios, t-values, chi-squared values and correlation coefficients, where available, using the methods suggested by Lipsey & Wilson (2001). Hedges' g will be used for estimating SMDs. The review authors will request information from the principal investigators if not enough information is provided to calculate an effect size and standard error. If missing summary data cannot be derived, the study results will be reported in as much detail as possible.
There are statistical approaches available to re-express dichotomous and continuous data to be pooled together (Sánchez-Meca, Marín-Martínes & Chacón-Moscoso, 2003). If dichotomous academic achievement outcomes are provided, we will convert them to SMDs using the Cox transformation.
We expect that completion rates will be dichotomous. For dichotomous outcomes we will calculate odds ratios or risk ratios with 95 % confidence intervals and p-values.
We expect there will be a mix of studies with some reporting change scores and others reporting final values. We will analyse change scores and final values separately (Higgins & Green, 2011).
Software statistical analyses will be RevMan 5.0, Excel and Stata 10.0.
Statistical procedures and conventions
The proposed project will follow standard procedures for conducting systematic reviews using meta-analysis techniques. The overall data synthesis will be conducted where effect sizes are available or can be calculated, and where studies are similar in terms of the outcome measured.
As different computational methods may produce effect sizes that are not comparable we will be transparent about all methods used in the primary studies (research design and statistical analysis strategies) and use caution when synthesizing effect sizes. Special caution concerns studies using instrumental variables (IV) to estimate a local average treatment effect (LATE) (Angrist & Pischke, 2009). They will be included, but may be subject to a separate analysis depending on the comparability between the LATE's and the effects from other studies. We will in any case check the sensitivity of our results to the inclusion of IV studies.
Studies that have been coded with a very high risk of bias (scored 5 on the risk of bias scale) will not be included in the data synthesis
All follow-up durations reported in the primary studies will be recorded and we will conduct separate analyses for short-, medium- and long-term outcomes (approximately 1 year, 2 year and more than 2 year follow up). We will conduct separate analyses for the different academic achievement outcomes (e.g. math and reading) as well.
As the intervention deal with diverse populations of participants (from different countries, from urban/rural districts etc.), and we therefore expect heterogeneity among primary study outcomes, all analyses of the overall effect will be inverse variance weighted using random effects statistical models that incorporate both the sampling variance and between study variance components into the study level weights. Random effects weighted mean effect sizes will be calculated using 95% confidence intervals and we will provide a graphical display (forest plot) of effect sizes. Heterogeneity among primary outcome studies will be assessed with Chi-squared (Q) test, and the I-squared, and τ-squared statistics (Higgins, Thompson, Deeks, & Altman, 2003). Any interpretation of the Chi-squared test will be made cautiously on account of its low statistical power.
For subsequent analyses of moderator variables that may contribute to systematic variations, we will use the mixed-effects regression model. This model is appropriate if a predictor explaining some between-studies variation is available but there is a need to account for the remaining uncertainty (Hedges & Pigott, 2004; Konstantopoulos, 2006).
We expect that several studies have used the same sample of data. We will review all such studies, but in the meta-analysis we will only include one estimate of the effect from each sample of data. This will be done to avoid dependencies between the “observations” (i.e. the estimates of the effect) in the meta-analysis. The choice of which estimate to include will be based on our quality assessment of the studies. We will choose the estimate from the study that we judge to have the least risk of bias, with particular attention paid to selection bias.
We anticipate that several studies provide results separated by for example age and/or gender. We will include results for all age and gender groups. To take into account the dependence between such multiple effect sizes from the same study, we will apply robust standard errors (Hedges et al., 2010). An important feature of this analysis is that the results are valid regardless of the weights used. For efficiency purposes, we will calculate the weights using a method proposed by Hedges et al (2010). This method assumes a simple random-effects model in which study average effect sizes vary across studies (τ2) and the effect sizes within each study are equicorrelated (ρ). The method is approximately efficient, since it uses approximate inverse-variance weights: they are approximate given that ρ is, in fact, unknown and the correlation structure may be more complex. We will calculate weights using estimates of τ2, setting ρ =0.80 and conduct sensitivity tests using a variety of ρ values; to asses if the general results and estimates of the heterogeneity is robust to the choice of ρ.
This robust standard error method uses degrees of freedom based on the number of studies (rather than the total number of effect sizes). Simulation studies show that this method needs around 20-40 studies included in the data synthesis (Hedges et al., 2010). If this number cannot be reached we will conduct a data synthesis where we use a synthetic effect size (the average) in order to avoid dependence between effect sizes.
Moderator analysis and investigation of heterogeneity
We will investigate the following factors with the aim of explaining potential observed heterogeneity: Study-level summaries of participant characteristics (studies considering a specific age (or grade level) group or socioeconomic status group, or studies where separate effects for high/low socioeconomic status or age (grade level) divided are available), intensity (size of reduction and initial class size) and duration (number of years in a small class).
If the number of included studies is sufficient and given there is variation in the covariates, we will perform moderator analyses (multiple meta-regression using the mixed model) to explore how observed variables are related to heterogeneity.
If there are a sufficient number of studies we will apply robust standard errors and calculate the weights using a method proposed by Hedges et al. (2010). This technique calculates standard errors using an empirical estimate of the variance: it does not require any assumptions regarding the distribution of the effect size estimates. The assumptions that are required to meet the regularity conditions are minimal and generally met in practice. Simulation studies show that both confidence intervals and p-values generated this way typically reflect the correct size in samples, requiring between 20-40 studies. This more robust technique is beneficial because it takes into account the possible correlation between effect sizes separated by the covariates within the same study and allows all of the effect size estimates to be included in meta-regression. We will calculate weights using estimates of τ2, setting ρ =0.80 and conduct sensitivity tests using a variety of ρ values; to asses if the general results and estimates of the heterogeneity is robust to the choice of ρ.
We will report 95% confidence intervals for regression parameters.
We will estimate the correlations between the covariates and consider the possibility of confounding. Conclusions from meta-regression analysis will be cautiously drawn and will not solely be based on significance tests. The magnitude of the coefficients and width of the confidence intervals will be taken into account as well.
Otherwise, single factor subgroup analysis will be performed. The assessment of any difference between subgroups will be based on 95% confidence intervals. Interpretation of relationships will be cautious, as they are based on subdivision of studies and indirect comparisons.
In general, the strength of inference regarding differences in treatment effects among subgroups is controversial. However, making inferences about different effect sizes among subgroups on the basis of between-study differences entails a higher risk compared to inferences made on the basis of within study differences; see Oxman & Guyatt (1992). We will therefore use within study differences where possible.
We will also consider the degree of consistence of differences, as making inferences about different effect sizes among subgroups entails a higher risk when the difference is not consistent within the studies; see Oxman & Guyatt (1992).
Sensitivity analysis
Sensitivity analysis will be carried out by restricting the meta-analysis to a subset of all studies included in the original meta-analysis and will be used to evaluate whether the pooled effect sizes are robust across components of methodological quality. For
methodological quality, we will consider sensitivity analysis for each major component of the risk of bias checklists and restrict the analysis to studies with a low risk of bias.
Further sensitivity analyses with regard to research design and statistical analysis strategies in the primary studies will be an important element of the analysis to ensure that different methods produce consistent results.
Assessment of reporting bias
Reporting bias refers to both publication bias and selective reporting of outcome data and results. Here, we state how we will assess publication bias.
We will use funnel plots for information about possible publication bias if we find sufficient studies (Higgins & Green, 2011). However, asymmetric funnel plots are not necessarily caused by publication bias (and publication bias does not necessarily cause asymmetry in a funnel plot). If asymmetry is present, we will consider possible reasons for this.
Treatment of qualitative research
We do not plan to include qualitative research.
REVIEW AUTHORS
ROLES AND RESPONSIBLIITIES
Below is listed who is responsible for the following areas: Content: Christoffer Scavenius Sonne-Schmidt Systematic review methods: Trine Filges Statistical analysis: Trine Filges Christoffer Scavenius Sonne-Schmidt Information retrieval: Anne Marie Klint Jørgensen
SOURCES OF SUPPORT
SFI Campbell.
DECLARATIONS OF INTEREST
None
PRELIMINARY TIMEFRAME
Approximate date for submission of the systematic review is 1 year after protocol approval.
PLANS FOR UPDATING THE REVIEW
Once completed, we plan to update the review with a frequency of 2 years. Trine Filges will be responsible.
AUTHOR DECLARATION
Authors' responsibilities
By completing this form, you accept responsibility for preparing, maintaining and updating the review in accordance with Campbell Collaboration policy. The Campbell Collaboration will provide as much support as possible to assist with the preparation of the review.
A draft review must be submitted to the relevant Coordinating Group within two years of protocol publication. If drafts are not submitted before the agreed deadlines, or if we are unable to contact you for an extended period, the relevant Coordinating Group has the right to de-register the title or transfer the title to alternative authors. The Coordinating Group also has the right to de-register or transfer the title if it does not meet the standards of the Coordinating Group and/or the Campbell Collaboration.
You accept responsibility for maintaining the review in light of new evidence, comments and criticisms, and other developments, and updating the review at least once every five years, or, if requested, transferring responsibility for maintaining the review to others as agreed with the Coordinating Group.
Publication in the Campbell Library
The support of the Coordinating Group in preparing your review is conditional upon your agreement to publish the protocol, finished review, and subsequent updates in the Campbell Library. The Campbell Collaboration places no restrictions on publication of the findings of a Campbell systematic review in a more abbreviated form as a journal article either before or after the publication of the monograph version in Campbell Systematic Reviews. Some journals, however, have restrictions that preclude publication of findings that have been, or will be, reported elsewhere and authors considering publication in such a journal should be aware of possible conflict with publication of the monograph version in Campbell Systematic Reviews. Publication in a journal after publication or in press status in Campbell Systematic Reviews should acknowledge the Campbell version and include a citation to it. Note that systematic reviews published in Campbell Systematic Reviews and co-registered with the Cochrane Collaboration may have additional requirements or restrictions for co-publication. Review authors accept responsibility for meeting any co-publication requirements.
Footnotes
1 Appendices
1
The inverse chi-square (Fisher) method (Hedges & Olkin, 1985)
2
The standardized regression coefficient measures the number of standard deviations of change in output that would be associated with a one standard deviation change in input.
3
The vote counting method did not necessarily lead to a different conclusion. It depends upon the inference procedure associated with the method (i.e., the category with the most “votes” represents the true state). The analysis in Hanushek (1989) shows that 24 (3) percent of the coefficients on expenditure were positive (negative) and significant and 46 (24) percent were positive (negative) and non-significant, implying that the typical relation is positive. Note that none of the methods used in either Hanushek (1989) or Hedges et al. (1994) combines magnitude of effect size and significance.
4
This risk of bias model was introduced by Prof. Reeves at a workshop on risk of bias in non-randomised studies at SFI Campbell, February 2011. The model is a further development of work carried out in the Cochrane Non-Randomised Studies Method Group (NRSMG).
5
This risk of bias model was introduced by Prof. Reeves at a workshop on risk of bias in non-randomised studies at SFI Campbell, February 2011. The model is a further development of work carried out in the Cochrane Non-Randomised Studies Method Group (NRSMG).
6
See user guide for unobservables