






Abstract
Background
Policy makers need access to reliable data to monitor and evaluate the progress of development outcomes and targets such as sustainable development outcomes (SDGs). However, significant data and evidence gaps remain. Lack of resources, limited capacity within governments and logistical difficulties in collecting data are some of the reasons for the data gaps. Big data—that is digitally generated, passively produced and automatically collected—offers a great potential for answering some of the data needs. Satellite and sensors, mobile phone call detail records, online transactions and search data, and social media are some of the examples of big data. Integrating big data with the traditional household surveys and administrative data can complement data availability, quality, granularity, accuracy and frequency, and help measure development outcomes temporally and spatially in a number of new ways.The study maps different sources of big data onto development outcomes (based on SDGs) to identify current evidence base, use and the gaps. The map provides a visual overview of existing and ongoing studies. This study also discusses the risks, biases and ethical challenges in using big data for measuring and evaluating development outcomes. The study is a valuable resource for evaluators, researchers, funders, policymakers and practitioners in their effort to contributing to evidence informed policy making and in achieving the SDGs.
Objectives
Identify and appraise rigorous impact evaluations (IEs), systematic reviews and the studies that have innovatively used big data to measure any development outcomes with special reference to difficult contexts
Search Methods
A number of general and specialised data bases and reporsitories of organisations were searched using keywords related to big data by an information specialist.
Selection Criteria
The studies were selected on basis of whether they used big data sources to measure or evaluate development outcomes.
Data Collection and Analysis
Data collection was conducted using a data extraction tool and all extracted data was entered into excel and then analysed using Stata. The data analysis involved looking at trends and descriptive statistics only.
Main Results
The search yielded over 17,000 records, which we then screened down to 437 studies which became the foundation of our systematic map. We found that overall, there is a sizable and rapidly growing number of measurement studies using big data but a much smaller number of IEs. We also see that the bulk of the big data sources are machine-generated (mostly satellites) represented in the light blue. We find that satellite data was used in over 70% of the measurement studies and in over 80% of the IEs.
Authors' Conclusions
This map gives us a sense that there is a lot of work being done to develop appropriate measures using big data which could subsequently be used in IEs. Information on costs, ethics, transparency is lacking in the studies and more work is needed in this area to understand the efficacies related to the use of big data. There are a number of outcomes which are not being studied using big data, either due to the lack to applicability such as education or due to lack of awareness about the new methods and data sources. The map points to a number of gaps as well as opportunities where future researchers can conduct research.
Abbreviations
call record details
Department for International Development
data mining
Defense Meteorological Satellite Program-Operational Linescan System
environmental clearance
Evidence for Policy and Practice Information
Enhanced Vegetation Index
global positioning system
internally displaced person
impact evaluation
Institutional Review Board
low and middle income countries
machine learning
mobile network operator
Organisation for Economic Co-operation and Development
randomised controlled trial
sustainable development goal
Socioeconomic Data and Applications Center
systematic review
satellite remote sensing
Social Sciences Citation Index
PLAIN LANGUAGE SUMMARY
Big data offer unrealised potential for impact evaluations (IEs)
Traditional data collection can be costly; target populations may be inaccessible, phenomena cannot always be directly observed and interviewing people may be unethical, dangerous or impossible. In addition, budget constraints can limit data collection.
“Big data” does not require data collection in the field, and can provide insight into economic, social and political behaviour.
What is this evidence and gap map about?
Big data consist of data such as online searches, social media, citizen reporting or crowdsourced data, process-mediated data such as mobile phone call record details (CRD), commercial transactions data and machine-generated data from satellites, sensors or drones.
Big data can measure outcomes that could not previously be measured using household surveys. The potential of big data to answer causal attribution, however, is still not widely understood, especially in low- and middle-income countries.
This EGM of studies using big data reviews methodological, ethical and practical constraints relating to the use of big data.
What studies are included?
The map includes IEs that use big data to evaluate development outcomes, systematic reviews (SRs) of big data IEs and other measurement studies that innovatively use big data to measure and validate any development outcomes.
Sources include social networks, internet searches, mobile data, crowd sourced data, data from public agencies, data produced by business, CRD and satellite data.
The map contains 437 studies written in English published between 2005 and 2019: 48 IEs, 381 measurement studies and eight SRs.
What are the main findings of this map?
There is considerable potential for measuring various development indicators using big data. The measurement studies serve as a proof-of-concept for evaluators wanting innovative ways to measure development outcomes.
There is potential for more IEs on development interventions. The map shows that the number of IEs that use big data to measure outcomes or control variables is growing fast, and there is scope for greater use.
Satellite data are used the most. The use of satellite data for IEs and measurement studies has been facilitated by the availability of preprocessed satellite data, new ML techniques and increased computational capacity to process the satellite images into meaningful measures of development outcomes. Despite a number of high-profile measurement studies, CRD data has not been used to rigorously evaluate any development outcome. Similarly, other human-sourced data and process-mediated data have been used only sparingly in IEs.
There are potential sectors and themes where SRs will be useful. The map highlights a few potential thematic areas where SRs will be informative, most notably those of (i) all IEs that have used satellite data; and (ii) those with reference to the data sources used in rigorously evaluating forest cover.
The number of measurement studies indicates potential for more IEs in fragile contexts.
Ethical concerns and transparency issues are substantial. Ethical issues related to informed consent, data privacy, data security and unintended exclusion are severe for some of the sources of big data. Few studies report on ethical issues related to using big data.
Some capacity constraints are acute. Computational capacity is constrained and technical expertise on large-scale big data analysis is siloed.
What do the findings of the map mean?
This map shows that big data can contribute to the evidence base in development sectors where evaluations are often infeasible due to data issues.
One of the key “absolute gaps” that the map has identified is that there are fewer IEs than measurement studies. Given the fast-growing availability of big data and improving computation capacity, there is great potential for the use of big data in future IEs. However, analytical, ethical and logistical challenges may hinder the use of big data in evaluations.
This report calls for standards to be set for the reporting of data quality issues, data representativeness and data transparency, and an Institutional Review Board (IRB) review specifically designed for ethical issues related to big data.
More interaction is needed between big data analysts, remote sensing scientists and evaluators.
How up-to-date is this EGM?
The authors searched for studies published up to December 2019.
BACKGROUND
Introduction
The problem, condition or issue
Policymakers need access to reliable data to evaluate development outcomes and decide on future resource allocation. Governments, multilateral organisations and other development players in low and middle income countries (LMICs) use censuses, nationally representative household surveys, other household surveys and administrative data to evaluate development programmes and policies. With the increasing complexity of development programmes, there is a need to collect a vast array of output, outcomes and contextual variables to robustly assess impact. However, significant data collection challenges remain. Data challenges for IEs include limitations on sample size and power due to budget constraints, inaccessible or difficult-to-reach sections of target populations, measurement errors due to recall bias, inadequate frequency and level of aggregation, inadequate information on controls and covariates, data collection lag times and difficulties in measuring long-term impact
The gap in data availability at the country level is partially driven by a lack of resources, limited capacity within governments and logistical difficulties in collecting the data. For example, the total cost of collecting data on all the 169 sustainable development goal (SDG) targets was estimated to be around USD 254 billion, which is about 12.5% of total official development assistance to be committed for the post-2015 period (Jerven, 2014). A recent UN survey shows that there is existing capacity to collect data on only 40 SDG indicators and data sources for another 47 indicators are available in principle. There is little capacity and resources for collecting data on the remaining indicators (UN DESA, 2018).
Data sources
Big data offers great potential for answering some of these data needs. More importantly, it answers the causal questions around which policies or interventions work, including in contexts where traditional methods of data collection are challenging. The UN Global Pulse (2013) defines big data as being digitally generated (as opposed to digitised manually), passively produced (a by-product of digital services, transactions and interactions), automatically collected and geographically and temporally trackable. Although there is no formal definition for big data, currently the term is characterised by the three Vs: high volume, velocity and variety. Satellite images, sensors and drones, mobile phone CRDs, commercial transactions data, online searches, social media, citizen reporting or crowdsourced data are the sources of big data.
Integrating big data with traditional household surveys and administrative data can complement data availability, quality, granularity, accuracy and frequency, as well as help measure development outcomes temporally and spatially in a number of new ways (BenYishay et al., 2018; Lokanathan et al., 2017; Salganik, 2017; UN Global Pulse, 2016; York & Bamberger, 2020). For example, satellite images and mobile CRD have been used in mapping poverty (Blumenstock et al., 2015; Jean et al., 2016), disaster response (Lu et al., 2012; Wilson et al., 2016) and food security (Decuyper et al., 2014). Web searches and social media were used in predicting unemployment and crime instances (Gerber, 2014; Xu et al., 2013).
While big data is increasingly used for tracking indicators and monitoring development progress on SDGs (Lokanathan et al., 2017; UN Global Pulse, 2012; Vaitla, 2014), available data are less often utilised to address causal questions about the effects of specific policies and programmes. Big data can contribute to answering some of the causal questions around which interventions work. Big data prediction models can generate proxy estimates for key development outcomes such as wealth, human development, infrastructure quality, forest cover and more, which can be used in experimental (Jayachandran et al., 2016; Pellegrini, 2019) and quasi-experimental studies (BenYishay et al., 2018; Jaiswal et al., 2020). Satellite images such as night light, crop intensity, water availability, land use, proximity to services and physical attributes such as elevation or slope can be used in IEs as a direct measure of outcomes or as covariates. Furthermore, big data can be used for measuring and evaluating the long-term impacts of policies and programmes, conducting ex-post evaluations and estimating spatial heterogeneity. For example, satellite data are available at least as far back as 1993 for all places (high-resolution pictures are available for the entire globe at a granularity as low as 1 × 1 metre), allowing measurement of long-term impacts. This can help fill the gaps in evidence that cannot be addressed by traditional data sources.
Why it is important to develop the systematic map
The potential of big data to answer causal attribution, however, is still not widely understood or used, especially in LMICs (York & Bamberger, 2020). In this context, a systematic collection of various sources of big data and ways of measuring and evaluating development outcomes will be a great value addition to the development community's contribution to evidence-informed policymaking.
In this paper we look at IEs, SRs and measurement studies
For the purpose of this report, big data measurement studies are defined as the studies that have innovatively used big data to measure and validate any development outcome such as poverty measurement, crop productivity, employment, mobility, forest cover, and so forth. These are not IEs but can inform future evaluations.
OBJECTIVES
The overarching aim of this report is to inform policymakers and evaluators of existing evaluations based on big data and to provide a database of big data-based IEs and studies that could inform future IEs. Specifically, the objectives of the research are to: Identify rigorous IEs, SRs and the studies that have innovatively used big data to measure any development outcomes, with special reference to fragile contexts; Summarise current understanding of potential uses, pros and cons, reliability, biases, risks and ethical issues in using big data for measurement and evaluation of development outcomes and Generate interest and awareness among key stakeholders (evaluators, researchers, donors, practitioners, implementers and policymakers) of the potential as well as challenges of using big data.
This systematic map addresses the following questions: How have different types of big data and methods been used for measuring and evaluating development outcomes? How dispersed or concentrated is the use of big data across development goals and geographies? What are the potential biases, measurement reliability issues, pros and cons, risks and ethical issues in using big data for measuring and evaluating development outcomes? What are some of the unexplored but promising applications of big data for IEs?
METHODS
Evidence and gap map: Definition and purpose
We follow 3ie's methodology and process for evidence gap maps (Snilstveit et al., 2017). To create this map, we used systematic methods to identify any completed and ongoing IEs, SRs and big data measurement studies relevant to our research objectives. We conducted systematic searches and data extraction as described in Appendices C and D. The studies identified are mapped on to the framework of big data sources and SDG outcomes to provide a visual display of the volume of and the trends in the evidence base. We also coded how the included studies have dealt with ethical and transparency related challenges. The systematic map is available through an online interactive platform on the 3ie website and allows users to explore the available evidence through different filtering options.
The online map can be accessed here: https://gapmaps.3ieimpact.org/evidence-maps/big-data-systematic-map.
Framework development and scope
For the purpose of this research, we define big data sources as digitally generated, passively produced and automatically collected data, as defined in UN Global Pulse (2013). The sources of big data include satellite images, sensors and drones, mobile phone CRDs, commercial transactions data, online searches, social media, citizen reporting or crowdsourced data. See Table 2 for more details on various sources of big data adapted from UN Global Pulse (2012, 2013), Yeung & Fok (2014) and Blazquez and Domenech (2018).
Selection criteria for studies
Abbreviations: CRD, call record detail; IE, impact evaluation; SR, systematic review.
Abbreviation: GPS, global positioning system.
3ie evidence gap maps compile IEs and SRs. However, in this study, we include IEs and SRs as well as measurement studies: the studies that have innovatively used big data to measure and validate any development outcome. These are multidisciplinary studies that use state-of-the-art methods from computer science and statistics to collect, clean and analyse big data for measuring development outcomes. For example, Jean et al. (2016) use transfer learning techniques as well as daytime and night light data from satellite images to estimate consumption expenditure at the cluster (village) level to map poverty in five African countries: Nigeria, Tanzania, Uganda, Malawi and Rwanda. While a number of such studies have used big data for measuring various development outcomes, few IEs have used these innovative big data-based outcome measures. These measurement studies, we hope, would serve as proofs of concept for innovative use of ML and big data that can be used in future evaluations.
3ie defines an IE as a “study of the attribution of changes in the outcome to the intervention.”
3ie (2012) impact evaluation glossary. Available at: https://www.3ieimpact.org/sites/default/files/2018-07/impact_evaluation_glossary_-_july_2012_3.pdf.
We use the Organisation for Economic Co-operation and Development (OECD) definition of fragile contexts, which includes conflicts, institutional fragility, social fragility, environmental risks, health risks and climatic risks. This list is more inclusive than the list used by the UK Department for International Development (DFID) and the World Bank, which includes conflict and institutional and social fragility (DFID, 2016). See Appendix A for more details on the classifications and country list. We use the OECD definition for classifying fragile contexts based on: Difficult terrain Natural disasters Conflict or humanitarian crisis Chemical or radio-nuclear issues Disease outbreaks or epidemics.
Using big data in evaluation poses a number of analytical challenges on issues including data quality, transparency, generalisability, and privacy and ethical challenges such as consent for using data and anonymisation of the data. This report also explores how the included studies dealt with these challenges.
Types of study design
Table 1 summarises the criteria we used for searching, screening and including the studies for the map.
Search methods and sources
Innovations in the type of devices available for measurement (satellites and sensors); daily personal use (mobiles, wearables, Internet of Things, etc.); social interaction (blogs, Facebook, Twitter, WhatsApp, etc.); and recording business transactions digitally (CRD, e-transactions, mobile money, credit card payment, etc.) have led to an explosion of automatically collected data. However, there is no official definition of big data. McKinsey defined it broadly as data “whose size is beyond the ability of typical database software tools to capture, store, manage, and analyze” (Manyika et al., 2011).
UN Global Pulse (2013) defines big data for the purposes of development as being digitally generated (as opposed to digitised manually), passively produced (a by-product of digital services, transactions and interactions), automatically collected and geographically or temporally trackable. While the size, velocity and veracity are all defining characteristics of big data, the definition relevant for IE is that these are nonsampled data, passively left behind by humans using digital devices and services or automatically collected by the services providers for the purpose other than statistical inference (Letouzé, 2016; UN Global Pulse, 2016). Hence, unlike the conventional survey data where the respondents say what they do or feel, big data captures what people actually do. The implication of this is that big data is nonreactive: in other words, there is less likelihood of social desirability bias (Salganik, 2017). The other key characteristic of big data that matters for evaluation is that it is near real-time and can be available across multiple frequencies (e.g., hourly, daily) over a long period. Table 2 provides the types of big data, subclassifications, definitions and sources.
Using these definitions, we include the following broad classification of big data
There are also other classifications of big data based on its structure: structured, semistructured and unstructured data. Structured data are in the standard columns and rows form such as what sensors provide; semistructured data contains free texts but can be tagged, such as Twitter; and the unstructured data includes images and videos (Desouza & Jacob, 2017). Big data can also be classified as open and proprietary data (Maaroof, 2015).
Human-sourced information from social networks that is provided voluntarily by users;
Process-mediated data from traditional business systems and websites that includes digitally recorded business activities;
Machine-generated data from automated systems includes information from sensors and machines that measure and record events and situations in the physical world.
Analysis and presentation
Report structure
We use the SDGs as the basis for identifying the outcome categories, similar to Phillips et al. (2017).
Our map refers to SDGs since they are globally acknowledged and fairly inclusive list of development outcomes. All the studies relevant to this map are expected to fall under at least one of the 169 targets listed within SDGs.
Outcome categories and definitions
Abbreviation: SDG, sustainable development goal.
Filters for presentation
We have added filters such as population, challenging contexts, geographic coverage to provide more details about the data sources and outcomes of interest. The population filter provides information on whether the studies in the map identify subgroups such as rural, urban, refugees, conflict affected persons, ethnic minorities. With the challenging contexts filter we show if the studies were in areas which were remote, conflict affected, affected by disease outbreak, and so on. We also identified different regions where the studies were conducted.
Dependency
Each unit of analysis was a report, peer reviewed journal publication, working paper. We included one study per unit of analysis. In cases where we had multiple reports we included the latest one with preference given to peer review versions and/or based on ease of access to a particular version. When multiple studies were covered by a single report, we included the report and then mapped the data sources and outcomes accordingly.
Data collection and analysis
Screening and study selection
We first employed Evidence for Policy and Practice Information (EPPI)-Reviewer's built-in text mining, an ML technique, to sort the studies based on the inclusion and exclusion criteria at the title and screening stage (see Appendix D for more details on how text mining was used for screening). This reduced the number of studies to be screened at the title and abstract level to 9720. At the second stage, three researchers screened the studies for eligibility based on inclusion and exclusion criteria defined in the study protocol. At the end of stage two, we had identified 1348 studies to be screened at the full-text level.
At stage three, four researchers coded the studies at the full-text level. We followed a single screening with safety first approach,
See Rathinam et al. (2019a) for more details on single screening with safety first approach. 9 See 3ie's critical appraisal checklist for SRs.
Data extraction and management
The three-stage process of screening resulted in a final list of 437 studies including 48 IEs, 381 measurement studies and 8 SRs. Through a consultation process, we identified the metadata to be extracted using a standardised data extraction tool and defined them in the study protocol. During the final studies coding, we collected metadata such as outcomes studies, outcome subcategories, data sources used, geographical location of the intervention, country, evaluation design, target population, data transparency, ethics and other bibliographic information from the included studies (see Appendix D for the data extraction tool). We also critically appraised the SRs (see Appendix E for the SR appraisal tool and summary of the included SRs). Due to the size and the nature of included studies we did not conduct critical appraisal of IEs or measurement studies.
Tools for assessing risk of bias/study quality of included reviews
All SRs have been critically appraised using 3ie's critical appraisal checklist, adopted from the SURE checklist. Appendix F summarises all the SRs included in our sample and Table G1 provides details on the critical appraisal of the included studies.
Methods for mapping
The studies were mapped using 3ie's evidence gap map platform, which is organised into rows and columns. Various big data sources are placed in the rows and the development themes are placed in the columns. Any intersecting cell represents the development outcome measured or evaluated using the particular type of big data. Different colour bubbles represent the type of study: grey bubbles denote IEs, blue bubbles denote measurement studies, green bubbles denote high-quality SRs and red bubbles denote low-quality SRs. Hovering over the bubbles will show the links to studies. There are also filters for different regions, countries, study design, fragile context and the target population of the studies.
Development themes (such as environmental sustainability, economic development and livelihoods) contain a large number of studies. We have provided maps within the main map to show how the studies are distributed across the subthemes under these broad themes. In the submaps, the big data sources are mapped against level 2 or level 1 subclassification provided in the SDGs as relevant. For example, the submap for economic development and livelihoods has been coded against the level 2 indicators of eradicating poverty (SDG 1) and employment and economic growth (SDG 8), and the submap for environmental sustainability is coded against the level 1 classification of SDGs 12, 13, 14 and 15. The following development themes have submaps: Economic development and livelihoods Health and well-being Governance and human rights Urban development Environmental sustainability.
RESULTS
Description of studies
Results of the search
We systematically searched academic databases with the help of an information specialist (see Appendix C for the list of academic databases and search strings) and manually searched specialist organisational websites and grey literature sources. The initial searches resulted in 17,393 studies, of which 17,008 studies were identified through bibliographic databases search and 385 studies were identified through hand-searching specialist databases and IE and grey literature repositories (Figure 1). All the results were uploaded onto EPPI-Reviewer 4 for screening and coding. Screening of the studies was done in three stages.
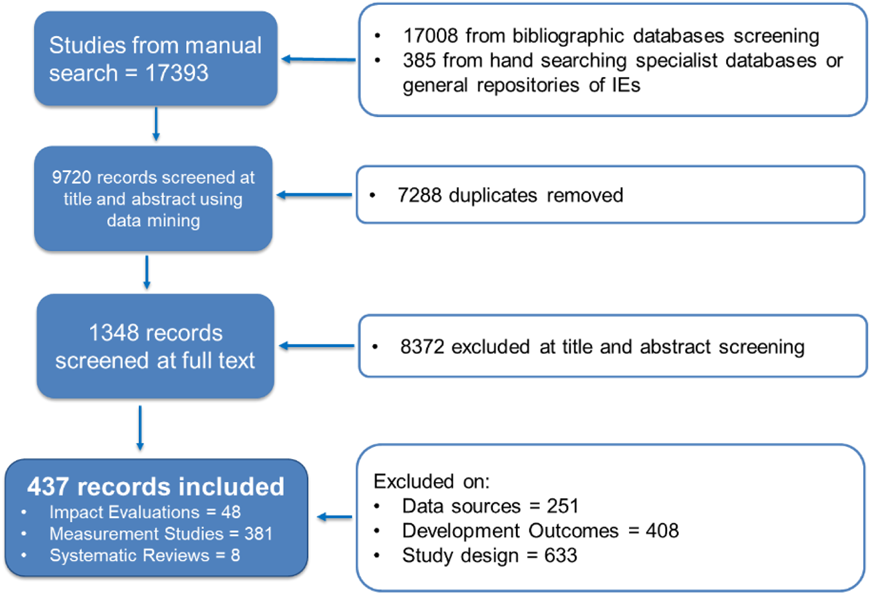
The PRISMA flowchart.
Excluded studies
This report includes papers written in English and published between 2005 and 2019. This map does not include studies that develop algorithms or methodologies for using big data without explicit application to measuring or evaluating a development outcome. This map does not include studies that describe how big data and ML have been used in development programming to help programme implementation, coordination and management for designing and scaling new development solutions; neither does it include studies that show how big data methods are used in randomised controlled trials (RCTs) to identify the differential impact of subgroups and in improving survey data collection, such as defining sampling frames.
Studies awaiting classification (if applicable)
If applicable, list the characteristics of any studies that have been identified as potentially eligible but have not been incorporated into the map (ER40).
Synthesis of included studies
The map contains 437 studies, of which 48 are IEs, 381 are measurement studies and 8 are SRs. Of the 48 IEs, 8 are RCTs and the remaining are quasi-experimental studies.
Figure 2 displays the number of studies published each year from 2005 to 2020. The light blue bar shows the measurement studies, the dark blue bar shows IEs and the line indicates the cumulative number of measurement studies, IEs and SRs. The number of measurement studies has grown gradually from 2005 to 2012, increasing substantially every year since then with maximum numbers in 2017 and 2018. The past five years alone have accounted for more than 60% of the studies, indicating the increasing availability of big data, improved computational capacity and greater interest among researchers and journals.
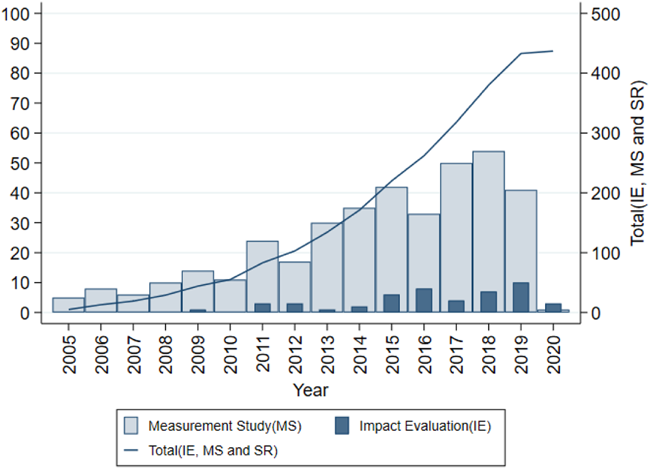
Number of studies published per year.
The figure also shows that applying big data to IEs is a new phenomenon. The first IE using big data was published in 2009. While almost all the IEs were published after 2013, more than three-quarters of the IEs were published in the last five years. We expect that the measurement studies will be proofs of concept, leading IEs to adopt to these approaches to innovatively measure development outcomes in evaluations. The map also points to the gap between the growth of measurement studies and use of big data in IEs.
Figure 3 shows the geographical distribution of the included studies. About 50% of the studies (n = 210) are from Asia and close to 30% (n = 132) are from Sub-Saharan Africa. The distribution of IEs and measurement studies are roughly similar to the overall distribution. One notable exception is Latin America and the Caribbean where the region accounts for 15% of total studies (n = 65), but substantially more IEs (38%, n = 18).
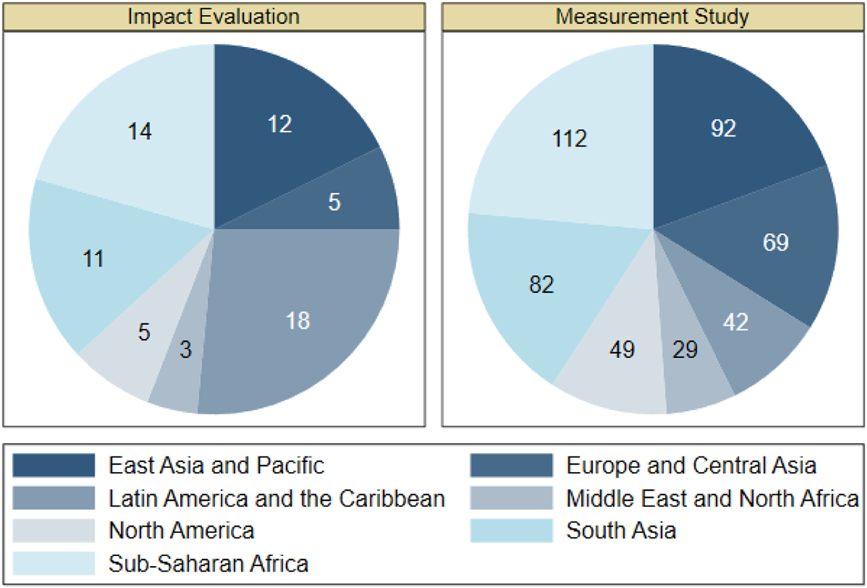
Distribution of studies over regions.
China (43) and India (34) are the most-studied countries, and Kenya has highest number of studies (15) in Sub-Saharan Africa (Figure 4). While East Africa is very well-represented on the map, other African countries have fewer entries and several countries in West and North Africa have no studies at all. About 35 of the studies are multi-country studies and 11 studies did not specify the country name primarily to conceal the identity of the data provider. The distribution of IEs and measurement studies are again roughly similar to the overall distribution but Latin America countries, particularly Mexico (5), account for a higher proportion of IEs. See Table H1 for a list of top 20 countries with the maximum number of studies and Table H2 for the geographical distribution of studies across the regions in Appendix G.
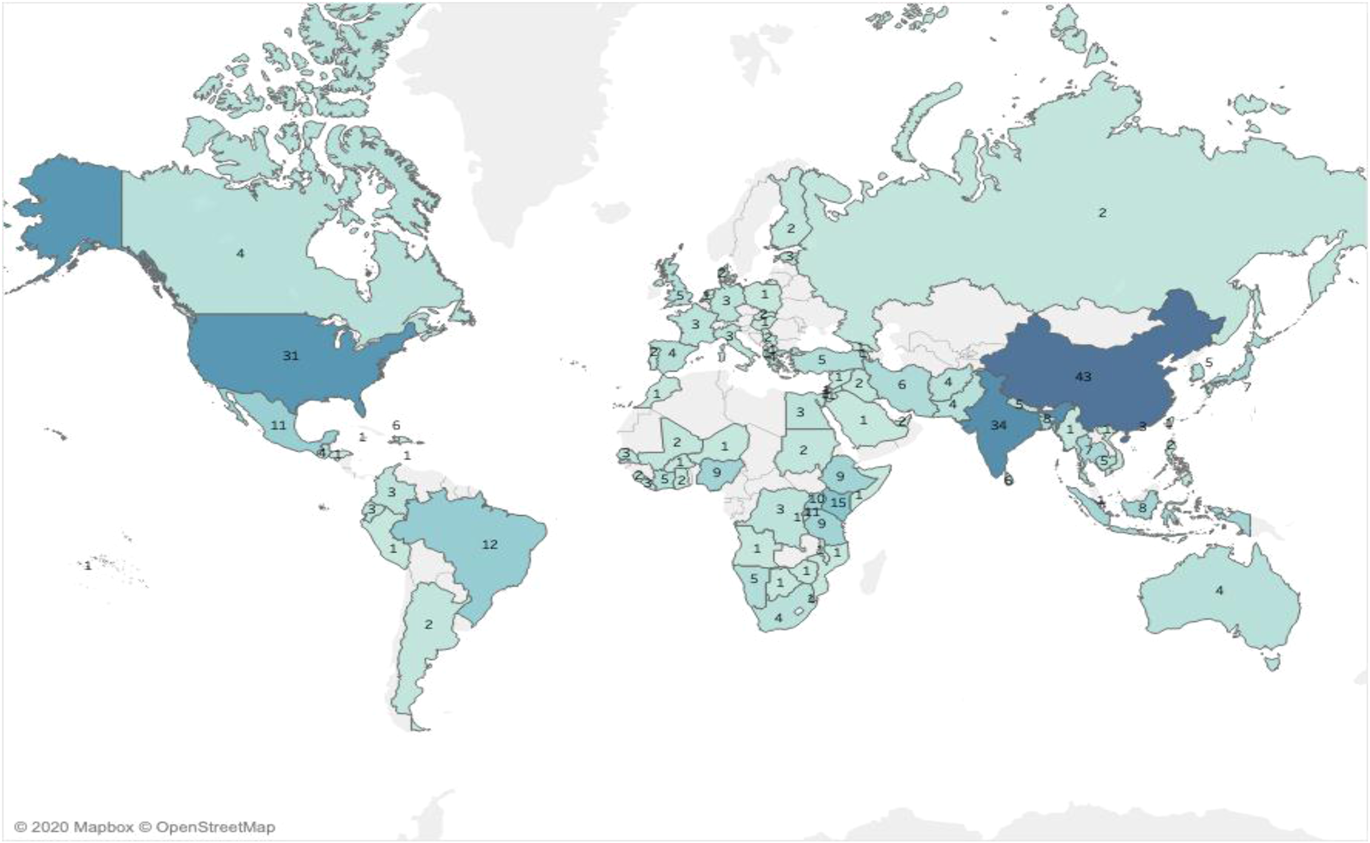
Geographical distribution of studies.
We find that most of the studies are concentrated in middle income countries. There are 232 studies (53%) in the middle income group, followed by 103 studies (24%) in the high income group and 71 studies (16%) in the low income group (Figure 5). Overall, about 69% (n = 303) of the total studies are from LMICs, but the IEs are distributed more in favour the LMICs as 83% of them (n = 40) are from LMICs. One of the notable features of the studies on the map is that about 82% (n = 359) of the total studies are published in peer-reviewed journals and the remainder are working papers (18%, n = 78).
Distribution of studies across data sources
As discussed in Section 2.1.2, big data can be generated by human interaction on social media, process-mediated data recorded by governments and the business and machine-generated data that is recorded by the automated systems. Figure 6 shows that machine-generated data are used the most. Of the total number of studies, close to 84% (n = 380) of the studies used some form of machine-generated data, while 12% (n = 53) of the studies used human-generated sources and 17% of the studies (n = 77) used process-mediated data.
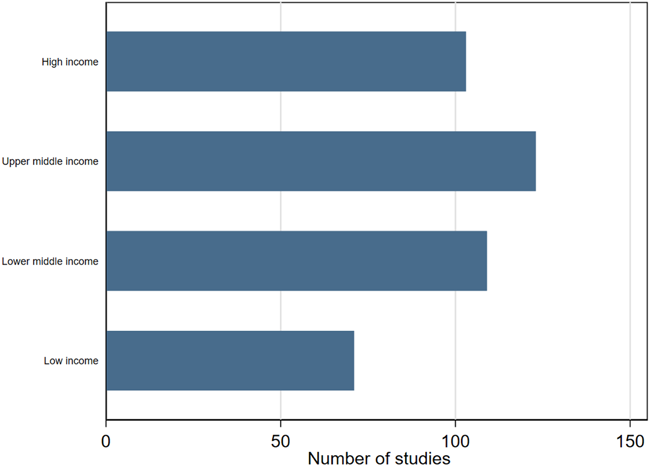
Number of studies by income classification.
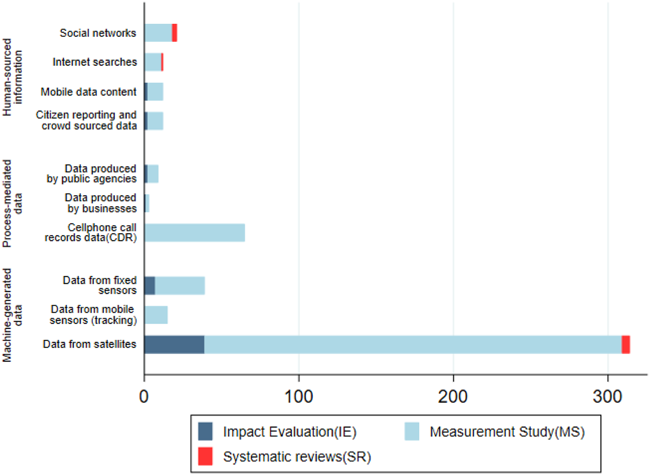
Number of studies per different type of big data.
Table 4 below provides a detailed breakdown of the number of studies per data source.
Number of IEs and measurement studies across data sources
Note: Percentage of subcategory total in parentheses. Columns do not add up due to multiple entries.
Data from satellites and fixed sensors
Satellite data are the most used source of big data as it accounts for 71% of the measurement studies (n = 210) and close to 81% of the IEs (n = 39). Data from fixed sensors (such as weather and pollution sensors, traffic sensors and electricity metres that provide high-frequency, localised measurements) could also be readily used in IEs. This is the second most used data source, with 15% of the IEs using these sources. This shows that the data from satellites and in situ sensors that help measure spatial outcomes are used most in IEs. Other big data sources have been seldom used for IEs despite measurement studies showing proof-of-concept.
Mobile phone CRD
A good number of measurement studies have used CRDs (17% n = 65) for measuring population movement, migration, disease spread and even to understand the literacy level of the subscribers. Surprisingly, we found no IEs that used this source of big data despite the availability of a good number of proof-of-concept papers in measuring key development outcomes.
Human-sourced data
Social networks including Facebook, Twitter and Wiki pages were used to measure development outcomes in 18 measurement studies. Internet searches like Google trends and other search engine queries were used in 11 studies. Mobile data content and crowdsourced data were used in 10 studies, primarily to measure disease outbreak, price data or opinion on issues like development services. This source has not been used in IEs, with two notable exceptions using crowdsourced data (Edjekumhene et al., 2019; Van der Windt & Humphreys, 2016).
Complementarity between data sources
There are about 57 studies on the map that have combined at least two sources of data and about seven of them have combined three or more sources (Table H3 in Appendix G). Data from fixed sensors and satellites data seem to complement each other well: 13 measurement studies and 2 IEs have combined these two sources. Mobile phone CRD and satellite data are the other combination that has been used repeatedly. About 10 of the measurement studies have combined CRD data and satellite data in their analysis (see Section 5 for a discussion and example on how satellite data and CRD can be combined together for better results). However, IEs seem not to have exploited this complementarity. See Table H3 in Appendix G for a list of studies using multiple sources of big data.
Distribution of studies across development themes
Section 4.2 identifies 10 broad development themes based on SDGs. Figure 7 and Table 5 show the number of studies across the development themes. About 50% of studies (n = 217) focus on environmental sustainability, which includes sustainable consumption and production, climate change, underwater life, and life on land. Economic development and livelihoods accounts for about 26% of the total studies (n = 114). Urban development and health account for 16% each (n = 68). Governance and human rights (7%, n = 30) and energy, industry and infrastructure (7%, n = 30) account for the remaining studies.
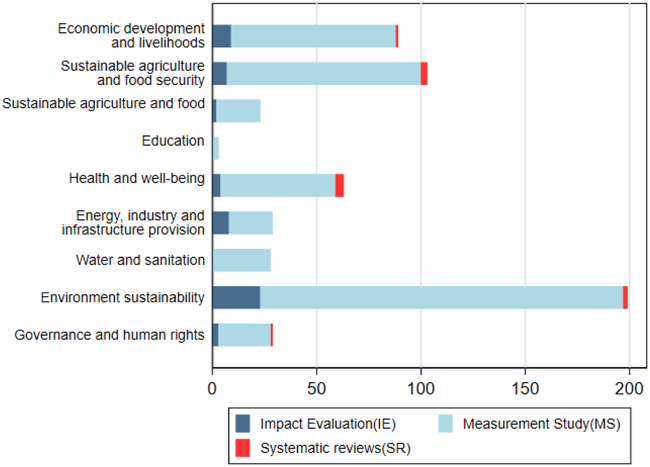
Number of studies against development outcomes.
Distribution of studies across development themes
While the distribution of IEs and measurement studies across the development themes remains the same as the overall distribution, there are a substantial number of IEs on economic development and livelihoods (17%) and energy, industry and infrastructure (17%). While most of the SRs looked at cross-sectoral themes, health is the most-studied sector (n = 5), followed by urban development (n = 3) and environment sustainability and economic development (n = 2). See Appendix F for critical appraisal of the SRs.
Units of observation
The unit of observation (or unit of analysis) is the class of elemental unit that constitutes the population and the units of measurement. Typically, in IEs, the units of observation are individuals, households, facilities (in facility surveys) or various level of administrative units such as villages, counties or districts. We have classified the unit of observation as population (including both individuals and households) or administrative units (villages, land parcels or any other units with a spatial element). The unit of observation seems to be an important element in analysing the use of big data in measuring development outcomes. Figure 8 (Panel 1) shows that about 70% of the measurement studies (n = 267) and 65% of the IEs (n = 31) have administrative units as their unit of observation. There is a clear distinction between different sources of big data, as shown in Figure 8, Panel 2. The unit of analysis for satellite data-based studies is predominantly administrative units (n = 259, 83%), while CRD-based studies are usually based on population units (n = 53, 82%). This difference shows that satellite data are more applicable when the outcome of interest has some spatial dimension such as local economic development, agricultural land productivity, forest cover or urban development.
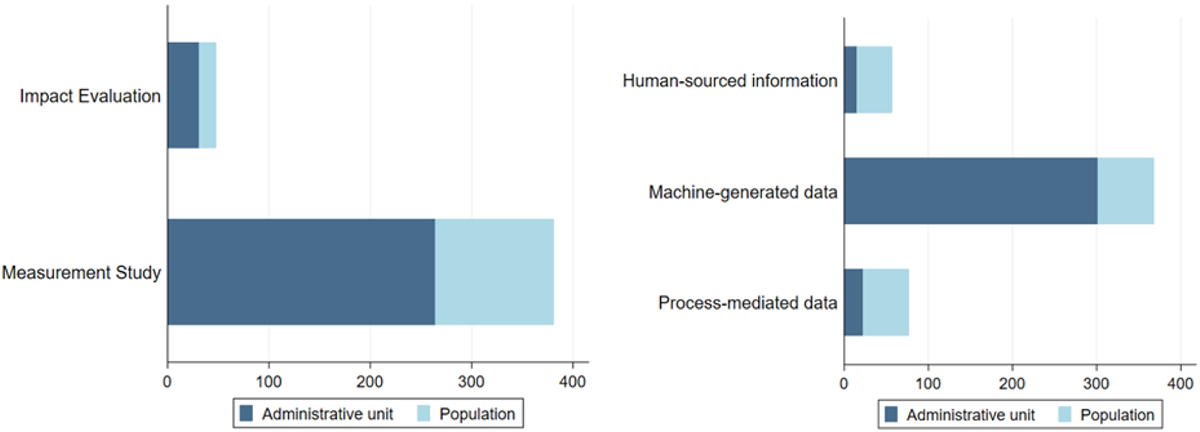
Units of observation.
Studies using mixed methods
Mixed-methods IEs that combine qualitative and quantitative analyses help assess the quality implementation and reliability of data and understand the mechanism of programme impact (Bamberger, 2012). Big data IEs can be combined with qualitative methods. However, only three IEs and five measurement studies reported using mixed methods.
Studies with a rural or urban focus
Figure 9 shows the proportion of studies focused on rural areas or urban areas, or both. Most studies looked at both rural and urban areas (74%, n = 325). About 9% of the studies (n = 41) focused on rural areas; 12% (n = 51) focused on urban areas. Among the remaining studies, 14 studies looked at conflict affected population, 4 were studies of ethnic minorities and 2 studied refugees.
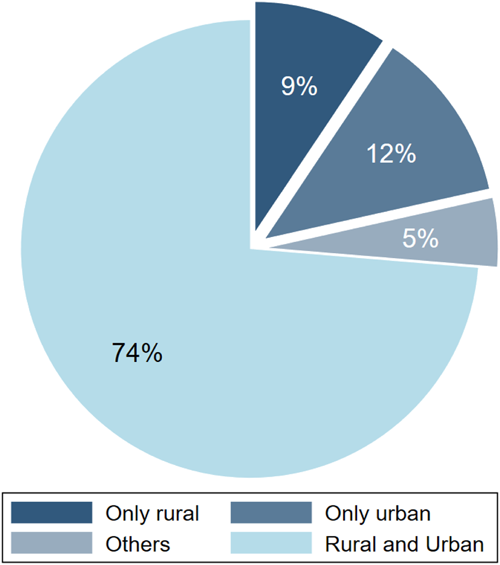
Distribution of population subgroups.
Studies by fragile context
We used the OECD definition of fragile context that includes conflict, institutional, social fragility, environmental, health and climatic risks (OECD, 2018). Figure 10 shows that 91 studies included on the map (21%) are from countries considered to be fragile. About 39 studies were conducted in a conflict or humanitarian crisis context; 22 studies each were conducted in contexts of difficult terrain and natural disasters; and 15 studies were conducted in the context of epidemics or disease outbreaks. There was one measurement study in the context of a chemical/radio-nuclear disaster. IEs follow the same pattern, except for one notable gap: there are no IEs in the context of epidemics or disease outbreaks despite a reasonably good number of measurement studies.
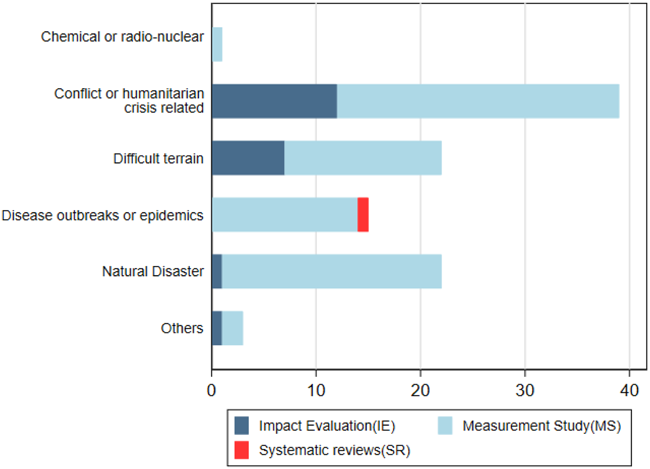
Number of studies in fragile contexts.
Table H4 in Appendix G shows that satellite data are the most used in fragile contexts, followed by CRD data and then the sensor data. The table also shows that almost all the big data sources have been used in one or two fragile contexts, indicating the importance of big data in fragile contexts.
Risk of bias in included reviews
Figure 11 shows that very few studies meet any of the following methodological quality markers. Is the construct validity explained (ie is there a discussion on how the big data-based indicator measures what the study claims to measure)? Are data and codes publicly available for replication? Are data collection methods discussed? Are there data quality issues in the dataset used and how are they addressed? Is the data representative of the population of interest? Are challenges in the analysis and reporting process discussed? Are the results generalisable? For example, are the research findings generalisable to other situations such as other platforms (data sources) or communities, or over time?
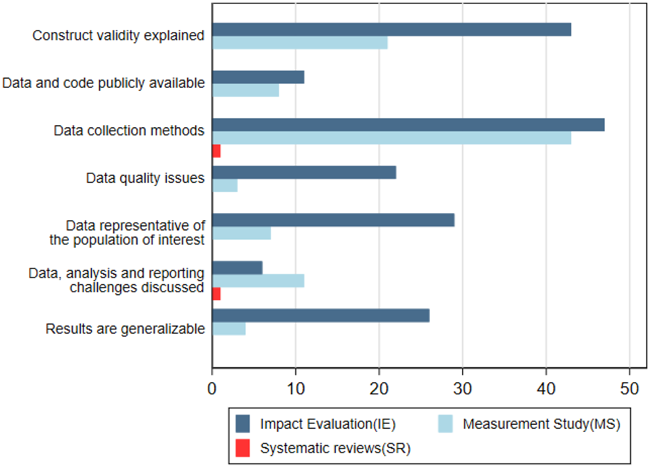
Number of IEs and MS against data quality and transparency. IE, impact evaluation.
Only 95 studies (22%) have reported on at least one of the above transparency criteria. For example, only 20% (n = 91) of the total studies reported on data collection methods, 6% (n = 25) on data quality issues, 8% (n = 36) on data representativeness, 14% (n = 64) on construct validity and 7% (n = 30) on generalisability. Only 4% (n = 19) of the studies have data and codes publicly available or available upon request.
There is, however, considerable difference between IEs and measurement studies in terms of reporting on data quality issues and transparency. Table H4 in Appendix G shows that IEs report a lot better on all these parameters. Of the total 48 IEs on the map, 46 of them report at least one aspect of transparency. Almost all the IEs report on data collection methods, 90% (n = 43) report on construct validity, 60% (n = 29) discuss representativeness of data, 54% (n = 26) discuss generalisability and 45% (n = 22) discuss various data quality issues. However, only 23% (n = 11) make data and codes available and 13% (n = 6) discuss key data analysis and reporting challenges. Figure 11 shows that very few studies meet any of the following methodological quality markers. Is the construct validity explained (ie is there a discussion on how the big data-based indicator measures what the study claims to measure)? Are data and codes publicly available for replication? Are data collection methods discussed? Are there data quality issues in the dataset used and how are they addressed? Is the data representative of the population of interest? Are challenges in the analysis and reporting process discussed? Are the results generalisable? For example, are the research findings generalisable to other situations such as other platforms (data sources) or communities, or over time?
Only 95 studies (22%) have reported on at least one of the above transparency criteria. For example, only 20% (n = 91) of the total studies reported on data collection methods, 6% (n = 25) on data quality issues, 8% (n = 36) on data representativeness, 14% (n = 64) on construct validity and 7% (n = 30) on generalisability. Only 4% (n = 19) of the studies have data and codes publicly available or available upon request.
There is, however, considerable difference between IEs and measurement studies in terms of reporting on data quality issues and transparency. Table H4 in Appendix G shows that IEs report a lot better on all these parameters. Of the total 48 IEs on the map, 46 of them report at least one aspect of transparency. Almost all the IEs report on data collection methods, 90% (n = 43) report on construct validity, 60% (n = 29) discuss representativeness of data, 54% (n = 26) discuss generalisability and 45% (n = 22) discuss various data quality issues. However, only 23% (n = 11) make data and codes available and 13% (n = 6) discuss key data analysis and reporting challenges.
DISCUSSION
Summary of main results
The use of big data in measuring development outcomes has been on the rise over the past 5 years. This rising trend is powered by the availability of (and our capacity to process) big data. In this section, we discuss the key findings, some of the notable gaps and the potential for future SRs.
There is a considerable potential for measuring various development indicators using big data
We identify a significant and growing evidence base of measurement studies that use some form of big data to measure a development outcome. Some outcomes are more amenable to the use of big data than others; environmental sustainability, economic development and livelihoods, health and well-being and urban development are where the majority of studies are concentrated. Education, sanitation, governance and human rights seem to be less responsive to big data use.
Multiple entries for most development theme indicate the potential of big data in contributing to measuring development indicators. Identifying measurement studies will be a valuable addition to development evaluators who look for innovative ways to measure a development outcome that was difficult to measure at all required spatial and temporal scales using conventional data collection methods.
There is potential for more IEs using big data on development interventions
The map contains 48 IEs. Use of big data measures in IEs as main outcomes or for controlling key covariates is fast-growing, but the IEs are fewer in number compared to measurement studies as well as in terms of the extent of their thematic and geographical coverage. IEs seem to be concentrated more around environmental sustainability, economic development and urban development. This complements existing efforts to build the evidence base in international development, as these sectors have much less rigorous evaluations (Sabet & Brown, 2018). The IEs also concentrate on using satellite data.
Satellite data are used most
The map shows that 71% of the measurement studies and 81% of the IEs used satellite data. This is also one of the sources that has been used since the early 2000s. The prominence of satellite data are primarily due to the fact that satellite images offer unique possibilities for measuring and evaluating development outcomes. Given the vast number of satellites covering almost every location on earth, it is possible to collect data at a high granularity (spatial resolution) and for multiple temporal frequencies for the past 30 years. Satellite data are freely available from several sources (such as NASA's Landsat and MODIS and the European Space Agency's Sentinel); more importantly, several preprocessed databases are available (such as AidData's Geoquery,
Yale University's G-Econ Project, the United Nations Environment Programme's Environmental Data Explorer, NASA's Socioeconomic Data and Applications Center [SEDAC], Global Forest Change 2000–2018 [Hansen et al., 2013], and several others). This preprocessed data or the image data could then be processed and converted into meaningful outcomes to measure economic activity at local level, urban development, forest cover, land productivity, distribution of the population, and so forth. These indicators can also be used for controlling for covariates.Spatial dimension matters
One of the key findings of the map is that most of the big data studies are applied in the context where the phenomenon studied has a spatial dimension, meaning the outcome and other covariates are measured on a spatial scale. Close to 70% of the studies on the map report using administrative units as their unit of measurement. This is particularly true for satellite and sensor data-based studies, as 82% have administrative units as their unit of measurement (such as local economic development, agricultural land productivity, forest cover or urban development). This is referred to as geospatial IE (BenYishay et al., 2017). However, there is considerable difference across data sources as CRD data are used to measure changes at the population level.
CRD data has great potential for measuring and evaluating development outcomes but is not yet used in IEs
CRD data are one of the most widely used sources in measurement studies. This is used for measuring population movement, migration, disease spread, and so forth. Despite a number of high-profile measurement studies, our systematic search did not find even one IE that used CRD data for rigorously evaluating a development outcome. This is a notable gap and a potential area for future exploration. It should be noted that CRD data are also fraught with multiple methodological challenges (such as nonrepresentativeness, lack of completeness, etc.) and ethical challenges (such as consent, unintended exclusion, etc.). Further, CRD data has been difficult to obtain as it is proprietary and hence it is difficult to maintain data transparency.
Other big data sources such as human-sourced and process-mediated data have good proof-of-concepts
Human-sourced data (such as social networks, internet searches, mobile data content citizen reporting or crowdsourced data) and process-mediated data (such as data produced by public agencies and by businesses) have a good number of measurement studies as proof-of-concept for using these sources to measure various development outcomes, but not many IEs use these sources. This also shows the possibility of potentially using these sources in future IEs. Similar caveats on methodological and ethical challenges discussed above in relation to CRD data will apply.
East Africa is well-represented, but not the rest of Africa
The geographical distribution of measurement studies and IEs show that the studies are evenly spread across the continents. However, Ethiopia, Kenya, Rwanda, Tanzania and Uganda are well-represented in terms of number of measurement studies and IEs, but the only non-East African country that seem to have well-represented on the map is Nigeria. There are very few studies in the rest of Africa. This gap is particularly serious given Africa's data challenges (Serajuddin et al., 2015).
Big data holds great potential for conducting IEs in fragile contexts, including during conflicts, humanitarian crises, epidemics and natural disasters
Conducting rigorous evaluation in fragile contexts (such as natural disasters, disease outbreaks and other crisis contexts) can be costly, risky to the beneficiaries and the evaluators, and in some cases outright infeasible. We identified 73 measurement studies, 17 IEs and one SR in such fragile contexts. Measurement studies are spread evenly across conflict or humanitarian crisis, disease outbreaks or epidemics, natural disasters and difficult-to-reach terrain. However, the IEs are concentrated around conflict and difficult terrain. The number of measurement studies indicate the potential for more IEs in fragile contexts.
There are potential sectors and themes where SRs will be useful
Though the number of IEs are fewer, the map highlights a few potentials thematic areas where SRs will help answer key questions on policy and research methods. For example, there is a concentration of IEs using satellite data, referred to as geospatial IEs, but we know little about how satellite data can help evaluate development programmes better, where it can add value, what type of interventions could be better evaluated and the technical challenges involved in using satellite data. An SR of all geospatial IEs that have used satellite data across the sectors will help understand the potential and challenges in using satellite data for IEs.
Similarly, there is a concentration of IEs on environmental sustainability and within that climate action and forest management. Though there a few SRs and evidence gap maps on forest management (Pelletier et al., 2016; Puri et al., 2016), a new review with reference to innovative, new data sources used in rigorously evaluating forest cover and the advantages and challenges thereof may be useful.
Using big data in IEs: Potentials and challenges
Rigorous IEs require a valid counterfactual. Randomising programme placement ensures preprogramme comparability of the treatment and control groups in most cases and quasi-experimental studies employ statistical procedures to identify a valid comparison group. In either case, evaluators collect require a vast array of data on the outcomes, covariates and other contextual factors. There is almost always a trade-off between collecting a complete array of necessary data and cost-effectiveness, and in a few cases, it may not be feasible to collect some of the covariates and confounders.
Big data, with the help of improved ML techniques and analytical capacity, can now be manipulated to evaluate development outcomes. The potential advantages for big data are, to date, most discernible in contexts where the immediacy, scale and/or reach of data are highly prized and alternative sources of data are absent or inadequate to the task. The ability to “zoom in” on particular zones of interest, and to produce estimates for small areas, is an oft-cited advantage of many types of big data (e.g., satellite and building footprint data, mobile phone CRD and signalling data and app-based location data) and one with particular relevance to evaluative contexts and SDG-related urbanisation, climate change and infrastructure. This holds particular promise for settings where census data renders small area estimation methods unsuitable. Big data has also been shown to be particularly advantageous for the analysis of disaster-induced displacement and disease outbreaks. In each of these cases, the advantage of big data is that it can support rapid appraisal and introduction or adjustment of policies/interventions on the basis of near real-time information.
In this section, we highlight a few examples from the map to show the steps involved in collecting, processing and using satellite and CRD data for measuring development outcomes. We draw on recent projects from 3ie and Flowminder to illustrate the processes.
Using satellite data in IEs
In a 3ie funded evaluation conducted by the Institute for Financial Management and Research, Pande and Sudarshan (2019) evaluated the recent environmental clearance (EC) reforms in India. Before the 2006 reform, mines of area over 25 hectares were required to hold a public hearing before approval. The new EC reform required mines of area between 5 and 25 hectares to hold a public hearing as well. This study exploits this historical discontinuity in clearance requirements to evaluate the impact of public hearings on mines' environmental compliance. Apart from rigorously evaluating the EC process in India, this study also provides a proof-of-concept for the use of remote sensing data and other publicly available data to monitor mines' environmental compliance. Using satellite data to assess the impact of EC process requires data on the timing of the intervention, the geographical scope of the intervention (ie the individual mines in this case), the outcome of interest (such as air pollution, land cover and water quality for the corresponding intervention) and control areas for the years before and after the intervention.
The following were the key steps involved in the big data IE.
There are several ways to collect the required satellite data. For a few key variables such as night lights, air pollution, land cover and water quality, elevation, slope, distance from certain services or infrastructure, geocoded data for various granularity and frequency is readily available in several databases such as Aiddata DataQuary, SEDAC, and so forth. This study has utilised data from differences sources that provide readily useable data. Alternatively, the researchers use ML techniques to analyse satellite images and predict development outcomes (Jean et al., 2016). Another useful source of areal images come from custom built drones that can provide very high resolution data for the exact spatial and temporal frequency (Pellegrini, 2019).
The researchers used the data provided by Dalhousie University on the fine particulate matter concentration as a proxy for air pollution. This database contains average annual particulate matter concentration for every 1 km cell for the study period;
They have used the Enhanced Vegetation Index (EVI) data from NASA's MODIS satellite to measure deforestation around the mining areas. EVI is available at a resolution of 250 metres for the entire globe and the researchers calculated annual maximum, median and mean EVI at mine sites. EVI data was used to measure the extend of and the date of beginning of deforestation (ie structural break in the time series) for each mine; and
Data on water quality from the site monitor nearest to each mines was collected from the Central Pollution Control Board's ENVIS database. They used Biological Oxygen Demand, a measure of organics pollution, as a proxy for water pollution.
This study, utilising web scraping to collect data on project characteristics and various sources of satellite data for measuring the outcomes of interest, is an excellent example of innovative data collection methods in a sector where the evidence base is very small (Rathinam et al., 2019b).
Using CRD analytics to inform disaster management
In this section, we briefly outline the process for undertaking CRD analytics to measure, characterise and predict population displacement and returnee/resettlement patterns in post-disaster settings. While applications of CRD data analytics to date have lacked an evaluative component, their potential in this regard is evident. We draw on a recent project at Flowminder, which revisited three sudden-onset disaster events to investigate drivers of displacements (individual and contextual) and the feasibility of predicting displacement locations from CRD data and data on disaster intensity and damage, on population density and on the humanitarian response. The three events were the 2010 earthquake in Haiti, the 2015 Gorkha earthquake in Nepal and the 2016 Hurricane Matthew in Haiti.
Flowminder has long-established partnerships with the major mobile phone network operators in Haiti and Nepal. Historically, data access has been a major barrier to the scale-up of CRD analytics for humanitarian and development applications. Mobile network operators (MNOs) are justifiably hesitant to authorise third-party access, given the need to safeguard subscribers' personal data.
Flowminder's original “data partnership” model developed lasting collaborations with individual MNOs. The priority was countries where substatial potential gains were available from novel, digital data given the existing data landscape. Lengthy negotiations with MNOs followed, often spanning many years and consuming extensive organisational resources, with no guarantee of a successful outcome. When this model “worked,” it led to strong and sustained partnerships with MNOs. In pursuit of impact at scale, Flowminder Foundation supplemented its original “data partnership” model with a toolkit-based approach designed to break down silos between data and methods, in effect negating the need for Flowminder to access MNO data by transferring methods expertise to MNOs themselves via the “Flowkit” suite of software.
Prior to analysis, MNO data underwent a long series of cleaning and preprocessing steps as part of quality assurance and to support the generation of standardised metrics. A first stage of analysis was undertaken to structure the data in a usable format and to detect data anomalies. Once data was cleaned, quality assured and converted into an analysable format, a number of preliminary processing steps were undertaken, including: Clustering of cell tower locations Assessment of each subscriber's phone usage behaviours (number of events, frequency and regularity) Determination of a predisaster “home” location.
MNO data: Preprocessing steps
Here are some commonly occurring issues in MNO data. Once identified, corrections and/or accommodations can be performed prior to and/or during the preliminary processing and analysis phases.
Item missing data (incomplete data records ie missing fields) Invalid entries for fields Duplicate records Interrupted data series' (e.g., no data for a particular time period) Inconsistent values (either in format, or definition) for keys that are used to join multiple datasets together Inconsistent entries for the “same” value (e.g., different spellings of the same place name).
Inconsistencies or errors in method used for “hashing” (a form of pseudonymisation) subscribers' IDs Inconsistent “hashing” of sender and recipient IDs for communication events (e.g., standard SMS or phone calls).
Cell locations occur outside national borders Updated cell locations are not consistent with previous cell locations Small deviations in updated cell locations, possibly due to inexact global positioning system measurements Data, projection and coordinate system information are often missing in coverage datasets Inconsistent output formats For best server or cell-in-isolation maps, polygons should be labelled in a manner consistent with cell table and/or CRD dataset.
Individual cell towers have significantly more/less traffic than normal Overall network traffic is significantly higher/lower than expected Traffic from a particular region is significantly higher/lower than expected.
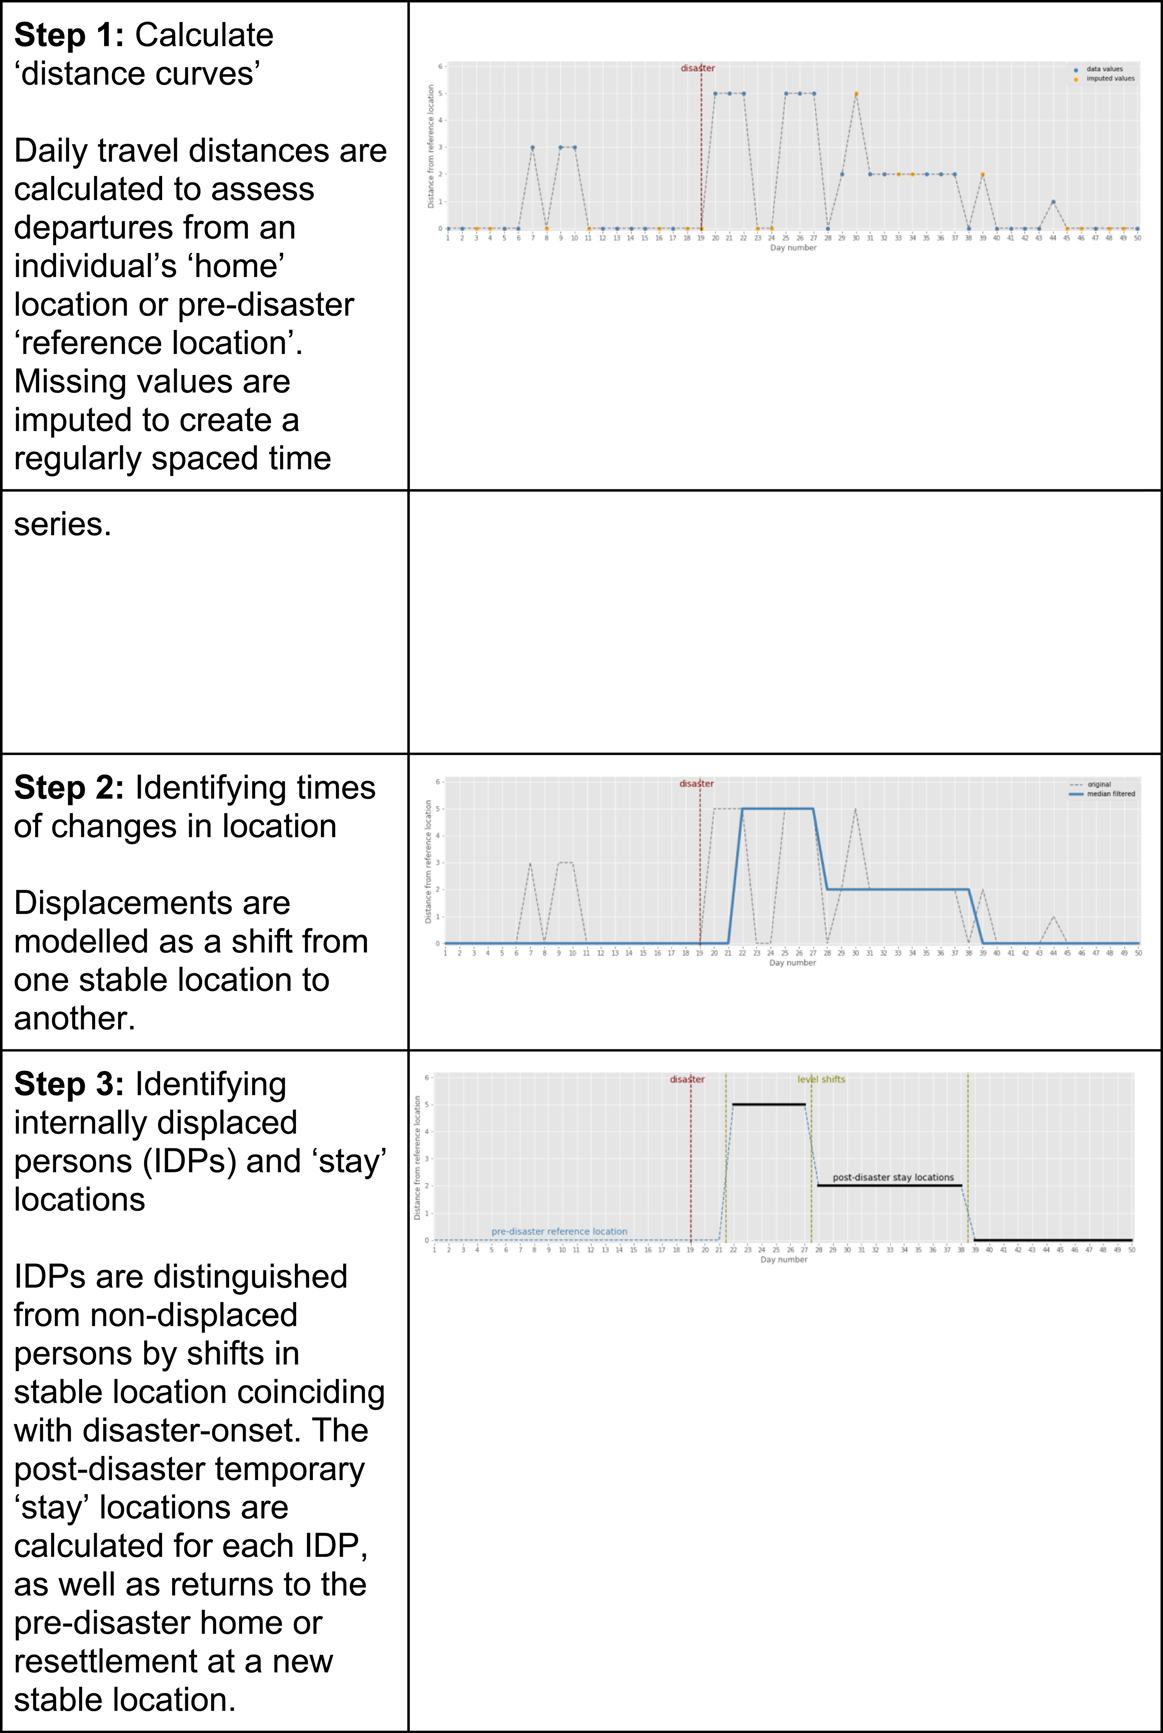
The processing steps undertaken to discern at individual level disaster-induced displacements from pseudonymised, time series CRD data are presented below in Figure 13.
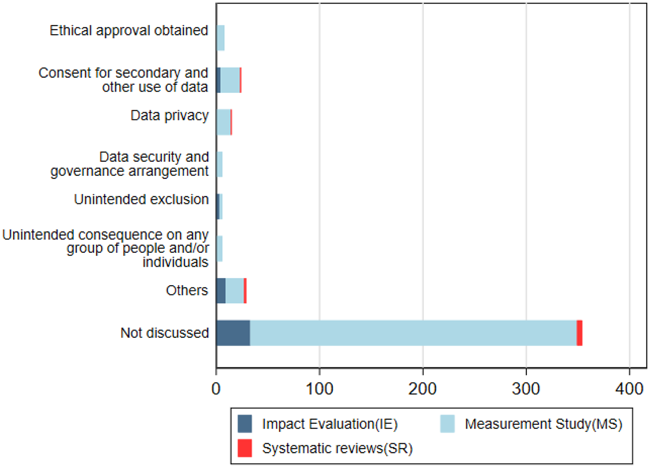
Number of studies reporting on ethics issues
Steps in CRD processing for displacement and return/resettlement/recovery pattern analysis. CRD, call record detail
The analysis disclosed striking commonalities in internally displaced person (IDP) return/resettlement rates, with the fraction of IDPs who remain displaced exhibiting a common rate of decay across all three post-disaster settings studied.
In a further step, the team developed new mobility and social network metrics to permit analysis of the relationships between contextual and individual variables and displacement duration, distance and trajectories, controlling for the severity of impacts and humanitarian response. The results suggest that the dispersal of an individual's social contacts and travel history predisaster are highly predictive of their post-disaster displacement trajectories. Individuals with localised travel patterns and social contacts were more likely to be displaced in the vicinity of their usual residence compared with those with more dispersed travel patterns and social contacts. A majority of IDPs remained within a 10 km radius of their usual place of residence. Across the three disasters, 60–70% of long-distance displacements (in excess of 100 km) involved travel to a familiar location and/or proximate to one or more contacts discernible in the predisaster CRD data. This pattern holds controlling for the severity of impacts at local area level and is consistent across all three disasters.
Results were validated via comparisons with reports retrospectively quantifying population displacements produced by the International Organisation for Migration, as well as with reference to data on the intensity of each disaster's impact on affected areas. The results indicate that CRD data analysis can be used to predict the estimated number and spatial distribution of IDPs at different time points based on initial estimates of the number of persons displaced in the immediate wake of a disaster, as well as to predict recovery/resettlement timelines. This has important implications for post-disaster humanitarian response and resettlement efforts. The same methods can support disaster resilience assessments and planning and provide a means to compare recovery and resettlement rates across different disaster events.
Areas of major gaps in the evidence
Satellite data also presents misclassification problems
Researchers, however, point to several technical challenges in using satellite images that may provide misleading conclusions. For example, Jain (2020) argues for the need for ground validation of satellite data as sometime the images could be misclassified (e.g., flood irrigation may be classified as flooded area); often this misclassification is systematic (ie forest cover is almost always misclassified as agriculture, which will bias the study results). This can be rectified with a field visit. Further, there could be differences in the data coming from different satellites and from the same satellite constellation but using different sensors (e.g., Normalised Difference Vegetation Index varies for different satellite sources and for same satellites across different versions, such as Landsat 5 and Landsat 8). Another example of what qualitative field visits could contribute to improving the interpretability of satellite data are the indicator “quality of roof construction” as a proxy for economic development. Straw roofs from satellite images are generally classified as low-quality; zinc and other hard roofs are classified as a sign of development. However, several factors may bias this classification: in hot climates, straw roofs may be preferred for their ability to keep cool compared to other hard roofs; poor families may have received donations of high-quality roofs; or lack of tenured security may discourage people invest in immoveable roof-tops despite increase in income.
Data quality and transparency is paramount
The map also points to the need to set standards for better reporting, as about 87% of the measurement studies did not report on data quality issues, representativeness, construct validity and generalisability. This would lead to questioning the internal and external validity of the findings. There is also a need to set standards for data transparency, taking into consideration the challenges in sharing proprietary data, data storing and the capacity of the Dataverse (see Box 1 for more details on data transparency).
Transparency in data analysis, use and sharing
In recent times, the use of big data for in-depth comprehension of developments in the social sector has gained traction. Transparency refers to publishing all relevant materials, including data and code, used in a research study in the public domain for independent verification. Transparency in research encompasses a number of elements that are no different while using big data as opposed to traditional data sources. Certain challenges that might arise are discussed below.
Deidentification: Deidentification is related to preserving the identity of the study subject before it is made available for any sort of analysis. A few concepts used in de-identification of big data are K-anonymity, L-diversity and T-closeness. A dataset is said to have K-anonymity if each person in the dataset cannot be identified by information of the other K-1 individuals in the dataset. In contrast, L-diversity is a group-based anonymisation technique that reduces the granularity in the dataset. T-closeness is a refinement of L-diversity and is used to decrease granularity over and above L-diversity. However, there are several examples of combining different source to re-identify the respondents in the data set (Archie et al., 2018). Scale and storage: In today's world, storage of a high volume of data are not a challenge owing to developments in cloud computing. A fairly new system that provides solution to the scalability and storage issue is storage virtualisation. In simple terms, this is a network of storage devices that are combined to create a single storage space. A few ways of safeguarding the data storage is encrypting all processes and the usage of hybrid clouds. Data repositories such as Harvard dataverse and figshare have limited capacity to handle big data and are often restricted by the size of the data uploaded. Cloud storages such AWS and other similar such storage will be a better option.
Ethical concerns are substantial
Ethical challenges such as consent, data privacy, data security and unintended exclusion are well documented in the literature (Lokanathan et al., 2017; York & Bamberger, 2020). A brief analysis of the studies on the map shows that very few studies report on any of these ethical challenges. However, the challenges are different for different sources of big data. For example, satellite data that involves little human interaction may not need an IRB review but most other big data source that use human-generated data without explicit consent for secondary use should be reviewed by IRBs. We also recommend more mixed-method big data evaluations to mitigate the potential disconnect between development stakeholders and big data researchers. Any mixed-method research needs to be reviewed by IRBs.
The map shows that most IEs have done well on reporting data quality issues but not on ethical issues. Since big data involves ethical issues (such as consent for secondary data use and unintended exclusion) that are new to conventional ethical standards, there is a need to update the current ethical standards practice to include big data use as well.
Big data may be growing in use and popularity, but the need for independent auxiliary data for “ground-truthing” remain
Many sources of big data are partial in terms of coverage and prone to biases that are difficult to measure, control and correct for in the absence of secondary data. Despite growing awareness and acknowledgement of its limitations, the household sample survey remains the dominant source of development policymaking. Big data often require survey data as “ground-truth” data to validate the findings. Demographic Health Surveys and Living Standards Measurement Studies are the two main surveys used in ground-truthing. There is considerable scope for merging the income and expenditure surveys, and food surveys conducted in several developing countries with big data to assess food shortages, poverty hotspots, and so forth.
Some capacity constraints are acute
Development organisations need to build staff capacity in order to use big data as a strategic asset (Perera Gomez & Lokanathan, 2017). They need to build multidisciplinary teams consisting of data experts and subject matter professionals, and also compete with the private sector to recruit the staff. Other major costs involve scaling up the technical infrastructure to enable data storage and processing on a large scale and data accessibility costs. The latter can be more difficult to predict considering that big data sources that are currently public may involve licensing in the future. Besides, ensuring the sustainability of data can be a cause of concern. As suggested by Hammer et al. (2017), as most of the big data is produced as a by-product by the private sector, continuity of data provision cannot be guaranteed in this age of evolving technology and market conditions. These concerns will call the wisdom of committing resources upfront to build capacity into question.
Need for better coordination between data scientists and evaluators
Big data analysts and evaluators use different framework and analytical tools. In particular, the big data measurement studies look for hidden patterns in the data with little support from theory and aim at prediction rather than causality (York & Bamberger, 2020). Further, the expertise needed to analyse big data remains largely localised and siloed. Outside of a small and highly specialised group of data scientists, there is uncertainty about how best to carry out large-scale big data analysis. The degree of technical specialisation combined with strict access restrictions to many types of big data has hindered big data applications in development evaluation. Hence, there is a need to promote interaction between development evaluators and data scientists for better cross-learning and adoption of big data in measuring and evaluating development outcomes.
The cost of collecting, analysing, storing and reporting big data is largely unknown
There is very little publicly available information on the cost of collecting, analysing and reporting big data. Blumenstock et al. (2015) reported that the phone survey for ground-truthing the CRD data costed USD 12,000 and took 4 weeks to administer. This is, however, only the variable cost of data collection in this study. There are multiple hidden costs such as staff costs and the cost of the necessary computing infrastructure (including storage); in addition, the opportunity cost of time involved in developing partnerships with data providers in some cases is not known. BenYishay et al. (2017) report that the cost of geospatial IE is around USD 150,000. One of the 3ie funded studies using satellite data are reported to have spent USD 3300 on data collection, which is about 1% of the total study budget, but have spent USD 103,864 on data analysis and reporting (about 32% of the total cost
It should be noted that the cost discussed here includes only the variable cost of data collection and the staff time, but may not include the cost of fixed infrastructure and equipment.
Evaluation of potential methodological issues
While big data can help resolve many data related challenges, there are considerable methodological, analytical, logistical and ethical challenges in the way of using it in measuring development outcomes (Letouzé, 2016; Lokanathan et al., 2017; Olteanu et al., 2019; Salganik, 2017). This section briefly discusses some of the prominent methodological challenges. As big data is varied in type, quality and composition, we also discuss if the challenges are specific to any particular type of big data.
We have grouped all the big data challenges that may affect measuring development outcomes credibly and lead to questionable internal and external validity of the studies.
Nonrepresentativeness of data and selection bias
Big data may unintentionally exclude certain sections of the population or marginalised communities, thereby making the sample unrepresentative of the population being analysed. Large samples do not solve this systematic bias. This, however, is not a challenge when using satellite data that has universal coverage but, with human-generated and CRD data, nonrepresentativeness is a serious challenge. Human-generated data such as Twitter, Facebook or web searches, as well as mobile phone use that generate CRD data, are not representative as the usage is limited by income, education, infrastructure, and so forth. However, clarity on what is the sample frame (ie who is included and who is excluded) will help interpret big data results appropriately. Nonrepresentative sample is still useful for within-sample comparisons, but may lead to erroneous out-of-sample generalisations (Olteanu et al., 2019; Salganik, 2017).
Construct validity
Construct validity is whether the proposed measure actually measures what it claims to be measuring. This becomes important when the construct is unobservable and has to be operationalised via some observed attributes (Olteanu et al., 2019). For example, does night light data truly reflect local GDP and other development outcomes such as health and education? What is it in the CRD data that reflects people's income or employment status? In many cases, the big data-based measures may not be straightforward, and it is good practice to clearly state construct validity and provide necessary support to back the claim in the papers. Development measures based on social media are particularly challenging due to different communication styles, special usage of terms and differences in language proficiency.
Data quality issues
Comparability of data over time: Since most of these data are collected routinely as a part of business, the nature and quality of data may change with the technology and business requirements. This may happen because the underlying technology has changed or because the people who use it have changed. For example, satellite data are not readily comparable across the years as there is a vast quality difference (Jain, 2020); good flu trends based on online searches peaked comparing to officially reported data when the underlying Google algorithm started prompting people to query more and broke the relationship between Google searches and flu prevalence (Archie et al., 2018).
Lack of completeness: Most big data is a by-product of peoples' everyday action and/or result of system logs of the government and businesses. It may not contain all the necessary information, such as demographic characteristics. However, combining multiple sources of data, especially big data and administrative data, can help resolve this problem (Salganik, 2017).
Generalisability
Generalisability or external validity refers to the applicability of the findings of a study to population or context other than it was produced. In the context of big data, generalisability would mean the applicability of the model to a setting different from the setting of the data that the model was trained on. For example, a model trained on satellite data from a specific geographical region may not be generalised (Head et al., 2017; Jean et al., 2016). It is good practice for studies to report on the representativeness of training data.
Data transparency
Transparency in this context refers to publishing all relevant materials, including the data and code, used in a study in the public domain for independent verification. Sharing of raw data in the public domain is often crucial for establishing confidence and reliability in the results. There are two challenges here: first, some of the major sources of big data (such as CRD) are proprietary and sharing may not be permitted beyond the closed group of researchers; and second, the data has to be de-identified before it can be shared and it is crucial to check whether there are variables or a combination of variables that can be used to reidentify research subjects.
We assessed whether the studies included in the systematic map asked the following questions: Is the data representative of the population of interest? Is the construct validity explained (ie is there a discussion on how the big data-based indicator measures what the study claims to measure)? Are there data quality issues in the dataset used and how are they addressed? Are the results generalisable? For example, are the research findings generalisable to other situations, such as other platforms (data source) or communities, or over time? Are data and codes publicly available for replication?
Evaluating reporting on privacy and ethical considerations
There are concerns over data access, privacy, consent and ethics in using big data. Although these are foundational issues for both small and big data studies, the challenges posed by big data have greater repercussions.
When using big data sources such as mobile data, most mobile operators have “inform and consent” policies that mandate disclosure of all relevant information to potential participants who can then evaluate this information and give explicit permission. However, these policies often contain legal language that is generally not discernible, and it is not clear if explicit consent is obtained to repurpose the data. This kind of informed consent may be completely absent in research leveraging social media data due to the impracticality of obtaining consent from millions of users.
Mobile phone user data and social media data are some of the most used sources of big data that can inform researchers about individuals' behaviour. Even if the data are de-identified, concerns still remain over the consent and ethics of sharing such data with researchers. It is thus imperative to have an ethics approval process in place that lays down the conditions under which such research can take place. There is a need for clear ethical standards for big data research and studies should be monitored by the IRBs.
Another ethical criterion when using big data can be concerned with the assessment of risks, the most common being privacy breaches leading to identity theft or other cybersecurity risks. The possibility of the reidentification of any individual user from poorly anonymised datasets adds to the concerns over anonymity of subjects. When combined with other sources, such datasets can be used to gain detailed insights about people without their knowledge. Such precise inferences may create the capacity for discrimination or mass manipulation. Sometimes data obtained for one purpose in social data research is used for secondary analyses, but the associated risks may not be well understood. For example, Facebook data in the past has been used for ad targeting, as well as for tailoring propaganda (Horowitz et al., 2018).
Big data may also inadvertently exclude certain sections of the population. For example, this bias can be observed in the case of “Street bump,” a mobile app that notifies the Boston City Hall whenever the user hits a bump on the road (Carrera et al., 2013). The data includes information only from the app users who often use both their cars and the app; this might inadvertently exclude poorer parts of the city that app users may not frequent. Policy based on such big data sources may have unintended consequences for the people who are excluded.
We assessed the studies on the following: Ethical approval obtained Consent for secondary and other use of data discussed explicitly Discussions on data privacy Discussions on data security and governance arrangement Discussion of any potential unintended exclusion Discussion of potential unintended consequences for any group of people or individuals.
Reporting on privacy and ethical challenges
Figure 12 shows that most studies (81%) do not report on ethical challenges and privacy issues. Of the few that do discuss such challenges, the most frequently discussed issue is consent for data use.
Limitations of the systematic map
This map covers large thematic areas and outcomes corresponding to SDGs. Given the wide scope of the outcomes, the evidence is sparse and bunched around a few themes. The thematic gaps here may not be read as actual gaps, but these areas may be not readily relevant to using big data. This map rather shows what evidence or proof-of-concepts are available to measure and evaluate development outcomes using big data.
This map followed a systematic process of searching, screening and coding of studies based on a predefined set of criteria in the study protocol developed with inputs from key stakeholders. However, despite best efforts in searching and screening the studies, given the wide scope of big data sources and their application across all developmental themes and the pace at which the literature is growing, it is possible that some relevant studies (especially measurement studies) could have been missed out.
It was beyond the scope of the study to provide a critical quality appraisal of the IEs or the measurement studies, given the large number of studies included on the map; nor did the report look at the details of ML methods used in the included studies.
Given the wide scope of development applications, it was not possible to code the studies for all subclassifications. Though the submaps (especially for economic development and livelihoods, health and well-being and urban development) provided coding at level 2 indicators, it was not possible to provide granular analysis of development themes corresponding to SDG indicators at level 3. Future systematic maps should aim to produce more granular classifications on the use of big data at the indicator level.
Some studies have used ML techniques for treatment effect heterogeneity in RCTs (Chernozhukov et al., 2019). However, it was beyond the scope of this report to include the role of big data analytical methods in conventional IE designs such as RCT and other quasi-experimental designs. This is a nascent but growing body literature and could be considered for inclusion in future maps.
Several studies suggest that the key advantages of big data sources (especially satellite data) are their long-term availability which will help evaluate the long-term impact of development interventions. The possibility of collecting a vast array of information on several contextual factors using big data can help evaluate complex interventions (Bamberger, 2016). However, this map did not code the studies for long-term impact or for complex interventions. Future maps may code and analyse the role of big data in measuring long-term impact and in evaluating complex interventions.
Stakeholder engagement throughout the systemaic map process
The stakeholders in this systematic map included an advisory group comprised of sector experts, FCDO staff, CEDIL staff. All stakeholders were engaged in reviewing drafts and final reports associated with the map. The protocol for the map was developed with inputs from the advisory board, and FCDO and CEDIL staff. The advisory board played a key role in steering the search strategy and building the list of key words.
AUTHORS' CONCLUSIONS
Big data has great potential to help address questions of relevance to international development, including for evaluating the effects of interventions. This systematic map compiles IEs, SRs and measurement studies that incorporate big data to highlight how this innovative, new data source is being used to evaluate development outcomes and (more importantly) where there is more potential to use big data in the future evaluations. We found 437 studies, of which 48 are IEs, 381 are measurement studies and 8 are SRs. Roughly half the studies are from Asia and another 30% are from Africa; about 70% are from LMICs. Of the 48 IEs, 8 are RCTs and the remaining are quasi-experimental studies.
Our results highlight considerable potential for using big data for measuring various development outcomes across SDG themes, but big data is more relevant to environmental sustainability, economic development and livelihoods, health and well-being and urban development. This map also highlights that big data can contribute to the evidence base in development sectors where evaluations are not generally feasible due to a lack of data, particularly due to fragile contexts.
One of the key “absolute gaps” the map has identified is that the number of IEs is lower in comparison to measurement studies. Given the fast-growing availability of big data and improving computation capacity, there is great potential for using big data in future IEs. This may not, however, be straightforward as there are several analytical, ethical and logistical challenges that may hinder the use of big data in evaluations. The development community that helps set standards and best practices and development stakeholders (including donors who facilitate rigorous evaluations and learning) have a strong role to play in facilitating this process. The report highlights the need for setting standards for better reporting on data quality issues, representativeness, construct validity and generalisability, as well as the need for data transparency and sharing. The report also calls for facilitating better interaction between big data analysts, remote sensing scientists and evaluators.
One of the key findings of the report is that satellite and sensor data are the most used data sources for both measurements studies and IEs. There are several sources of preprocessed satellite data that could be used directly in evaluations without the evaluators having to process them using complex ML models themselves. Satellite data seems to be particularly useful in the context where the development interventions and the outcomes studied have spatial dimension economic activity at the local level, urban development, forest cover, land productivity and distribution of the population, or where the outcome and other covariates are measured on a spatial scale (ie villages, counties, districts, plots or protected areas). CRD data, on the other hand, despite being used widely in measurement studies, is not yet used in IEs. The data deficiency in international development is partly due to fragile contexts such as diseases spread, violence, natural calamities and difficult terrain. This map highlights the potential of big data in fragile contexts: one-quarter of the studies were conducted in such a context.
For evaluators and researchers, the report calls for better reporting on data quality, ethics and transparency. There is also an absolute gap in using mixed methods jointly with big data and cost-effectiveness. For the donors, this report calls for more efforts on setting up best practices and ethical standards and in facilitating more interaction among remote sensing scientists, big data analysts and development evaluators.
Implications for research, practice and/or policy
Reliable data are paramount to evaluating development outcomes and future resource allocation. This systematic map compiles the IEs, SRs and measurement studies to highlight how innovative, new data sources are being used in evaluating development outcomes, and more importantly where there is more potential to use big data in the future evaluations. This map shows that big data can contribute to evidence base in development sectors where evaluations are not generally feasible due data deficiency. Given the fast growing availability of big data and improving computation capacity, there is a great potential for using big data in the future IEs. There are several sources of preprocessed satellite data that could be used in evaluations directly without the evaluators having to process them using complex ML models themselves There is also an absolute gap in using mixed methods jointly with big data and cost effectiveness. This should be prioritised by donors and researchers as a mix of quantitative big data analysis and qualitative field level analysis will help strengthen the validity of the results. More efforts, on the donors' end, is required to set up best practices and ethical standards, and facilitating more interaction among remote sensing scientist, big data analysts and development evaluators.
Footnotes
ACKNOWLEDGEMENTS
The authors would like to thank Sriganesh Lokanathan, Ariel BenYishay, Neeta Goel, Marshall Burke, Marie Gaarder for their valuable inputs. The authors will also like to thank John Eyers, members of the CEDIL quality assurance team for their feedback. FCDO and CEDIL provided funding for this systematic map and report.
CONTRIBUTIONS OF AUTHORS
Content: Francis Rathinam, Samantha Watson, Sebastian Vollenweider, Zeba Siddiqui, Manya Mallik, Pallavi Duggal, and Sayak Khatua. Map methods: Francis Rathinam. Statistical analysis: Sayak Khatua and Francis Rathinam. Information retrieval: Zeba Siddiqui, Manya Mallik, Pallavi Duggal, and Sayak Khatua.
DECLARATIONS OF INTEREST
The authors declare no conflict of interest.