






Abstract
Policymakers have little time left to prevent the worst impacts of climate change and limit global warming to well below two degrees. However, a systematic assessment of the available scientific evidence—that is up to date—is not always available to understand what climate policies work, to what extent, in what context, why, and for whom. This is also true for demand-side policies, including those that use behavioral change to reduce energy demand and the related carbon emissions. There is an ever-burgeoning literature on policy interventions that target behavioral change among households, with new insights and evidence of their efficacy in different contexts. This living systematic review (LSR) and network meta-analysis (NMA) synthesizes this evidence to provide timely, rigorous and up-to-date insights on this topic. Our LSR and NMA integrate the evidence available from multiple disciplines to answer the following questions: (1) to what extent can information, behavioral (including feedback, social comparison and motivation), and monetary based interventions reduce energy consumption of households; (2) what the relative effectiveness of interventions is; and (3) how effective are the combinations of different interventions. In doing so, we also pilot an LSR for climate policy solutions and share learnings with the community. To fulfill these objectives, we searched the academic and gray literature for experimental and quasi-experimental studies that quantitatively assessed the impact of either behavioral, monetary, or information interventions (or a combination of these) on energy consumption (including electricity and heat) of the households in residential buildings. We searched the relevant databases: Web of Science Core Collections Citation Indexes, Scopus, JSTOR, RePec, Google Scholar, and gray literature repository Policy Commons to retrieve over 109,000 potentially relevant article abstracts and apply machine learning algorithms to identify the most likely relevant papers. Note that with this update, that includes the relevant literature published till end of December 2024, we added roughly 53,000 potentially relevant documents to the previously existing pool of potentially relevant literature from Khanna et al. (2021). A team of four reviewers screened the titles and abstracts of studies identified as being potentially relevant by the machine learning algorithm, with full-text assessments and double-coded data collection following for a set of included studies. The effect sizes reported by different studies were harmonized to Cohen's d for synthesis. We used a multilevel random effects model and NMA for calculating the average intervention effect. We adjust our estimates for possible small-study effects (publication bias). The NMA allows us to visualize the relative efficacy of the interventions through rankograms and cumulative ranking probability plots. Unlike previous meta-analyses in this field of research, this study also implements a comprehensive risk of bias criteria for assessing the quality of each study using a modified version of the framework recommended by the Center for Environmental Evidence. We identified 213 relevant studies and conducted meta-analyses on 192 studies that provide quantitative estimates of the relationship between behavioral, monetary, and information incentives and reduction in energy consumption of households. The studies together represent evidence from 40 countries and 6,528,923 households (average total sample size of 33,216). The studies were of varying quality, with the presence of methodological weaknesses across the included studies. We find an overall average effect size of Cohen's d = 0.22 or 0.13 after adjusting for potential small-study bias across. Such an effect corresponds to approximately a 4%–6% reduction in energy consumption. Monetary incentives have the largest average effect, followed by some behavioral (motivation) and information interventions. Combining interventions can also increase effectiveness; for example, combining information, social, and behavioral (motivation) interventions has high average effects. Our analysis finds that behavioral, monetary and information interventions taken together on average have a small-moderate effect on energy consumption of households. Some intervention combinations yield substantially larger impacts—especially when considered at scale. However, the practical consequences of the average effect sizes reported in this review depend on at least three factors: how often a person makes decisions that could be influenced by the interventions under investigation, the scalability and cost of interventions, and the welfare consequences of the interventions. The fast-growing literature on behavioral, information, and monetary interventions in household energy consumption makes this field a fitting case study for a “living” review assessment. Of the 663 effect sizes used for synthesis, about half come from studies produced after 2020 that were not included in previous reviews on the topic. However, there are significant challenges with consistently updating a review, most importantly, in terms of maintaining consistency in the identification and coding of studies, given resource constraints and changing personnel. Applying machine learning algorithms during abstract-level document screening helped us significantly reduce the manual effort involved in identifying the relevant literature.
Plain Language Summary
Optimized policy interventions can effectively lower household energy demand.
The Review in Brief
This living systematic review (LSR) and network meta-analysis (NMA) provides evidence on the efficacy of information, behavior, and monetary interventions in reducing household energy consumption. Monetary interventions seem to be more effective than other interventions. Optimal policy packages where interventions are paired with other interventions can increase overall effectiveness.
What Is This Review About?
This review demonstrates how scientific evidence on the effectiveness of one set of policy interventions, namely interventions in household energy demand, can be kept up to date to deliver rigorous, solution-oriented knowledge to policymakers to meet their needs. The policy interventions studied in this review include monetary incentives that offer households a tangible financial reward for reducing energy consumption, behavioral interventions like nudging, appealing to norms, motivation techniques, and providing easily interpretable information at the point of decision-making, as well as improving skills required to perform or forego behaviors. This review assesses the extent to which such policy interventions can reduce household energy consumption.
What Is the Aim of This Review?
We sought to answer three questions: By how much can information, nudges, and cash rewards reduce household energy use on average? Which of these three approaches works best? Do combinations of them deliver even bigger savings?
What Are the Main Findings of This Review?
The evidence suggests that behavioral, monetary and information interventions can cut energy consumption in households by 4%–6%, though some interventions or combinations of interventions have larger impacts. Because study quality varies, there is a need to incorporate study quality metrics while deriving policy implications of studies in this field.
What Do the Findings of This Review Mean?
The effectiveness of interventions aimed at reducing household energy consumption is shaped by several factors, including the frequency of relevant decisions, the scalability and cost of interventions, and their broader welfare implications. Ultimately, a well-calibrated approach driven by evidence that accounts for study quality, intervention combinations, and policy feasibility is necessary to maximize the impact of household energy interventions.
Background
The Problem, Condition, or Issue
Policymakers only have little time left to prevent the worst impacts of climate change and limit global warming to well below two degrees (IPCC 2022, 2023). Assessments by the Intergovernmental Panel on Climate Change (IPCC) have provided evidence about the extent of climate change and possible pathways for mitigation (IPCC 2023). However, rigorous solution-oriented knowledge of how to facilitate those pathways is missing (Berrang-Ford et al. 2020; Minx et al. 2017). In particular, a systematic assessment of scientific evidence on what climate policies work, to what extent, in what context, why, and for whom is not available (Berrang-Ford et al. 2020). This LSR and NMA demonstrate how scientific evidence on the effectiveness of a particular set of policy interventions, namely behavioral, information, and monetary interventions in household energy demand, can be kept up-to-date to deliver timely, rigorous, and solution-oriented knowledge to policymakers.
Finding low-energy-demand pathways is necessary to hedge against the risks involved in decarbonizing energy supply and is key to finding socially acceptable ways of meeting the Paris climate goals (Creutzig et al. 2022; Grubler et al. 2018; Van Vuuren et al. 2018). There has been a surge in interest in using demand-side policies, particularly aimed at behavioral change, for reducing energy demand and the related emissions. To reduce the energy demand of households, primary studies have experimented with using monetary incentives, behavioral interventions including nudging, appealing to norms, information incentives like providing easily interpretable and credible information at the point of decision-making, and so forth. The relevant literature is spread across various disciplinary fields: economics, psychology, power systems, and engineering studies. This LSR and NMA integrates the evidence available from all these sources to compare the effectiveness of different types of interventions (sometimes deployed simultaneously) and to understand what drives the variation in outcomes across studies.
The Intervention
We reviewed the literature on interventions in residential energy demand to reduce energy usage. These interventions include monetary incentives that offer households a tangible financial reward for reducing energy consumption, behavioral interventions like nudging, appealing to norms, information interventions that provide easily interpretable and credible information at the point of decision-making, as well as improving skills required to perform or forego behaviors. In this review, we broadly classify the interventions into three categories: monetary, behavioral, and information. The more detailed typology in Table 1 further breaks behavioral interventions into feedback, social comparison, and motivation interventions. This classification of interventions into five categories is then used for analysis in the subsequent sections. This typology is consistent with those used by previous reviews on energy consumption in households (Buckley 2020; Delmas et al. 2013; Khanna et al. 2021). This classification has been adopted across a series of reviews and meta-analyses that form an “ecosystem of reviews” that evaluates interventions in households' consumption choices in food, transport, and buildings. This series of coordinated systematic reviews explores the effectiveness of demand-side interventions to induce behavioral change in key GHG emissions sectors, including food (Lohmann et al. 2024), transport (Javaid et al. 2022), and buildings (Khanna et al. 2021).
Detailed typology of interventions.
How the Intervention Might Work
There is a rich theoretical literature on possible pathways that drive reduction in household energy consumption in response to monetary, information, or behavior-based interventions.
Information measures reduce energy consumption by reducing information gaps, decreasing the costs of acquiring information about energy-saving measures, improving skills required to perform or forego behaviors, and appealing to intrinsic motivations. These interventions may take the form of general energy campaigns or tailored advice, such as energy audits. Often, access to energy efficiency information in homes is costly, especially in rental properties, and poses barriers to energy conservation. Energy audits can address these information asymmetries by providing households with accessible and actionable information (Ramos et al. 2015). According to the theory of norm activation, energy saving tips and audits can enhance consumers' perceived control over their behavior (Fischer 2008), whereby learning about energy consumption behavior and energy saving tips can lower the perceived cost of adopting energy efficient practices(Delmas et al. 2013). Further, individuals tend to be more receptive to those they have meaningful relationships with (Cialdini 2009; Cialdini and Goldstein 2004), hence, are more likely to act on information that was delivered through strong social ties (e.g., families) (Abrahamse and Steg 2013; Christakis 2009) and through those they perceived more similarities with (Burger et al. 2004).
Feedback reduces energy consumption by influencing consumers' behavior through the provision of information on their past behaviors and energy usage patterns. Interventions can include home displays, historical usage patterns, smart meters, and redesigning utility bills. Individual feedback influences individual behavior through self-efficacy (Bandura 1997). In both types, feedback provides insights into the link between desired outcome (e.g., energy saving) and the behavior change needed to reach that outcome (e.g., turn off lights) (Kluger and DeNisi 1996). Matthies (2005) presents a heuristic model of environmentally relevant behavior that provides a framework for how feedback interrupts habitual behavior of energy consumption and initiates changes in three consecutive processes: norm activation, motivation, evaluation, and action. The process of norm activation requires three building blocks, such that consumers become conscious of their environmental problems, of the relevance of their behaviors, and their ability to influence their behaviors and outcomes (sense of control). Succeeding this is the process of weighing and evaluating personal environmental norms, social norms, and other motives to decide their course of action. Building on this framework, feedback presents consumers with a problem that requires conscious choices, offering an opportunity for self-reflection. By linking consumption feedback to a specific appliance, it raises awareness of the significance of individual actions while also providing a direct solution, thereby enhancing the sense of control. All three components are required for norm activation. Feedback is crucial in influencing energy consumption habits where consumers are unaware of their own behaviors, and do not know how to address them (Fischer 2008; Matthies 2005).
Social comparison reduces energy usage by benchmarking household consumption with comparable households. Social comparison is a provision of social norms on the standard level of usage given household characteristics and the socially acceptable level of usage, guiding consumers' behaviors, especially under uncertain circumstances (Allcott and Mullainathan 2010; Delmas et al. 2013). For reference-dependent consumers (Kahneman 2003), social norms become an important reference point to avoid disutility from socially disapproved behaviors (Fischer 2008; Schubert and Stadelmann 2015). Behavioral changes driven by social comparisons are motivated by individuals' desire to feel better off relative to a worse group (downward comparison) (Suls et al. 2002) or to see themselves in a better light relative to the better-performing group (upward comparison) (Cialdini et al. 1976). Social comparisons also correct biased beliefs of individuals' consumption (environmentalist overconfidence on their energy savings) (Andor and Fels 2018) generate competition and reinforce consumers' desire to be above average (Abrahamse et al. 2005).
Motivation interventions tackle consumers' time-inconsistent preferences by binding their future behaviors, sometimes with a reference point (O'Donoghue and Rabin 1999). Consumers with time-inconsistent preferences tend to procrastinate on and delay actions to reduce energy consumption or may never achieve them due to present bias (O'Donoghue and Rabin 2008). Motivations, like personal commitment, “appeals to a person's norm”—desire to satisfy their self-expectation (Abrahamse et al. 2005). Public commitment motivates changes in behavior through social pressure appealing to consumers' desire to meet others' expectations, be it their peers or an institution. A motivation with reference point (specific target) appeals to a person's loss aversion, where failure to meet their commitment creates more “disutility” than accomplishing it (Bandura 1986; Kahneman and Tversky 2013).
Monetary incentives reduce energy consumption through financial consequences in the form of pricing, rebates, and rewards (Dietz 2015; Mi et al. 2021; Sloot et al. 2021). Indirect incentives provide users with financial information on their energy consumption to motivate cost savings through reducing consumption. Direct incentives provide immediate financial benefits, including rebates for energy reduction and dynamic electricity pricing–varying prices through the day or during peak periods in response to demand. The economic theory of rational choice explains the effects of financial incentives in motivating energy conservation based on the assumption of rational consumers who act in their self-interest and select options where benefits outweigh costs (Hutton and McNeill 1981; Scott 2000). In the context of both direct and indirect incentives, rational consumers will reduce consumption overall or during peak times when the financial benefits (e.g., cost savings, paying lower prices, rebates) of doing so are higher than the costs (e.g., using electricity at a particular time) (Jackson 2005). However, recent psychological research suggests consumers also consider the “wider social consequences” such as environmental intrinsic values and personal norms in addition to the costs and benefits of their energy consumption behavior (Sloot et al. 2018; Stern 2000). Studies have shown that overemphasis on extrinsic and monetary values to promote pro-social behavior can crowd out “intrinsic motivation to act altruistically” and reduce desired behaviors (Frederiks et al. 2015; Frey and Jegen 2001; Menges et al. 2005).
Why It Is Important to Do This Review
There is a well-established and fast-growing literature on monetary, behavioral, and information interventions in energy consumption in households, including nudging, appealing to norms, providing easily interpretable and credible information at the point of decision-making, and so forth. The relevant literature is spread across various disciplinary fields: economics, psychology, and power system studies.
Previous meta-analyses on this topic are intra-disciplinary (e.g., Abrahamse et al. 2005) and/or focused on a subset of interventions. For instance, Faruqui and Sergici (2013) focus on pricing interventions, Karlin et al. (2015) on feedback, and Andor and Fels (2018) on social comparison, commitment devices, goal setting, and labeling. Nisa et al. (2019) consider evidence from a wider range of household behaviors that are relevant for climate change mitigation, but do not review interventions in energy consumption exhaustively. The meta-analysis by Delmas et al. (2013) was based on a narrower literature search and did not include studies published after 2012. A review with a similar scope but with studies updated till 2019 was published by Buckley (2020). Khanna et al. (2021) provide a comprehensive meta-analysis, but the literature on behavioral interventions is increasing fast, so reviews need to be constantly updated.
The latest systematic review by Khanna et al. (2021) contained 360 effect sizes from 122 studies with evidence from 25 different countries published by mid-2020. Since then, considerably more evidence has emerged in this fast-growing field of study as technological advancements in metering energy and information provision have made it easier to experiment with such interventions. The new knowledge gained from these studies may lead to changes in evidence-based recommendations for policymakers and practitioners. However, there are long lags in incorporating new evidence. To prevent such gaps in knowledge, this review will systematically and continually update the evidence using the “living systematic review” concept, hitherto mainly discussed in clinical sciences (Akl et al. 2017; Elliott et al. 2017; Simmonds et al. 2017; Thomas et al. 2017). This LSR and NMA provide up-to-date evidence, with almost double the number of effect sizes, while simultaneously preventing duplication of effort in incorporating past studies.
Methodologically, this review fills several gaps: understanding the role of machine learning (ML) in updating reviews, resolving the statistical challenges in updating meta-analyses, and setting up guidelines for updating policy recommendations based on a living review.
Objectives
Our LSR and NMA integrate the evidence available from multiple disciplines to answer the following questions: (1) To what extent can information, behavioral, and monetary interventions reduce the energy consumption of households? (average effect size of interventions); (2) What is the relative effectiveness of interventions? (account for heterogeneity in intervention effects across and within studies); (3) How effective are combinations of different interventions?; (4) What is the potential and pitfalls of using “living” systematic review for providing evidence on climate policy solutions? We address the first question on the effectiveness of interventions in reducing household energy consumption by conducting a multilevel meta-analysis model and subgroup analysis to explore the differentiated effect sizes by risk of bias (ROB) level in primary studies. The second and third questions on the relative and combined effectiveness of interventions are addressed both with an NMA and a multilevel model.
Methods
We start this study by replicating the methods from Khanna et al. (2021) as it provides a rigorous and comprehensive evidence base and serves as a suitable case for living evidence, as noted in the review protocol (Khanna et al. 2024). We therefore adopt all the definitions and conventions from this study and add the elements required to turn it into an LSR and NMA. We refer to the PRISMA-LSR and PRISMA-NMA reporting guidelines. We adhere to the MECCIR reporting standards and fill out the AMSTAR2 checklist along with the review. The relevant portions of the MECCIR standards for protocol have been filled in and are attached (Khanna et al. 2024).
Criteria for Considering Studies for This Review
Types of Studies
We include studies that conduct randomized controlled trials to estimate the effect of the relevant interventions. We also include studies with quasi-experimental designs that estimate the causal effect of an intervention using observational data through statistical methods, including difference-in-difference or instrumental variable analysis. We also include longitudinal studies that compare the energy consumption before and after the intervention, but do not necessarily estimate a causal effect. We do not include studies that are purely theoretical or simulate the effect of interventions using constructed data. We also do not include studies that target only specific types of appliances.
Types of Participants
We include all studies that estimate the effect at the household level, or common living spaces like dormitories. We do not include the effect of interventions in commercial establishments or industries.
Types of Interventions
This review includes studies that involve monetary, information, or behavioral interventions to bring about a reduction in energy consumption in households. Following Khanna et al. (2021), we classify the interventions into five categories—monetary incentives, information, feedback, social norms, and motivation interventions. Refer to Table 1 for details about each type of intervention. Interventions are often applied together in the studies that we review. In this case, the relevant effect size observation is tagged with all the relevant interventions. We also analyze the effect of the different combinations of interventions (“intervention packages”). Experiments that target specific appliances only, structural upgrades, and direct load control are not included. Studies that analyze different drivers of energy conservation (such as demographic, environmental attitudes, etc.) rather than a policy instrument are not included.
Types of Comparisons
We include studies that use a study design which has a valid comparison group as a benchmark to quantify behavior change. This can be a control group in experimental studies, a statistically constructed or selected control group in quasi-experimental studies or the level of behavior before the intervention in longitudinal designs. Studies that do not observe behavior in a control group/historical reference/constructed control group are excluded.
Types of Outcome Measures
Primary Outcomes
Energy or electricity consumption of the household or of the shared accommodation in the case of dormitories. This unit of analysis may, however, vary in the studies: kWh, BTUs, units of energy/square foot of floor space, percentage change in energy consumption, absolute change in energy consumption, and so forth. Energy consumption must be measured at the household level or the level of dormitories. Studies that investigate the shift in energy demand (e.g., whether households consume more electricity at night when evening consumption is priced higher) but not the overall reduction in energy consumption of the household are not included. We also exclude studies that only investigate intentions/motivations to reduce energy consumption.
Secondary Outcomes
N/A.
Duration of Follow-Up
We separately code the duration of the baseline period, duration of the intervention, and duration of the follow-up. However, not many studies do follow-ups.
Types of Settings
We will include all experimental and quasi-experimental studies conducted at the household level. We will only include studies that capture actual energy consumption behavior, so we will exclude simulation studies or studies conducted in a laboratory setting that only capture intent to save. This strategy is considered optimal as there is already a large literature that captures experiments in the real world, such that evidence from online or lab experiments does not need to be included.
Search Methods for Identification of Studies
The starting point of our search is the studies identified by Khanna et al. (2021) through their comprehensive search of the relevant literature in previous systematic reviews and meta-analyses, and bibliographic databases. Khanna et al. (2021) used a prioritized screening approach (Callaghan and Müller-Hansen 2020) to identify relevant evidence from over 64,000 studies at the abstract level (through a mix of manual and ML approaches), whereby 934 studies were screened manually at the full-text level and 122 relevant studies were identified, which are twice as many as identified by any previous systematic review with this scope and includes all the studies identified by previous reviews. We update this pool of relevant studies through string-based searches of bibliographic databases and gray literature since 2020, when the databases were searched by Khanna et al. (2021). The search string we use follows the PICOS (population, intervention, comparator, outcome, and study design) logic to target empirical studies covering one or more of such interventions and household energy consumption as the outcome variable (Table 2).
Search string used in Web of Science/Scopus/Medline advanced search.
Electronic Searches
Our search covers all the relevant databases: Web of Science Core Collections Citation Indexes (the topic field, which includes title, abstract, author keywords and keywords plus), Scopus (title, abstract, keywords), JSTOR (title, abstract), RePec (title and keywords), and the web-based academic search engine Google Scholar (title) and Policy Commons (title). For Google Scholar, we use Publish or Perish to download the relevant search results. We split the query by intervention type, implement partial queries separately, and retrieve the first 1000 results available for each intervention. We ran a similar query for searching Policy Commons and included documents from Working Papers, Conference Proceedings, and Reports. Khanna et al. (2021) included papers identified through literature snowballing, and we will implement the same. We identify records through snowballing of the literature cited in existing reviews.
Through this comprehensive search strategy, we retrieve just under 53,000 of potentially relevant article abstracts from bibliographic databases (reflecting the sizeable literature published between 2020 and 2025). The last database search was implemented on January 22, 2025.
To make the identification of relevant papers tractable, we apply a ML algorithm that uses support vector machines to rank the studies identified by the search queries in the order of relevance of their abstracts. The best-performing ML classifier is trained on the set of previously screened documents (N = 6023) and iteratively trained on newly screened abstracts (see Appendix S1—Prioritized screening).
Data Collection and Analysis
Description of Methods Used in Primary Research
The primary studies in our inclusion scope compare household energy consumption before and after an intervention (pre–post), across treatment–control groups, or both before and after intervention and across treatment groups (difference–in–difference [DID]). The primary statistical methods used for analysis in these studies are difference of means, ordinary least squares regression, or panel regression with household/time fixed effects panel.
Selection of Studies
The inclusion decision is made based on the comprehensive inclusion-exclusion criteria provided in Table 3 below.
Inclusion/exclusion criteria used for classifying studies.
Data Extraction and Management
The studies were screened, and data were extracted by a graduate student under the direct supervision of a research associate, who has a background in economics. Since the data collection effort was conducted over a period of 1 year and continues to keep the review “living,” more than one graduate student was involved over the lifetime of the project. To achieve consistency, the research associate was involved throughout the process to train the students. To ensure reliability, the research associate discussed the codebook and the interpretation of the various fields using examples given in Khanna et al. (2021). Further, a sample of 100 abstracts and a sample of 10 studies were screened and coded by all the coders. The discrepancies in the screening and coding were discussed to resolve differences. The ROB assessment was performed by an experienced systematic review expert and the graduate students, as detailed in the section on Assessment of ROB in included studies.
Assessment of ROB in Included Studies
For critical appraisal, we coded metrics of study quality covering aspects of internal and external validity following the ROB framework suggested by the Collaboration for Environmental Evidence (Konno et al. 2021) for each included study. We adjusted the CEE critical appraisal tool (CAT) to be applicable to the specific data set we are working with, in terms of study designs and statistical techniques implemented in the primary studies.
Specifically, our framework included 18 questions corresponding to five instead of the seven CEE CAT criteria. We did not assess studies on Criterion 3 (Risk of Misclassified Comparison Biases) meant for evaluating observational studies only, as most of the primary studies in our data set are experimental studies. We also did not consider Criterion 4 (Risk of Performance Biases) because it is uncommon for trials to be pre-registered in this field, and as such, we are unable to assess if implementation of the intervention varied from the documented design. The detailed tool can be found in the codebook. Following the CEE CAT framework, we summarize ROB level for each criterion as “low” (with a score 1), “medium” (with a score 2), or “high” (with a score 3).
The ROB questionnaire was filled out by the person coding the study. Our data set also includes studies that were coded in Khanna et al. (2021), but which did not include a ROB assessment. The ROB for these studies was assessed by a senior member of the research team, who also helped train the graduate students in conducting ROB for other studies included in the data set. To ensure uniformity across coders, 10 studies were coded by all the coders, and the results were compared and discussed to resolve discrepancies.
Measures of Intervention Effect
Design elements of original studies are captured as dummy variables for the following variables: weather controls (if a study controls for any aspect of weather, it is assigned value 1); demographic controls (if a study controls for demographic variables like age, income, composition of the family etc., it is assigned value 1); residence controls (if a study controls for the characteristics of the house like size, etc., it is assigned value 1); and randomization (assigned value 1 if households are randomly assigned between interventions). We also include as moderator variables study design (difference-in-difference, control-treatment, or pre-post) and statistical method (panel regression, OLS regression, or difference of means tests) employed in the studies. Other moderator variables capture the factors that are likely to affect the relationship between energy use and the intervention, for example, duration of experiment or region in which the experiment was performed.
Unit of Analysis Issues
Randomization at the cluster level: we coded whether households in each study were randomized at the cluster level (district, state, neighborhood) or at the household level. For studies where households are cluster randomized and the effect is calculated at the household level, we also coded whether the primary study calculated the effect accounting for the effect of such clustering (whether cluster standard errors were calculated). All the studies included in the final analysis accounted for clustering in calculating the standard error for the effect size. For one, the effect and the SE were both calculated at the cluster level.
Repeated observations on participants: we selected the longest follow-up from each study. While this may induce a lack of consistency across studies, giving rise to heterogeneity, we also code the duration of the study to capture the heterogeneity that this introduces.
Criteria for Determination of Independent Findings
Generally, we do not expect the studies to capture multiple outcomes. Most of the studies included in this literature are likely to report some form of reduction in energy consumption. It could be that some studies report a reduction in energy consumption for sub-groups of the population. In this case, the metric reported for the whole sample would be coded and not the reductions reported for specific sub-groups. We explicitly exclude studies or observations that report reductions in energy consumption only for specific appliances or times of the day.
However, primary studies tend to report multiple effect sizes. The primary source of multiplicity is that studies report analyses both unadjusted and adjusted for confounders. Additionally, they may also report effects at different points in time after the intervention. While multi-arm studies that directly compare the efficacy of interventions against each other are rare in our data set, it is common for studies to test more than one intervention or combinations of interventions against a common control group. For example, a study might test the impact of three interventions on energy consumption against a common control group: (1) giving feedback to consumers about their past consumption (feedback), (2) providing them with a comparison of their consumption and their peers (social comparison), and (3) both feedback and social comparison.
We follow an integrative approach to deal with the multiplicity of estimates and include multiple effect sizes from all studies where they are available. This has the advantage that it increases the size of our data set and increases statistical power, but also introduces statistical dependencies in our data set. To deal with these dependencies flexibly, we estimate our aggregate effect sizes using two-level multilevel or hierarchical models, where the higher level represents variation in effect size across studies and the lower level represents within-study variation. We use robust variance estimation (with small sample corrections) to test the robustness of our estimates. Lastly, adding different interventions and combinations of interventions in the multilevel models as moderator variables allows us to address multiplicity and compare average effects across interventions.
Dealing With Missing Data
An attempt was made to retrieve missing data in all manuscripts that otherwise qualified for inclusion by approaching the authors via e-mail; however, repeated requests were not sent. Studies excluded due to missing information are also identified separately in case information becomes available.
Assessment of Heterogeneity
We will examine effect size heterogeneity by examining the results of the meta-analysis and report the Q test for the fitted models and report the I 2 statistic for the meta-analysis of the overall average intervention effect. We report both the between-study and within-study I 2 derived from the multilevel model used for calculating the overall average intervention effect.
Assessment of Reporting Biases
We assessed publication bias using funnel plots and Egger's test. The funnel plot shows the distribution of effect sizes in conjunction with the standard error. We use statistical tests that are more formal than the funnel plot to confirm the presence of publication bias and to estimate the “true” average effect size adjusted for publication bias. We use the precision-effect test (PET) and precision-effect estimate with SE (PEESE) for estimating/testing the “true” effect in the presence of publication bias (Stanley and Doucouliagos 2014). PET and PEESE use the following regression models:



Data Synthesis
The studies in our study are expected to report effects in terms of relative change in energy consumption, but the exact dependent variable may vary across studies. We first standardize the effects by converting the estimates of energy reduction reported by each study to Cohen's d. A positive effect size is interpreted as a decrease in energy consumption by the treatment population relative to the control population. A negative effect, on the other hand, implies an increase in energy consumption in the treatment group.
We use a random effects model to aggregate effect sizes extracted from the primary studies. A random effects model is appropriate when effect sizes in primary studies do not consistently converge to a central population mean (Nelson and Kennedy 2009; Ringquist 2013), which is typically the case in social science research and certainly the case for studies relating to energy consumption in households with heterogeneous intervention effects (Delmas et al. 2013). The ordinary random effects model is inappropriate when the effect sizes included are not statistically independent (Ringquist 2013). Effect sizes are likely to be dependent in our sample as we extract multiple effect sizes from each study. In addition, several of the studies in our set employ multiple interventions, and some use data from the same underlying experiments. We employ a multilevel meta-analysis model to account for such dependence. The multilevel analysis explicitly models that several of the effect sizes (level 1) come from the same study (level 2).
Subgroup Analysis and Investigation of Heterogeneity
Our data set includes studies that employ different types of interventions: monetary incentives, information, feedback, social comparison, and motivation, as well as combinations of them, to reduce the energy consumption of households. The diversity of interventions and their combinations used in our data set could be a source of heterogeneity in our analysis. We investigate such heterogeneity using two approaches: a multilevel meta-regression model and an NMA approach.
Heterogeneity could also arise out of context in which the studies were carried out. The previous version of this review (Khanna et al. 2021) investigates this heterogeneity by adding variables that represent both context and setting of interventions and study design characteristics as moderator variables in the meta-analysis models. Such analyses have also been conducted by previous reviews (Buckley 2020; Delmas et al. 2013) and the results from these analyses have tended to be consistent overtime. Therefore, we do not repeat the heterogeneity analysis here for the sake of the focus of this review. However, the data set that we provide with this study also contains information on these variables, and such analysis can easily be carried out by users of this data.
Meta Regression Approach for Heterogeneity Analysis
We added a dummy variable that indicated the type of intervention or the combination thereof as a moderator variable in the multilevel meta-analysis model to calculate intervention specific average intervention effects. These are presented in the form of a forest plot (Figure 1).
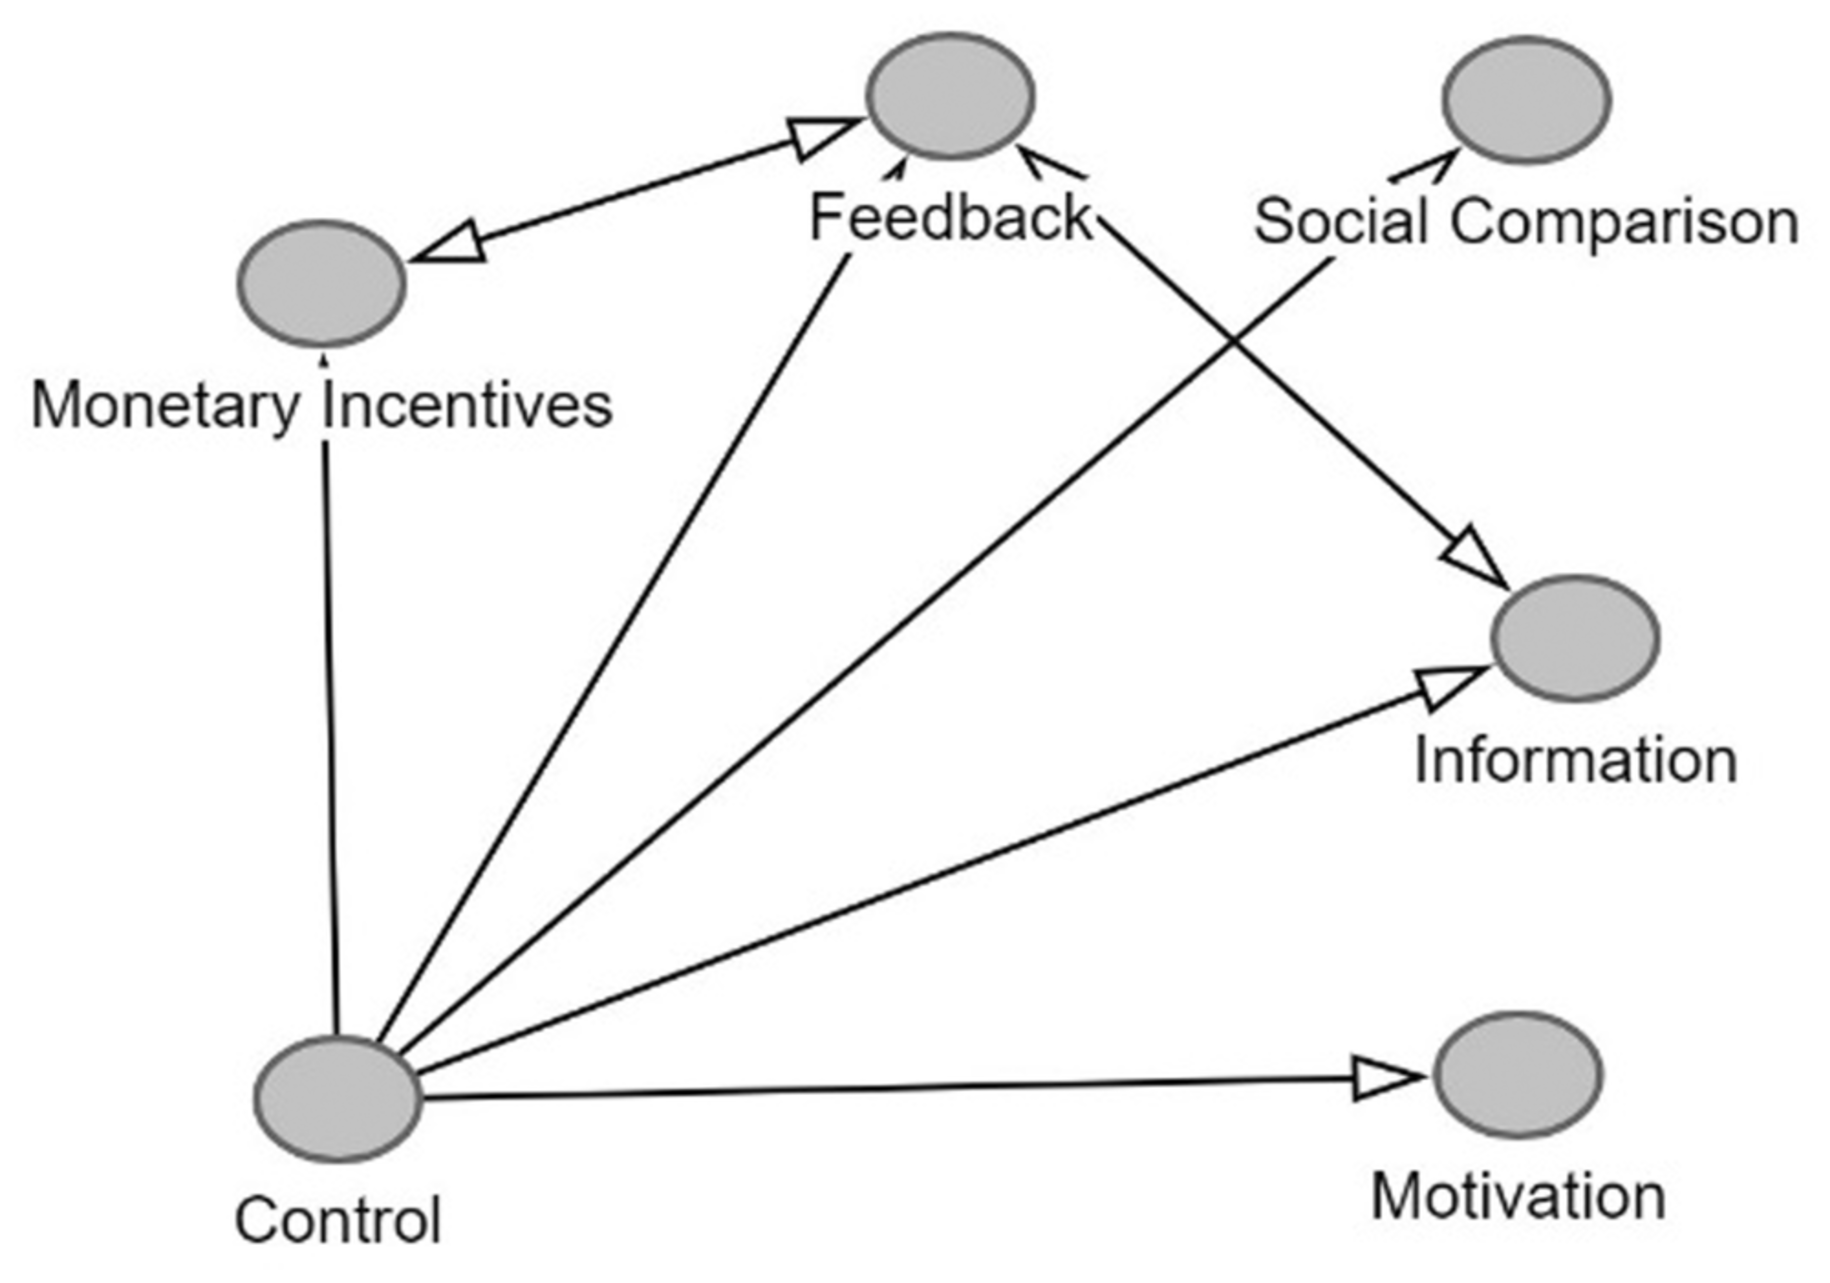
Possible comparisons in network meta-analysis.
NMA for Heterogeneity Analysis
We conducted an NMA to compare the average effects of various behavioral interventions on our primary outcome. Each effect size in our data set records the effect of interventions compared with a control group, for example, monetary incentives versus control, information versus control, and so forth. For studies where the experimental units receive multiple interventions, their interventions are recorded as a combination of interventions. For example, if participants receive both feedback and monetary incentives, then the comparison would be feedback and monetary versus control (Figure 2). The primary studies included in this network analysis were nearly always two-armed, and compared a treatment group against a control, with very few interventions compared directly (Fernández-Castilla and Van den Noortgate 2023). Since such direct evidence head-to-head comparison between interventions is rare, our network has a “star-shaped geometry.”
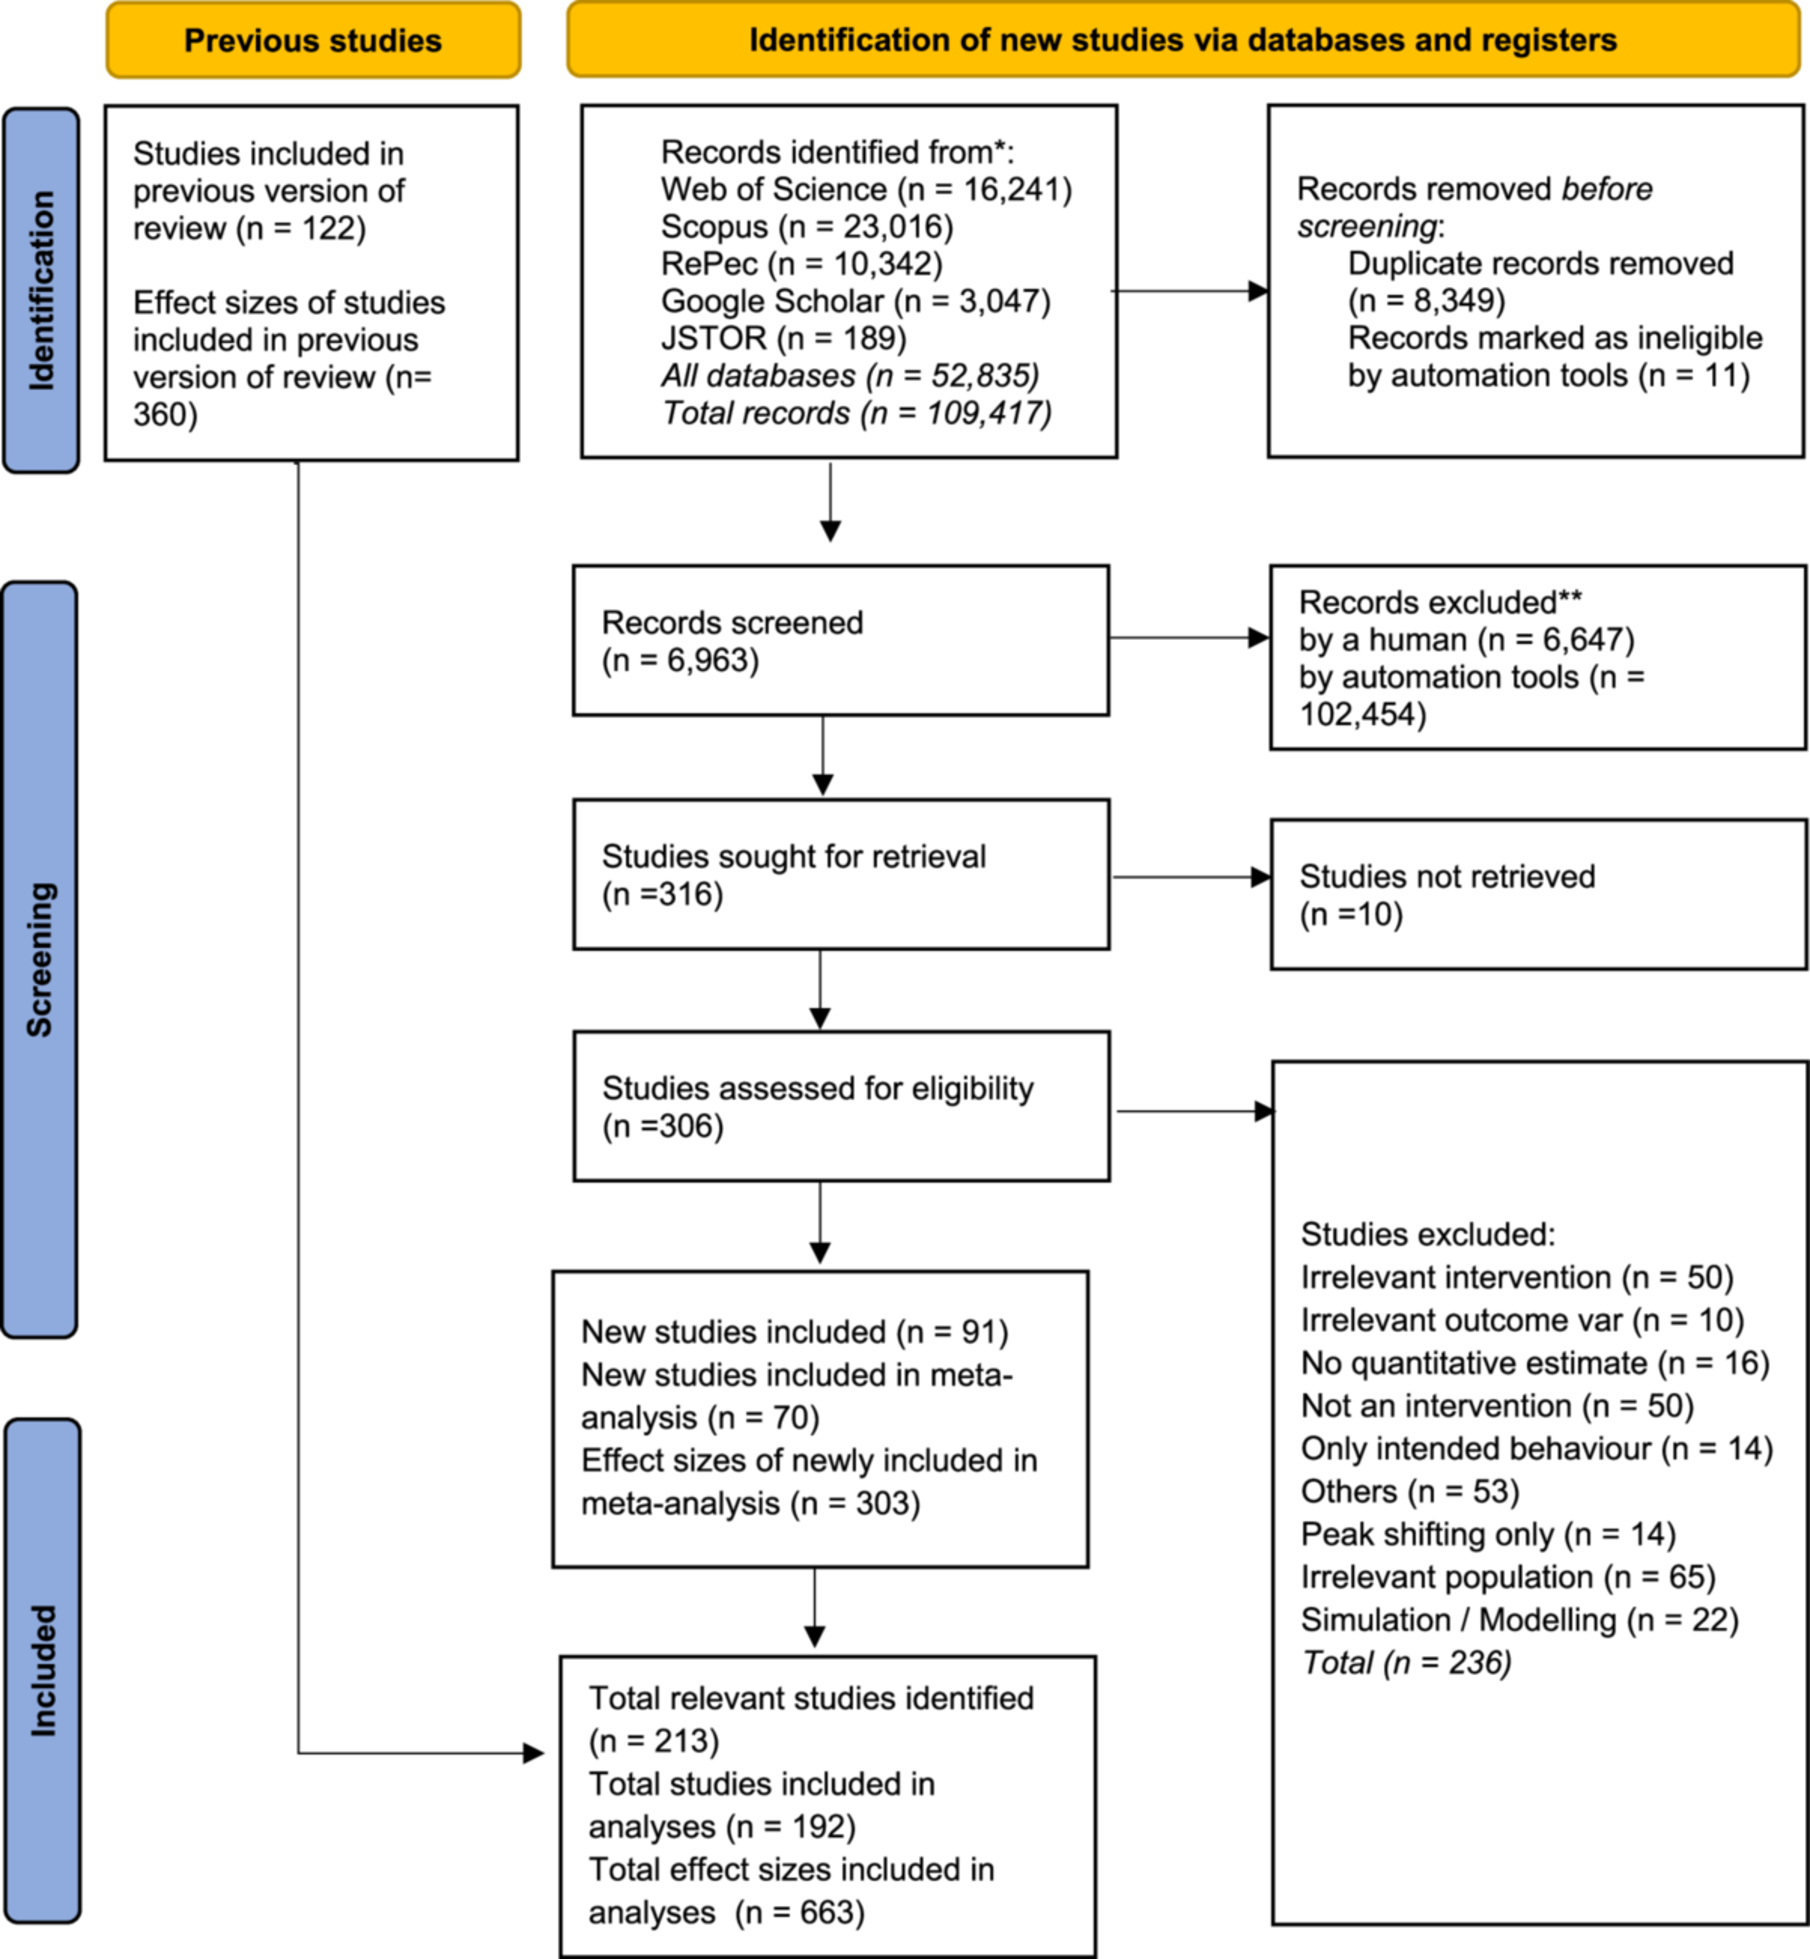
PRISMA-LSR flow diagram for updated systematic reviews which included searches of databases. created using Living PRISMA Flow: R package and ShinyApp for producing PRISMA-style flow diagrams for living systematic reviews (Version 0.0.1).
Network Geometry, Transitivity, Consistency, and Heterogeneity Assessment
An initial check while conducting NMA is that the data should satisfy the transitivity assumption, that is, included studies are sufficiently similar in effect modifiers so that it is valid to compare interventions indirectly via the common control. This allows evidence across these groups to provide a comparative ranking of the interventions (Chaimani et al. 2023; Fernández-Castilla and Van den Noortgate 2023; Wilson et al. 2016). We qualitatively assessed transitivity by reviewing study characteristics across important effect modifiers identified by Khanna et al. (2021) to ensure no major systematic differences that would violate this assumption (e.g., all studies targeted a similar outcome under comparable conditions) (Lin et al. 2021). Each intervention (or combination) was counted as a separate node in the network; in cases where the same study reported multiple comparisons (for instance, testing the same intervention in different subpopulations or timeframes), we included each comparison as if from an independent study for the purposes of the NMA (since NMA requires one effect size per study per comparison). This approach allowed us to include all relevant comparisons, but we acknowledge it treats repeated measures from a single study as independent, which we address in sensitivity considerations elsewhere.
We also evaluated whether the consistency assumption was likely to hold. Consistency refers to the agreement between direct and indirect evidence for the same comparison. Our star-shaped network lacked any loops of evidence (not many interventions were compared directly in any study), the usual methods for checking consistency could not be applied. In particular, a node-splitting analysis (which typically separates direct from indirect evidence on a particular comparison) did not produce any estimates. In other words, the network geometry provided no opportunity for inconsistency to arise—any comparison between two active interventions was informed only by indirect evidence through the control. We therefore could not calculate local inconsistency measures or obtain node-split p-values, and a design-by-treatment global inconsistency test likewise had no degrees of freedom (no between-design Q statistic could be computed, shown by the netsplit() procedure returned only NA estimates, and the blank in the table). By design, the network is structurally consistent (there is no conflict between direct and indirect evidence since indirect evidence is all that exists).
In lieu of formal inconsistency tests, we focused on between-study heterogeneity as a measure of variability in effects that could impact our confidence in the results. We employed a random-effects NMA model with a common between-study variance (τ2) across all comparisons. This model estimates a shared heterogeneity parameter, allowing each intervention effect to vary across studies around an overall mean effect. We quantified the total heterogeneity with metrics such as τ (the between-study standard deviation) and I2 (the proportion of variability in effect estimates due to heterogeneity rather than chance). This global heterogeneity assessment served as a proxy check: if heterogeneity was extremely high, it might indicate underlying inconsistency or important effect modifiers. Conversely, low to moderate heterogeneity would increase confidence that the intervention effects are reasonably consistent across studies. As reported below, the selected model's heterogeneity was in an acceptable range (common τ2 was moderate and I2 was not excessive), suggesting that while studies differed to some extent, the variability in effects was adequately accounted for by the random-effects model. No concerning inconsistency was detected in the network, given the absence of conflicting direct evidence and the tolerable level of heterogeneity observed.
NMA Setup
Our NMAs were carried out within a Bayesian framework, utilizing Markov Chain Monte Carlo (MCMC) methods to estimate the posterior distributions of the effect sizes (Tonin et al. 2017). We adhered to a non-informative prior approach to ensure minimal prior influence on the results. We initialized four separate MCMC chains with different starting values to enhance the robustness and convergence of our simulations. Each chain underwent a substantial iteration process involving 100,000 iterations, with the first 10,000 discarded as burn-in to ensure stabilization of the chains. Convergence was checked using Gelman-Rubin-Brooks plots, providing a comprehensive assessment of stability across chains (see Appendix S1 for details).
We tested both fixed-effects and random-effects models, but ultimately used only a random-effects model. The selection criteria between these models were guided by the fact that random fits the data structure better. This was validated by the Deviance Information Criterion (DIC), with random effects models exhibiting a DIC lower by at least 10 points, indicating a significantly better fit and parsimony (Liew and Lee 2019).
Effect Size and Ranking Estimates
The probability of each intervention being the most effective was computed and visualized through rankograms and cumulative ranking probability plots. The overall efficacy and acceptability of the interventions were summarized using the Surface Under the Cumulative Ranking (SUCRA) curve, which provides a numerical value between 0% and 100%, where higher values denote superior effectiveness or acceptability (Chaimani et al. 2023). The SUCRA is created based on the rank probabilities generated from the MCMC iterations in gemtc (van Valkenhoef and Kuiper 2012). For each iteration, treatments are ranked, and these rankings are used to estimate the probability of each treatment being the best, second best, and so forth. The SUCRA is then calculated by dividing the ranks into quantiles and determining the cumulative probabilities that each treatment is within a specific rank. It reflects how consistently a treatment performs across iterations. The scatter plot of SUCRA scores illustrates that the average proportion of intervention being worse than the current treatment over the 101000 iterations (Chaimani et al. 2023).
Sensitivity Analysis
We conducted a sensitivity analysis of the results with respect to the ROB assigned to each study. We calculated the average effect size and the forest plots with average effect for different combinations of interventions separately for the studied categories, as having high, medium, and low ROB. We also distinguish the high, medium, and low ROB by different criteria of biases identified.
Results
Description of Studies
Results of the Search
The starting point of our review was the 122 studies and 360 effect sizes included in the previous meta-analysis by Khanna et al. (2021) that screened the relevant literature till June 2020. Our search queries extended the search to December 2024. We identified just under 53,000 new, possibly relevant abstracts across databases. We used prioritized ML algorithms to identify the most relevant studies (n = 6963) that were screened at the title and abstract level by human coders. Of these abstracts, 318 were tagged as relevant, and the studies were screened at the full-text level and 91 of these were found to be relevant for the review, but there was incomplete statistical information for 21 studies, so 70 studies were included in the meta-analyses. Including the studies from Khanna et al. (2021), we therefore include 192 studies and 663 effect sizes in our analyses.
Included Studies
We found a total of 213 relevant studies and included a total of 192 studies and 663 effect sizes extracted from them in our analyses. We categorize the studies that investigate the effects of one of the five intervention categories mentioned in Table 1 1 or a combination of them. Table 4 also provides an overview of the distribution of important variables coded for the studies. Most of the data set comes from studies in North America, followed by Europe and the United Kingdom. About one-fifth of effect sizes come from Asia, though this overwhelmingly represents Japan and other OECD countries in Asia. We have very few studies from South America or Africa. Most of the studies implement an experimental study design and randomization, and use a difference-in-difference study design that is considered the most reliable for estimating causal effects. But a large proportion of studies use only ordinary least squares estimation techniques rather than controlling for panel effects, and most do not explicitly control for weather, an important determinant of energy consumption (Khanna et al. 2021). A large proportion of the studies allow residents to opt into the study, which can cause possible awareness bias, which we code in our risk-of-bias framework. Study-by-study details of the included studies are provided in Table 5.
Summary of included studies and their characteristics.
Characteristics of included studies.
Excluded Studies
Study-by-study details of the studies excluded after full-text screening and the reason for exclusion are provided in Table 6.
Study-wise exclusion reason of excluded studies.
ROB in Included Studies
A comprehensive ROB assessment was conducted across five key methodological domains: confounder bias, selection bias, detection bias, outcome reporting bias, and outcome assessment bias. The findings indicate substantial methodological concerns in the body of included studies, which should be carefully considered when interpreting the synthesis of results.
In the domain of confounder bias, most studies (55.7%) were rated as having a high ROB, reflecting significant limitations in how confounding variables were identified, controlled, or reported. Only 44.2% of studies were assessed as low risk, highlighting a consistent pattern of insufficient adjustment for potential confounders that could affect internal validity.
For selection bias, a more balanced distribution was observed, with 56.9% of studies rated as medium risk, 37.5% as low risk, and only 5.6% as high risk. This suggests that while there are some concerns regarding participant selection processes (such as inadequate randomization or nonrepresentative sampling), the issue is less pronounced compared to confounding.
In terms of detection bias, which pertains to how outcomes were measured and whether these measurements were applied consistently across groups, over half of the studies (56.0%) were rated as high risk. An additional 21.5% were rated as medium risk, and only 18.9% were classified as low risk. This indicates a notable concern regarding the reliability and objectivity of outcome measurements, which may compromise the credibility of reported findings.
The domain of outcome reporting bias also demonstrated substantial risk, with 36.2% of studies rated as high risk and 45.2% as medium risk. Only 18.6% were assessed as low risk. This raises significant concerns about selective reporting of results, such as omission of unfavorable outcomes or post hoc changes to pre-specified outcomes, which may lead to a distorted evidence base.
Lastly, outcome assessment bias was predominantly rated as medium (46.0%) or high (34.0%) risk, with only 20% of studies considered low risk. This reflects issues such as a lack of blinding of outcome assessors or the use of subjective outcome measures that could introduce assessment-related variability or bias.
The summary of risk-of-bias assessment for the data set is given in the Table 7 below. Study-by-study details of the risk-of-bias for studies are provided in data set available on GitHub.
Summary of risk of bias assessment of included studies.
Synthesis of Results
We used a multilevel random effects model and tested the results for small study effects, as an indication of possible publication bias, whereby studies are more likely to be produced where they find desirable and significant effects and/or authors undertake multiple hypothesis testing (p-hacking) and report only those tests found to be statistically significant. The funnel plot (Figure 3) suggests asymmetry in the distribution of effect sizes by their standard errors (a measure of sample size), which is consistent with possible publication bias/small-study effects. To test for this formally, we conducted Egger's test, which includes the standard error of studies as a moderator variable in the meta-analysis model. The coefficient of the standard error is statistically significant at a 0.01% level of significance. We use the PEESE estimate to identify the “true” effect size by including the variance of the effect size as a moderator variable (Nakagawa et al. 2022). However, we also note that there is high between study heterogeneity in our meta-analysis model that includes all the interventions and effect sizes. Between study I 2 ∼ 75% in our data (I 2 above 50% is usually considered high) though this is not uncommon in the environmental literature (Nakagawa et al. 2022). Methods to test or adjust for publication bias in the presence of heterogeneity may not be powerful, as it is difficult to distinguish between genuine small-study bias and true heterogeneity in effect sizes. This is especially true when the meta-analysis is not large (Peters et al. 2010). The PET-PEESE approach that we employ here also performs poorly in case of high heterogeneity, though it has better properties than conventional meta-analysis (Stanley 2017). Though the size of our meta-analysis is favorably large, we are not able to necessarily distinguish between the size of publication bias and heterogeneity through statistical tests, and therefore expect the true estimate to be in the range defined by the estimates adjusted for publication bias and not adjusted for bias, as presented below.
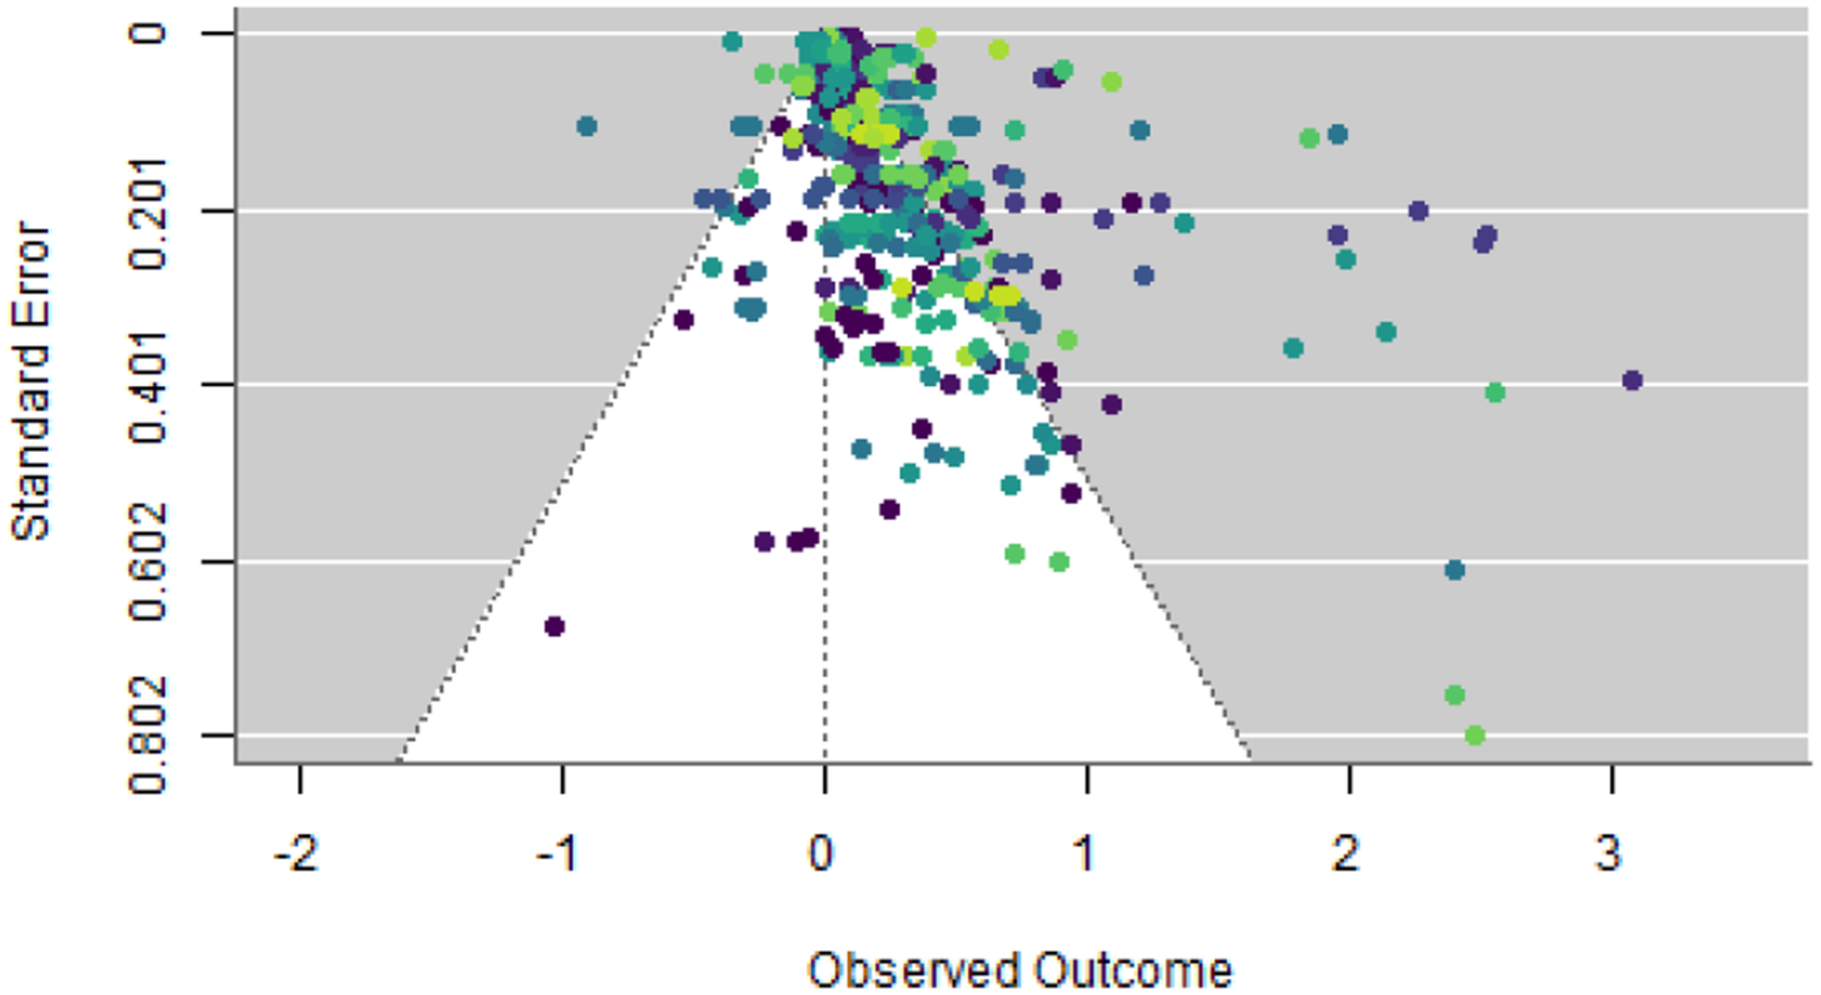
Funnel plot showing the estimated effect sizes along with the standard error.
The average effect size across all interventions estimated using a multilevel random effects model is Cohen's d = 0.22 (95% CI = [0.18, 0.26]), which decreases to Cohen's d = 0.13 (95% CI = [0.09, 0.17]) on applying the PEESE adjustment for publication bias. The estimated average effect is both statistically significant and substantive across model specifications.
We assessed study quality by covering aspects of internal and external validity following the ROB framework recommended by CEE. Table 8 presents the results of the sensitivity analysis of the average effect size with respect to the assessed ROB. For each of the criteria, the average effect size is highest (between 0.25 and 0.32) for the group of studies assessed as having a high ROB, while the average effect size is comparatively smaller (between 0.11 and 0.23) for studies having a low ROB. While the magnitude of the average effect size is lower for studies with the highest quality, the effect is statistically significant for all estimated intervention effects.
Average effect size for each group, along with the 95% confidence interval.
Note: Criterion 1: Risk of confounding biases; this criterion is concerned with biases due to uncontrolled (or inappropriately controlled) variable (confounder) that influences both the intervention/exposure and the outcome. Criterion 2: Risk of post-intervention/exposure selection biases; this criterion is concerned with biases arising from systematic differences in the selection of subjects or areas into the study or analysis after intervention or exposure. Criterion 5: Risk of detection biases; this criterion is concerned with biases arising from systematic differences in measurement of outcomes. Criterion 6: Risk of outcome reporting biases; this criterion is concerned with biases in reporting of study findings. Criterion 7: Risk of outcome assessment biases; this criterion is concerned with biases due to error in applied statistical methods.
Explaining Heterogeneity in Effect Sizes
The Q test indicated that there is statistically significant heterogeneity across the studies, even after accounting for small-study bias. The between-study heterogeneity and within-study heterogeneity baseline multilevel model is estimated to be approximately 75% and 25%, respectively. The diversity of interventions and their combinations used in our data set could be a source of heterogeneity in our analysis. We investigate such heterogeneity using two approaches: a meta-regression model and an NMA approach. In the following paragraphs, we first present estimates of the average effect sizes for the combinations of interventions reported in the literature.
Network Geometry, Transitivity, and Consistency Conditions for Using NMA
The primary studies included in our analysis were nearly always two-armed and compared a treatment or a combination thereof against a control. For example, if participants receive both feedback and monetary incentives, then the comparison would be feedback and monetary versus control. Since direct evidence (head-to-head comparison between interventions) was rare in our data set, our network has a star-shaped geometry (Figure 4). The predominance of a star-shaped geometry has two implications: first, as such the partial fulfillment of transitivity and second, consistency assumption does not have serious consequences for the NMA as there are not any sets to compare across and second, we do not expect the results of the NMA to differ significantly from a random effects meta-analysis because again there is only limited new information available. NMA does, however, provide an opportunity to probabilistically rank the effectiveness of interventions using SUCRA plots presented below. Additionally, the efficacy of NMA would also increase as more trials provide direct evidence between interventions.
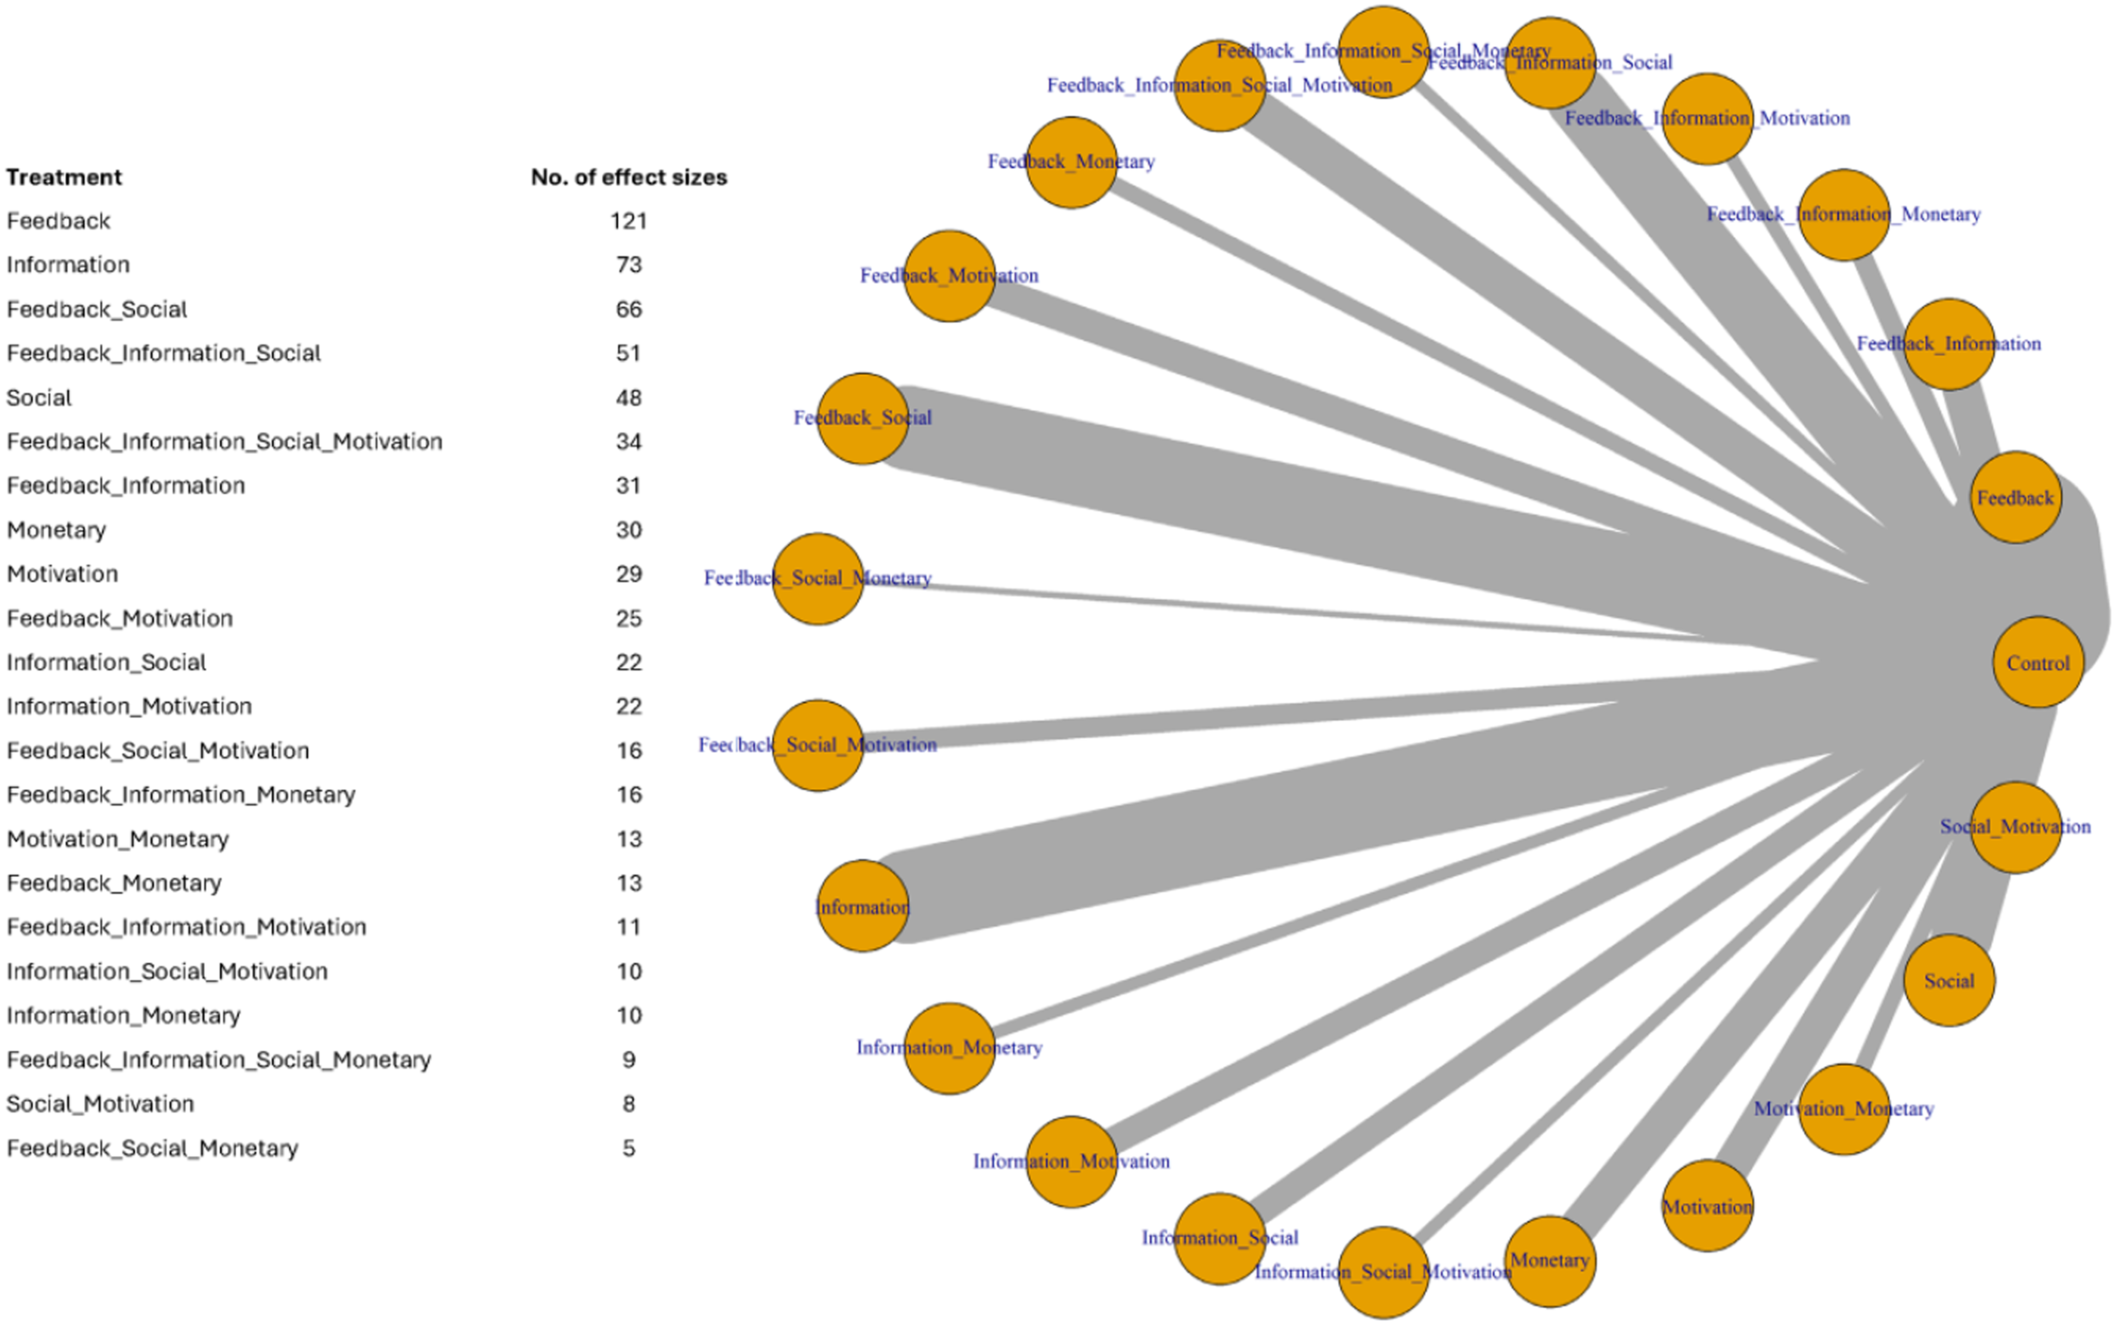
Network diagram showing the number of effect sizes for each intervention combination. Combinations of interventions for which there were less than five observations have not been shown for brevity.
The first step to applying NMA was conducting a transitivity test to ensure that the studies included are similar enough so that their effect sizes are comparable. We qualitatively assessed transitivity by reviewing study characteristics across important effect modifiers identified by Khanna et al. (2021) to ensure no major systematic differences that would violate this assumption (e.g., all studies targeted a similar outcome under comparable conditions) (Lin et al. 2021). Table 9 shows the distribution of important moderator variables across the interventions. As can be seen from the table, importantly, most studies employ randomization across interventions. Across interventions, the proportion of studies with low ROB is also similar. Additionally, for most of the interventions, the predominant study design is difference-in-difference and employs means differences or OLS estimates. However, there is some variation in the geographical distribution of studies across interventions, but previous research only indicates minimal differences across geographies. Only monetary intervention studies tend to employ weather as a moderator variable. As such, we assess there is a moderate level of homogeneity in studies across interventions.
Characteristics of the included studies across the studied interventions (selected).
Due to the star-shaped geometry (missing evidence on head-to-head comparisons between interventions), we are unable to validate the consistency assumption using the node-splitting method for our data structure (Liew and Lee 2019). Instead, consistency is assessed by global statistical heterogeneity quantified using the I2 statistic, with a common heterogeneity parameter incorporated in the random-effects model (Fernández-Castilla and Van den Noortgate 2023). The global I2 estimate for our network is 7%, which can be considered moderate heterogeneity in a meta-analysis context. This implies that there are some differences in effect size between studies—likely due to contextual or methodological diversity—but not so large as to undermine the overall findings of NMA. The random-effects model captured this heterogeneity, and the credible intervals for intervention effects were accordingly widened to reflect it. Importantly, incorporating this heterogeneity through the random-effects model adds confidence that the uncertainty is properly accounted for and the results are conservative.
The results for consistency checks confirmed that the direct and indirect evidence were in agreement (to the extent assessable). Because there were no actual loops in the evidence network, the consistency assumption cannot be violated in the usual sense. The node-splitting analysis we attempted yielded all NA results, and the global inconsistency chi-square test had between-design Q = 0 (with no degrees of freedom), indicating no detectable inconsistency. In practical terms, this means the NMA is essentially synthesizing parallel comparisons against control, and therefore the only considerations are heterogeneity and transitivity (discussed above), rather than inconsistency between different sources of evidence. The coherence of the network lends credibility to the comparative conclusions: the rank ordering and relative effects are driven by consistent patterns observed across studies rather than contradictory evidence. We emphasize, however, that “no inconsistency” here is largely a function of the network structure (and should not be interpreted as a confirmation of consistency beyond what the data allow). It simply reflects that there were no overlapping comparisons to test. Thus, our confidence in the NMA results comes primarily from the transitivity assumption holding and the reasonable level of heterogeneity, rather than from any statistical test of consistency.
Estimated Average Effect Sizes Across Intervention Combinations
The average effect sizes for intervention combinations estimated using the multilevel model (Figure 5) and NMA (Figure 6) are broadly in agreement with each other. Our analysis reveals differences in the average effect sizes across interventions. Studies that solely focus on monetary incentives have the highest average effect size (0.36; 95% CI = [0.23, 0.49]), followed by motivation (0.31; 95% CI = [0.18, 0.44]) and information (0.24; 95% CI = [0.15, 0.32]). Social comparison (0.13; 95% CI = [0.03, 0.23]) and feedback (0.10; 95% CI = [0.04, 0.17]) have similar, lower average effect size. The forest plots for each of the five interventions are provided in the Appendix S1.
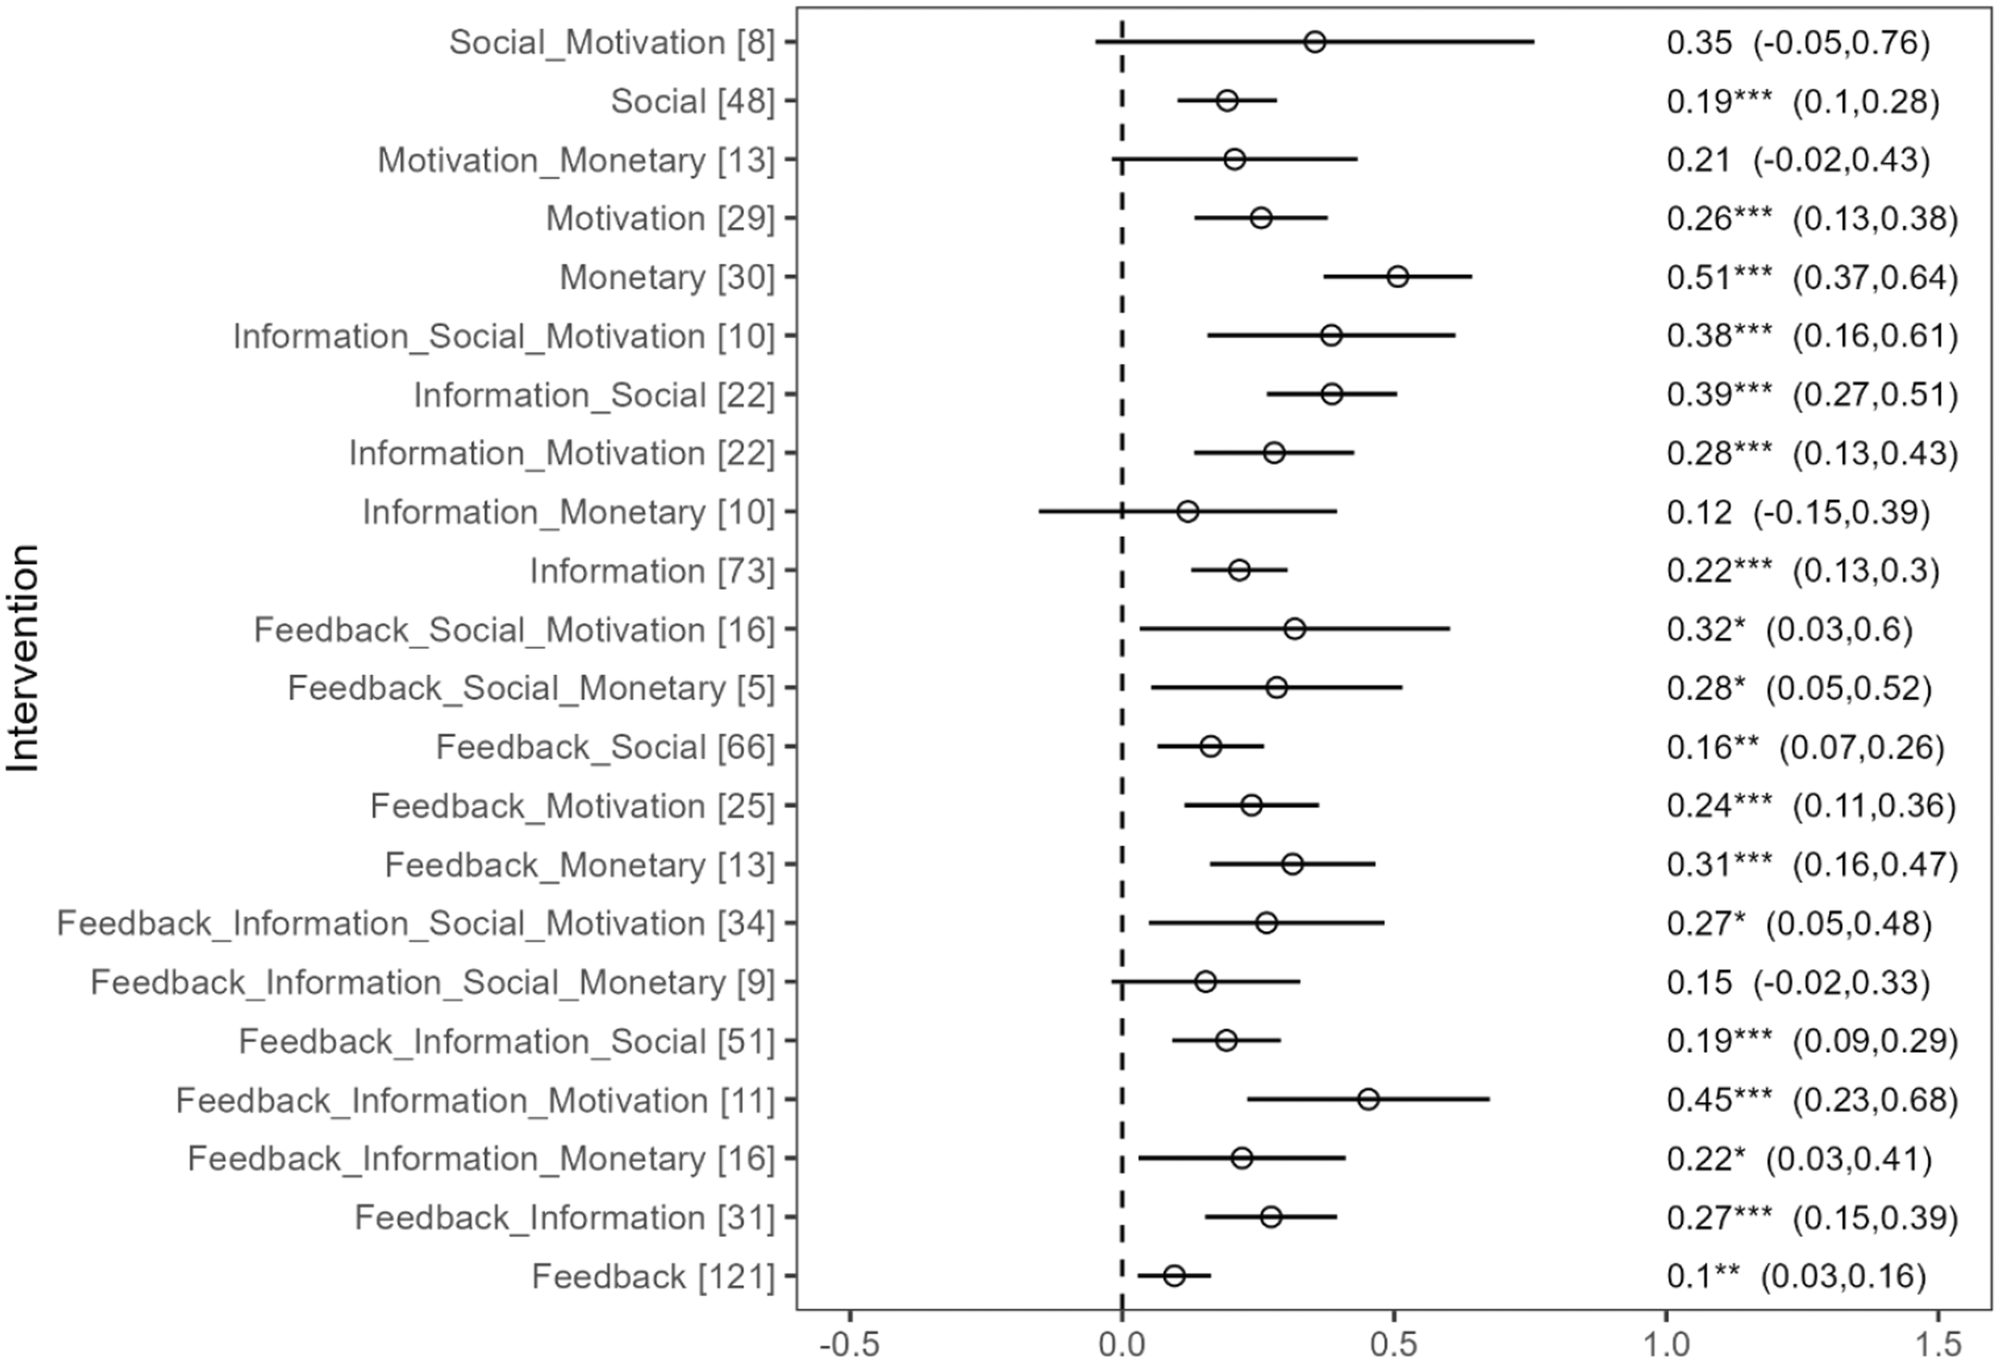
Estimated average effect size using a multilevel random effects model for each combination of interventions studied in the literature (not adjusted for publication or risk of bias). (1) Dependent variable is the Cohen's d for each reported effect size across studies. Effect size > 0 implies reduction in energy consumption. (2) The number of effect sizes in the data set for each combination is shown in the square parentheses. Combinations of interventions for which there were less than five observations have not been shown for brevity. Estimates for all possible combinations are provided in additional Table 3. The estimated between study and within study I2 from the multilevel model is 79% and 20%, respectively. Note that while global I2 in network meta-analysis is a summary metric for all heterogeneity across the network, I2 in multilevel meta-analysis partitions heterogeneity across different levels in the hierarchical data structure, providing targeted insights into sources of variance. Both statistics help interpret the reliability and consistency of meta-analytic results but are not directly comparable.
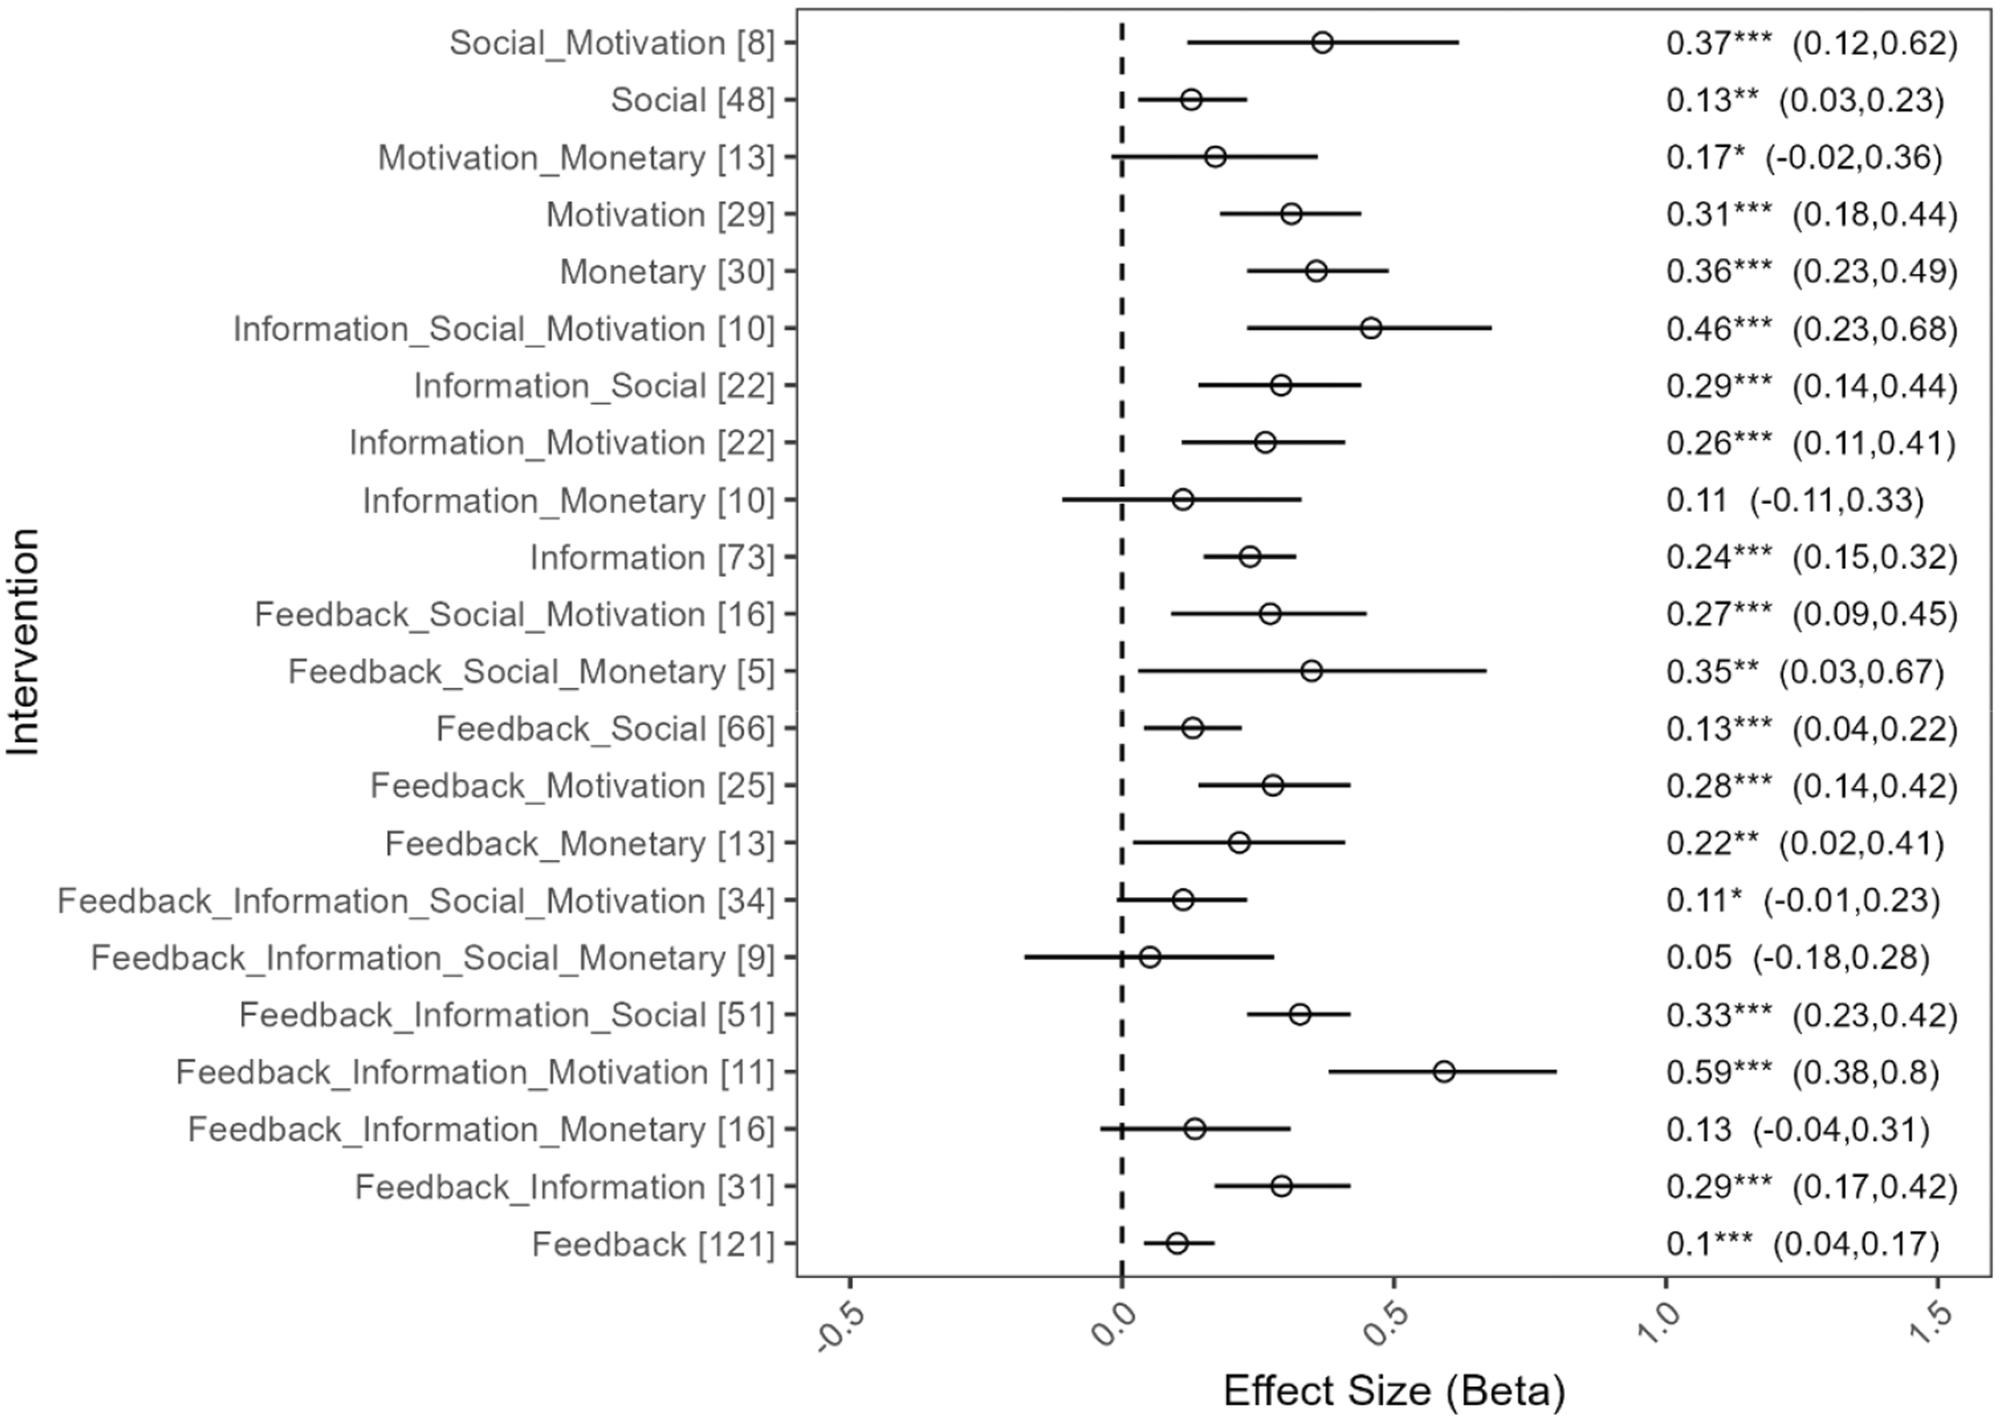
Estimated average effect size using a network meta-analysis model for each combination of interventions studied in the literature (not adjusted for publication or risk of bias). (1) Dependent variable is the Cohen's d for each reported effect size across studies. Effect size > 0 implies reduction in energy consumption. (2) The number of effect sizes in the data set for each combination is shown in the square parentheses. Combinations of interventions for which there were less than five observations have not been shown for brevity. Estimates for all possible combinations are provided in additional Table 3. The estimated global I2 is 7%.
We find evidence that many interventions are complementary in that the effect of a combination of the interventions is higher than the effect of individual interventions. For example, studies that combine feedback and information, interventions are complementary, but the effect is not additive in that the combined effect is lower than the sum of individual effects. The effect size (0.29; 95% CI = [0.17, 0.42]) is higher than the effect size for information and feedback studies individually. Adding motivation strategies to most intervention packages seems to increase effectiveness. In other cases, the effect size of the combination is about the same as the individual effects, indicating little gain from combining the interventions. For example, the effect size of feedback and social comparison (0.13; 95% CI = [0.04, 0.22]) is about the same as social comparison and feedback individually.
An additional useful aspect of NMA is the ability to probabilistically compare the size of the interventions studied using the SUCRA score for each intervention combination. Figure 7 presents the SUCRA score for the studied intervention packages, along with the average effect sizes derived using the multilevel model. Two combinations of interventions, namely, information-social-motivation and feedback-information-motivation, have the highest SUCRA score, along with social-motivation, which is also ranked higher. Monetary interventions have a higher score than other standalone interventions, reconfirming the results from the NMA and the multilevel model.
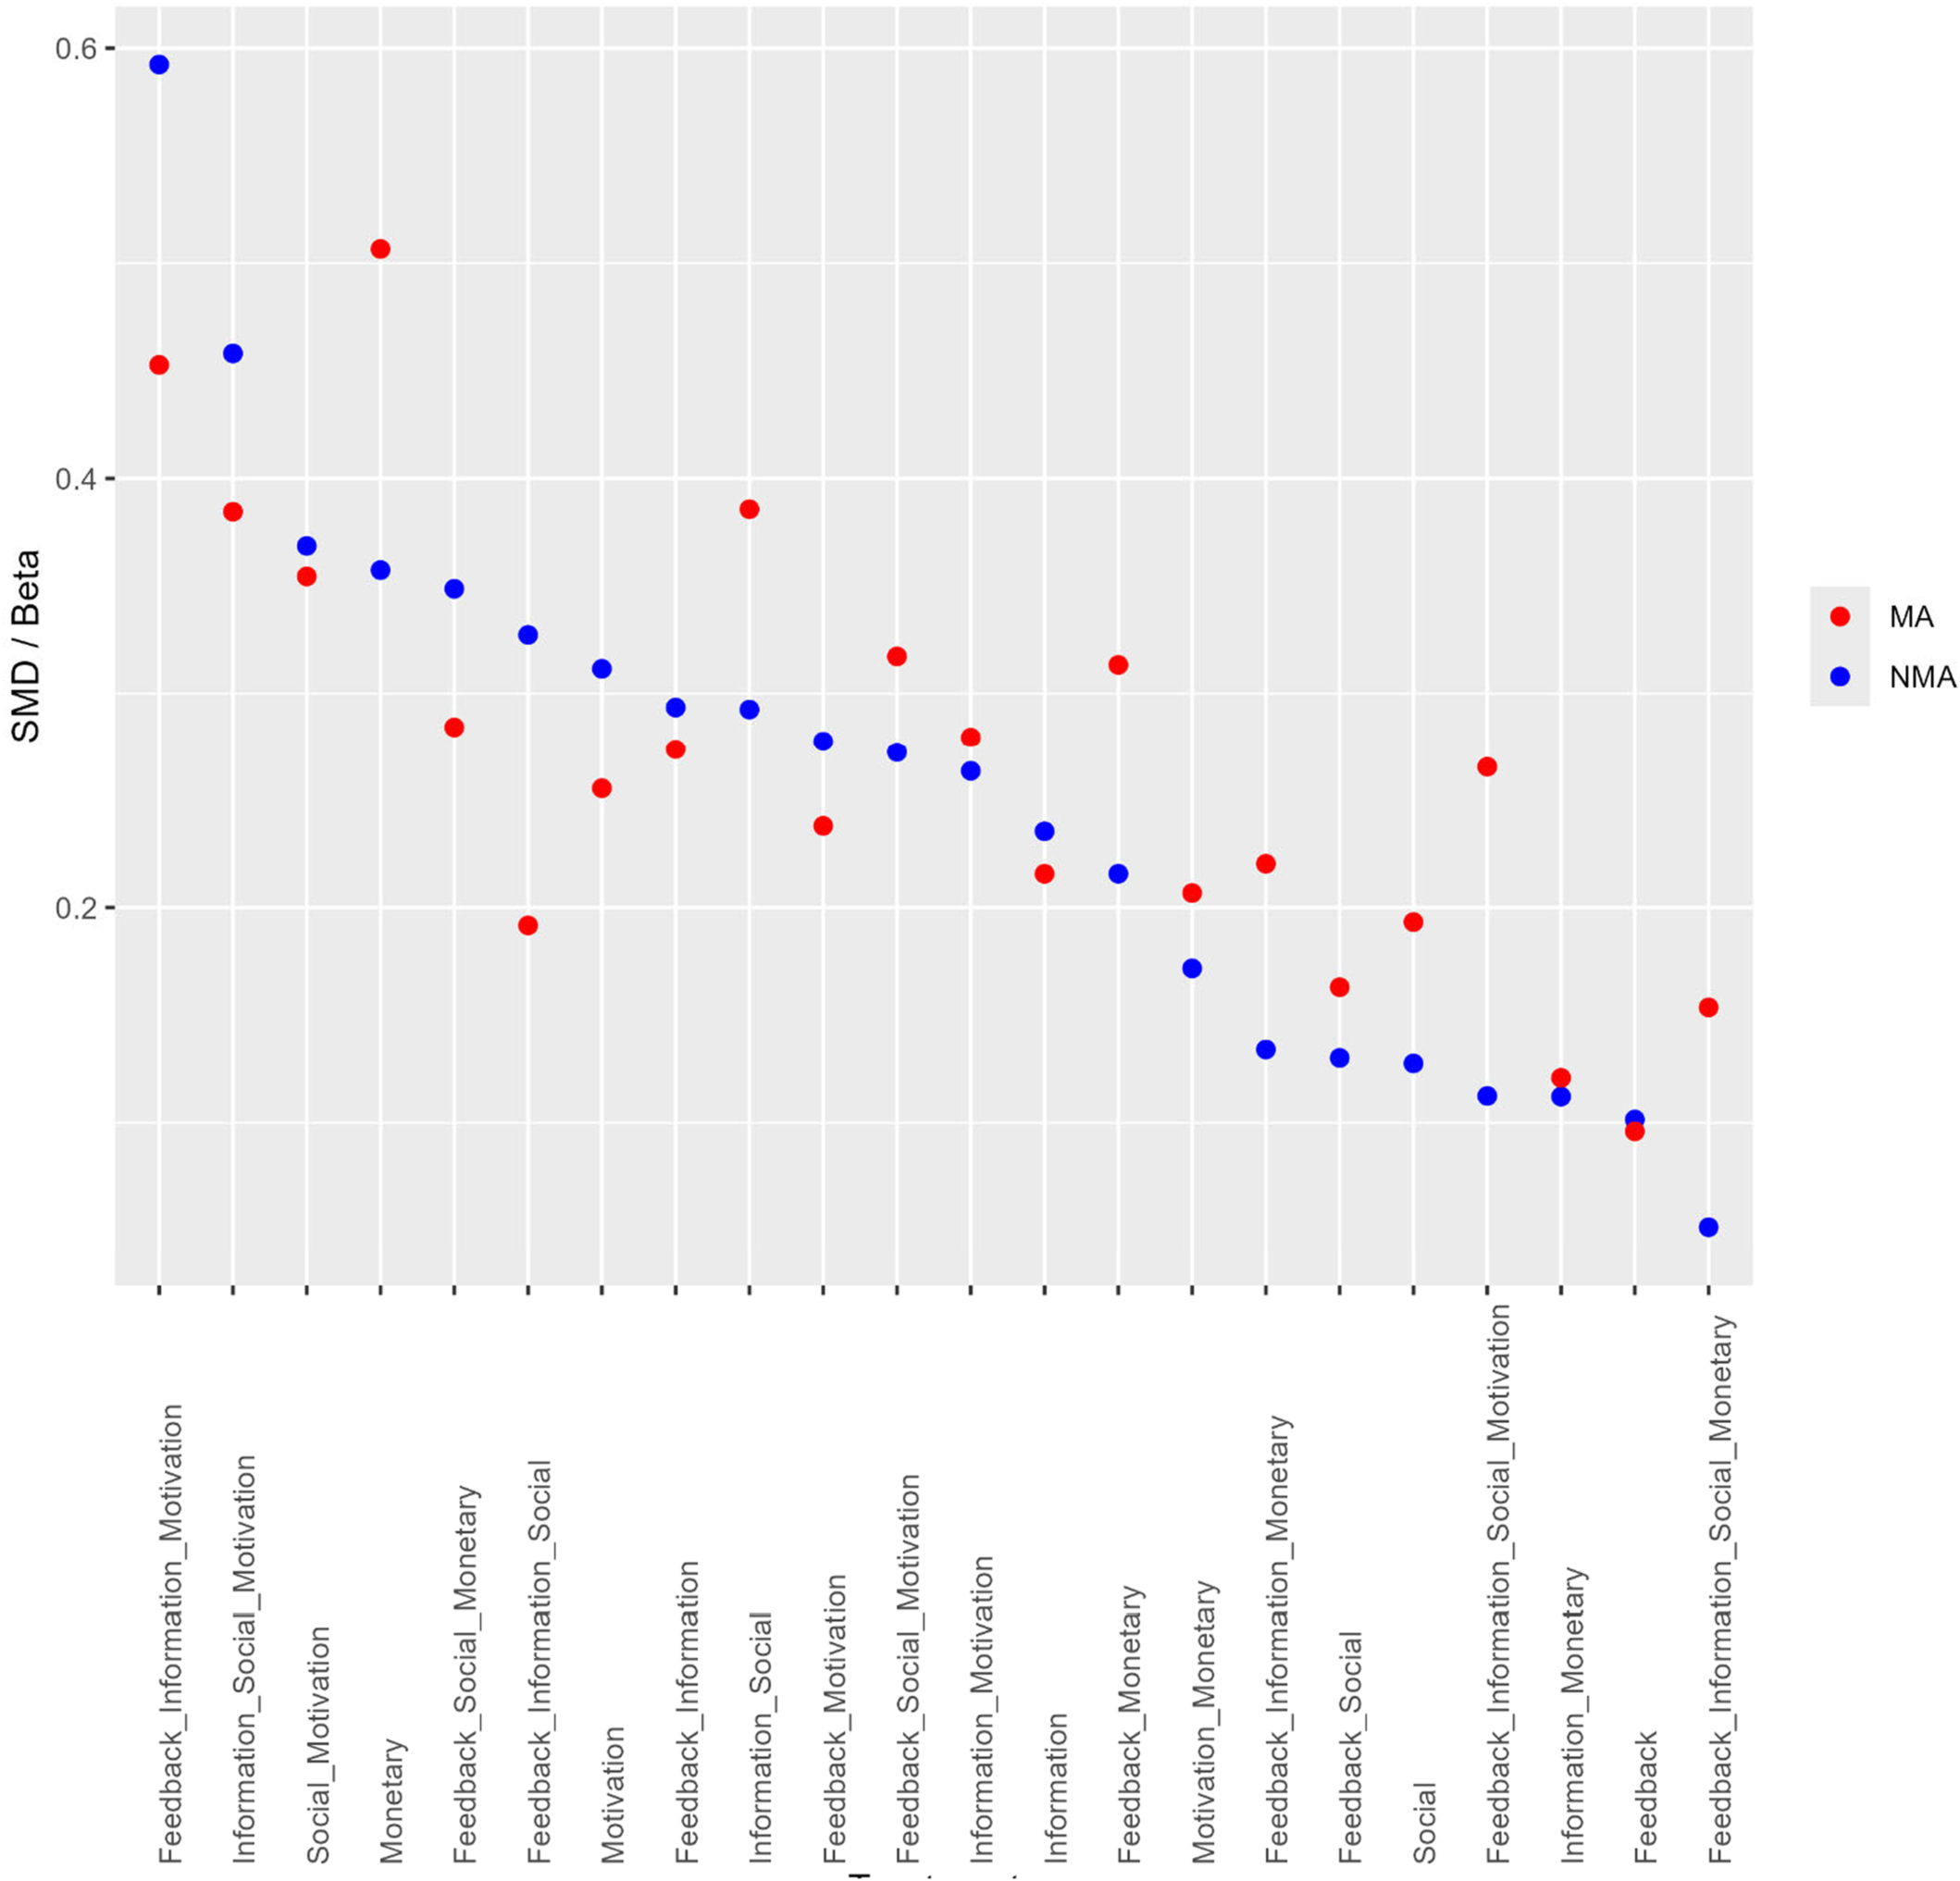
The SUCRA score for each combination of interventions studied in the literature, as obtained from the network meta-analysis model, along with the estimated average effect size using a multilevel random effects model for each combination.
Discussion
Summary of Main Results
Our meta-analyses of 192 studies and 663 effect sizes that provide estimates of the relationship between behavioral, monetary, and information interventions and reduction in energy consumption of households finds that overall, these interventions have a statistically significant, average effect size of Cohen's d = 0.22, or Cohen's d = 0.13 on applying the PEESE adjustment for publication bias.
Funder and Ozer (2019) provide updated benchmarks for interpreting effect sizes in psychology that are relevant here: an effect-size r of 0.05 (d = 0.10) indicates an effect that is very small for the explanation of single events but potentially consequential in the not-very-long run, an effect-size r of 0.10 (d = 0.20) indicates an effect that is still small at the level of single events but potentially more ultimately consequential, an effect-size r of 0.20 (d = 0.40) indicates an effect of medium size that is of some explanatory and practical use even in the short run and therefore even more important, and an effect-size r of 0.30 (d = 0.63) indicates an effect that is large and potentially powerful in both the short and the long run.
However, we also note that some intervention or their combinations yield substantially larger impacts—especially when considered at scale. We find that monetary incentives have a large average effect (0.36), along with motivation (0.31) and information (0.24). Combining monetary, behavioral, or information interventions can also increase effectiveness, even though the effect is not additive in that the combined effect is lower than the sum of individual effects. Combinations like information-social-motivation (0.38) and feedback-information-motivation (0.32) have high average effects. Among the behavioral interventions, while fewer studies have investigated motivation techniques as compared to social comparison and feedback, the results seem promising: motivation interventions by themselves or in conjunction with other interventions tend to have a higher impact. However, we should not just assume that more interventions mean bigger impacts, as the effect size of some combinations is about the same as individual effects.
What would the average effect reported in terms of Cohen's d above imply in terms of reductions in energy use? We try to provide a sense of this by calculating the average effect size both in terms of Cohen's d and percentage change in energy consumption for the subset of observations that directly report a reduction in energy consumption in percentage terms. For this subset of 397 observations, the average intervention effect is Cohen's d = 0.26 or 6.6% when expressed as a reduction in energy consumption. The average effect corrected for publication bias is Cohen's d = 0.15 or 4.6% when expressed as a percentage change in energy consumption.
Overall Completeness and Applicability of Evidence
This review searched for a wide sources of academic and nonacademic sources to create the most comprehensive data set of studies on behavioral, information, and monetary interventions for reducing energy consumption. The review also assesses how publication bias and reporting biases can affect the results obtained from studies. However, the language of the search query was English and tends to be predominantly from experiments performed in English-speaking countries. This could lead to biases if results in non-English speaking countries, importantly, Latin America, differ significantly from the countries included in our set.
Quality of the Evidence
The evidence synthesized in this review was of varying quality. Most of the studies that we identified implemented some form of randomization and used robust difference-in-difference study designs. However, the rigor of the statistical methods used varied across studies. Our ROB analysis also highlights the presence of methodological weaknesses across the included studies. Most notably, high ROB related to confounders, detection, and outcome reporting threatens the internal validity and reliability of synthesized findings (see Table 7). As such, interpretation of pooled results should be approached with caution. The potential for publication bias—where studies with null or negative findings are less likely to be published—further compounds these concerns and may skew the overall conclusions of the review. These limitations reinforce the need for transparent reporting, robust study designs, and standardized ROB assessments in future research.
Potential Biases in the Review Process
We were limited by time and financial resources in conducting this living review. While we try to ensure consistency and quality using a range of ML approaches and double-coding samples of our data set, we are unable to double-code all the studies, including the ROB assessments. We regularly checked for agreement between the different coders, but there could nevertheless be systematic differences in coding by different coders that can be addressed by double-coding the entire set of studies if resources become available in the future.
To use NMA to investigate the heterogeneity in effect sizes, we checked if our data met the transitivity and consistency assumptions. We assessed transitivity qualitatively by reviewing study characteristics across important effect modifiers identified by Khanna et al. (2021), and found moderate homogeneity in studies across interventions, though no major systematic differences were observed that would invalidate our results. Our star-shaped data set lacked any loops of evidence, so the usual statistical methods for checking consistency could not be applied. Instead, consistency was assessed by global statistical heterogeneity quantified using the I2 statistic, with a common heterogeneity parameter incorporated in the random-effects model. The I2 estimate for our network is 7%—likely due to contextual or methodological diversity—but is not so large as to undermine the overall findings.
Agreements and Disagreements With Other Studies or Reviews
The average effect size of the studies' interventions, along with intervention combinations, is broadly in line with those reported by Khanna et al. (2021), but provides a much more fine-grained comparison between various interventions and intervention packages. Unlike Delmas et al. (2013), who find that pecuniary feedback and incentives lead to a relative increase in energy usage rather than induce conservation, we find monetary incentives to be the most effective strategy. In this regard, the findings of this review are more akin to those of Buckley (2020). The review also confirms earlier findings by Delmas et al. (2013) that strategies providing information (including individualized audits and consulting) are comparatively more effective for conservation behavior than strategies that provide historical, peer comparison energy feedback. Javaid et al. (2022) have also found that behavioral interventions have a small to moderate effect in transport literature, and the need to complement behavioral interventions with other techniques (in this case, infrastructure). However, Lohmann et al. (2024) find that in the food domain, structural choice architecture interventions prove equally, if not more, effective than monetary incentives. The review also confirms publication bias in the literature reported by Buckley (2020) and adjusts the average effect sizes reported for publication bias, though we note that adjustment for publication bias is more difficult in the presence of high heterogeneity.
Authors' Conclusions
Implications for Practice and Policy
Our analysis finds that behavioral, monetary, and information interventions on average have a small to moderate effect, corresponding to 4%–6% of on energy consumption of households, though some intervention combinations have a larger impact. Ultimately, the practical consequences of the average effect sizes reported in this review, however, depend on at least three factors. First, consideration should be given to how often a person makes decisions that could be influenced by the interventions under investigation (Funder and Ozer 2019). For example, a widespread introduction of energy feedback would not only influence one purchase decision but could potentially have a cumulative effect on many different purchase decisions, which would significantly increase the actual expected effectiveness of an intervention. Second, the scalability and costs of interventions are important. A relatively cheap and easy-to-implement intervention that can be rolled out in such a way that it can influence the decisions of millions of people is to be evaluated differently from an intervention that is rather costly and resource-intensive to implement. Thirdly, interventions may differ strongly in their welfare effects (Allcott et al. 2022; Allcott and Kessler 2019), which, for example, incorporate the actual reduction in externalities, such as greenhouse gas emissions, achieved by the intervention, the cost that those who are affected by the intervention incur when changing their behavior, that is, the potentially lower comfort from curtailing energy usage in response to higher prices, potential effect heterogeneity and any other intervention effects that affect individual utility. Hence, the estimated meta-analytic average effects may serve as a good starting point for assessing the potential of interventions to promote the adoption of efficient appliances, but to increase the informative value of meta-analyses for such questions, as also recommended in Andor and Fels (2018), studies should be more transparent about the costs of interventions, scalability, and possibly welfare effects, so that these aspects can also be included in the quantitative research synthesis.
Implications for Research
Our findings support the idea that such interventions should not be looked at only individually but rather as packages to increase effectiveness. Smart packaging can ensure that the overall effect of a portfolio of well-integrated interventions is larger than the effect of individual interventions. While some mechanisms as to how various interventions interact have been suggested in the literature (Stern 2020; Wolske and Stern 2018), further research is needed to test these hypotheses, to harvest synergies and avoid possible trade-offs while combining interventions.
Our NMA was hindered by the star shaped geometry of the evidence. More studies that compare and contrast different interventions and their combinations directly, rather than always to a control group, can also help answer the question of which intervention combinations can enable more meaningful use of advanced synthesis methods like NMA that can then also help compare untested combinations of interventions.
The fast-growing literature on behavioral, information, and monetary interventions in household energy consumption makes this field a fitting case study for a “living” review assessment. Of the 663 effect sizes used for synthesis, about half come from studies produced after 2020 that were not included in previous reviews on the topic. We will continue to collect evidence and update the data set over the next 2 years as envisaged in the plan for the “living” review. However, there are significant challenges with consistently updating a review, most importantly, in terms of maintaining consistency in the identification and coding of studies, given resource constraints and changing personnel. Applying ML algorithms helped us significantly reduce the manual effort involved in identifying the relevant literature. Recent advances in AI and ML could, in the future, relieve reviewers from even more workload. However, they would need to be thoroughly evaluated, and reporting standards adjusted to avoid compromising review quality.
Author Contributions
Content: Tarun M. Khanna, Diana Danilenko, Mark Andor, Tim Repke, Julian H. Elliott, Max Callaghan. Systematic review methods: Jan C. Minx, Julian H. Elliott, Tarun M. Khanna, Diana Danilenko, Tim Repke, Max Callaghan. Statistical analysis: Tarun M. Khanna, Qianyi Wang, Diana Danilenko. Information retrieval: Diana Danilenko, Tim Repke, Luke A. Smith, Bhumika T. V., Aditya Narayan Rai, Jorge Sanchez.
Footnotes
Acknowledgments
The authors would like to acknowledge Jeremey Grimshaw and Vivan Welch for their guidance throughout this review, especially during the formulation of the review protocol. The helpful comments by the reviews of the protocol for this review are much appreciated.
Conflicts of Interest
Mark Andor has been involved in the development of relevant interventions, primary research, and prior published reviews on the topic. Tarun M. Khanna, Jan C. Minx, and Max Callaghan have published prior reviews on this topic. The other authors declare no conflicts of interest.
Plans for Updating This Review
We plan to continuously screen the new literature emerging in the field. The search queries will be run every month on Scopus and WOS, the two databases that constitute the largest source of literature for our analysis. Using the same ML algorithm that we used for the baseline review, we will rank order and screen at least the top 10% of all as yet unscreened documents every 2 weeks. Any relevant studies found will be screened and coded after critical appraisal. We will upload the data from the newly coded studies monthly on an open-source platform (GitHub). The appropriateness of the frequency of screening will be evaluated after the first annual update, and the protocol will be modified accordingly. The process for updating the review is shown in  . We have secured resources and plan to publish one baseline review (2025) and two annual updates (2026 and 2027). The annual update in 2027 will include studies published till December 2026.
The search queries on the remaining databases will be run once every year. The results from these searches will be rank-ordered using the ML algorithm. The statistical stopping criteria developed by Callaghan and Müller-Hansen will be applied to all search results (re-ranked in the order they would have been seen had all been available, including results from previous searches) until we can reject the null hypothesis that we have missed our recall target of 95% within a pre-specified statistical confidence interval. At this point, the screening will be stopped. The newly included studies will be coded. We plan to re-run the analysis on an annual basis. The updated analysis will feed into an updated manuscript that will be submitted to Campbell Systematic Reviews for peer review and a draft published as a pre-print on the online repository.
Differences Between Protocol and Review
The review protocol stated that we would first standardize the effects by converting the estimates of energy reduction reported by each study to semi-partial correlation coefficients or d-based effect sizes, as appropriate, and then convert them to Fisher's Z. It was envisaged that the final analysis would be in terms of Z scores. However, the software packages for implementing Network Meta-Analysis only work with SMD like Cohen's d or Hedge's g. We therefore converted all the effect sizes to Cohen's d for the purpose of this analysis. No other significant departures from the protocol are reported.
Sources of Support
We refer to three broad categories of interventions in this review: monetary, behavioral and information interventions. The more detailed typology in further breaks behavioral interventions into feedback, social comparison and motivation interventions. This classification of interventions in five categories is then used for analysis in the subsequent sections.
Supplementary Material
Please find the following supplemental material available below.
For Open Access articles published under a Creative Commons License, all supplemental material carries the same license as the article it is associated with.
For non-Open Access articles published, all supplemental material carries a non-exclusive license, and permission requests for re-use of supplemental material or any part of supplemental material shall be sent directly to the copyright owner as specified in the copyright notice associated with the article.
