
Abstract
We tested the possibility that the five–factor model of personality is associated with three measures of body weight and with changes in their levels over time and that these associations are gender specific. The study was conducted at two points of time, Time 1 (2664 participants) and Time 2 (1492 participants), over approximately 4 years, controlling for gender, age, education, and having a chronic disease. Body weight was assessed by body mass index, waist circumference, waist–to–hip ratio, and the five–factor model by Saucier's Mini–Markers. Cross–sectional regression results indicated that conscientiousness was negatively associated with the three body weight measures, whereas neuroticism and extraversion were positively associated with the three body weight measures. The longitudinal regression results indicate that extraversion was associated with an increase in two of the body weight measures. Neuroticism was associated with increase in all three body weight measures and more strongly for women than for men. Openness was associated with a decrease in all three body weight measures for women, but this association was not significant for men. These findings help identify personality traits that lead to risk of weight gain and point to the modifying role of gender. Copyright © 2013 John Wiley & Sons, Ltd.
The prevalence of obesity in the Western world has reached alarming proportions, with some referring to it as the 21st century's pandemic (e.g. Behn & Ur, 2006; Caballero, 2007). Overweight is defined as a body mass index (BMI) that exceeds 25 (BMI = weight in kilogrammes divided by the square of the height in metres). In the USA, about two–thirds of the population is overweight (Ogden et al., 2006). A similar prevalence was found in a representative sample of nine European countries (Pischon et al., 2008) and in Israel (Keinan–Boker, Noyman, Chinich, Green, & Nitzan–Kaluski, 2005). Measures of body weight reflect long–term mechanisms and underlying influences (Haslam & James, 2005), some of which are likely to include enduring personality traits (Ozer & Benet–Martinez, 2006). The linkages between personality traits and body weight are complex and likely to involve physiological as well as cognitive, emotional, and behavioural mechanisms. For example, personality traits determine physiological reactivity to environmental stimuli (Robinson, 2007) that may contribute to increases in adiposity (Vicennati, Pasqui, Cavazza, Pagotto, & Pasquali, 2009). Cognitions may be important in promoting healthy behaviours, such as physical exercise or eating a balanced diet (e.g. Conner & Norman, 2005), whereas emotions are related to overeating behaviours (Evers, Stok, & de Ridder, 2010). The present study addresses the links between personality traits and body weight measures. We examined the concurrent relationships between personality traits and body weight. We further test whether personality factors are associated with change in body weight over time.
Personality traits were conceptualized in our study from the five–factor model (FFM) of personality, which has subsumed most personality traits under five dimensions: extraversion (E), agreeableness (A), conscientiousness (C), neuroticism (N), and openness to experience (O) (McCrae & John, 1992; Saucier & Goldberg, 2001). The possible mechanisms linking personality and body weight vary and include cognitive, behavioural, and psycho–physiological pathways. Behavioural pathways suggest that personality traits are a strong predictor of health behaviours such as over eating and inactivity (e.g. Bogg & Roberts, 2004). Cognitive pathways suggest that personality traits influence health–related decision–making styles (Flynn & Smith, 2007) or risk evaluation (e.g. Hampson, Andrews, Barckley, Lichtenstein, & Lee, 2006). Psycho–physiological pathways suggest that personality traits influence individuals‘ stress appraisals and coping mechanisms (Caspi & Roberts, 2001; Segerstrom, 2000), which may lead to hormonal changes associated with potentially adverse physiological outcomes, including increased obesity (Magiakou & Chrousos, 2005). The FFM has been validated in many cross–cultural studies (Saucier & Goldberg, 2001; Yoon, Schmidt, & Ilies, 2002), in different languages (Hendriks & Perugini, 2003), and with the use of a variety of assessment instruments (John, 1990). Although critics have pointed out several conceptual and methodological concerns associated with the FFM (Block, 2001), it has been the focus of most personality research (Ozer & Benet–Martinez, 2006).
Conscientiousness was consistently found, in both cross–sectional and longitudinal studies, to be associated with lower body weight (Brummett et al., 2006; Chapman, Fiscella, Duberstein, & Coletta, 2009; Hampson, Goldberg, Vogt, & Dubanoski, 2006; Magee & Heaven, 2011; Sutin, Ferrucci, Zonderman, & Terracciano, 2011; Terracciano et al., 2009). Increased body weight has also been associated with trait N. Neurotic individuals tend to have higher body weights when measured both concurrently (Chapman et al., 2009; Magee & Heaven, 2011; Sutin et al., 2011) and over time (Sutin et al., 2011; Terracciano et al., 2009). Another longitudinal study (Brummett et al., 2006) found both concurrent and over–time associations between N and body weight for woman only.
With regard to E, recent studies (Kakizaki et al., 2008; Sutin et al., 2011) found, albeit only in their cross–sectional analyses, that participants with higher levels of E had higher body weights compared with those with low levels of E. Another longitudinal study (Magee & Heaven, 2011) found E to be positively associated with an increased likelihood of obesity both concurrently and over time, whereas another longitudinal study found this association only in men (Brummett et al., 2006). Other studies found no associations between E and body weight (Chapman et al., 2009; Terracciano et al., 2009). One longitudinal study found higher levels of O to be associated with decreased body weight (Brummett et al., 2006), whereas other cross–sectional and longitudinal studies found no associations between O and body weight (Chapman et al., 2009; Magee & Heaven, 2011; Sutin et al., 2011; Terracciano et al., 2009).
The relationships between A and body weight measures are inconsistent. A recent study (Magee & Heaven, 2011) found that A was positively associated with obesity, albeit only in their cross–sectional analyses. However, other two longitudinal studies found that A was associated with a decrease over time in body weight measures (Brummett et al., 2006; Sutin et al., 2011), but another longitudinal study found no relationship at all (Terracciano et al., 2009). Another cross–sectional study (Chapman et al., 2009) found a positive relationship only in men.
The Present Study
In the present study, the relationship between personality and adiposity was broadly examined across different body weight measures. With the exception of two studies (Sutin et al., 2011; Terracciano et al., 2009), most previous research on personality and obesity have focused on one body weight measure only (primarily using self–reported weight), particularly on BMI, a general adiposity anthropometric indicator. Growing evidence suggests, however, that BMI might not be the most relevant measure of the effects of adiposity on health outcomes. Waist circumference (WC), an abdominal adiposity anthropometric indicator, has the strongest association with health risk indicators such as the metabolic syndrome (Shen et al., 2006), independently of BMI (e.g. Pischon et al., 2008). Another abdominal adiposity anthropometric indicator is the waist–to–hip ratio (WHR). WHR was recently introduced from the argument that it describes fat distribution better than WC. WHR was found to be the best adiposity risk marker for acute myocardial infarction (Yusuf et al., 2005). Therefore, in addition to BMI derived from staff–reported weight and height, we also tested whether personality shared similar relationships with WC and WHR, referring to them collectively as ‘measures of body weight’ when necessary for the sake of simplicity.
With most individuals, weight changes over time with the ageing process (Alfonzo–Gonzalez, Doucet, Bouchard, & Tremblay, 2006). In addition to concurrent associations, this study examined the longitudinal relationships between personality and body weight measures by testing whether personality traits are associated with changes in body weight over time. Longitudinal studies on FFM and changes in body weight over time are relatively sparse (Brummett et al., 2006; Sutin et al., 2011).
We hypothesized that N and E were positively associated with body weight at baseline and with increases in its level over time, whereas the opposite associations were hypothesized for C. In light of null or inconsistent results in previous studies, we explored the association between O and A with body weight measures without a priori hypotheses regarding our expected observations. We also examined the possible modifying role of gender. Qualitative and quantitative gender differences exist with regard to body morphology, distribution of body fat, weight–related biological mechanisms, and the development of chronic diseases (Haslam, 2005; Woods, Gotoh, & Clegg, 2003). Additionally, accumulating evidence shows gender differences in the relationships between personality and health–related outcomes (for a recent summary, see Mansdotter, 2010). Furthermore, the social meaning of body weight is decidedly different for the sexes (Friedman, Reichmann, Constanzo, & Musante, 2002). Results of previous longitudinal studies (e.g. Brummett et al., 2006; Hampson et al., 2006; Magee & Heaven, 2011; Sutin et al., 2011; Terracciano et al., 2009) that tested gender differences in the relationships between personality and body weight have been inconsistent, and the mechanisms underlying gender differences in these relationships are not yet sufficiently understood. Therefore, we formulated our hypotheses in a general manner and conducted an exploratory test of the moderating effect of gender on the associations of personality with levels of BMI, WHR, and WC.
The study was conducted on a large sample of participants and controlled for potential important confounders of gender, age, and education. Additionally, we controlled for respondents who self–reported having a chronic illness (e.g. cardiovascular disease) because their scores on the FFM or on measures of body weight were likely to be influenced by their health status (Friedman, 2000).
Methods
Participants
The design of the present study was prospective and included a baseline measurement (referred to here as T1) and follow–up (referred to here as T2) for approximately 44 months (SD = 17). Study participants (N = 2895) were employees who came to a medical centre for a routine medical examination (T1). Ninety–two per cent agreed (n = 2664) to participate.
Those who refused did not differ from study participants on any of the socio–demographic or biomedical variables evaluated. These examinations were provided as a subsidized fringe benefit. Thus, attrition between T1 and T2 could be due to change of employer, residence, or work location, totally unrelated to participation in the current study. Fifty–four per cent of those examined at T1 returned for a follow–up examination (T2) (n = 1492). We tested for attrition bias from T1 to T2. The personality traits of those examined at T1 who did not return for a follow–up examination did not differ from those who returned at T2. However, they were more likely to be male, older (near retirement age), and less educated. These findings are consistent with previous reports on attrition bias in health survey studies (e.g. Korkeila et al., 2001). These possible sources of attrition bias were controlled for in the data analyses, as explained later. The preceding rate of attrition is on par with those reported for other longitudinal studies (Ployhart & Vandenberg, 2010).
The sample that had complete data for the two waves consisted of 1492 participants (1016 men and 476 women). Respondents were, on average, 47.57 and 51.32 (SD = 9.72, 9.86) years of age, at T1 and T2, respectively. Men and women did not differ significantly in age. All had completed a mean of 15.83 and 16.22 (SD = 2.81, 2.68) years of education at T1 and T2, respectively.
Procedure
The study protocol was approved by the ethics committee of the Tel Aviv Sourasky Medical Center. Each participant was recruited individually by an interviewer, received an explanation regarding the survey's purpose, and was invited to participate. Confidentiality was assured, and each participant signed a written informed consent form. As part of the periodic health examination, each respondent provided a medical history and underwent blood sampling after an overnight fast, a physical examination by a physician, urinalysis, stress electrocardiogram, spirometry, and vision and hearing function tests. The results of these examinations and the responses to the study questionnaire were recorded and entered into a computerized database.
Measures
The study questionnaire included background, socio–demographic, occupational, psychological, and physical morbidity factors.
The five–factor model
Personality dimensions were assessed by the Big Five Mini–Marker scale (Saucier, 1994), which consists of 40 adjectives that measure five personality factors (eight for each factor): E, A, C, N, and O. Respondents were asked to indicate how accurately or inaccurately these adjectives describe them on a 9–point Likert scale ranging from 1 (extremely inaccurate) to 9 (extremely accurate). The Mini–Marker scale has been demonstrated to have adequate reliability and validity estimates (Saucier, 1994) and has been used in various countries and cultures (Armon, Shirom, & Melamed, 2012; Thompson, 2008). We chose this version to maintain the interest of participants and to minimize respondent refusal. We used the back–translation procedure for testing the reliability of our Hebrew translation of this instrument. Three independent judges assessed the adequacy of the translation, with an inter–rater reliability of .83. Confirmatory factor analysis confirmed the theoretically expected five–factor structure (for elaboration, see Armon et al., 2012). The Cronbach internal consistency reliabilities of the FFM (α range = .70–.80) were largely on par with those reported in the original version (Saucier, 1994), with those reported in a meta–analysis (Viswesvaran & Ones, 2000), and with other studies using the Hebrew version of the Mini–Marker scale (e.g. Avisar & Shalev, 2011).
Body weight measures
The BMI (kg/m2), WHR (cm), and WC (cm) were used as continuous variables. The body weight measures at both T1 and T2 were assessed by the same medical staff, using the same procedures at a single centre and laboratory.
Covariates
We controlled for gender, age, and years of education, as reported by the respondents at T1. Age has been consistently found to be associated with the FFM (e.g. Donnellan & Lucas, 2008) and body weight (e.g. Ogden et al., 2006). Education (years) has been found to be associated with both body weight (Chapman et al., 2009) and personality (O'Connor & Paunonen, 2007).
Following the criteria of previous studies (Donders, Roskes, & van der Gulden, 2007), we controlled for chronic disease on the basis of a self–reported diagnosis of diabetes, cancer, cardiovascular disease, respiratory disease (asthma, bronchitis, and chronic obstructive pulmonary disease), neurological disease (Parkinson's, multiple sclerosis, etc.), musculoskeletal complaints (neck pain and pain in the shoulder region or lower back), and rheumatic disease (e.g. rheumatoid arthritis), the most prevalent chronic diseases in Israel (Rennert & Peterburg, 2001). The decision to control for chronic disease was based on previous findings suggesting that the disease or the medication could impact body weight (Friedman, 2000). As an additional control variable, we counted the number of days between T1 and T2, referred to as the T1–T2 time lag.
Statistical analyses
The hypotheses were tested on the BMI, WHR, and BMI values at T1 and T2 using ordinary least squares (OLS) regressions (with
Results
The means and their standard deviations for the sample that had complete data for the two time waves 1 appear in Table 1. All criteria and predictors were systematically examined to detect outliers or non–normal distributions (i.e. skewness > 2.0 and kurtosis > 5.0); none was detected. For each of the study variables, we used a two–tailed t–test to test the significance of the mean differences between the male and female respondents and between T1 and T2 matching variables. The results appear in Table 1. In agreement with past research, E and A were higher for women (see review of Schmitt, Realo, Voracek, & Allik, 2008). However, contrary to past research, there were no gender differences in the mean scores on N and C. O was higher for men. Men were significantly higher than women on all body weight measures. Furthermore, with the exception of BMI and WC in the male sample, each of the T1 body weight measures was significantly different from the corresponding T2 values (p < .01). For men, WHR decreased significantly. For women, there was a significant increase from T1 to T2 in BMI and WC and a significant decrease from T1 to T2 in WHR.
Means and standard deviations (SD) of the study variables
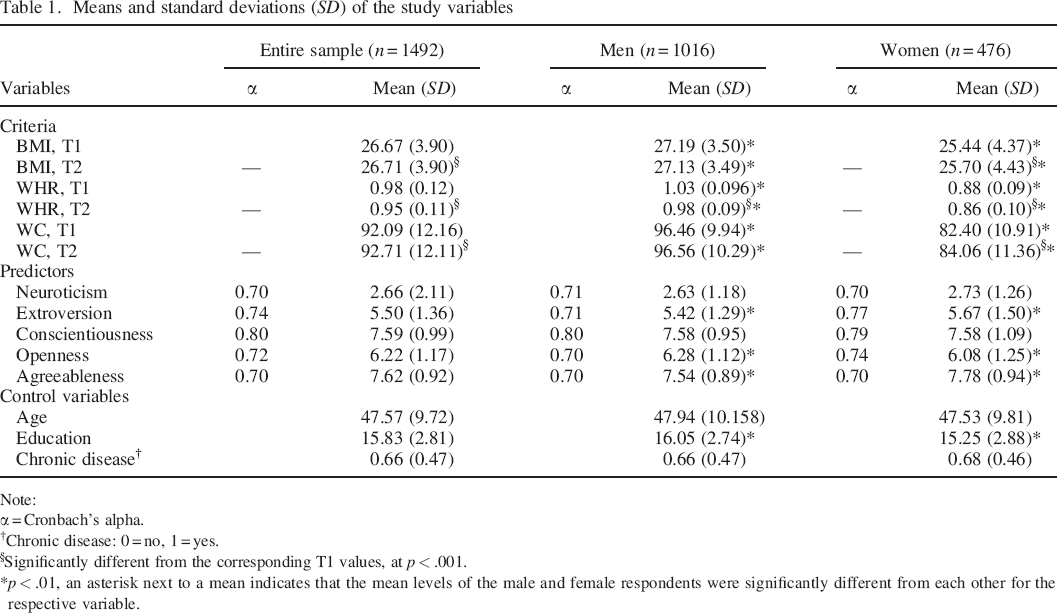
Note:
α = Cronbach's alpha.
Chronic disease: 0 = no, 1 = yes.
Significantly different from the corresponding T1 values, at p < .001.
p < .01, an asterisk next to a mean indicates that the mean levels of the male and female respondents were significantly different from each other for the respective variable.
The intercorrelation matrix of the study variables for the entire sample that had complete data for both waves 2 (also footnote 1) is given in Table 2. The BMI and WC consistency coefficients were found to be high (r = .91 and .83, respectively), whereas the consistency coefficient for WHR was found to be slightly lower (r = .64). The correlations between WC and BMI and between WC and WHR were significant at both T1 and T2 (r ranged from .77 to .80), whereas the correlations between BMI and WHR at T1 and T2 were significant but lower (r = .51 and .43, respectively).
Intercorrelations of all study variables
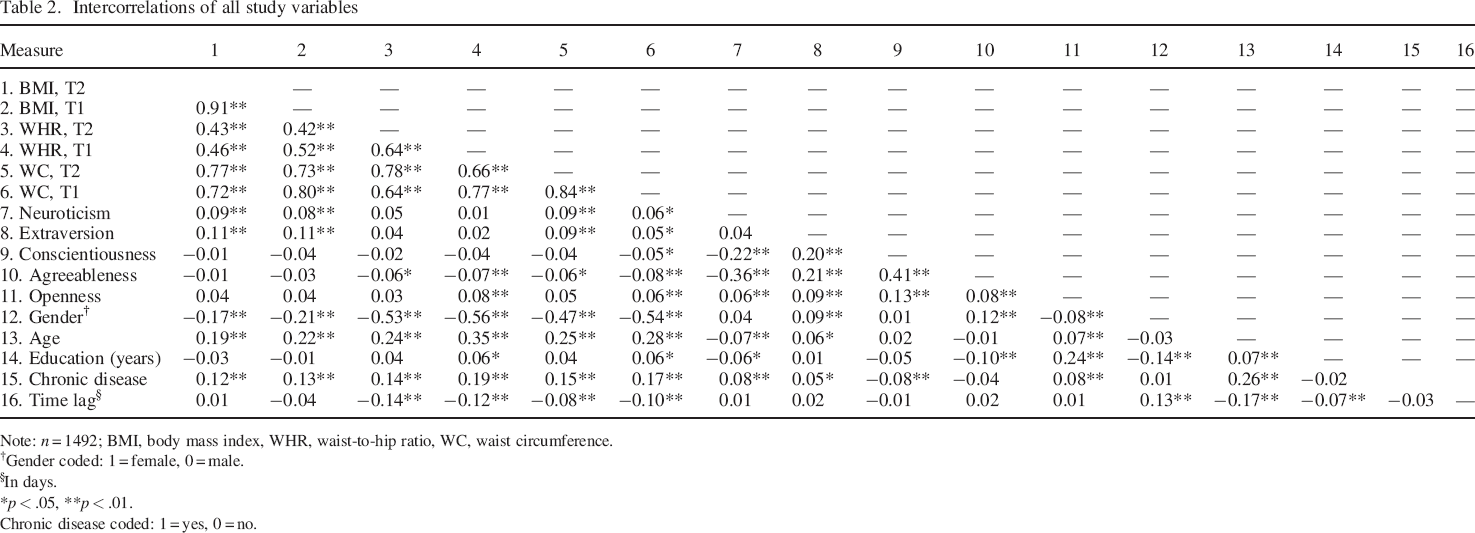
Note: n = 1492; BMI, body mass index, WHR, waist–to–hip ratio, WC, waist circumference.
Gender coded: 1 = female, 0 = male.
In days.
p < .05.
p < .01.
Chronic disease coded: 1 = yes, 0 = no.
The unadjusted correlations of personality traits and body weight measures, as reported in Table 2, are as follows: N was positively and significantly correlated with BMI and WC at T1 and T2 (r ranged from .06 to .09), and E was positively and significantly correlated with BMI at both T1 and T2 and with WC at T1 (r ranged from .05 to .11). A was negatively and significantly correlated with WHR and WC at both T1 and T2 (r ranged from −.06 to −.08), whereas O was negatively and significantly associated with WHR and WC only at T1 (r = .08 and .06, respectively). The associations between C and body weight measures at T1 and T2 were not significant.
The results of the OLS regression analyses testing the hypotheses that personality traits are associated with body weight measures after controlling for the aforementioned covariates are reported in Table 3. N was positively associated with all three measures of body weight at baseline (T1) only (β = .05 and .05, p < .05, for BMI and WHR, respectively; β = .06, p < .01, for WC). E was positively associated with baseline levels of all three body weight measures (β = .10 and .06, p < .01, for BMI and WC, respectively; β = .05, p < .05, for WHR) and with change from T1 to T2 in WHR levels (β = .05, p < .05) and WC (β = .06, p < .01). C was negatively associated with all three measures of body weight at baseline only (β = −.05 and −.05, p < .05, for BMI and WHR, respectively; β = −.06, p < .01, for WC). The significant unadjusted correlations of A and O with the criteria, as presented in Table 1, were decreased by the addition of gender as a covariate. The effect sizes, based on the ΔR2 of the FFM in the OLS regressions, were significant for all criteria (excluding the criterion of T2 levels of WHR) and ranged from 1% to 2%.
Hierarchical regressions predicting T1 and changes from T1 to T2 in levels of BMI, WHR, and WC by the control variables, and the FFM traits for the entire sample
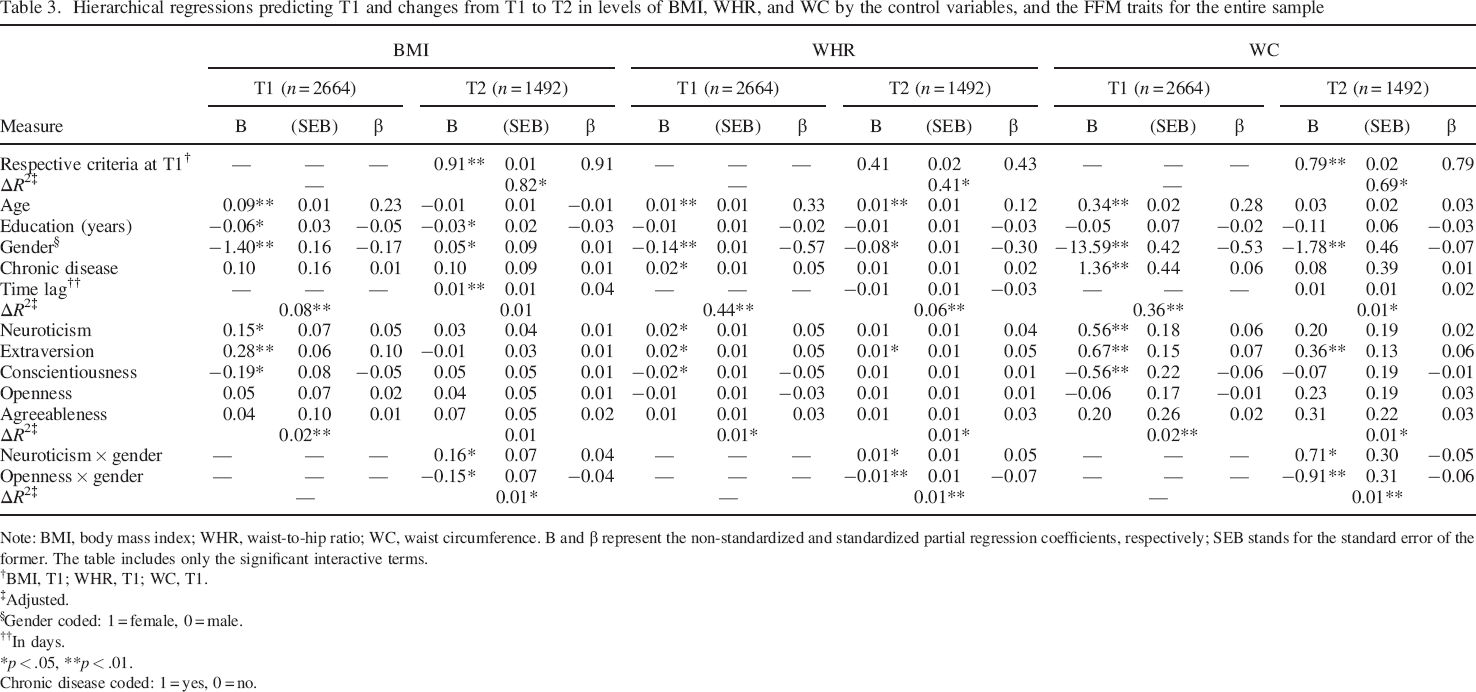
Note: BMI, body mass index; WHR, waist–to–hip ratio; WC, waist circumference. B and β represent the non–standardized and standardized partial regression coefficients, respectively; SEB stands for the standard error of the former. The table includes only the significant interactive terms.
BMI, T1; WHR, T1; WC, T1.
Adjusted.
Gender coded: 1 = female, 0 = male.
In days.
p < .05.
p < .01.
Chronic disease coded: 1 = yes, 0 = no.
Gender was found to have a moderating effect. It interacted with N and O in influencing change from T1 to T2 in all three measures of body weight. The significant interactions found were plotted according to Aiken and West (1991). This plotting (not shown) indicated that N was associated with increases in all three body weight measures and more strongly for women than for men. O was associated with a decrease in all three body weight measures and more strongly for women as well. The effect sizes, as based on the ΔR2 of the interactions of gender with the FFM in the OLS regressions, were rather small but significant (ΔR2 = 0.01).
To determine whether the associations of N and O with body weight measures were significant for both genders, we stratified all analyses by gender (footnote 1). For women, N was positively associated with change from T1 to T2 in levels of all three measures of body weight (β ranged from .06 to .12, p < .01). For men, the associations of N with change from T1 to T2 in body weight measures was significant only for WHR (β = .06, p < .05). The association of O with change from T1 to T2 in body weight measures was positive and significant for women (β = −.10 and −.07, p < .01, for WHR and WC, respectively, and β = −.05, p < .05, for BMI) and not significant for men. Age, years of education, or having a chronic disease did not moderate the association between personality and body weight measures.
Discussion
The present prospective study was designed to facilitate our understanding of the role of personality in the aetiology of obesity by examining whether the FFM is concurrently associated with three body weight measures, BMI, WC, and WHR and with changes in their levels over a 4–year period, as well as testing the possibility that these associations are gender dependent. The findings show that C was inversely related to body weight measures at baseline, but not with changes in their levels over time. N was positively associated with body weight measures at baseline and with an increase in their levels over time, although the over–time associations were stronger for women. E was positively associated with body weight measures at baseline and with increase in their levels over time. O was associated only with over–time decreases in body weight measures only for women. It was also important to note that the preceding associations were observed for at least two of the body weight measures, thus providing a cross–validation of the findings.
In contrast to most previous studies on FFM and body weight measures that relied on a self–reported general measure of adiposity (BMI), the current study provides important evidence on how the FFM also contributes to key criteria of abdominal obesity (WHR and WC) measured objectively by medical staff. Abdominal obesity is an important contributor to certain diseases and bodily disorders such as insulin resistance, the metabolic syndrome, type 2 diabetes, chronic inflammatory processes, atherosclerosis, and subsequent cardiovascular disease (Black, 2003). Focusing on three different measures of body weight as an outcome of personality is particularly important in the modern world where increasing levels of obesity in the population have become a serious societal problem, with critical health implications (e.g. Judge & Cable, 2011; Klein et al, 2007; Shapiro, King, & Quinones, 2007).
The results of the current study point to the significance of testing health–related physiological indicators as outcomes of personality using a longitudinal design. Most studies on FFM and body weight have been cross–sectional in nature, which has limited scholars‘ ability to infer conclusions about causality and change (e.g. Chapman et al., 2009). Time represents a necessary consideration because, generally, changes in health or physiological outcomes take longer to occur than changes in psychological or behavioural outcomes. Some of the dynamic changes in the outcome measures cannot be detected in a cross–sectional design. Indeed, our findings indicated that the pattern of association between personality traits and the outcome measures changed somewhat over time. Moreover, gender differences in these associations were uncovered only when changes over time in the outcome variables were tested. The study–specific results are discussed in the following.
Conscientiousness was inversely associated with body weight measures, which is consistent with previous research (e.g. Sutin et al., 2011; Terracciano et al., 2009). C, which is represented by goal directedness and self–discipline, influences body weight primarily by leading to patterns of healthy behaviours (Friedman, 2000), such as dietary control and physical exercise (Haslam & James, 2005; Ozer & Benet–Martinez, 2006). However, in contrast to our expectation and to the results of other longitudinal studies (e.g. Brummett et al., 2006), we were unable to confirm the hypothesized associations of C with change over time in levels of WC and the other body weight measures (BMI and WHR). This may be due to potential mediation mechanisms, possibly related to health practices or metabolic factors, not included in the current study.
In agreement with our expectation and with results of previous studies, N was positively associated with body weight measures at baseline (Chapman et al., 2009; Sutin et al., 2011). N is characterized by the tendency to view the world pessimistically and interpret many stimuli as stressful (McCrae & John, 1992). The literature on human physiology suggests that the experience of stress would result in hormonal changes associated with potentially adverse physiological outcomes, including increased obesity (Magiakou & Chrousos, 2005). Thus, we argue that over time the experience of stress as experienced by those high on N contributes to increases in stress hormones with potential adverse effects on physiological indicators such as abdominal obesity (e.g. Black, 2003; Chrousos, 1995). The experience of stress, primarily through perturbation of the hypothalamic–pituitary–adrenal (HPA) axis, appears to contribute to increases in abdominal obesity through the accumulation of fat tissue (Kyrou, Chrousos, & Tsigos, 2006). Chronic exposure to stress and HPA axis activation can be potentially damaging because of the prolonged glucocorticoid (cortisol hormone in humans) action on the expression of important genes implicated in several crucial metabolic pathways, which is expected to progressively increase abdominal obesity and decrease lean body (muscle and bone) mass (Black, 2003; Kyrou et al., 2006; Magiakou & Chrousos, 2005). In addition, N may lead to poor health habits (e.g. physical inactivity and poor dietary control) (Smith & MacKenzie, 2006), which in turn, are causally linked to higher body weight (Bjorntorp, 2001; Torres & Nowson, 2007). However, in support of another longitudinal study (Brummett et al., 2006), our prospective analysis revealed that when measured over time, the association of N with increase in body weight is stronger for women. This gender–dependent association may be a result of the following circumstances. First, women, in general, report more weight stigmatization than men do and at lesser degrees of being overweight (e.g. Cossrow, Jeffery, & McGuire, 2001) and, therefore, are more exposed to social stresses. Second, women tend to experience heightened physiological reactivity to social stressors as compared with men (Kudielka & Kirschbaum, 2005). Thus, the combination of these may lead them to subsequent higher weight gain compared with men.
Additionally, as expected and in concurrence with previous cross–sectional and longitudinal studies (Kakizaki et al., 2008; Magee & Heaven, 2011; Sutin et al., 2011), we found that E was positively associated with all three measures of body weight and with increases in levels of WHR and WC over time. In this respect, our findings support the ‘reinforcement sensitivity theory of personality’ (Gray, 1990). According to Gray, E is referred to as an appetitive–positive affect system devoted to foraging and reward seeking (Carver & White, 1994), which can be implicated in a higher–calorie diet (e.g. Jallinoja, Pajari, & Absetz, 2010) and exaggerated activation of the HPA axis, which, as noted earlier, appears to contribute to increases in abdominal obesity (Kyrou et al., 2006). An alternative explanation for these results is that individuals with high positive mood states are more likely to be reckless, to perceive themselves as less vulnerable to undesirable health conditions, and to adopt maladaptive health behaviours (for reviews, see Grant & Schwartz, 2011; Gruber, Mauss, & Tamir, 2011), which might result in higher body weight levels.
Our study results also revealed that the associations of O with changes over time in levels of body weight measures were moderated by gender, such that O was associated with a decrease in body weight over time for women only. We may speculate that different social roles and challenges for men and women may account for these results. O is characterized by a high interest in aesthetics (McCrae & John, 1992), presumably resulting in women paying more attention to their physical appearance. In addition, O reflects greater health consciousness, which might lead to healthy diets (Brummett, Siegler, Day, & Costa, 2008; Goldberg & Strycker, 2002). Because women face far more stringent standards of physical appearance than their male counterparts (e.g. Friedman et al., 2002), it is possible that scoring high on O might lead women to adopt healthy eating behaviours to avoid an increase in body weight (Mõttus et al., 2011).
Finally, we did not find significant concurrent or over–time associations for A with body weight measures. As noted in the introduction, previous studies had inconsistent results. Research suggests that A, characterized by warmth, empathy, and consideration of others (McCrae & John, 1992), can influence body weight in two ways, both associated with eating behaviours. On one hand, scoring high on A may raise susceptibility to overeating by reducing adaptive scepticism to marketing campaigns for high–calorie foods, increasing food consumption due to social obligations or enhancing susceptibility to interpersonal influence and social contagion that encourage overeating (Christakis & Fowler, 2007). On the other hand, it is possible that a trusting and compliant nature may predispose individuals to obey suggested guidelines with respect to diet and exercise (Goldberg & Strycker, 2002; Mõttus et al., 2001). Thus, we speculate that A led to contradictory eating behaviours among the sample subjects, which in turn had opposite influences on body weight, thus counteracting or nullifying the effect of A on body weight in our statistical analysis.
We should point out several strengths of the current research. First, the study was based on a large heterogeneous sample. Arguably, this means that effects of modest magnitude reached the traditional level of significance, p < .05. However, in obesity research, modest results often translate into meaningful inputs for interventions designed to combat the obesity epidemic (Huang & Glass, 2008). Second, we obtained our results using three indicators (BMI, WHR, and WC), each of which refers to a different aspect of obesity (e.g. Shen et al., 2006). A third strength relates to exploring the relationship between the FFM and body weight at baseline and over time. Finally, we controlled for important confounders in personality–body weight relations, such as gender, age, years of education, and self–reported chronic illnesses, and tested non–linear and interactive associations.
Our study had several limitations. First, the sample of subjects undergoing a periodic health examination may not be representative of the general population. Most of these individuals were more educated (mean = 15.83 and 16.22 years of education at T1 and T2, respectively) compared with the working population in Israel (mean = 14 years of education). With their higher education level and higher socio–economic status, which is presumed to be associated with better health, these respondents may be less likely to be obese (e.g. Brummett et al., 2006). However, it is very likely that the significant findings obtained here with regard to personality and body weight will be replicated in the less resilient, lower socio–economic strata.
Another limitation of the study is that the prospective design was based on only two periods of measurement. This has obvious advantages over testing cross–sectional relations only because it controls for the confounding influence of time–invariant common causes (Dormann, 2001). However, a design based on only two measurements cannot provide information on the precise nature of intra–individual change over time (Ployhart & Vandenberg, 2010). For plotting individual growth curves, which may include linear as well as curvilinear terms, at least three measures of data are needed. In addition, because the FFM was not reassessed at T2, we could not test the possibility of reverse causation.
An additional caveat concerns the time lag between T1 and T2. Past studies do not provide a clear indication of the optimal time lag when assessing changes in body weight measures. The follow–up time of 44 months may be too short for assessing changes in measures of body weight known to be relatively stable. Therefore, we recommend that future research in this area use multiple repeated measures within a longitudinal design with longer time intervals between measurements to allow for assessment of individual change over time.
Finally, in the current study, for reasons described earlier, we used the Mini–Marker scale, which provides only a total score for each of the broad domain levels of the FFM. Detailed facet–level analyses provide a circumscribed and deeper understanding of the relation between personality traits and various outcomes, including body weight (e.g. Sutin et al., 2011).
We recommend that future studies consider using personality scales that allow an assessment of the more circumscribed facet level as well as the broad domain levels of each of the FFM traits, such as the Revised NEO Personality Inventory.
Implications
The pattern of our findings suggests that anthropometric changes over time are associated with individual personality predispositions. Still, as posited by the person–by–situation interactional theory (e.g. Edwards, 2008; Schneider, 2001), personality predispositions may continuously interact in multidirectional ways with situational characteristics to influence indicators of body weight. For example, it has been argued that N interacts with environmental stressors to influence measures of body weight (Davis & Cerullo, 1996). Additionally, several possible mediating mechanisms may explain the relationship between the FFM and body weight, including health habits that have been implicated in the progression of obesity (Reilly et al., 2005). Future research may be directed at exploring contingent and context–specific mediators and moderators of the relationships investigated in our study.
Nonetheless, our major findings combined with those of earlier longitudinal studies help identify the personality traits that might lead to the risk of weight gain. In addition, the present findings underscore the importance of considering the effects of gender as well. As our results indicate, the population at high risk for weight gain is women who score high on N and low on O. E appears to be a risk factor for weight gain for both genders, whereas C is probably protective against weight gain. An important next step in this field of research is to examine possible mechanisms underlying the associations revealed by our study.