
Abstract
A general factor (gp) at the apex of personality has been suggested to account for the correlations between the Big Five. Although the gp has received ample support from monomethod studies, results from studies incorporating different methods have remained rather ambiguous; some have identified a gp across different informants, whereas others have not. It was hypothesized that these divergent findings are a result of varying lengths of acquaintance between raters. To this end, the current study presents a multitrait multi–informant meta–analysis (total N = 11 941) that found weak support for a gp as a substantive trait of personality. Evidence for a gp was susceptible to the length of acquaintance between informants. Although a gp could be identified for short–term acquaintances, it remained elusive at long–term acquaintance. Thus, the gp in other ratings more likely reflects normative ratings of an average individual rather than ratings of the specific target person. Copyright © 2013 European Association of Personality Psychology
Hierarchical views of personality (e.g. Carroll, 2002; Eysenck, 1947; Mowen, Park, & Zablah, 2007) describe personality as falling along a continuum that ranges from rather narrow traits to increasingly general dimensions. On the most abstract level, the Five–Factor Model (FFM; Digman, 1990) represents five orthogonal traits of personality: conscientiousness, agreeableness, neuroticism (or reverse scored as emotional stability), openness to experiences (or intellect), and extraversion. Although conceived as independent from each other, the five traits have routinely demonstrated low–sized to medium–sized correlations between their scores in empirical studies. Meta–analyses have estimated the mean true score correlation to be around
This paper seeks to explain these divergent findings as a result of varying levels of acquaintance between informants. The accuracy of observer ratings of personality frequently increases with the length of time they have known the target person (Beer & Watson, 2008a; Biesanz, West, & Millevoi, 2007; Kurtz & Sherker, 2003; Schneider, Schimmack, Petrican, & Walker, 2010). Therefore, if the general factor of personality represents a substantive trait of personality, it should be well–defined for long–acquainted individuals, whereas it is likely to emerge less clearly in dyads who have known each other for only a short period. On the other hand, if it primarily represents an evaluative bias resulting from stereotype information, the general factor would be expected to be better defined at short–term than at long–term acquaintance. To this end, the current study presents a multitrait multimethod (MTMM) meta–analysis to study the effect of different levels of acquaintance on the emergence of a higher–order general factor of personality across self–rating and other ratings.
Higher–order models of personality
A two–factorial view of personality postulates two orthogonal traits hierarchically superordinate to the five–factor space (Carroll, 2002; Digman, 1997): the α factor, also known as stability (DeYoung, Peterson, & Higgins, 2002, 2005), represents low levels of neuroticism and high levels of conscientiousness and agreeableness, whereas the β factor (or plasticity) reflects the shared variance between openness and extraversion. These two superfactors (Carroll, 2002) or metatraits (Digman, 1997) have been suggested to reflect individual differences in self–control and personal growth as seen in the restraint of hostile and aggressive behaviours towards others and an active engagement with the environment (Hirsh, DeYoung, & Peterson, 2009). They express two fundamental needs of individuals: the need for stable psychosocial functioning and the need for an active exploration of the world (DeYoung et al., 2002, 2005). Together, they determine how individuals react in novel situations. These metatraits loosely resemble Block's (Block & Block, 1980; see also Robins, John, & Caspi, 1994) two–factorial personality model that has been introduced as an early alternative to the FFM and describes two central traits: ego control and ego resilience. The former refers to the capacity to inhibit one's impulses and, thus, mimics stability, whereas the latter determines the capacity to adapt one's reaction to situational demands. Support for the two–factorial structure of personality has been received from several single sample studies (e.g. Alessandri & Vecchione, 2012; Hirsh et al., 2009) and also various multimethod examinations (e.g. DeYoung, 2006; McCrae et al., 2008; Şimşek, Koydemir, & Schütz, 2012). Although there is still some debate if both factors are equally pronounced across cultures—for example, some European and Asian studies could not univocally confirm the α factor (cf. Jang et al., 2006)—overall, meta–analytical summaries clearly reproduced both factors (Chang, Connelly, & Geeza, 2012; Markon, Krueger, & Watson, 2005). These factor–analytical studies combined with accumulated evidence of a neurobiological basis of the two metatraits (DeYoung, Hasher, Djikic, Criger, & Peterson, 2007; DeYoung et al., 2002) led Block (2010) to conclude in his review that the five factors of personality are clearly ‘subsumed by the higher order, progenetive Big Two factors’ (p. 21).
The general factor of personality, gp (Musek, 2007), represents the most abstract level of personality and is assumed to be hierarchically superordinate not only to the FFM but also to the two–factor model of personality. It constitutes a combination of those Big Five components that are generally positively valued: high levels of openness, conscientiousness, extraversion, and agreeableness, and low levels of neuroticism. High scorers on the gp have been attributed a ‘good’ personality (Rushton & Irwing, 2011, p. 132) and are seen as friendly, well–adjusted, and outgoing, whereas low scorers are characterized as ‘difficult’ personalities that do not mix well with others. In this respect, the gp has been associated with various favourable characteristics such as positive affectivity, subjective well–being (Musek, 2007), self–esteem (Erdle, Irwing, Rushton, & Park, 2010), and even general intelligence (Loehlin, 2011). Moreover, the validity of the gp has been inferred from its prediction of various behavioural outcomes. For example, the gp predicted job performance of long–term employees in business organizations and military personnel (Van der Linden et al., 2011). In adolescents, it was related to sociometric position within the peer group and ratings of likability (Van der Linden, Scholte, Cillessen, te Nijenhuis, & Segers, 2010).
The gp has been recovered in various single–method studies in mixed samples of the general population (Erdle et al., 2010), children (Van der Linden, Scholte, et al., 2010), and even psychiatric patients (Van der Linden, te Nijenhuis, & Bakker, 2010). However, monomethod studies are distorted to some degree because true trait components cannot be distinguished from rater–specific biases, for example, a self–favouring bias (Paulhus, Bruce, & Trapnell, 1995) that leads to inflated ratings of one's standing on a particular trait. In particular, self–reports are prone to a common method bias (Podsakoff, MacKenzie, Lee, & Podsakoff, 2003), which results in spurious correlations between measures of different constructs obtained from the same source. This seems particularly relevant for the case of a general factor of personality. Although some research has identified a gp across self–report and peer reports as well (Loehlin & Horn, 2012; Rushton et al., 2009), others have not (Danay & Ziegler, 2011; Riemann & Kandler, 2010); a recent meta–analysis found only weak support for a gp across multiple informants (Chang et al., 2012). For example, Anusic, Schimmack, Pinkus, and Lockwood (2009) suggested that the gp is a product of informant–specific halo error reflecting a general disposition to attribute favourable characteristics to oneself and others. An explanation for the mixed support of the general factor hierarchy in multi–informant studies might be attributed to varying levels of acquaintance within the rater dyads.
The effect of acquaintance length
Acquaintance between two individuals refers to the degree to which they are familiar with or have knowledge about each other. It is composed of qualitative (i.e. type of relationship) and quantitative (i.e. frequency and intensity of interactions) aspects (Starzyk, Holden, Fabrigar, & MacDonald, 2006). The accuracy of trait judgments is frequently a function of the quantitative aspect: the length of acquaintance (Biesanz et al., 2007; Bernieri, Zuckerman, Koestner, & Rosenthal, 1994; Kurtz & Sherker, 2003; Paulhus & Bruce, 1992; Schneider et al., 2010). Long–term acquaintances have more opportunities to interact with each other and observe each other's behaviours in different situations, and this typically makes them better informants than short–term acquaintances. For example, Watson, Hubbard, and Wiese (2000) observed that the agreement between self–reported and other–reported personality is about Δr = .15 higher for long–wed couples than respective correlations for short–term friend dyads. Further support for this acquaintanceship effect has been received from longitudinal studies that have demonstrated increasing self–other agreement over time. Paulhus and Bruce (1992) examined agreement within initially unacquainted groups that met each other over the course of 7 weeks. Agreement between self–rating and informant ratings of personality increased significantly over time. A similar trend was identified in pairs of college roommates over a period of 4 months (Kurtz & Sherker, 2003). Biesanz et al. (2007) estimated an increase in self–other agreement of about Δr = .05 for every 5 years of acquaintance, whereas other authors (Schneider et al., 2010) believe that the accuracy of trait ratings monotonically increases during only the first 3 years of acquaintance; beyond that, length of acquaintance does not ensure higher self–other agreement. This effect is typically more pronounced for those traits in the five–factor space that are less clearly manifested in observable behaviours (i.e. neuroticism, agreeableness, or openness; Kurtz & Sherker, 2003; Paulhus & Bruce, 1992; Simms, Zelazny, Yam, & Gros, 2010). By contrast, extraversion and conscientiousness, which are even readily inferred from thin slices of behaviour (e.g. Carney, Colvin, & Hall, 2007), show high levels of self–other agreement early on in a relationship, and this agreement shows little increase over time (Paulhus & Bruce, 1992; Simms et al., 2010).
The effect of acquaintance length has been attributed to differential effects of stereotype (Cronbach, 1955) or normative (Furr, 2008) information about what people generally tend to be like. If substantial information about an individual's trait level is not available, peers resort to implicit personality theories, a set of preexisting beliefs about people and how traits typically covary, and substitute missing information with stereotypical estimates of the ‘average’ or ‘typical’ person's trait (Beer & Watson, 2008a). These a priori beliefs function as a form of heuristic to simplify personality ratings made by others and to create a coherent personality impression. The stronger this simplicity heuristic, the less accurately people distinguish between different personality dimensions and, thus, cluster different traits along a common continuum. Because normative ratings are generally rather positive in nature (Wood, Gosling, & Potter, 2007), making observer ratings at short–term acquaintance also entails viewing others very positively. Consequently, these ratings by others result in an attenuation or even denial of socially undesirable attributes, and this could lead to trait judgments that resemble a general factor of personality.
If the general factor beyond the five–factor space is not merely an artefactual bias in self–perception or other perceptions but a substantive structure of personality, it should be unaffected by the length of acquaintance. On the other hand, if the higher–order structure fails to replicate at long–term acquaintance and can only be identified at short–term acquaintance, it is more likely to be a product of stereotype–based judgments. These stereotype effects should result in higher cross–informant correlations for similar positively evaluated traits and, thus, artificially create a general factor of personality.
Overview
The higher–order structure of personality was analyzed in a meta–analysis of multi–informant correlations of the five factors of personality assessed as self–report and peer reports. The study reconstructed a full multitrait multi–informant matrix consisting of correlations between the Big Five resulting from self–rating and other ratings. For each correlation in this matrix, a separate meta–analysis was conducted, thus resulting in 45 independent meta–analyses. In the second step, the synthesized correlations were analyzed in search of a general factor of personality. Then, the length of acquaintance between the raters was considered as a potential factor that might mask the identification of a higher–order structure in the synthesized multi–informant data.
Method
Literature search
Primary studies reporting relevant correlations between measures of the Big Five obtained from self and nonself sources were located by searching several computerized databases (PsycINFO, Psyndex, EconLit, and Google Scholar) using the keywords ‘(trait or Big Five or Five Factor Model) and (peer or informant or observer or spouse or roommate or self–other)’. Moreover, references of previous meta–analyses on self–other agreement of personality (Chang et al., 2012; Connelly & Ones, 2010; Connolly, Kavanagh, & Viswesvaran, 2007; McCrae et al., 2004) and the manuals of published personality inventories were inspected for additional studies reporting self–other correlations of personality.
A study was included in the meta–analysis when it met the following criteria. (i) The study was published after 1980, 1 (ii) it was written in English or German, and (iii) it included a measure of personality according to the five–factor taxonomy. Eligible Big Five instruments were identified using the classification by Salgado (2003). Instruments not included in this classification were categorized as Big Five measures on the basis of the evaluations of two independent raters. To avoid artefactual errors due to imperfect construct validities (cf. Hunter & Schmidt, 2004; Mount & Barrick, 1995), instruments that were developed outside the five–factor framework were excluded. (iv) The traits were measured with a validated multi–item instrument. Scales that were constructed ad hoc or single–item measures were excluded to avoid spurious correlations resulting from unreliable instruments. (v) Personality ratings of at least one of the five traits were obtained from other ratings. (vi) The study reported correlations between traits measured by the same informant or cross–informant agreement. Studies reporting profile analyses or mean differences 2 were excluded. (vii) The mean duration of the acquaintance between the target person and the observer was reported. (viii) Participants, raters, and ratees were at least 14 years of age and (ix) of sound physical and psychological health. Studies on children or patients with severe physical trauma or mental illnesses were not considered in order to exclude individuals with unstable personalities for whom temporary personality changes seemed likely.
This search resulted in 44 eligible research articles and three theses reporting 1,481 correlation coefficients.
Meta–analytic procedure
To identify higher–order factors of personality from the multi–informant data, in the first step, a 10 × 10 matrix was formulated consisting of true–score correlations between the following: (i) the five self–reported personality traits; (ii) the five peer–reported traits; and (iii) the five traits assessed by different raters. For each correlation in this matrix, a separate meta–analysis was conducted, thus resulting in 45 independent meta–analyses.
Nonindependence
Untransformed Pearson product moment correlations were used as effect size measures. To ensure an appropriate level of independence, the following approaches were used: (i) for studies reporting on several independent samples, correlations from each sample were included; (ii) when studies reported multiple correlations for the total sample and several subgroups, only the total sample correlation was considered; and (iii) if a study included multiple correlations between two traits from the same sample (e.g. measured with different instruments), the correlations were combined into a composite correlation using the procedure proposed by Cheung and Chan (2004). This resulted in 986 independent correlation coefficients from 56 samples.
Outliers
Extreme correlations (i.e. outliers) were identified using the studentized deleted residual (Viechtbauer & Cheung, 2010), which yields a z–standardized difference measure between each observed effect and the predicted average true effect when the respective effect actually fits the assumed model. Using a nominal α of 1%, these indicated that between 0 and 2 correlations were potential outliers. To reduce the impact of these outliers, the respective correlations were truncated to the lower or upper bound of the 90% credibility interval of the true effect calculated from a dataset from which the outliers had been removed. 3
Effect size synthesis
Correlations were synthesized using a random effects model with a restricted maximum likelihood estimator (Viechtbauer, 2005), which decomposes the variability of the effect sizes into heterogeneity as a result of random population effects and sampling variance. In contrast to fixed–effect models, these models do not assume an identical population parameter across all studies—which is seldom tenable in empirical research synthesis (see Schmidt, Oh, & Hayes, 2009, for a review). The accuracy and significance of the synthesized effects were gauged by means of a 95% credibility interval.
Correction for artefacts
The observed correlations were corrected for two sources of error: sampling error and measurement error. Sampling error was accounted for by weighing the individual correlations by the inverse of their variances. Measurement error was accounted for twofold. First, because some studies employed multiple peer informants, which is likely to result in higher reliabilities than ratings from a single informant, these correlations were individually corrected using the interrater reliabilities following the approach in Chang et al. (2012). 4 Second, adjustments for the instruments’ test–retest reliabilities were applied. These corrected correlations represent the stable overlap between self–rating and other ratings with situation–specific random variance from differences in, for example, mood or alertness removed (Connelly & Ones, 2010). As none of the primary studies reported information on test–retest reliabilities, a separate meta–analysis on test–retest correlations for personality inventories assessing the Big Five was conducted. 5 The means and variances of the square roots of these synthesized test–retest correlations were used as artefact distributions to correct the variance–weighted mean correlations for transient error (Hunter & Schmidt, 2004). Other forms of measurement error such as internal consistency were not considered as these hardly affect self–other correlations (McCrae, Kurtz, Yamagata, & Terracciano, 2011).
Multitrait multimethod analyses
Latent variable modelling
The correlations between the Big Five synthesized in the first step were subjected to structural equation modelling (SEM; cf. Cheung & Chan, 2005; Viswesvaran & Ones, 1995) in Mplus 6 (Muthén & Muthén, 1998–2011) with a maximum likelihood estimator. Following recommendations by Viswesvaran and Ones (1995), the harmonic mean of all samples was used as the sample size for these analyses because the harmonic mean gives less weight to individual large studies than the arithmetic mean and, as such, more closely reflects the overall precision of the data. The choice of sample size in meta–analytic SEM primarily affects the parameters’ standard errors (and consequently the associated significance tests) but not the parameter estimates themselves.
Multitrait multimethod models
All analyses modelled five latent trait factors, each represented by two indicators: the self–rating and the peer rating. Thus, each latent trait represented the variance shared across informants. To identify the latent factors, the paths for the two indicators were constrained to be equal; thus, self–rating and peer ratings contributed equally to the latent trait variance. First, a baseline model was specified, which included five correlated traits without acknowledging informant–specific biases. This model was subsequently extended with correlated error terms for each informant to acknowledge rater–specific biases. Then, a higher–order trait model that included two correlated higher–order trait factors, α and β, was tested (left panel of Figure 1). To identify the β factor, the loadings of its indicators were constrained to be equal. Finally, to separate the α and β factors from a potential general factor of personality, a bifactorial model with a general factor in addition to two orthogonal α and β factors was considered (right panel of Figure 1). As bifactorial models with five traits are ordinarily not identified, the respective factor loadings were estimated using the Schmid and Leiman (1957) procedure. This transforms the oblique factor structure obtained in the correlated α and β model into a bifactor structure with a common factor (in this case, the general factor of personality) and two orthogonal group–specific factors (cf. Reise, 2012). As a global indicator of the general factor's importance, McDonald's (1999) ωh was reported. ωh represents the ratio of variance accounted for by the general factor to the total amount of variance explained by all factors and has been suggested to be an optimal indicator of a measure's general factor saturation (Zinbarg, Revelle, Yovel, & Li, 2005). As a simple rule of thumb (Revelle, 1979), a ωh of at least .50 has been suggested as a minimum threshold in order to allow for meaningful interpretations of the common factor.
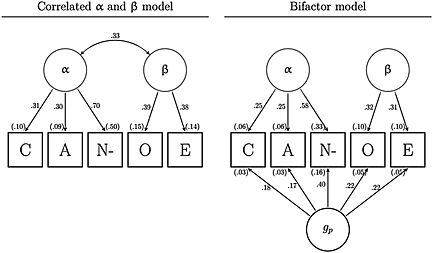
Standardized factor loadings and variance explained (in parentheses) of general and specific factors in latent multi–informant ratings. α, stability; β, plasticity; gp, general factor of personality; C, conscientiousness; A, agreeableness; N−, neuroticism (reverse scored); O, openness; E, extraversion. Measurement models are not presented.
Model evaluation
Model fit was evaluated in line with common praxis (cf. Schermelleh–Engel, Moosbrugger, & Müller, 2003) by using the comparative fit index (CFI), root mean square error of approximation (RMSEA), and standardized root mean square residual (SRMR). Different models were compared with the sample–size–adjusted Bayesian information criterion (BIC) for which lower values indicate a better fit.
Results
Study characteristics
Most samples originated from North America (63%) and Europe (33%). The total sample size was N = 11,941 (range of the individual studies’ Ns: 33 to 1,260), and approximately 61% of the participants were female. Ages ranged from 14 to 63 years (M = 29.43, SD = 12.91). The type of relationship between target and informant was qualified as relative (e.g. parent or sibling) for 12%, spouse or dating partner for 24%, friend or close acquaintance for 16%, incidental acquaintance or stranger for 16%, and unspecified peer for the remaining dyads. The length of acquaintance between the raters ranged from less than 1 year to 35.5 years (Mdn = 4 years). For most samples, other ratings were based on a single informant; about 15% included two informants and 10% up to nine. Most studies used variants of Costa and McCrae's (1992) NEO scales (43%), followed by various adjectives lists (31%), the Big Five Inventory (12%; John et al., 2008), and Goldberg's (1999) statements from the International Personality Item Pool (2%).
Synthesized correlations
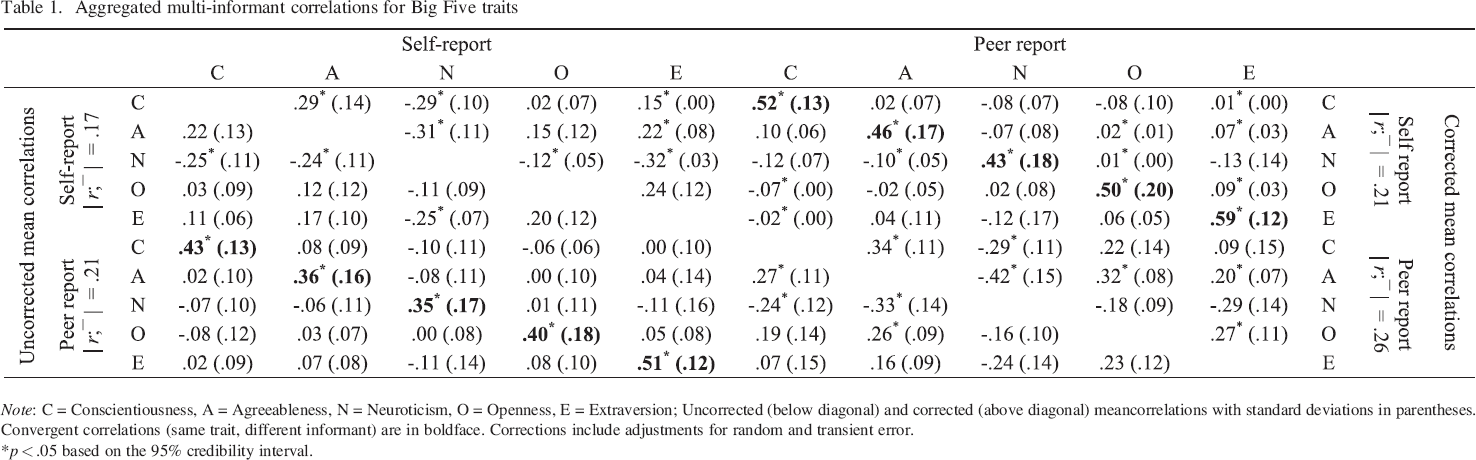
In total, 45 separate meta–analyses were conducted, one for each correlation resulting from the assessment of the five factors of personality as self–report and other reports. The results of these meta–analyses are summarized in Table 1. All meta–analyses involved between 16 and 52 independent effect sizes based on a minimum of N = 4,337 participants. Most effect sizes were available for the syntheses of self–other correlations of the same trait (range: 47–52). The corrected self–other correlations for all five traits (bold values in Table 1) demonstrated good convergent validities across raters, with all values falling between .43 (neuroticism) and .59 (extraversion). These results are comparable with self–other correlations obtained in previous meta–analyses (cf. Connelly & Ones, 2010; Connolly et al., 2007). Most heterotrait–heteromethod correlations were small (r <.15) and not significant (p > .05). Within informants, the five traits were moderately correlated:
Aggregated multi–informant correlations for Big Five traits
Meta–analytic multitrait multimethod analyses
The synthesized 10 × 10 matrix of true–score correlations was used as input for the confirmatory factor analyses in the search for higher–order factors of personality. A model with five correlated latent trait factors but without informant–specific biases did not provide an adequate fit to the data, χ2(30) = 6254, CFI = .597, RMSEA = .204, SRMR = .092, BIC = 133,068. Acknowledging potential method effects by modelling correlated error terms in addition to the five traits achieved a superior fit, χ2(10) = 52, CFI = .997, RMSEA = .029, SRMR = .012, BIC = 127 037. The mean absolute correlations between the latent traits was .12, which is similar to correlations obtained in previous single–sample MTMM studies (e.g. DeYoung, 2006:
The higher–order factor model with two correlated α and β factors, χ2(15) = 238, CFI = .986, RMSEA = .054, SRMR = .041, BIC = 127 180, resulted in a satisfactory fit. Although all traits had significant loadings on their higher–order factor, the α factor was primarily defined by neuroticism (λ = .70, p < .001, R2 = .50), whereas agreeableness (λ = .30, p < .001, R2 = .09) and conscientiousness (λ = .31, p < .001, R2 = .10) had somewhat moderate loadings (left panel of Figure 1). The two metatraits were significantly correlated at r = .33, p < .001, which falls in line with the assumption of a superordinate general factor of personality at another level above the α and β factors. 6 The estimates in the bifactor model resulted in moderate loadings on the common factor for most traits (right panel of Figure 1) between λ = .17 for agreeableness and λ = .40 for neuroticism. As a consequence, McDonald's (1999) ωh, an indicator of the general factor saturation, was rather low (ωh = .21). As a common factor should at least explain 50% of the variance in order to allow for meaningful interpretations (Revelle, 1979), evidence of a general factor of personality common to all five traits was rather scarce in the cross–informant correlations.
Length of acquaintance
A potential higher–order structure of personality could have been masked by varying levels of acquaintance. The acquaintance effect on the emergence of a gp was studied in two ways. On the one hand, short–term acquaintances were compared with long–term acquaintances by means of subgroup analyses. On the other hand, gradients of the focal parameters across different levels of acquaintance were analyzed using local weights for each individual effect size (see Supporting information for more details about the procedure).
Subgroup analyses
The available samples were split into two subgroups. Because the validity of peer ratings increases markedly within the first 3 years of acquaintance, but increases less beyond that point (Schneider et al., 2010), the short–term acquaintance group included samples with a median acquaintance length of Mdn = 6 months (range = [0, 36]). By contrast, long–term acquaintances knew each other on average Mdn = 13.77 years (range = [3.42, 35.5]). In line with previous observations (e.g. Biesanz et al., 2007; Kurtz & Sherker, 2003; Paulhus & Bruce, 1992), self–other agreement increased at long–term acquaintance (Table 2). This was most pronounced for openness,
Self–other agreement at short–term and long–term acquaintance
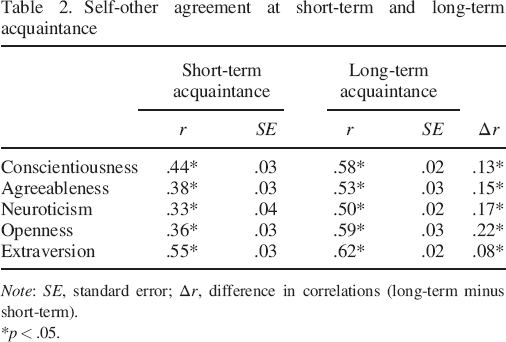
Note: SE, standard error; Δr, difference in correlations (long–term minus short–term).
p < .05.
Latent multi–informant correlations at short–term and long–term acquaintance
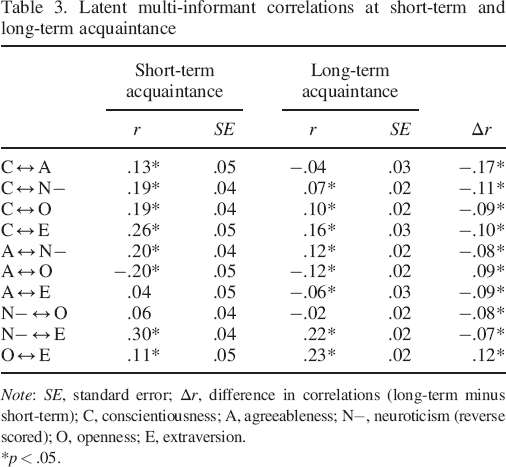
Note: SE, standard error; Δr, difference in correlations (long–term minus short–term); C, conscientiousness; A, agreeableness; N−, neuroticism (reverse scored); O, openness; E, extraversion.
p < .05.
As a consequence, higher–order latent trait models resulted in a better fit at short–term acquaintance, χ2(15) = 97, CFI = .977, RMSEA = .059, SRMR = .042, BIC = 40,917, than at long–term acquaintance, 7 χ2(16) = 155, CFI = .990, RMSEA = .051, SRMR = .042, BIC = 81,425. At short–term acquaintance, all traits had significant loadings on their respective higher–order factors. Moreover, the α and β factors were highly correlated (r = .57, p < .001), and the bifactor estimates (bottom left panel of Figure 2) also included substantial loadings on a common factor. By contrast, at long–term acquaintance, the respective higher–order factor structure was markedly different (top right panel of Figure 2). The correlation between α and β dropped to r = .24, p < .001. As a result, the common factor was rather ill defined (bottom right panel of Figure 2). The gp predominantly represented neuroticism (R2 = .28) and explained only between 0% and 3% of the variance of the other traits. The different loading pattern on the gp was mirrored by ωh, which was higher at short–term acquaintance (ωh = .38) than at long–term acquaintance (ωh = .18).
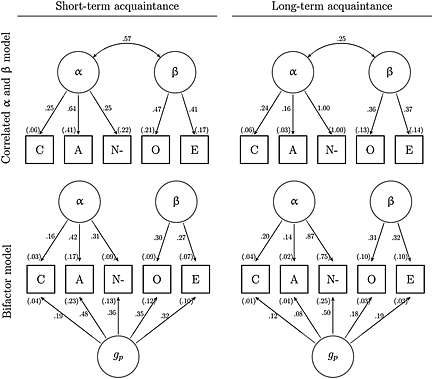
Standardized factor loadings and variance explained (in parentheses) of factors in latent multi–informant ratings at short–term (Mdn = 6 months) and long–term acquaintance (Mdn = 14 years). α, stability; β, plasticity; gp, general factor of personality; C, conscientiousness; A, agreeableness; N−, neuroticism (reverse scored); O, openness; E, extraversion. Measurement models are not presented.
Gradients of model parameters
The subgroup analyses presented in the previous section had two limitations. First, the varying lengths of acquaintance within each subgroup were ignored. Second, the chosen length of acquaintance used to divide the samples into the short–term and long–term acquaintance groups was arbitrary to some degree. To overcome these limitations, a cross–sectional gradient for the latent correlation between the two higher–order factors α and β was estimated (cf. Hildebrandt, Sommer, Herzmann, & Wilhelm, 2010). At focal points from 0 to 20 years of acquaintance, the previous meta–analyses and subsequent latent variable models were estimated anew by using local weights for the individual effect sizes. The weights were created in such a way that effect sizes from samples near the defined focal point were given a larger weight approaching 1, whereas effect sizes from samples distant from the focal point were given smaller weights approaching 0 (refer to the Supporting information for more details). Hence, the previous analyses were repeated 21 times using different weights depending on the focal length of acquaintance. This allowed for the inspection of continuous parameter changes across different lengths of acquaintance without creating a priori subgroups. The loadings of the five traits on the two higher–order factors, α and β, across different lengths of acquaintance are plotted in the left panel of Figure 3. Most traits showed a gradual increase of their factor loadings with long–term acquaintance; only agreeableness demonstrated a marked drop in factor loadings. The latent correlations between the two higher–order factors across different lengths of acquaintance are plotted in the left panel of Figure 4. In line with the previous subgroup analyses, the gp, as indicated by the correlation between α and β, was most pronounced among short–term acquaintances (e.g. at 1 year, it was r = .54, p < .001). After 20 years of acquaintance, the respective correlation dropped to r = .11, p = .34. This decline was mirrored by McDonald's ωh; the gp emerged more clearly at 1 year of acquaintance (ωh = .32), whereas it was increasingly difficult to identify for individuals who had known each other for a longer period (ωh = .08).
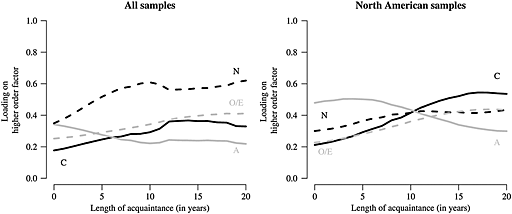
Factor loading on higher–order factors of personality in multi–informant ratings from 0 to 20 years of acquaintance. C, conscientiousness; A, agreeableness; N−, neuroticism (reverse scored); O/E, openness/extraversion.
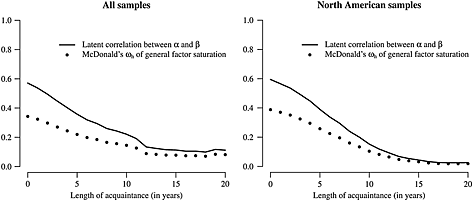
Latent correlations of higher–order factors of personality in multi–informant ratings from 0 to 20 years of acquaintance.
Sensitivity analyses
Previous studies indicated mixed support of the higher–order structure of personality across different cultural regions (e.g. Jang et al., 2006). Therefore, the previous analyses were repeated for a subgroup of samples that were conducted in North America (USA and Canada). Among these samples, the previously reported results were clearly confirmed. Self–other correlations significantly, p < .05, increased with length of acquaintance (Table S1 of the Supporting information), whereas most cross–trait correlations decreased (Table S2). Moreover, acquaintanceship length moderated the emergence of the gp. The correlation between α and β was strongest among short–term acquaintances and gradually decreased within 20 years of acquaintance (right panel of Figure 4). Among European samples, higher–order models failed to converge because agreeableness was uncorrelated to conscientiousness, r = .05, p = .19, and neuroticism, r = .03, p = .44. As a consequence, neither the α factor nor a putative gp could be identified. However, these results should be interpreted with caution because they are based on rather few primary studies—many of the meta–analyses conducted to construct the correlation matrix for the confirmatory models included as few as six primary studies.
Discussion
The observation that the Big Five are empirically frequently moderately correlated (e.g. Mount et al., 2005) has led to the proposal of a general factor at the apex of the personality hierarchy, similar to the cognitive domain (Musek, 2007; Rushton & Irwing, 2011). However, previous validity studies across multiple informants have yielded rather mixed results; some studies identified the gp (e.g. Rushton et al., 2009), whereas others did not (e.g. Riemann & Kandler, 2010). To rectify these seemingly contradictory findings, the present study reported an MTMM analysis on meta–analyzed self–report and peer reports of personality. By extending recent meta–analytical research on the structure of personality (Chang et al., 2012) with findings on implicit simplicity effects in observer ratings of personality (Beer & Watson, 2008a, 2008b), the study provided several new insights: (i) Even when controlling for method effects, the Big Five are moderately correlated. Although a putative gp could be extracted from these correlations, the respective factor loadings on the five traits were rather small. (ii) The length of acquaintance between the informants moderated the identification of a gp. In line with an artefact interpretation of the gp, the common factor emerged more clearly at short–term than at long–term acquaintance. (iii) The two–factorial higher–order structure was less susceptible to the length of acquaintance between informants. If anything, the factor loadings of most traits (except for agreeableness) on α and β tended to increase with acquaintanceship length. (iv) The view of a universal higher–order structure of personality across cultures might be challenged: the α factor could not be identified among European countries, whereas it clearly emerged in North American samples. (v) Finally, the presented study also offered a methodological contribution by presenting a new method for the analysis of continuous moderators in meta–analytical SEM using parameter gradients (see Supporting information).
The gp across informants
Personality research is dominated by single–method studies, which cannot adequately separate true trait components from artefacts that are a result of a specific measurement method. Unfortunately, the bulk of previous research supporting the existence of a gp has relied on monomethod studies (e.g. Erdle et al., 2010; Rushton & Irwing, 2008; Van der Linden et al., 2011). As soon as the higher–order structure of personality was examined across multiple instruments (e.g. Hopwood, Wright, & Donnellan, 2011) or informants (e.g. Danay & Ziegler, 2011), the previously impressive apparent support for a gp became less clear. In line with previous single–sample studies that managed to successfully identify a gp across different raters (e.g. Loehlin & Horn, 2012; Rushton et al., 2009), the present multitrait multi–informant meta–analysis identified moderate correlations within the five factor space that allowed for the extraction of a putative gp. Although the respective factor loadings on the gp (λ = .57) fell in line with previous monomethod studies (λ = .63–.67; Rushton & Irwing, 2008), the gp explained only about 3–16% of the variance in the Big Five. Thus, one might question the meaningfulness of such a trait beyond the Big Five. The interpretation of the gp as a substantive personality trait is further challenged by its susceptibility to the length of acquaintance between informants. Although self–other agreement in the current study increased with length of acquaintance—thus, replicating previous findings (cf. Biesanz et al., 2007; Watson et al., 2000)—the respective cross–trait correlations were significantly reduced in size (about
The gp as shared bias
If the gp represents a bias in self–report and other reports, how might this bias be explained? Observers who have not known a target person long enough to have sufficient information regarding his or her actual personality typically substitute missing information with normative information on how people typically are or ought to be (Beer & Watson, 2008a). In such a way, they try to create a consistent personality image of others. In support of this premise, Biesanz et al. (2007) demonstrated that observers’ ratings of a target person reflect the ratings of an average hypothetical target instead of the specific individual when the length of acquaintance is short. Moreover, zero–acquaintance studies using photos have revealed moderate correlations between socially desirable characteristics; that is, faces rated high in agreeableness, which represents the most socially favourable attribute of the Big Five (Hafdahl, Panter, Gramzow, Sedikides, & Insko, 2000), are also rated as being somewhat high in openness, conscientiousness, extraversion, and emotional stability (Penton–Voak, Pound, Little, & Perrett, 2006). However, with increasing acquaintance, this spill–over effect becomes smaller. The longer observers have known the target person, the more traits become differentiated and stereotypical ratings shrink in favour of ratings that more closely reflect the respective individual. For example, the mean intercorrelation between other ratings of the Big Five decreased about Δr = .22 for ratings of complete strangers as compared with ratings of spouses (Beer & Watson, 2008b). Thus, at short–term acquaintance, others are attributed a variety of socially favourable qualities such as being agreeable, intellectually curious, and emotionally stable, which together mimic a putative gp. A rather similar effect can be observed in self–ratings of personality. Meta–analytical reviews (e.g. Li & Bagger, 2006) have associated all traits within the FFM with socially desirable responding, the tendency to present oneself overly favourably in line with prevalent social norms (cf. also the halo effect; Anusic et al., 2009). Typically, it leads to inflated ratings on all five traits within the FFM (Paulhus et al., 1995). Social desirability is frequently captured by the first principal component of self–report inventories (Edwards & Edwards, 1991; Schmit & Ryan, 1993) and, as a consequence, accounts for a significant proportion of variance in the gp (e.g. Backström, 2007; Musek, 2007). This effect is partly a consequence of the evaluative item content of most FFM instruments. When neutrally rephrased items are administered from which the socially desirable content has been removed, evidence for a gp gradually disappears (Bäckström, Björklund, & Larsson, 2009). Thus, social desirability results in a bias in self–ratings similar to that found for other ratings at short–term acquaintance. Because the bias in other ratings gradually decreases the longer observers have known the target person, in the present meta–analysis, the gp across informants became less evident with increasing length of acquaintance. After about 10 years of acquaintance, the gp gradually disappeared (Figure 4). In line with an artefact interpretation, these analyses indicate that a gp that converges across raters (cf. Rushton et al., 2009) is primarily the result of normative information in other reports of personality.
The gp as more than bias?
Following the tradition of Campbell and Fiske (1959), this study examined the gp from a multiple informant perspective. Because single–method studies cannot separate true trait components from artefacts resulting from the measurement method, multimethod studies have been frequently advocated for the validation of constructs in the personality domain (cf. Schimmack, 2010). These analyses examined the variance shared across self–rating and other ratings to identify a putative gp; unshared variance components unique to the self or the other perspective were treated as measurement error. However, it is conceivable that these unshared variance components not only represent error but also included substantial aspects of an individual's personality (cf. Vazire & Carlson, 2011). Self–reports might contain information about oneself that is not readily observable by others, just as observer reports might include information about another person's personality that goes unnoticed by oneself. In line with this assumption Vazire and Mehl (2008) demonstrated that self–report and observer reports of typical behaviours differentially predicted a person's actual behaviours; the self was more accurate at predicting some behaviours, whereas observers were more accurate at others. Thus, each informant had access to specific information not available to the other. This is also highlighted by several criterion validity studies of the FFM traits. A recent meta–analysis demonstrated that observer ratings of personality predicted job performance and showed incremental validity beyond self–reports (Oh, Wang, & Mount, 2011). Thus, the observer ratings included specific information about a person's personality not captured by the respective self–ratings and uniquely predicted work behaviours. Similarly, implicit aspects of personality that are not readily accessible to oneself but can manifest in spontaneous behaviours observable by others predicted actual behaviours beyond explicit trait ratings (Back, Schmukle, & Egloff, 2009). In light of several single–informant studies demonstrating the criterion validity of the gp (e.g. Van der Linden, te Nijenhuis, et al., 2010; Van der Linden et al., 2011), it might be speculated that some of the informant–specific variance in this study included substantial trait components that are not shared across perspectives. This would leave some room for a rater–specific gp beyond a mere bias interpretation that should be explored in future studies.
A universal higher–order structure of personality
The gp is but one recent attempt to pattern the correlations between the five traits of personality. Although the current study provided scarce evidence for a gp that replicates across different lengths of acquaintance and cultures, the two–dimensional structure proved to be more robust. Plasticity, the correlation between extraversion and openness, emerged clearly in short–term and also long–term acquaintance groups—although the factor loadings on the higher–order trait tended to increase gradually with increasing length of acquaintance. Thus, plasticity seemed to be better defined in pairs that knew each other a longer time. Moreover, plasticity was also the only higher–order factor that replicated across cultures; the β factor emerged comparably in North American and European samples. Stability, the second higher–order factor of personality, was also clearly identifiable albeit not invariant across different lengths of acquaintance (Figure 3): the loadings for neuroticism and conscientiousness gradually increased for long–time acquainted dyads, whereas the respective loading of agreeableness continually decreased. However, the emergence of α depended on the dominating culture. Stability was identified in North American samples but was ill defined among European samples. The lack of invariance across culture has also been noted previously (cf. Jang et al., 2006) and makes the view of a universal two–factorial concept of personality seem premature. Rather, it seems prudent for future research to systematically examine the higher–order structure of personality across different languages, countries, and societies.
Limitations
Some caveats might limit the generalizability of these results to some degree. One limitation pertains to the methodological avenue adopted for this study. The meta–analysis relied on the reported correlations between the observed trait scores but had no access to the item–level data. Thus, instruments that do not have a pure simple factorial structure but include items that load on several trait factors could have created spurious correlations between the trait scores. Such factor blends can contribute to the emergence of artificial higher–order factors of personality (Asthon, Lee, Goldberg, & de Vries, 2009) because cross–loadings of selected items on two or more factors that are not accounted for result in spurious correlations between Big Five scores (Marsh et al., 2010). Thus, future studies are encouraged to replicate these findings with item–level data and to explicitly model latent constructs that can account for potential factor blends. In addition, the type of administered FFM instrument should be explicitly acknowledged. Although the gp has been extracted from various scales (cf. Rushton & Irwing, 2009), it seems to emerge less clearly in instruments using neutrally phrased items from which the socially desirable content has been removed (Bäckström et al., 2009). Another limitation of this study pertains to the modelling strategy of the latent factors. Because the current study included only two informants (self and peer), it was necessary to constrain the loadings of the latent trait factors; thus, self–rating and observers ratings contributed equally to the latent trait variance. This limitation could be overcome in future studies by including more raters—for example, different types of observers (e.g. family members and friends). Furthermore, it is conceivable that the acquaintance effect might be confounded with developmental differences related to the age of the respondents: short–term acquaintances were younger (Mdn = 20.4 years) than long–term acquaintances (Mdn = 33.5 years). As people mature, self–reports of personality generally become more differentiated across traits and result in lower correlations within the FFM (Soto, John, Gosling, & Potter, 2008). Stronger evidence could be gathered from matched samples with different lengths of acquaintance but comparable age structures. Moreover, this study examined only the quantitative aspect of acquaintance (i.e. its length) but neglected the qualitative component (i.e. the type of relationship; cf. Starzyk et al., 2006). It is possible that the degree of emotional attachment between raters results in attributions of more desirable characteristics to others than for targets with whom observers are not as strongly involved (Connelly & Ones, 2010). Finally, it should be acknowledged that most dyads in the aggregated primary studies were not randomized. Thus, a selection bias cannot be ruled out: it is conceivable that only pairs that agree on each other's personality stay friends, whereas dyads that disagree would cease their interactions and, thus, exhibit a shorter length of acquaintance. The combined effects of the quantitative and qualitative aspects of acquaintance should be examined more closely in future studies, for example, by using randomized roommate pairs (cf. Kurtz & Sherker, 2003).
Conclusion
As attractive as the idea of a general trait at the top of a personality hierarchy might seem, its empirical support based on the present meta–analysis is rather weak. Although the Big Five exhibited minor correlations between each other even when controlling for method–specific biases, they were rather small and, moreover, susceptible to the length of acquaintance between raters. A putative gp could be extracted from ratings of dyads who had known each other for a comparably short period, but it gradually disappeared with increasing length of acquaintance. This sheds doubt on the idea that the gp is a substantive trait that is more than a shared bias in self–rating and other ratings. More likely, the previously identified gp across informants represents shared normative ratings that result from socially desirable responding in self–reports (Bäckström et al., 2009) and implicit personality theories in other reports (Beer & Watson, 2008a) rather than substantive aspects of an individual's personality.
Supporting Information
Supporting Information, gnambs - The Elusive General Factor of Personality: The Acquaintance Effect
Supporting Information, gnambs for The Elusive General Factor of Personality: The Acquaintance Effect by Gnambs Timo in European Journal of Personality
Footnotes
Notes
References
Supplementary Material
Please find the following supplemental material available below.
For Open Access articles published under a Creative Commons License, all supplemental material carries the same license as the article it is associated with.
For non-Open Access articles published, all supplemental material carries a non-exclusive license, and permission requests for re-use of supplemental material or any part of supplemental material shall be sent directly to the copyright owner as specified in the copyright notice associated with the article.