
Abstract
The Big Five is a useful model of attributes now commonly used in cross–cultural research, but without the support of strong measurement invariance (MI) evidence. The Big Six has been proposed as a cross–culturally informed update, and the broader Big Two (Social Self–Regulation and Dynamism) draws on even more cross–cultural evidence. However, neither has been rigorously tested for cross–cultural MI. Here a Big Six inventory (36QB6) and measures of the Big Five and Big Two derived from it were tested and refined for cross–cultural usability in samples from 26 nations, divided into three subsets. Confirmatory factor analysis of the models in the first subset of nations demonstrated fit as strong in translation as typical personality measures achieve in their nation of origin (although poor per standard benchmarks). Items that performed inconsistently across cultures were removed, and alternates considered in a second subset of nations. Fit and invariance were improved for refined 30–item QB6, 25–item Big Five and 14–item Big Two measures in the third subset of nations. For all models, decrease in comparative fit index between MI levels was larger than .01, indicating lack of support for higher levels. Configural and factorial invariance were relatively stronger, compared to scalar and full. Copyright © 2014 European Association of Personality Psychology
While the scientists developing models of personality over the last century have generally come from a restricted range of nations in North America and Europe, psychology is the study of the human mind and behaviour in general. It is certainly the goal of most psychologists to understand human personality in ways that transcend the immediate place and time of the researcher.
Standard practice in the field has been to thoroughly refine and validate a proposed inventory in the initial language of development. Only after an inventory is well established is it translated into other languages and its cross–cultural applicability assessed. With this project, we take a more ‘culture–fair’ approach. Data from diverse nations are drawn on to refine three personality measures (the QB6 and Big Five and Big Two measures derived from it). Here an inventory platform developed in English (but based on evidence from lexical work in many languages) is tested for cross–cultural applicability at a relatively early stage of development. This allows evidence from diverse cultures to play a role in inventory refinement and should lead to inventories that are more culturally decentred.
The Big Five
The use of lexical studies in the 1970s, based on the rationale that the most important distinctions between people will be encoded in the natural languages (Goldberg, 1981), allowed personality researchers to move away from expert judgment in selection of variables and to base studies of personality structure on objective patterns in personality lexicons. The procedure of lexical studies is easily transferable to diverse languages. In any new setting, four basic steps can be followed: (1) extract all personality relevant terms from a dictionary; (2) reduce to a tractable number; (3) administer in inventory form to participants; and (4) use factor analysis to determine which terms hang together and best distinguish between individuals in the population. A standard methodology (and the linking of results by the use of marker sets) has allowed for comparison of structural models of personality attributes across languages.
The Big Five (Extraversion, Emotional Stability versus Neuroticism, Conscientiousness, Agreeableness and Intellect/Openness) rose to prominence when factor–analytic studies conducted with temperament and personality scales and lexical studies in English, German (Ostendorf, 1990) and Dutch (De Raad, Henriks, & Hofstee, 1992) converged on this model (Goldberg, 1990; Saucier & Goldberg, 1996). A degree of consensus has been highly generative for the field of personality psychology, and many meaningful relations between life outcomes and scores on the five factors have been established (e.g. Ozer & Benet–Martínez, 2006).
Big Five inventories have been used regularly in cross–cultural research but have generally not been subjected to full measurement invariance analyses (Church et al., 2011). Initial investigations, including PCA, have suggested an initial level of configural invariance for the NEO–PI–R across cultures (McCrae & Costa, 1997; Poortinga, Van De Vijver, & Van Helmert, 2002). And Nye, Roberts, Saucier and Zhou (2008), comparing one Big Five scale at a time across three cultural groups (using the mini Markers, Saucier, 1994), found configural but not factorial or scalar invariance. More rigorous measurement invariance analyses of the NEO–PI–R in three nations indicated considerable differential item functioning for nearly half the items (Church et al., 2011).
The Big Six
Lexical studies have since been completed in languages increasingly culturally and linguistically distant from the original trio of Germanic languages. The accumulating evidence suggests that updates to the Big Five model could make it more cross–culturally informed (Ashton et al., 2004; Saucier, 2009). Studies in Italian (De Raad, DiBlas, & Perugini, 1998), Hungarian (Szirmak & De Raad, 1994), Greek (Saucier, Georgiades, Tsaousis, & Goldberg, 2005) and Chinese (Zhou, Saucier, Gao, & Liu, 2009) have not found the Big Five in the five factor solutions. The addition of a sixth factor, including content related to personal integrity versus taking advantage of others, makes the model better match empirical results from a larger group of lexical studies. A more cross–cultural model, drawn from a larger and more diverse population base, is more likely to replicate over time and across additional languages and cultures. Even in North America, the Big Six has been shown to have some theoretical and predictive advantages over the Big Five and to contribute additional interpretive power (Ashton & Lee, 2007; Saucier, 2009; Thalmayer, Saucier, & Eigenhuis, 2011). Luckily, the Big Six model is highly isomorphic to the Big Five, allowing for straightforward integration of previous research results with this updated model.
The Questionnaire Big Six (QB6) scales, including Conscientiousness, Honesty/Propriety, Agreeableness (Kindness and Even Temper), Resiliency versus Internalising Negative Emotionality, Extraversion (Gregariousness and Positive Emotionality) and Originality/Talent, are highly comparable to Big Five dimensions and to Ashton and Lee's (2007) HEXACO six–factor inventory (Saucier, 2009). The QB6 scales are complementary to the HEXACO inventories in being shorter. Advantages of QB6 include better elucidation of the ‘externalising’ domain, compared to the Big Five, because Agreeableness and Honesty/Propriety distinguish between reactive versus predatory aggression, respectively, at their low ends. Internalising affect (depression, anxiety, tendencies toward panic and phobias) is also better represented than in Big Five measures of similar length. And Originality/Talent encompasses perceived talents, abilities and intellectual interests, including ‘positive valence’ content typically found in broader variable selection studies but excluded in most inventories (Thalmayer et al., 2011).
The Big Two
There is evidence that one–factor and two–factor models of personality structure may be even more ubiquitous (Saucier, Thalmayer, & Bel–Bahar, ; Saucier, Thalmayer, et al., 2014). Saucier, Thalmayer, et al. (2014) provide specific highly recurrent terms for a two dimensional model (Social Self–Regulation [S] and Dynamism [D]) drawn from nine diverse lexical studies. This ‘Big Two’ was not derived as higher–order factors from Big Five (or Six) scales but from the first two factors derived when hundreds of natural–language descriptors are analysed. One factor (D) appears to relate to the relative proportion of approach versus avoidant tendencies in the personality, whereas the other (S) relates to the internalisation of social and cultural norms. This model of personality attributes is more ‘culturally decentred’—based on data from diverse populations around the world—thus, it minimises bias for or against one kind of human culture or population.
A two–factor model is the highest of three levels of structure commonly used by contemporary personality psychologists; higher–order factors of the Big Five (Digman, 1997; De Young, 2006) are similarly at this level and are comparable to the Big Two. This simple model can be differentiated into the useful midlevel, with five or six factors. Even more predictive power is available at the facet level, where each of the five or six factors is differentiated into subcomponents (John & Srivastava, 1999), as in the NEO–PI–R (Costa & McCrae, 1992) or the HEXACO (Lee & Ashton, 2004). Psychologists will naturally choose more differentiated models where possible to facilitate prediction. But two factors make for a parsimonious model with potential advantages for theory. They replicate reliably across diverse cultures and languages and across diverse variable selection strategies and procedures (Saucier, Thalmayer, et al., 2014) and thus offer a firmer foundation for the cross–cultural study of personality. An inventory developed using this culturally decentred model is more appropriately and should be more easily, translated into new languages, facilitating cross–cultural research and measurement invariance.
Cross–cultural measurement invariance and goals for the current study
The current study assesses cross–cultural consistency in Big Six self–report personality data from 26 nations collected as part of the Survey of World Views, a large omnibus survey of constructs relevant to cross–cultural psychology (Saucier, Kenner, et al., 2014). The 36QB6 is tested for measurement invariance (MI) and refined for cross–cultural applicability. Because the Big Five is the closest the field of personality has to a ‘consensual model’ and because it is now often measured across cultures, a workable Big Five inventory is also constructed from items in the dataset, tested and refined. Because the Big Two has theoretical and cross–cultural advantages, but no measure of it currently exists, a 20–item Big Two inventory developed from QB6 items is also tested and refined. Developing and validating the three measures from QB6 items can allow researchers, regardless of preferred model, to make use of the translations into 31 languages of the 40 personality items used in the Survey of World Views (all items and translations are freely available at http://psychometriglossia.uoregon.edu/).
Invariance testing allows us to determine the extent to which items are used in similar ways by different groups and the extent to which the same patterns of correlations between items emerge. To the extent that MI can be established for the QB6 and/or its QB5 and QB2 off–shoots, we can have more confidence that these models of personality and these specific inventories are cross–culturally appropriate. Where established, comparison of correlations between attribute dimensions and other constructs and life outcomes of interest can confidently be made across cultural groups.
Invariance testing typically proceeds in four stages. At the most basic level, configural MI tests whether the same factors apply across groups; there are no parameter equality constraints. If established, configural MI indicates that individuals across nations use the same number of latent variables to reflect differences in scores on the items, providing a reference model for more constrained models. We can then proceed to test factorial or metric equivalence—whether the same factor structure (number of latent variables and interrelationships to one another and indicator items) holds across the groups (Vandenberg & Lance, 2000) and thus whether same items can be used to assess the constructs across groups. Factorial invariance involves a constraint of equality across groups for factor loadings. If established, this suggests that items are used in a similar way across groups with respect to factor structure and that latent variables have well–matched content across groups; in this case, it is reasonable to examine the relationships of these latent variables to other constructs of interest across groups. A lack of MI at this stage means there is content in the latent constructs that varies from group to group and suggests that items are perceived and interpreted differently or that attributes covary with one another inconsistently across contexts. Factorial invariance is necessary though not sufficient for comparing scores across groups.
The level of scalar equivalence tests whether patterns of scores and weight parameters (factor loadings) match across groups, such that relative differences can be compared. It sets a constraint that intercepts be equal across groups, so that any cross–cultural differences cannot be attributed simply to differential functioning the single indicators in various groups. Finally, full equivalence involves constraints on the residual variances and tests whether scales measure latent traits with similar reliability across groups. Full (or strict) invariance means that one can directly compare scores at face value across groups, interpreting differences as applied to latent constructs.
Models will initially be tested in each country using single–group confirmatory factor analysis (CFA). There is reason to anticipate levels of fit that do not achieve standard benchmarks per Hu and Bentler (1999). For multifactor inventories like the QB6, with measurement at the item level, such benchmarks are rarely, if ever, achieved (Marsh, Hau, & Wen, 2004). This might be due to a variety of factors: accumulation of item–level error, order and method effects, similarities in wording and life–domains referenced (e.g. Poortinga et al., 2002). It can also be argued that personality itself lacks the ‘local independence’ or simple structure that fit indices reward (Cramer et al., 2012). In the QB6, items that are direct opposites of one another have generally been avoided, and the largest possible range of domain content has been included in each short scale. Such an approach is intended to maximise predictive validity, not internal consistency.
Hopwood and Donnellan (2010) demonstrate that multidimensional personality inventories, many of which were developed by exploratory factor analysis, routinely fail to achieve adequate fit per standard benchmarks. Their CFAs of eight inventories (all constructed in North America) found that none achieved adequate fit in a North American community sample, despite established predictive validity. (Two had inadmissible results, remaining six: Tucker–Lewis index (TLI) .52–.70, comparative fit index (CFI) .61–.79, root mean square error of approximation (RMSEA) .09–.13). If it is difficult to achieve good fit of multidimensional models in one population, it will be even more challenging to find it in models tested across diverse populations. Thus, comparisons will be made to the fit indices reported by Hopwood and Donnellan (2010) as reasonably high, ‘domain specific’ benchmarks.
The current study initially assesses the cross–cultural usability of QB6. The Big Six model was developed using the results of culturally diverse lexical studies (Saucier, 2009), and thus, it is expected to have a better chance of measurement invariance across cultures than many other personality models. However, the measures of the Big Six were developed using North American data as a baseline, so the QB6 is likely to fit best in the North American populations that had the most impact on its development. It is likely that it will fit less well as samples more culturally distant from this place of origin are tested.
A Big Five model and a Big Two model will also be tested. The Big Five is a simpler structure than the Big Six, but it reflects a somewhat smaller base of lexical personality research. Thus, the overall fit is anticipated to be similar to the Big Six. The Big Two is a parsimonious model drawing on a more diverse range of cultures than the Big Six (Saucier, Thalmayer, et al., 2014). Thus, it might be anticipated to demonstrate better cross–cultural measurement invariance, particularly in nonwestern settings. The comparative fit of the models, however, is not the purpose of the current study. Because the three models are all derived from a Big Six measure, the Big Five and Big Two begin such a comparison at a disadvantage. Our main purpose in including additional models derived from a Big Six measure is to explore the relative fit of items and thereby refine measures of the three models for the use of researchers who collect survey data for cross–cultural comparisons.
Method
Participants
Survey of World Views data included 8883 participants from 33 countries. In the current study, several exclusion criteria were applied prior to analysis. Participants were eliminated if they were not students, if more than 10% of a participant's 36QB6 responses were missing, if that participant's standard deviation for 36QB6 items was below .50 (to cull those who tended to give the same response for every item) or if they were one of a few cases judged to be a likely duplicate responder. Participants were also excluded if they were very extreme and consistent with respect to yea–saying or nay–saying in the full questionnaire. Finally, countries were excluded if the remaining sample was smaller than 150 participants. Criteria for even stricter exclusions were applied only as a last resort in individual country samples where problems with analysis convergence were encountered (noted in text).
Table 1 displays sample sizes per country for the 7378 participants from 26 nations included in the current analyses. Average age in the samples ranged from 19.8 in the Philippines and Ukraine to almost 24 in Kenya, Ethiopia and Argentina, and 24.5 in Tanzania (average sample mean age = 21.7, SD = 1.28). In four of the 26 nations, men were the majority of participants (Bangladesh [22% female], Ethiopia [28%], Tanzania [31%] and Kenya [34%]). In the remaining 22 nations, women were the majority, with the highest percentages in Thailand (75%), Brazil (78%) and Poland (89%; average across samples = 59% female).
Sample sizes and means and standard deviations of scales for the 26 countries, grouped by region
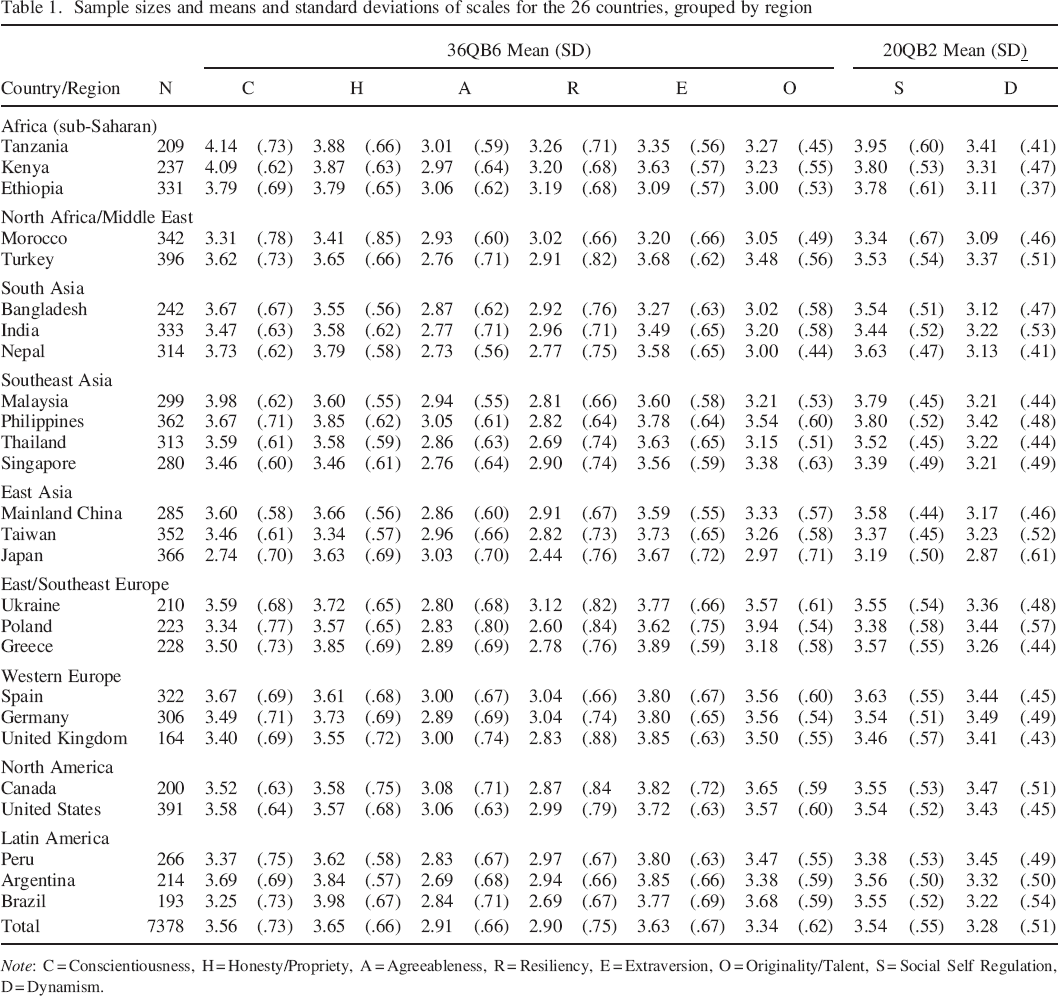
Note: C = Conscientiousness, H = Honesty/Propriety, A = Agreeableness, R = Resiliency, E = Extraversion, O = Originality/Talent, S = Social Self Regulation, D = Dynamism.
The country samples were grouped into three subsets to facilitate model respecification and testing. Selection of countries into these subsets was made prior to this study by the second author, such that each has a high N and represents all major parts of the world in a similar way. Splitting the countries into three sets enabled us to (a) test a priori structural models, (b) empirically derive models that might achieve a better fit and (c) rigorously test those models to establish their generalisability and usefulness to investigators in future studies. We were able to use the first set of countries as a derivation sample, in which a model is derived and optimised, and the second set of countries as a cross–validation sample, in which the fit of the optimised model is interpreted as a realistic estimate of the generalisability of the optimised model to other samples (Wiggins, 1973). This procedure could then be repeated to further refine the model for cross–validation in the third set of countries. Cross–validation is recommended for regression–based procedures when the sample is large enough (Horst, 1966; Wiggins, 1973). Each of our sets of countries had over 2000 cases, which seems a sufficient sample size for empirically deriving or for testing a model.
Procedure
Country selection attempted to represent the world, in terms of demographic footprint and economic impact. The 33 sampled countries have aggregated populations amounting to 67.3 percent (4.7 billion) of the world's population; when the gross domestic product of these 33 countries is aggregated, the total makes up 76.2 percent of the gross aggregate domestic products of all countries in the world (Central Intelligence Agency, 2012).
Cooperating faculty from diverse fields publicised the study to students at their own higher–education institutions. Data were collected online in 2012 via a US server platform, with compensation handled via Western Union or Amazon gift coupons. See Saucier, Kenner, et al. (2014) for details about data collection and the full sample. Use of college students enabled standardised online administration and minimised between–population differences in level of education.
Materials
The current study used 40 total QB6 items (the 36QB6 and, appended at the end, four QB6 items from longer versions; Saucier, 2009; see Table 2). Questionnaires for participants in Canada, England, India, Kenya, Singapore and the United States were in English. Participants in other countries used items translated into Chinese (China, Taiwan), ‘new world’ Spanish (Peru, Argentina), Castilian Spanish (Spain), Arabic (Morocco), Kiswahili (Tanzania), Amharic (Ethiopia), Portuguese (Brazil), German, Polish, Ukrainian, Greek, Turkish, Japanese, Thai, Malay, Nepali, Bengali or Filipino/Tagalog. In all cases, back–translation was used, with at least two translators working independently.
Initial QB6 personality items and final Big Five and Big Six inventories
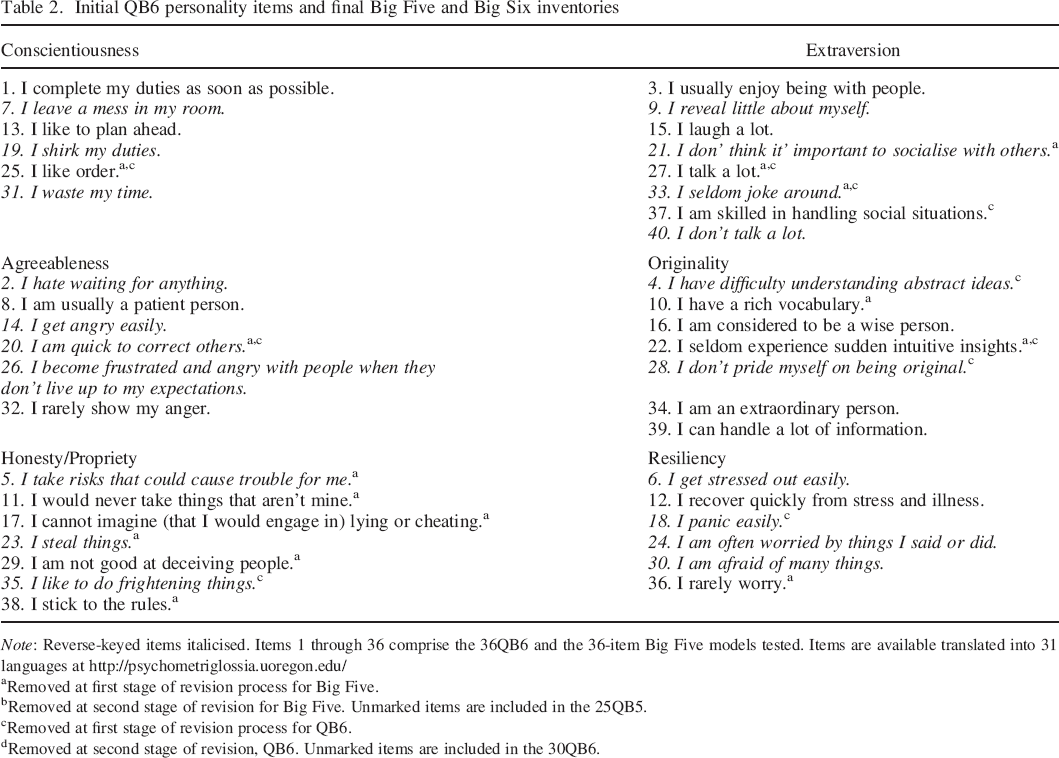
Note: Reverse–keyed items italicised. Items 1 through 36 comprise the 36QB6 and the 36–item Big Five models tested. Items are available translated into 31 languages at http://psychometriglossia.uoregon.edu/
Removed at first stage of revision process for Big Five.
Removed at second stage of revision for Big Five. Unmarked items are included in the 25QB5.
Removed at first stage of revision process for QB6.
Removed at second stage of revision, QB6. Unmarked items are included in the 30QB6.
In addition to the QB6, a Big Five model and indicators of the Big Two, Social Self–regulation and Dynamism were analysed. The initial Big Five included all items from the 36QB6, with Agreeableness (A) and Honesty/Propriety (H) items collapsed into a single scale. This conceptualisation of an A/H scale emphasises H more than some Big Five A scales (there is greater emphasis here on patience and on a lack of hostility or taking advantage of others and less on being actively kind). However, De Raad et al. (2010) argue that the Honesty dimension should rightly be considered part of Agreeableness, in part based on their interpretation of Ashton and Lee (2007) that two of the six facets of NEO–PI–R A are Honesty related. As evident in Thalmayer et al. (2011, supplemental materials), the other scales of the 48QB6 (a slightly longer version of the 36QB6) correlate highly with analogous BFI (John, Donahue, & Kentle, 1991) and NEO–FFI (Costa & McCrae, 1992) Big Five scales. The convergent correlations were .80 to .81 for Conscientiousness, .76 to .82 for Resiliency and Emotional Stability versus Neuroticism, .68 to .70 for Extraversion and .63 to .74 for Openness and Originality. The highest divergent correlation was only .36 (BFI Agreeableness with QB6 Extraversion).
Ten–item Big Two scales (see Table 3) were developed from the 40 personality items available in the Study of World Views data using the following procedure:
The 40 items were correlated in the Eugene Springfield Community Sample (N = 453) with Big Two adjective markers from Saucier, Thalmayer, et al. (2014).
For Social Self–Regulation (S), terms included are as follows: honest, kind, generous, gentle, good, obedient, respectful, diligent, responsible and (reverse keyed) selfish. For Dynamism (D), terms included are as follows: active, brave, bold, lively and (reverse keyed) timid, weak and shy. A reduced set with at least (roughly) double the loading on the primary versus secondary factor (relatively univocal) was retained. An EFA indicated items with low loadings that could be dropped, resulting in 13 S and12 D items retained. An EFA with the 25 items in a college student sample (N = 225) indicated four items with low loadings and one overly redundant item for removal, leading to scales with 10 items each.
Big Two Items, with Big Six scale source noted
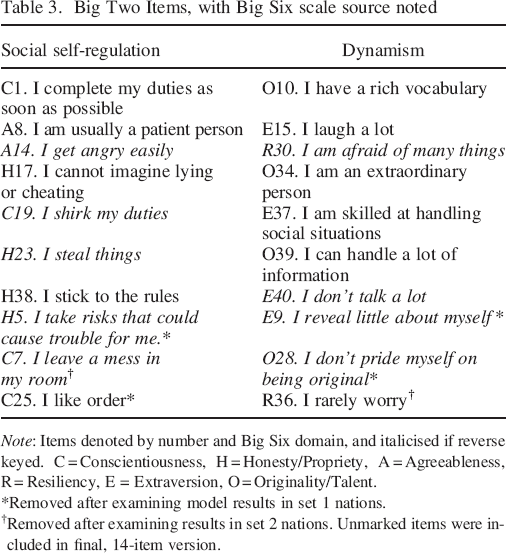
Note: Items denoted by number and Big Six domain, and italicised if reverse keyed. C = Conscientiousness, H = Honesty/Propriety, A = Agreeableness, R = Resiliency, E = Extraversion, O = Originality/Talent.
Removed after examining model results in set 1 nations.
Removed after examining results in set 2 nations. Unmarked items were included in final, 14–item version.
Analyses
The 36QB6, 36–item Big Five and 20–item Big Two were initially tested individually in each of the set 1 countries using confirmatory factor analysis in Mplus version 7. The set including the United States was chosen as set 1 to facilitate comparison with fit in the country most influential in creating the QB6 model. Comparisons were made to standard benchmarks per Hu and Bentler (1999) and to domain specific benchmarks fit statistics (those reported by Hopwood and Donnellan [2010]), as detailed above.
Measurement invariance was then tested in four stages (as described above and following Muthén and Muthén [1998–2012]):
Configural invariance: Factor means fixed at zero in all groups, but factor loadings and other parameters allowed to vary. Factorial/metric invariance: Adds constraint of equal factor loadings across samples to above. Scalar invariance: Adds constraint of equal intercepts across groups to above; factor means fixed at zero in one group and free in others. Full/strict invariance: Adds constraint of equal error variances to all above constraints.
According to Cheung and Rensvold (2002) and Kline (2011), change in CFI between one level and the next of more than .01 indicates that the null hypothesis of invariance should not be rejected (in other words, fit may be worse at the stricter level). Fit at all levels is reported, however, regardless of whether the criterion is met, for relative comparisons.
Next, items were removed from the 36QB6, 36–item Big Five and 20–item Big Two based on review of standardised loadings and intercepts across set 1 countries (for this step, all 40 available items were considered for the QB6, and 39 of the 40 (excluding additional H item ‘I stick to the rules’, which was believed to be more similar to Big Five Conscientiousness than Agreeableness content). The refined, provisional models were then tested individually in each set 2 nation, and again standardised loadings and intercept variation across countries were perused to identify items for removal. The final refined models were then tested individually and for measurement invariance in set 3 nations. For comparison purposes, the original, full–length models were also run in the set 3 nations.
Results
Questionnaire Big Six
The fit of the 36QB6 in the first set of nations is reported in Table 4. The model converged in all, and fit was similar across countries. Notably, fit was not better in the United States than in other cultural groups. The fit of the QB6 across nations did not meet standard benchmarks for good fit in any nation, but it was similar to or better than that reported by Hopwood and Donnellan (2010) for broad personality inventories developed and tested within North American samples. Thus, fit can be said to have met domain specific benchmarks in most of the set 1 nations.
Fit Indices of the 36QB6 in set 1 nations, individually and for progressively more stringent measurement invariance tests
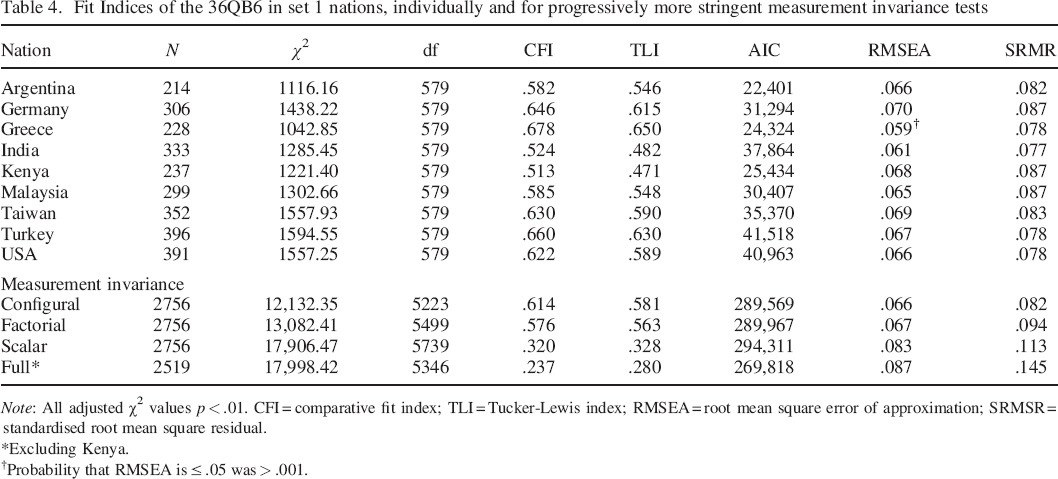
Note: All adjusted χ2 values p < .01. CFI = comparative fit index; TLI = Tucker–Lewis index; RMSEA = root mean square error of approximation; SRMSR = standardised root mean square residual.
Excluding Kenya.
Probability that RMSEA is ≤ .05 was > .001.
The results of testing the four levels of measurement invariance of the 36QB6 in set 1 are also reported in Table 4. These indicate little change in fit between configural and factorial invariance, but some decline in fit between factorial and scalar levels. Between all levels, however, the change was larger than the .01 criteria proposed by Cheung and Rensvold (2002) to indicate nonsignificant change. The last stage, full measurement invariance, had to be tested excluding Kenya, due to difficulty with convergence for the Kenyan group (not positive definite) in this test only. For comparison purposes, the other three levels are additionally reported excluding Kenya.
Next, in hopes of revising for maximum cross–cultural fit, we consulted modification indices. However, these were difficult to act on, because of inconsistency in indications across groups and lack of interpretability. Instead, we considered the item pool systematically, in terms of indices of item difficulty and discrimination. The four additional QB6 items (two Extraversion [E], one Honesty/Propriety [H] and one Originality [O]) were added to the 36 original items, and the 40 items were perused for differential item functioning across set 1 countries. Items that fit relatively poorly cross–culturally were identified in terms of (a) number of countries for which standardised loadings of the item on intended factor was lower than .25 and (b) high standard deviation in intercepts, indicating greater relative variation in endorsement (difficulty) across nations. On this basis, seven items (one each from Conscientiousness [C], H and Agreeableness [A], and two each from O and E) were removed from the group (see Table 2). 1
The provisional 33–item QB6 was then tested using CFA in the second set of nations (see Table 5). Inspection of item standardised loadings and intercepts in this set, and an effort to maintain balanced keying, led to further removal of one item each from the E, O, H and Resiliency scales. (Because the model did not converge in the data from Morocco or Tanzania, standardised loadings from these groups were not available.) This led to a refined 30–item version (henceforth 30QB6), with exactly five items on each scale.
The provisional 33–item QB6 in set 2 nations
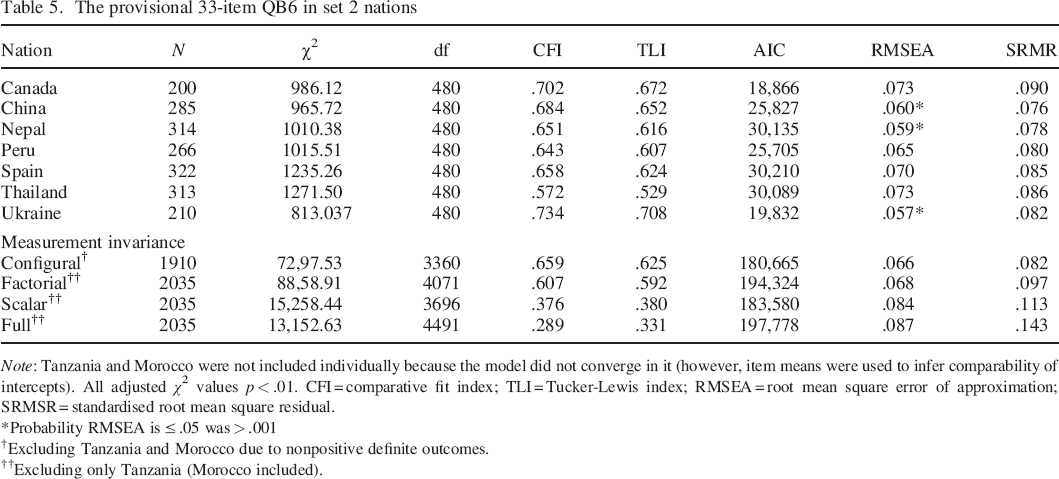
Note: Tanzania and Morocco were not included individually because the model did not converge in it (however, item means were used to infer comparability of intercepts). All adjusted χ2 values p < .01. CFI = comparative fit index; TLI = Tucker–Lewis index; RMSEA = root mean square error of approximation; SRMSR = standardised root mean square residual.
Probability RMSEA is ≤ .05 was > .001
Excluding Tanzania and Morocco due to nonpositive definite outcomes.
Excluding only Tanzania (Morocco included).
The fit of the 30QB6 and the progressive measurement invariance analyses in set 3 nations are reported in Table 6. Due to some difficulties with convergence in the data from Ethiopia, more stringent data selection criteria were used in that group, 2 and one item with especially poor fit was excluded (R36: ‘I rarely worry’). Fit indices indicate better fit than for the 36QB6 in set 1, and similar fit to domain specific benchmarks. For direct comparison, progressive measurement invariance analyses for the 36QB6 in this set of nations are also included. (At the scalar and full levels, the analysis could not be reported due to difficulties with the Ethiopia set, and analyses are reported excluding Ethiopia. Comparable analyses of the 30QB6 were added.) The comparison favours the 30QB6 over the 36QB6, as hypothesised, particularly (in some cases only) in terms of CFI and TLI.
The 30QB6 in set 3 nations
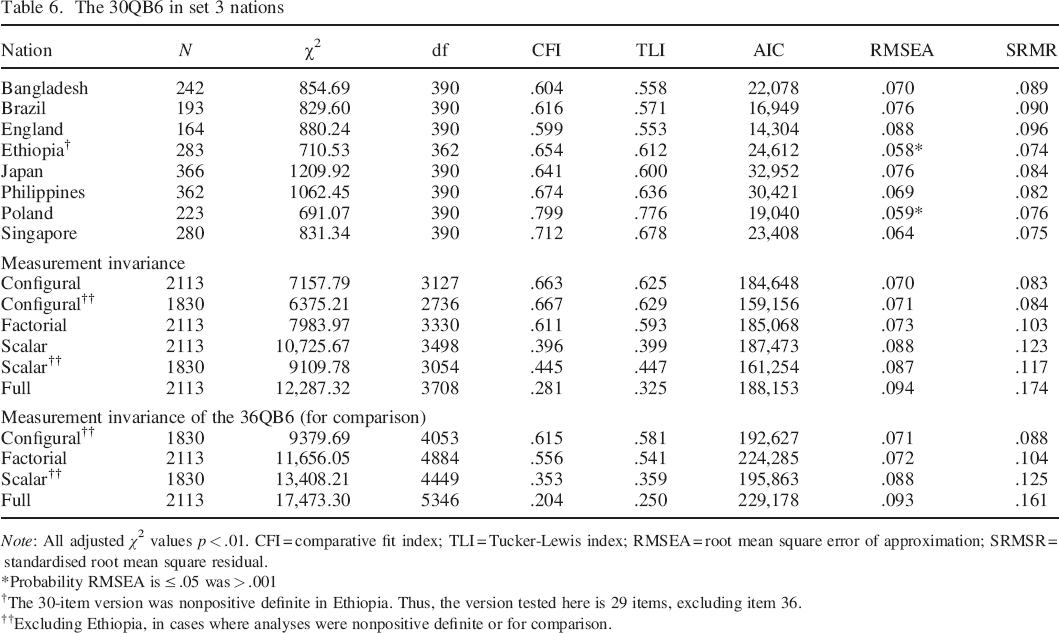
Note: All adjusted χ2 values p < .01. CFI = comparative fit index; TLI = Tucker–Lewis index; RMSEA = root mean square error of approximation; SRMSR = standardised root mean square residual.
Probability RMSEA is ≤ .05 was > .001
The 30–item version was nonpositive definite in Ethiopia. Thus, the version tested here is 29 items, excluding item 36.
Excluding Ethiopia, in cases where analyses were nonpositive definite or for comparison.
The Big Five
The fit of the 36–item Big Five in the first set of nations is reported in Table 7. The model converged in all, and fit was similar across countries. Again, fit was not better in the United States than for other cultural groups. As for the 36QB6, fit across nations failed to meet standard benchmarks while generally meeting domain specific benchmarks. The results of testing the four levels of measurement invariance again indicate little change in fit between configural and factorial invariance, but some decline in fit in scalar and full levels. Fit is slightly better for the Big Five than for the Big Six model in terms of CFI and TLI. Again, CFI difference between levels of invariance was always greater than .01, indicating that more stringent models fit significantly more poorly.
Fit indices of initial 36–item Big Five measure in set 1 nations, individually and for progressively more stringent measurement invariance tests
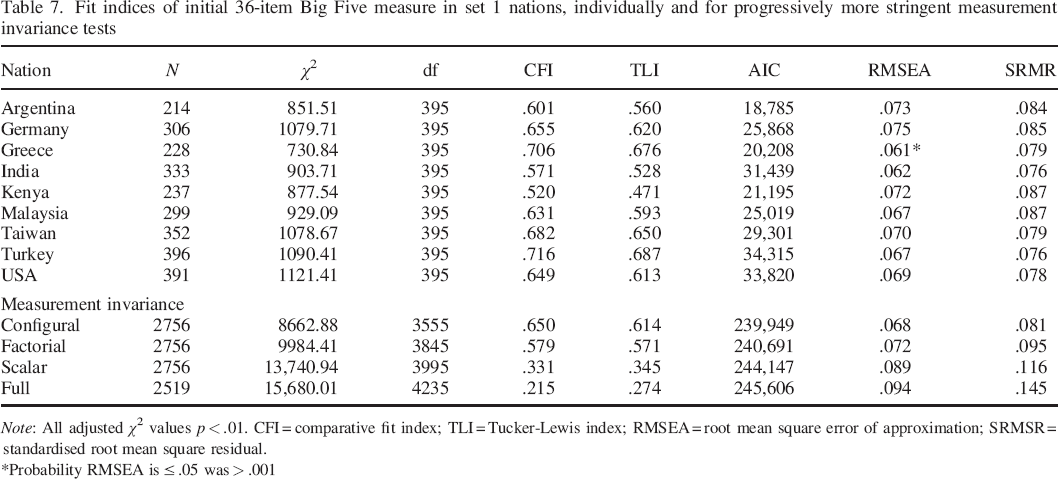
Note: All adjusted χ2 values p < .01. CFI = comparative fit index; TLI = Tucker–Lewis index; RMSEA = root mean square error of approximation; SRMSR = standardised root mean square residual.
Probability RMSEA is ≤ .05 was > .001
To revise for maximum cross–cultural fit, three of the four additional QB6 items (two Extraversion [E] and one Originality [O]) were added to the 36 original items, and CFA results for this 39–item version in each set 1 country were perused as described above for the QB6. Here too, seven items (one each from Conscientiousness [C] and O, two from E and three from Agreeableness/Honesty [A/H]) were removed from the group. This provisional 32–item Big Five measure was then tested using CFA in the second set of nations (see Table 8). Inspection of standardised loadings and intercepts, and an effort to maintain balanced keying and scales of similar length, next led to removal of one item each from the E, O and Resiliency scales, and all four remaining H items from the A/H scale. (Because the model did not converge in the data from Morocco or Nepal, standardised loadings from these groups were not available.) This led to a 25–item Big Five, with five items on each scale.
The provisional 32–item Big Five in set 2 nations
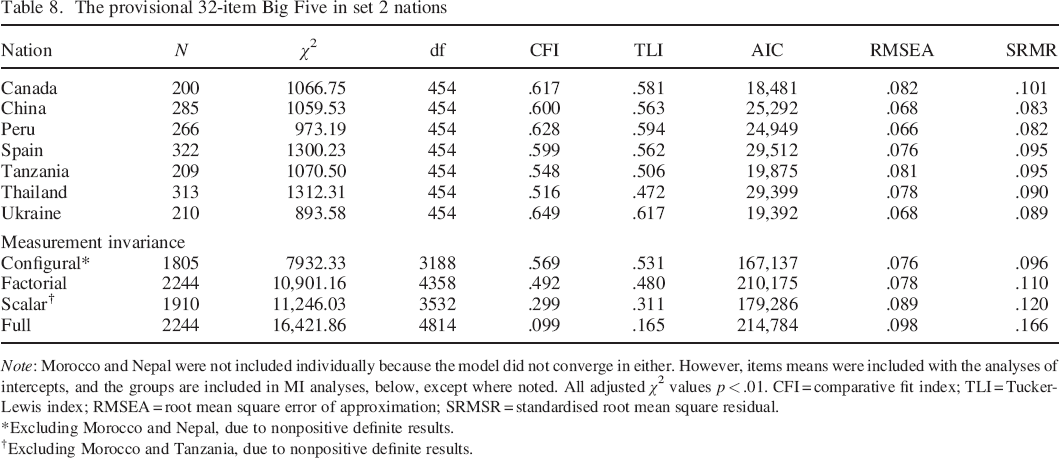
Note: Morocco and Nepal were not included individually because the model did not converge in either. However, items means were included with the analyses of intercepts, and the groups are included in MI analyses, below, except where noted. All adjusted χ2 values p < .01. CFI = comparative fit index; TLI = Tucker–Lewis index; RMSEA = root mean square error of approximation; SRMSR = standardised root mean square residual.
Excluding Morocco and Nepal, due to nonpositive definite results.
Excluding Morocco and Tanzania, due to nonpositive definite results.
The fit of the 25–item Big Five measure (henceforth 25QB6) and the progressive measurement invariance analyses in set 3 nations are reported in Table 9. Fit indices indicate better fit than the 36–item version in set 1.
The 25QB5 in set 3 nations
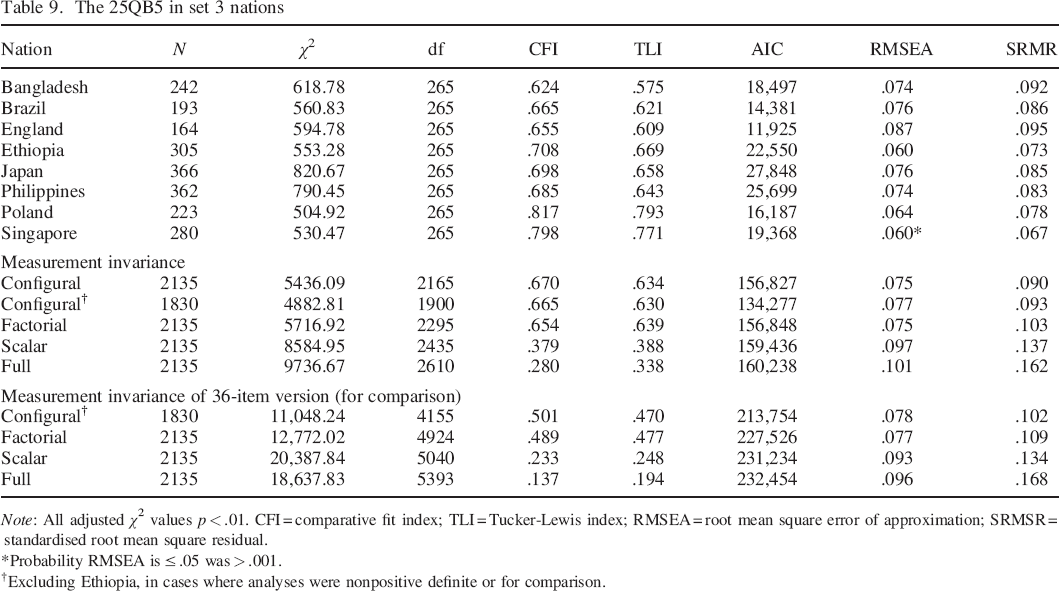
Note: All adjusted χ2 values p < .01. CFI = comparative fit index; TLI = Tucker–Lewis index; RMSEA = root mean square error of approximation; SRMSR = standardised root mean square residual.
Probability RMSEA is ≤ .05 was > .001.
Excluding Ethiopia, in cases where analyses were nonpositive definite or for comparison.
The Big Two
The 20–item Big Two measure fit slightly less well in the set 1 data than did the 36QB6 (see Table 10). Again, change in CFI between levels of measurement invariance was greater than .01 in all cases. There was an especially substantial drop–off in fit between factorial and scalar levels, indicating variation in scale means across groups (see Table 1 for scale means by nation).
The 20–item QB2 in set 1 nations
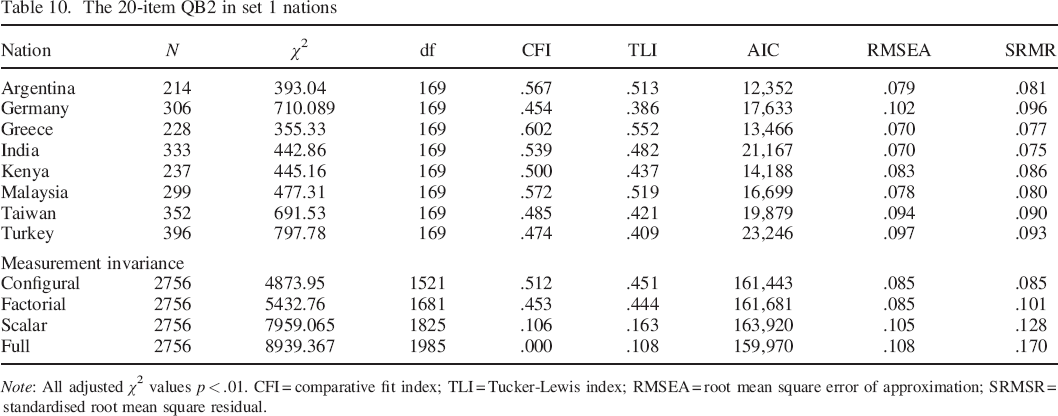
Note: All adjusted χ2 values p < .01. CFI = comparative fit index; TLI = Tucker–Lewis index; RMSEA = root mean square error of approximation; SRMSR = standardised root mean square residual.
As above, the standardised loadings of items on their factors and the standard deviation of item intercepts were consulted to identify cases of differential item functioning for removal. Balanced keying and maintenance of relatively even proportions of Big Six factor content in each of the Big Two were also considered. On the Social Self–Regulation scale, one H and two A items stood out as having particularly problematic loadings and intercepts. Three others (two H and one C item) had more minor indications of poor fit. Because the scale was made with three H and three C, but only two A items, however, the worst fitting H and C items were removed, and both A items were retained. Similarly, for Dynamism, because the scale was made from three E and O but only two Resiliency (R) items, E and O items were chosen for removal from the pool of those with most problems in fit (see Table 3).
This provisional 16–item Big Two measure was tested in the second set of nations (see Table 11). Again, standardised loadings and intercepts across countries were consulted to identify differential item functioning. For S, the poorest fit was observed for one item each from C, H and A. Only the C item was removed in order to retain an adequate range of content. For D, the poorest fit was observed for one E and the two R items. In the interest of retaining the few remaining reverse–keyed items, only one R item was removed.
The provisional 16–Item QB2 in set 2 nations
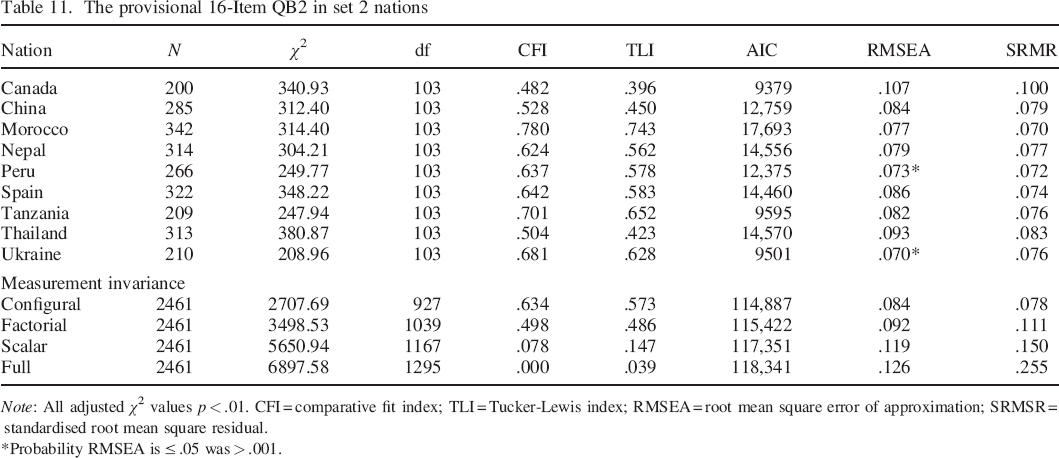
Note: All adjusted χ2 values p < .01. CFI = comparative fit index; TLI = Tucker–Lewis index; RMSEA = root mean square error of approximation; SRMSR = standardised root mean square residual.
Probability RMSEA is ≤ .05 was > .001.
The refined 14–item Big Two inventory (henceforth 14QB2) was tested in set 3 nations (see Table 12). Measurement invariance was still very poor at scalar and full levels. Compared to the 20–item Big Two in the same datasets, fit was slightly improved at all levels. 3 (Table 13)
The 14QB2 in set 3 nations
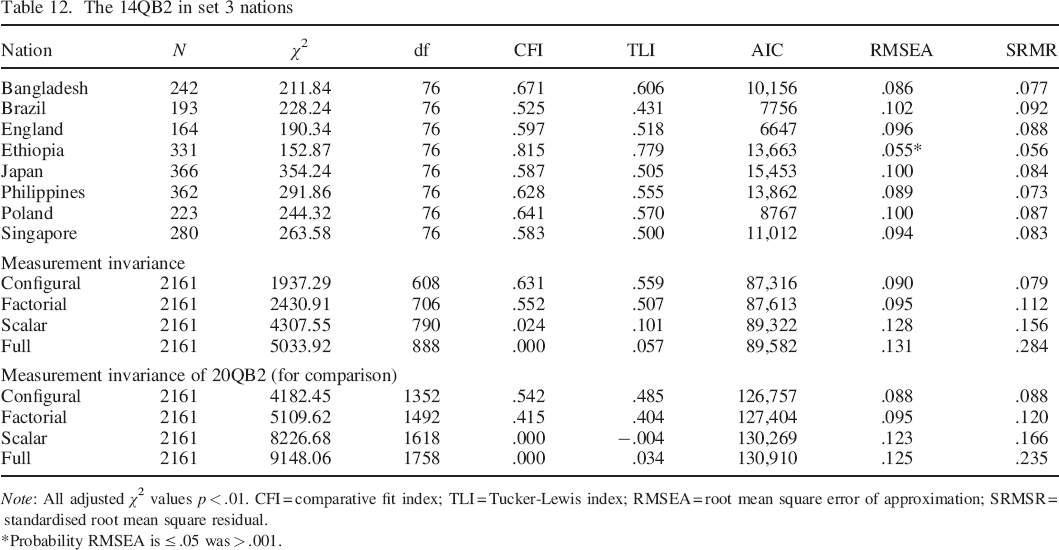
Note: All adjusted χ2 values p < .01. CFI = comparative fit index; TLI = Tucker–Lewis index; RMSEA = root mean square error of approximation; SRMSR = standardised root mean square residual.
Probability RMSEA is ≤ .05 was > .001.
Standardised loadings and interfactor correlations (factorial invariance), refined inventories

Table 14 presents reliability values for the refined scales. The modest level of many of these indicators of internal consistency can be attributed in large part to the abbreviated nature of the scales. The scales are designed to capture the core of each factor in a maximally cross–culturally generalisable way, with the expectation that future psychometric work can effect an increase the number of items and can rebuild internal consistency indices to more consistently adequate levels.
Internal consistency (Cronbach's alpha) for refined scales in 26 nations
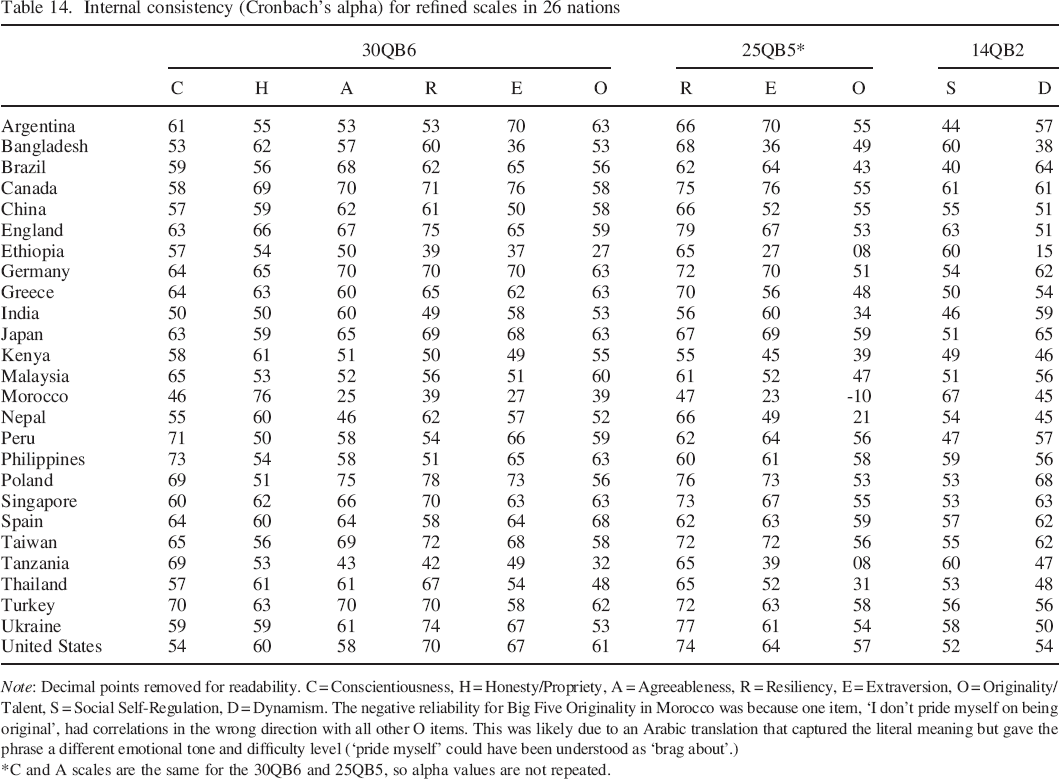
Note: Decimal points removed for readability. C = Conscientiousness, H = Honesty/Propriety, A = Agreeableness, R = Resiliency, E = Extraversion, O = Originality/Talent, S = Social Self–Regulation, D = Dynamism. The negative reliability for Big Five Originality in Morocco was because one item, ‘I don't pride myself on being original’, had correlations in the wrong direction with all other O items. This was likely due to an Arabic translation that captured the literal meaning but gave the phrase a different emotional tone and difficulty level (‘pride myself’ could have been understood as ‘brag about’.)
C and A scales are the same for the 30QB6 and 25QB5, so alpha values are not repeated.
Discussion
In the current study, data from an unusually diverse group of nations were used to test the measurement invariance and cross–cultural applicability of the 36QB6, a measure developed to improve on the cross–cultural validity of similar inventories. Big Five and the Big Two models were also tested. Additionally, the large dataset was used to refine more cross–culturally informed versions of all three measures. Refined (but still provisional) versions presented here are the 30QB6, 25QB5 and 14QB2.
Compared to standard fit indices (Hu & Bentler, 1999), the fit of the initial models in set 1 was marginal. While SRMR was under .09 for most, RMSEA (which rewards parsimony) indicated close fit in some instances and adequate fit in many. In no case did CFI or TLI ‘incremental fit indices’ meet the benchmark (.90 or above). This was anticipated due to analysing an item–level, Likert–scale measure (Kline, 2011), with multiple factors and because broad–bandwidth personality inventories of this nature consistently achieve poor fit, even when they demonstrate strong criterion validity (Hopwood & Donnellan, 2010). Fit in CFA may be fundamentally constrained for such inventories, given cross loadings and similarities in wording or life domain that logically result in correlated errors (Poortinga et al., 2002). For CFI (which assesses variance explained over the null model), low values were likely due to low standardised loadings of items on factors (low ‘factor saturation’). Compared to fit indices reported by Hopwood and Donnellan (2010) for an array of personality inventories developed and tested and in North America, the results of CFA in the individual countries suggested similar levels of fit. This might be taken to indicate some level of cross–cultural fit in this particular field of study.
As predicted, neither the Big Six nor Big Five models had a clear advantage over the other. Comparing the refined 30–item and 25–item versions, the Big Five had slightly better CFI and TLI values, but the QB6 had slightly better RMSEA values. SRMR values were mixed for CFA in individual countries, but slightly better for across–country analyses in the QB6.
In the tests of measurement invariance, more stringent levels in no cases met the criteria of less than .01 decrease in CFI. Thus, strictly speaking, the inventories do not meet criteria for measurement invariance. Looking at relative fit across levels, however, it can be seen that results suggest acceptable fit at the configural and factorial levels, provided that comparison is made to domain specific benchmarks. Fit at the configural level suggests that the same number of factors may work acceptably (again, by domain specific standards) across nations for the refined versions of all three inventories. At the factorial level, there is likewise indication that the items load in a rather consistent pattern on the same factors across nations, so that the factors would have similar interpretation.
The moderate (for the QB6 and Big Five) or dramatic (for the Big Two) drop–off in fit at the scalar level is not surprising given the divergences in scale means, observable in Table 1. It appears that while the models all work more or less adequately (by domain specific benchmarks) at basic levels, to explain the number of latent variables present for the items and which items relate to which scales, they do not currently offer any basis for mean comparisons across cultures. Such comparisons, of course, are problematic for many reasons. Cultural diversity leads to challenges in scale translation because in many cases the same concepts (pride, insights, taking risks) convey different emotional or evaluative tones. Highly differential levels of familiarity with survey tasks can lead to differences in use of the scale options. Reference group effects can also affect responses and scores (Heine, 2012; Heine, Lehman, Peng, & Greenholtz, 2002)—likely the case with Conscientiousness in the current data, where the lowest mean score was observed in Japan, a place hardly known for a lackadaisical, impulsive way of life (scores in Tanzania were two standard deviations higher). Consistent cultural differences in the amount of variance observed in trait scales, with Europeans expressing the greatest within–group variation and East Asians and Africans the least, have also been reported (McCrae, 2002). This may be because in individualistic, as opposed to collectivistic, cultures, more diversity may be expressed and given importance (McCrae, 2002). It may also be due to response styles driven by similar cultural forces. For example, in East Asia, there is more tendency toward middle responding (McCrae, 2002).
The difficulty of fitting the QB6 model in data from Africa (Morocco, Ethiopia and Tanzania) provides an excellent illustration of the effect of population selection in developing a model. The Big Five was initially developed in a small range of nations, principally the United States (e.g. Goldberg, 1990), with crucial early confirmation in the Netherlands and Germany. The Big Six drew on data from a larger and more diverse group of countries (Ashton et al., 2004), but this group did not include any from the African continent. None of the models were developed using data from South America, either, but this has likely been less consequential, since South American countries use European languages and their populations are partly a European diaspora. The Big Two model conceptualised here, on the other hand, was developed based on data from nine nations, two of them African (Saucier, Thalmayer, et al., 2014). And in the present study, the Big Two model fit just as well in data from Africa as it did in nations from other regions. It is of note that the final QB2 version fit best first in Ethiopia, second in Bangladesh and worst in England. The Big Two is, if anything, strongest in the ‘global south’, although the differences are small, and the model works nearly as well in the ‘global north’. Because of a dearth of lexical studies there, we do not really know what indigenous five–factor and six–factor models would be in the ‘global south’; they may have their own replicable patterns, for example an alternative ‘southern Big Five’ or Six.
Overall, however, it cannot be said that the QB2 fit better than the QB6 or QB5—it simply fit more evenly across contexts, applying in a more trouble–free manner in more places. As items for this measure were chosen only from QB6 items, this particular measure of the model started at a disadvantage—few of the core Big Two items identified in the last table in Saucier, Thalmayer et al. (2014) were available in the pool. Such core items would tend to be interstitial to Honesty, Agreeableness and Conscientiousness rather than representing one of these factors exclusively as in the QB6 item pool. The Big Two measure should thus especially be seen as in an early stage of development. Future cross–cultural surveys would ideally draw on a wider selection of items, hewing closer to the content in the adjectives identified in Saucier, Thalmayer, et al. (2014); we are not however advocating using actual adjectives as measures of the Big Two, since adjectives can be especially difficult to faithfully translate.
The QB6 is likewise still under development. Even the refined version presented here is not intended as a final, superior measure of the Big Five or Six but as an intermediate iteration based on a large, interesting pool of items (IPIP; Goldberg et al., 2006). The current study applies a cross–cultural generalisability criterion to a relatively early stage of inventory development, with an eye toward creating an inventory and a model that is more culturally decentred. The results are informative as to which items translate more readily and comparably, leading to more consistent intercepts and factor loadings. A limitation of the current study is the restriction of participation to college students. While this facilitated cross–cultural comparison by holding age, literacy and education–level relatively constant, it does limit our ability to generalise to the entire populations from which our samples were drawn.
A limitation specific to the Big Five and Big Two measures is that the QB6 items used were not chosen with the measurement of these models in mind. This was particularly problematic for the Big Two—the refined measures presented here are shorter and include fewer core–content items than would be ideal to cover the two broad dimensions. For the 25QB5, this limitation is specific to the Agreeableness domain, which here lacks some of the kindness and warmth content often emphasised in Big Five measures. It is our hope, however, that developing and validating Big Five and Big Two measures from this set of items will allow researchers, regardless of preferred model, to make use of the translations of the personality items used in the Survey of World Views. Translations of items on these inventories, now available in 31 languages, represent a significant cooperative effort on the part of translators, psychologists and linguists around the globe. We hope to facilitate cross–cultural research by making these items and scales freely available to other researchers. While the scientists developing models of personality have historically come from a restricted range of nations, there is increasing awareness that broadening our scope of interest can improve the replicability, generalisability and quality of our results. The measures presented here should ideally contribute to the long–term goal of understanding human personality in ways that transcend a single place and time.