
Abstract
Several personality models are known for being replicable across cultures, such as the Five–Factor Model (FFM) or Eysenck's Psychoticism–Extraversion–Neuroticism (PEN) model, and are for this reason considered universal. The aim of the current study was to evaluate the cross–cultural replicability of the recently revised Alternative FFM (AFFM). A total of 15 048 participants from 23 cultures completed the Zuckerman–Kuhlman–Aluja Personality Questionnaire (ZKA–PQ) aimed at assessing personality according to this revised AFFM. Internal consistencies, gender differences and correlations with age were similar across cultures for all five factors and facet scales. The AFFM structure was very similar across samples and can be considered as highly replicable with total congruence coefficients ranging from .94 to .99. Measurement invariance across cultures was assessed using multi–group confirmatory factor analyses, and each higher–order personality factor did reach configural and metric invariance. Scalar invariance was never reached, which implies that culture–specific norms should be considered. The underlying structure of the ZKA–PQ replicates well across cultures, suggesting that this questionnaire can be used in a large diversity of cultures and that the AFFM might be as universal as the FFM or the PEN model. This suggests that more research is needed to identify and define an integrative framework underlying these personality models. Copyright © 2016 European Association of Personality Psychology
Personality traits are conceived as being rather stable across the life span, having a major impact on people's behavioural expression across similar situations (e.g. Costa & McCrae, 1998; Tett & Guterman, 2000; Wille, De Fruyt, & Feys, 2013). Several models of personality traits are known for being replicable across cultures and are supposed to be universal such as Eysenck's Psychoticism–Extraversion–Neuroticism (PEN) personality model (Barrett, Petrides, Eysenck, & Eysenck, 1998), the Big Five (Hendriks et al., 2003) or Costa and McCrae's Five–Factor Model (FFM) (McCrae & Costa, 1997). The universality of these models provides important empirical support for the relevance of these hierarchical personality models and in particular for the FFM that is certainly the most widely recognized and frequently used model (Carlo, Knight, Roesch, Opal, & Davis, 2014). In the 1990s, Zuckerman, Kuhlman, and Camac (1988) claimed that the FFM did not emphasize the biological bases of personality enough and suggested taking into account only traits with an established biological–evolutionary basis, such as sensation seeking or impulsivity. They thus proposed a so–called Alternative FFM (AFFM). This AFFM includes some different higher–order factors, such as aggressiveness or sensation seeking, and in particular an activity factor instead of the openness to experience factor of the FFM that has no counterpart in the AFFM (Joireman & Kuhlman, 2004). This AFFM was recently revised mainly by identifying four facet scales for each factor (Aluja, Kuhlman, & Zuckerman, 2010). Considering the fact that the FFM and the revised AFFM differ slightly, with an activity factor instead of the openness to experience domain (Aluja, García, & García, 2002), and that we do not know if the revised AFFM replicates well across cultures, the aim of this study was to investigate this model in a large sample from five continents, with samples from a large variety of cultures.
To develop the AFFM, Zuckerman et al. (1988) studied the underlying structure of a selection of scales, known for having psychobiological correlates. They identified a replicable five–factor structure that constitutes this AFFM (Zuckerman, Kuhlman, Thornquist, & Kiers, 1991). Based on this model, they developed the Zuckerman–Kuhlman Personality Questionnaire (ZKPQ, Zuckerman, Kuhlman, Joireman, Teta, & Kraft, 1993) assessing impulsive sensation seeking, neuroticism–anxiety, aggression–hostility, activity and sociability. The absence of facets and ‘the limited sampling of item content within the five trait scales of the ZKPQ’ (Aluja et al., 2010, p. 417) did limit the usefulness of this instrument for applied or clinical purposes. For this reason, Aluja et al. (2010) developed a new instrument based on the ZKPQ including four facets per factor and using a four–category Likert–type response scale instead of the true–false format, the Zuckerman–Kuhlman–Aluja Personality Questionnaire (ZKA–PQ). This work led to the revised AFFM, which encompasses slightly different higher–order personality factors: aggressiveness (which refers to the tendency to feel anger and hostility towards others), activity (which refers to a need and energy for a variety of activities, impatience and restlessness), extraversion (which refers to positive emotions, sociability and a tendency to expose ourselves), neuroticism (which refers to negative emotions, dependence and low self–esteem) and sensation seeking (which refers to a need for new and exciting experiences and intolerance to boredom), each of which includes four facets (see Table 4 for the exact labels of the facets). The ZKPQ and the ZKA–PQ were used in a large number of studies, focusing in particular on the biological correlates of personality traits (e.g. Aluja, García, Blanch, De Lorenzo, & Fibla, 2009; Aluja et al., 2015; García, Aluja, Fibla, Cuevas, & García, 2010; Laplana, Royo, García, Aluja, Gomez–Skarmeta, & Fibla, 2014) or personality disorders (e.g. Aluja, Blanch, & Balada, 2013; Aluja, Blanch, García, García, & Escorial, 2012; Aluja, García, Cuevas, & García, 2007). Since its publication in 2010, this personality questionnaire has already been used in different studies, and the interest it has awakened has been increasing among personality psychology scholars in different regions of the world (e.g. Rossier, Zecca, Stauffer, Maggiori, & Dauwalder, 2012; Surányi, Hitchcock, Hittner, Vargha, & Urbán, 2013). This is why the evaluation of the generalizability across cultures of the revised AFFM and the cross–cultural validity of the ZKA–PQ is truly important.
The Five–Factor Theory (FFT, McCrae & Costa, 1999) as well as Zuckerman et al. (1988) claims that higher–order personality factors are dispositional traits that are biologically rooted. For this reason, they should allow one to describe individual differences in populations all over the world. However, these basic dispositions are not directly observable but are latent traits underlying our everyday behaviours. The expression of these latent personality dispositions is modulated by several regulation processes, such as emotional regulation processes for the expression of emotions in terms of affects or adaptive processes like career adaptability for work–related behaviours (Rossier, 2015a). These regulation processes are called characteristic adaptations within the FFT framework and include personal strivings and attributes along with habits and are influenced by dynamic processes (McCrae & Costa, 1999). In this setting, social and cultural contexts can moderate the expression of latent personality dispositions in terms of behaviours (McCrae, 2004), but people's actions can also have an impact on their culture (Breugelmans, 2011). The characteristic adaptations and the ability of this system to take into account influences from the environment to adjust the expression of personality are crucial in order to allow individuals to behave in an adapted way, accounting for the expectations of their social and cultural environments (Church, 2010). The existence of stable personality dispositions and regulation processes explains why personality has a consistent impact on behaviour expression, and the existence of regulation processes explains why the expression of these behaviours tend to adjust to contextual constraints and are thus influenced by the context. The impact of the context is mediated by these regulation processes (Rossier, 2015b). However, it is essential to note that social and cultural environments are not supposed to modify the structure of the underlying dispositional personality traits, but to have an impact on the expression of these traits.
The stability of personality traits‘ structure across cultures has been documented for several models. Lynn and Martin (1995) studied the factor structure of the revised Eysenck Personality Questionnaire across 37 nations and observed that the PEN model replicates well and might be universal. A couple of years later, McCrae (2002) observed the same for the Revised NEO Personality Inventory (NEO–PI–R, Costa & McCrae, 1992) and the FFM, analysing data from 36 cultures. We can notice that two factors of these two personality inventories are similar and that psychoticism could be partially considered as a combination of the FFM's three remaining factors. However, psychoticism may also have some specific variance, even if there is a relatively strong negative correlation between psychoticism and agreeableness and conscientiousness (Aluja et al., 2002). In a study including 50 cultures, McCrae, Terracciano, and 78 Members of the Personality Profiles of Cultures Project (2005a) concluded that observer–rating personality data also indicate that the FFM personality structure replicates well across cultures and might be considered as universal. However, some minor culture specificities can be observed for specific traits in specific regions. For example, in collectivistic cultures or African countries, the excitement–seeking facet was observed to have an important and consistent secondary loading on openness to experience rather than loading specifically on extraversion as in most occidental cultures (Konstabel, Realo, & Kallasmaa, 2002; Zecca et al., 2013). At the culture level, aggregate personality traits have been related to several cultural factors such as the gross national product, the geographic location and Hofstede's cultural dimensions (McCrae, Terracciano, & 79 Members of the Personality Profiles of Cultures Project, 2005b). Moreover, different studies have shown that geographically and historically similar cultures are associated with similar aggregated personality profiles (Allik & McCrae, 2004). Western cultures are usually more extraverted and open to experience than African and Asian cultures that are more agreeable and more conscientious. Furthermore, internal reliabilities of personality scales are usually lower in collectivistic cultures than in individualistic ones (Piedmont, Bain, McCrae, & Costa, 2002; Rossier, Rigozzi, & Personality Across Culture Research Group, 2008). One possible explanation of this phenomenon is that in ‘collectivistic cultures, behavior is determined more by social context than by traits’ (Rossier, Dahourou, & McCrae, 2005, p. 241). However, several methodologists have suggested that in order to compare scores across cultures, personality inventories should achieve metric and scalar equivalence (e.g. Van de Vijver & Leung, 2001). Metric equivalence implies that the metric (or factor loadings) of the scale is invariant across cultures, and scalar equivalence implies that the origin (or intercept) of the scale is similar across cultures.
Johnson, Spinath, Krueger, Angleitner, and Riemann (2008) studied the level of equivalence of the Multidimensional Personality Questionnaire in German and American samples using an item response theory approach. They observed that most of the mean personality level differences between the two countries could be attributed to differences in terms of item difficulties between language versions. Nye, Roberts, Saucier, and Zhou (2008) studied the measurement equivalence of the Big Five Mini–Markers in three large samples of university students from three countries on three different continents, the USA, Greece, and China, and observed that the Big Five Mini–Markers did reach structural, but not metric or scalar, equivalence. Church, Alvarez, Mai, French, Katigbak, and Ortiz (2011) studied the structural, metric and scalar invariance of the NEO–PI–R in three culturally different countries, the USA, Mexico, and the Philippines, using multi–group confirmatory factor analyses and three different language versions of the NEO–PI–R. They observed that a significant proportion of items and facets did not reach scalar invariance, even though structural and metric equivalences were usually reached. Recently, Zecca et al. (2013) studied, in a large French–speaking sample of nine French–speaking African countries and Switzerland, the level of equivalence of the NEO–PI–R and observed that the main scales of this instrument reached structural or configural as well as metric invariance but not scalar invariance. All these results indicate that some personality measurements, and in particular the NEO–PI–R, reach structural or configural invariance across cultures and in some cases even metric invariance. This suggests that comparing aggregate personality traits across cultures may be unreliable and that specific cultural and/or language norms should be used for personality inventories like the NEO–PI–R or the Revised Eysenck Personality Questionnaire.
After the development of the AFFM and of the ZKPQ (Zuckerman, 2002), this English instrument was translated into a large number of languages (French, German, Greek, Italian, Mandarin, Romanian, Serbo–Croatian, Spanish, Catalan, etc.) and used in a variety of cultural settings. The different language versions were all validated, indicating that the AFFM replicates quite well across cultures (e.g. Ostendorf & Angleitner, 1994; Wu, Wang, Du, Li, Jiang, & Wang, 2000; Zuckerman et al., 1993). Later on, a formal analysis of the cross–cultural generalizability of the AFFM was conducted (N > 9000, Rossier et al., 2007), which led to the conclusion that the AFFM structure replicates particularly well across cultures and that the ZKPQ can be used in a variety of cultures. The recently developed ZKA–PQ was originally created simultaneously in two languages, Spanish and English. The replicability across these two languages was taken into account in the development of the questionnaire itself. Since its publication, the ZKA–PQ has already been translated and validated in four additional languages, Catalan (Blanch, Aluja, & Gallart, 2013), French (Rossier, Hansenne, Baudin, & Morizot, 2012), German (Schmid, 2013) and Hungarian (Surányi & Aluja, 2014). These three successful validations indicate that the ZKA–PQ and the revised AFFM may be generalizable across a larger number of cultures.
In order to assess if the AFFM can be considered to be universal as the FFM, the aim of this research project was to assess the cross–cultural generalizability of the revised AFFM and the replicability of ZKA–PQ's factor structure. This is of importance considering that if several competing models of personality traits are universal, an integrative framework may be considered. It will also allow verifying if ZKA–PQ results across cultures may be compared. In order to achieve this aim, we first will study the cross–cultural stability of the correlation between factors and facets and two person–related variables, age and gender, taken as context variables (Van de Vijver & Leung, 1997). The replicability of the factor structure across cultures will then be assessed as well as the measurement equivalence, considering both the item level (taking parcels into account) and the facet level, in order to verify whether the differential item functioning, if any, cancels out at the facet level.
Method
Participants
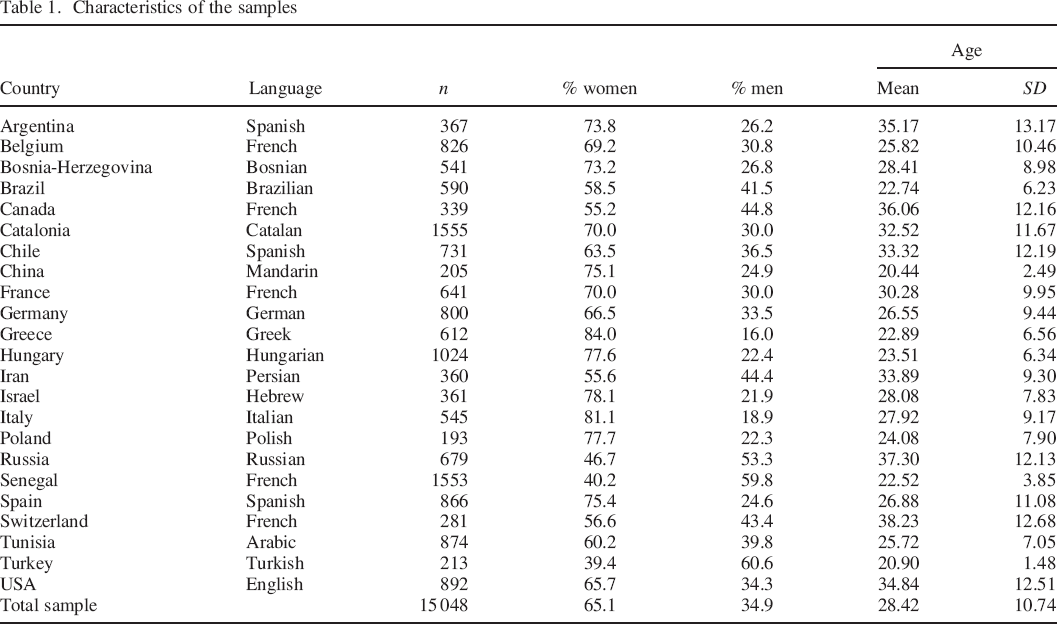
Overall, 15 048 participants (5257 men and 9791 women) took part in the study: 23 samples from 22 countries (Spain was represented by a Castilian—Spain in this study—and a Catalan sample) and speaking 17 different languages. The number of participants per sample ranged from 193 in Poland to 1555 in Catalonia. Proportions of men and women differed significantly across samples, but these differences remained globally negligible, χ2(22) = 1023.68, p < .001, η2 = .007. Most samples had a smaller proportion of men (ranging from 16.0% to 44.8%), but three countries (Russia, Senegal, and Turkey) had a slightly larger proportion of men. Gender distribution among samples with more women, χ2(19) = 350.33, p < .001, η2 = .003, or more men, χ2(2) = 8.81, p = .01, η2 < .001, was quite similar. Table 1 presents the proportion of men and women as well as the mean age for each sample. The average age was 29.58 (SD = 11.41) and 27.79 (SD = 10.30) for men and women, respectively. This mean age difference was significant but negligible, t(15 046) = 9.78, p < .001, d = 0.17. Age ranged from 18 to 84 years for men and from 18 to 80 years for women. Age differences across samples were large, F(22, 15 047) = 187.01, p < .001, η2 = .22. Nine samples (Argentina, Canada, Chile, France, Iran, Russia, the Catalan–speaking Spanish sample, Switzerland, and the USA) had quite a diverse sample in terms of age (Mage > 30.00, SD ≥ 9.30), and age differences among these nine samples were significant but small, F(8, 5844) = 24.85, p < .001, η2 = .03. Eleven countries (Belgium, Bosnia–Herzegovina, Brazil, Germany, Greece, Hungary, Israel, Italy, Poland, the Spanish–speaking Spaniards, and Tunisia) had a younger but diverse sample (22.70 < Mage < 30.00, SD > 6.00), and age differences among these 11 regions were significant but small, F(10, 7231) = 35.56, p < .001, η2 = .05. Finally, three countries (China, Senegal, and Turkey) had younger and more homogeneous samples in terms of age (Mage < 22.60, SD < 4.00), and age differences among these three countries were significant but small, F(2, 1970) = 45.72, p < .001, η2 = .04. Results concerning the Canadian and Swiss samples have already been published elsewhere (Rossier et al., 2012).
Characteristics of the samples
Measure
The Zuckerman–Kuhlman–Aluja Personality Questionnaire
The ZKA–PQ (Aluja et al., 2010) is a recently developed personality measurement comprising 200 items and 20 facets aiming at assessing the revised AFFM's five main factors: aggressiveness (AG), activity (AC), extraversion (EX), neuroticism (NE) and sensation seeking (SS). Each main factor comprises 40 items divided into four facets. AG includes physical aggression (AG1), verbal aggression (AG2), anger (AG3), and hostility (AG4). AC is divided into work compulsion (AC1), general activity (AC2), restlessness (AC3), and work energy (AC4). EX is divided into positive emotions (EX1), social warmth (EX2), exhibitionism (EX3), and sociability (EX4). NE is divided into anxiety (NE1), depression (NE2), dependence (NE3), and low self–esteem (NE4). Finally, SS is divided into thrill and adventure seeking (SS1), experience seeking (SS2), disinhibition (SS3), and boredom susceptibility/impulsivity (SS4). The response format is a 4–point Likert–type scale ranging from strongly disagree (1) to strongly agree (4). Approximately half of the items, two to eight items per facet scale, are negatively keyed (78/200). The psychometric properties of the ZKA–PQ, including structural, convergent and discriminant validity, were demonstrated in several studies (Aluja et al., 2012, 2013; García, Escorial, García, Blanch, & Aluja, 2012; Zuckerman & Aluja, 2015). In the original Spanish validation, the internal consistencies of the five factors ranged from .85 to .92 and of the facets from .65 to .90 (Aluja et al., 2010).
Seventeen different language versions of the ZKA–PQ were used for this study: Arabic, Bosnian, Brazilian, Catalan, English, French, German, Greek, Hebrew, Hungarian, Italian, Mandarin, Persian, Polish, Russian, Spanish, and Turkish. Six were validated language versions, Catalan (Blanch et al., 2013), Spanish and English (Aluja et al., 2010), French (Rossier et al., 2012), German (Schmid, 2013), and Hungarian (Surányi & Aluja, 2014), and the ZKA–PQ was translated into 11 additional languages. 1
Translations
When a language version did not exist for a specific country, the researcher of that country had to translate the ZKA–PQ into that language with the help of a local team of specialists in validation studies and linguists (the original version of the ZKA–PQ is in Spanish and English). A psychologist fluent in English, and who did not contribute to the translation, back–translated the translated version into English. This back–translation was then sent to this present study's third author. An analysis of the equivalence of the back–translated English version and the original English version was performed using the tm and stringer R packages, designed for text analyses and text mining (for a description of the method, see Blanch & Aluja, 2015). When non–equivalent items were identified, a professional translator compared the back–translated English version and the original English version. Based on these two analyses, researchers received suggestions regarding the revision of items seemingly not equivalent in the translated and original versions. This iterative process went on until the authors of the translated version and the Catalan team, who initiated the present research, reached an agreement.
Procedure
Researchers from a variety of countries and cultures were invited, by the second author, to translate the ZKA–PQ into their native languages and to gather if possible 500 participants, or at least 200, in order to conduct a cross–cultural study of the revised AFFM. The second author developed software for the online use of each language version of the ZKA–PQ. Researchers of each country or culture could then email invitations to students, academics and non–academics of their universities to participate in the study and answer the questionnaire on the Internet. In order to increase participants‘ motivation, they received a personalized feedback with their indicative personality profile (based on the original version's norms) and an interpretative report of their personality profile. Access to the online ZKA–PQ version was only possible with a password so that people who had not been invited could not participate. Data from Canada and Switzerland were collected using a paper–and–pencil version of the ZKA–PQ because of the administrative difficulties in sending emails to all members of the co–authors‘ respective universities (participants from all other samples completed the online version of the questionnaire). The American sample was obtained by means of Amazon Mechanical Turk (www.mturk.com). The American participants were the only ones who received a small financial compensation for completing the questionnaire (between $0.60 and $1.00). A small proportion of the German sample received course credit. The data were collected in 2012 and 2013, except for the Swiss and Canadian data that were collected in 2010.
The software recorded raw scores for all scales with the answers to all the questions into a database for later analysis. Additionally, the country, gender and total response time were recorded. Participants who responded in less than 15 minutes to the 200 questions were excluded from the analysis (in order to remove all people who responded randomly). Moreover, in order to identify and remove inconsistent subjects, Aluja, Blanch, Martí–Guiu, and Blanco (2015) developed an inconsistency index (INC) for the ZKA–PQ by using 10 pairs of highly correlated items in a wide sample of voluntary and anonymous subjects of both sexes. They compared their data with randomly generated data and observed that in their real data a score higher than 10 discriminated 3.7% of subjects who responded inconsistently. For this reason, participants with an INC higher than 10 were excluded in the present study, which represented between 2.8% and 4.9% of the participants depending on the sample or country.
Statistical analyses
Internal consistencies were assessed using Cronbach's alpha. The relationship between the overall internal reliabilities for each country, the inconsistency index and the proportion of women and men was assessed by computing Spearman's rho. The impact of age was assessed after excluding three countries (China, Senegal, and Turkey) that had very young and homogeneous samples in terms of age (Mage < 22.60, SD < 4.00). A series of hierarchical linear modelling was computed for each domain to assess if correlation was significantly different across cultures. To assess this impact on each factor and each facet, partial correlations were computed controlling for gender. To assess gender differences, analyses of covariance were computed to control for age differences. To compare the facet–level factor structure for the entire sample, we conducted a principal axis factor analysis with varimax rotation on the 20 facet scales. The loading matrix was then subjected to an orthogonal Procrustes rotation (Schönemann, 1966) using the normative Spanish structure as the target (calibration sample of the validation study). It is important to note that the Catalan and Spanish samples of this study differ from the normative Spanish sample of the study by Aluja et al. (2010). Convergence after rotation was determined by computing congruence coefficients (CCs; Haven & ten Berge, 1977). CCs higher than .90 indicated a high structural equivalence, CCs ranging from .81 to .90 a borderline structural equivalence and CCs equal to or below .80 a poor structural equivalence (McCrae, Zonderman, Costa, Bond & Paunonen, 1996). The same was repeated for each sample or country.
To analyse the level of invariance across cultures, we used multi–group structural equation modelling for each factor successively, applying the method used by Zecca et al. (2013). First, we verified the adequacy of each factor's structure including four facets. Each facet was defined as a latent variable of three parcels using a systematic algorithm (Coffman & MacCallum, 2005; Little, Cunningham, Shahar, & Widaman, 2002). The first parcel resulted from the mean of the first, fourth, seventh, and tenth items; the second parcel resulted from the mean of the second, fifth, and eighth items; and the last parcel resulted from the mean of the third, sixth, and ninth items. Thus, we tested a higher–order model for each main personality dimension considering three parcels per facet as the observed variable, the four facets as the first–order latent variables and the main personality dimension as the second–order latent variable. For each facet, the initial loading for one of the three parcels was set to 1, and for the main personality dimension, the initial loading for one of four facets was set to 1. An additional model considering all five factors in a single model and the facet scales as the observed variables was subsequently computed in order to verify whether the item–level—or in our case parcel–level—differential item functioning possibly cancelled out at the facet level. In this case, the initial loading for one of the facets was set to 1 for each mean personality dimension. The model also included covariance between the five main personality dimensions and took into account the secondary loading of positive emotions on neuroticism (Table 5). In order to assess model fit, various goodness–of–fit indices were considered: χ2 per degree of freedom (χ2/df), the comparative fit index (CFI), the Tucker–Lewis index (TLI) and the root mean square error of approximation (RMSEA). A χ2/df below 5 reflects an acceptable model fit (Bollen, 1989). An RMSEA equal to or lower than 0.05 reflects good fit, and values between 0.05 and 0.08 indicate an acceptable fit (Browne & Cudeck, 1992). CFI and TLI values above 0.95 indicate a good fit, while values ranging from 0.90 to 0.95 are considered acceptable (Byrne, 2010). Along with the overall fit of each model, changes in model fit statistics were also inspected, in order to analyse configural, metric and scalar invariance (Duarte & Rossier, 2008). Change in the CFI should be less than 0.01 (Byrne & Van de Vijver, 2010; Cheung & Rensvold, 2002), and some authors have used ΔRMSEA < 0.05, although no cut–off was provided (e.g. Savickas & Porfeli, 2012).
Results
Internal consistency and influence of age and gender
Factor internal consistencies are presented in Table 2. They ranged from .78 to .96, Mdn = .91. As observed in other studies with African samples (Zecca et al., 2013), internal consistencies were slightly lower for factors in Senegal, ranging from .78 to .89, Mdn = .84. However, they can still be considered as good (Kline, 2000). Globally internal consistencies of facet scales ranged from .40 to .94, Mdn = .80. The median internal consistency of all facet scales, except two, was above the .70 threshold. The internal consistencies of the restlessness (AC3) and boredom susceptibility/impulsivity (SS4) facets were slightly lower (respectively ranging from .54 to .73, Mdn = .67, and .40 to .71, Mdn = .63). Facet scale internal reliabilities were also slightly lower in China (ranging from .51 to .87, Mdn = .69) and Senegal (ranging from .40 to .84, Mdn = .64). Considering internal consistencies of all other facet scales (18) in all other 21 samples, only 17 internal consistencies out of 378 (4.49%) were below .70 and two below .60 (0.53%). The median internal consistencies of the factors and of the facets were not related to the mean age and mean inconsistency index per country (rho ≤ |.37|, p > .05). Only the percentage of men and women per country was associated with facet median internal consistencies (rho = −.53, p = .009). Samples including a higher proportion of men had slightly lower overall internal consistencies at the facet level. This remained true even after removing Senegal and China, associated with lower internal consistencies (rho = −.57, p = .007). Finally, the correlation between the median internal consistency and Hofstede's (2001) individualism cultural dimension, considering the value of Ghana for Senegal and of Libya for Tunisia as proxies (no values were found for Bosnia and Russia that were excluded), was positive and significant for factors (n = 21, rho = .54, p = .01) and facets (n = 21, rho = .62, p = .003). These correlations remained similar and significant even after controlling for the gross domestic product per capita (World Bank values of 2013).
Means, standard deviations and internal reliabilities for women and men for each culture and for each factor
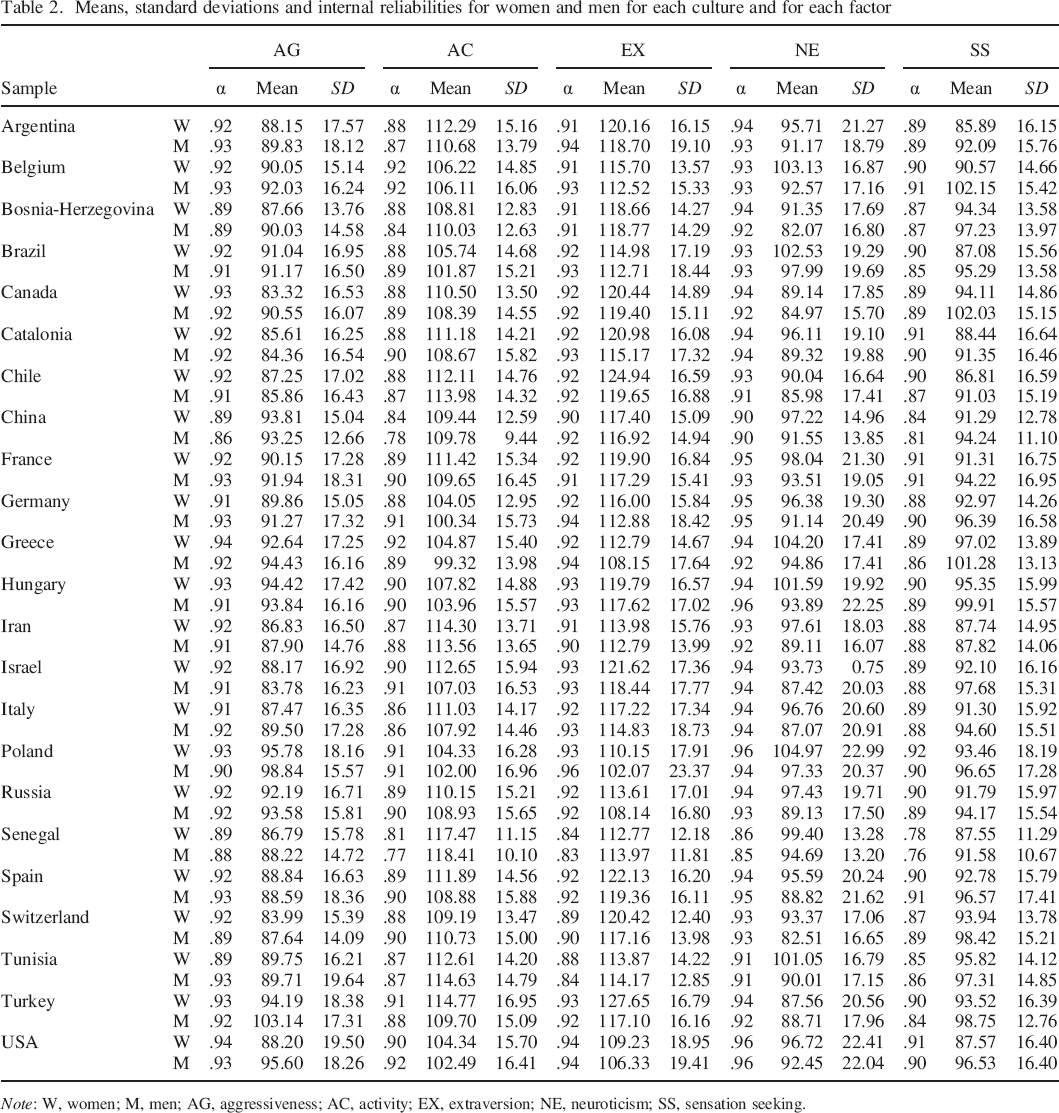
Note: W, women; M, men; AG, aggressiveness; AC, activity; EX, extraversion; NE, neuroticism; SS, sensation seeking.
After controlling for gender and excluding the countries with young and homogeneous samples in terms of age (China, Senegal, and Turkey), correlations between personality factors and age were computed (Table 3). Globally, a small negative correlation with aggressiveness and neuroticism, a small positive correlation with activity and an almost medium negative correlation with sensation seeking were observed. The correlation with aggressiveness was mainly due to correlations with the verbal aggression and hostility facets. The correlation with activity was due to a correlation with the hostility facet. Age correlated with all four neuroticism facet scales (r ≤ −.15), and the correlation with sensation seeking was mainly due to correlations with the thrill and adventure seeking, experience–seeking, and disinhibition facets. Hierarchical linear modelling analyses were then computed to examine whether the relations between age and ZKA–PQ factors varied across cultures. For each factor, we tested the existence of substantial age factor slope variance on the basis of the χ2 value obtained from the difference between the log–likelihoods of a model with random slopes and one with random intercepts only. Across countries, there was no difference in the relation between age and neuroticism, χ2(1) < 0.01, p = 1.00. The variance of the age–neuroticism slopes was 0.00. Some differences were still observed in the relation between age and other personality factors, all χ2(1) ≥ 6.68, p < .01, with small slope variance ranging from 0.002 for aggressiveness to 0.007 for activity. If we consider only the nine cultures (Argentina, Canada, Chile, France, Iran, Russia, the Catalan–speaking Spanish sample, Switzerland, and the USA) that had quite a diverse sample in terms of age (n = 5,842, Mage > 30.00, SD ≥ 9.20), the pattern of correlations between age and the ZKA–PQ factors was very similar (aggressiveness, r = −.17; activity, r = .09; extraversion, r = −.01; neuroticism, r = −.19; sensation seeking, r = −.30).
Correlations with age and gender differences for each personality dimension and each sample
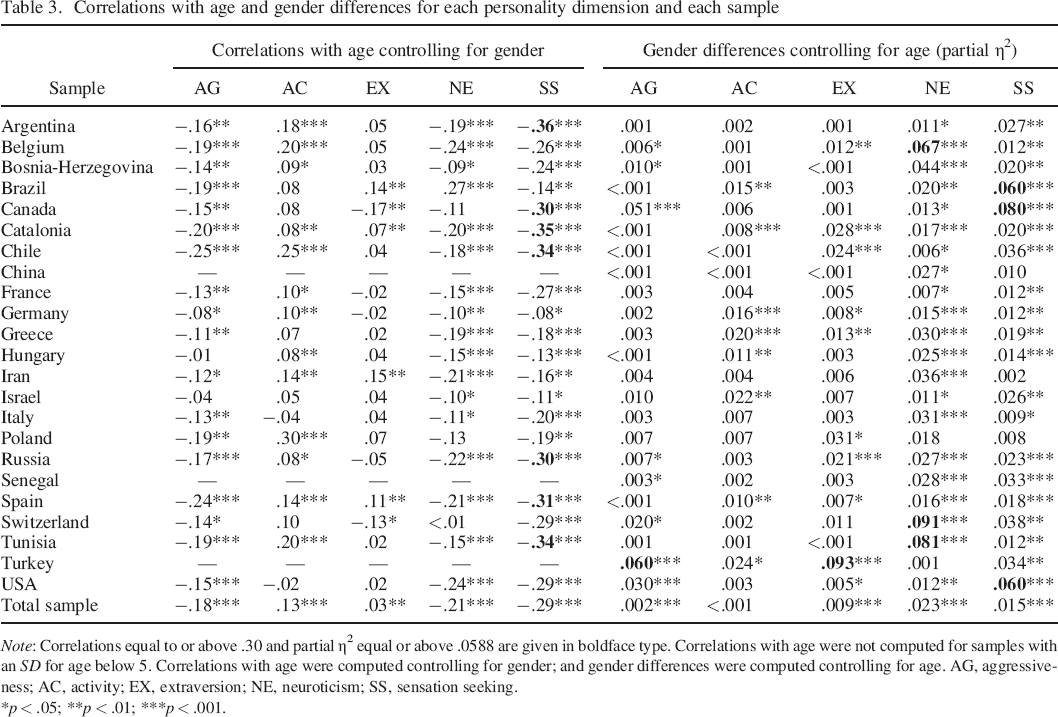
Note: Correlations equal to or above .30 and partial η2 equal or above .0588 are given in boldface type. Correlations with age were not computed for samples with an SD for age below 5. Correlations with age were computed controlling for gender; and gender differences were computed controlling for age. AG, aggressiveness; AC, activity; EX, extraversion; NE, neuroticism; SS, sensation seeking.
p < .05;
p < .01;
p < .001.
After controlling for age, gender had a non–significant negligible impact on aggressiveness, activity and extraversion, but a significant and small impact on neuroticism and sensation seeking, with women scoring significantly higher on neuroticism and lower on sensation seeking. Concerning facet scales, a gender difference associated with a medium effect size (η2 ≥ .058) was observed for work compulsion (η2 = .066) and thrill and adventure seeking (η2 = .081), with women scoring lower on both facet scales. A gender difference associated with a small effect size (η2 ≥ .0099) was observed for anger (η2 = .014), restlessness (η2 = .011), positive emotions (η2 = .016), social warmth (η2 = .031), anxiety (η2 = .021), depression (η2 = .013), dependence (η2 = .022) and low self–esteem (η2 = .013), with women scoring higher on these facet scales. Across cultures, a significant and non–negligible gender difference on aggressiveness was observed for Bosnia–Herzegovina, Canada, Israel, Switzerland, Turkey, and the USA. For activity, a non–negligible gender difference was observed for Brazil, Germany, Greece, Hungary, Israel, the Spanish–speaking Spanish sample, and Turkey. For extraversion, a non–negligible gender difference was observed for Belgium, Chile, Greece, Poland, Russia, the Catalan–speaking Spanish sample, Switzerland, and Turkey. For neuroticism, gender differences were always associated with a small or medium effect size, except in Chile, France, and Turkey, where the difference was negligible. For sensation seeking, gender differences were always associated with small to medium effect sizes, except for Iran, Italy, and Poland (Table 3). Globally, gender differences were similar across samples with some specific patterns of differences, as for example in Turkey.
Replicability of the factor structure across samples and cultures
In order to compare the facet–level factor structure for the entire sample (N = 15 048), we conducted a principal axis factor analysis with varimax rotation on the 20 facet scales. Using Cattell and Kaiser's criteria, a five–factor solution explaining 57.71% of the variance was extracted. The first six eigenvalues were 5.00, 3.48, 2.04, 1.57, 1.51, and 0.89. The Kaiser–Meyer–Olkin (Kaiser, 1970) measure of sample adequacy was above .80. Each facet loaded on the expected factor (λ > .50), except restlessness, which only moderately loaded on the activity factor (λ = .34). Moreover, hostility and positive emotions showed a secondary loading on the neuroticism factor (respectively λ = .41 and λ = −.44). Each factor was associated with one single higher–order dimension of the ZKA–PQ. Factor 1 correlated with neuroticism (r = .98), factor 2 with aggressiveness (r = .93), factor 3 with extraversion (r = .94), factor 4 with sensation seeking (r = .97), and factor 5 with activity (r = .97). Correlations between the main personality dimensions were all below .30, except between aggressiveness and neuroticism (r = .33) and between extraversion and neuroticism (r = −.45). After an orthogonal Procrustes rotation using the normative Spanish structure as the target, the total CC was .98, the CCs for the factors ranged from .97 to .99 (Mdn = .99) and the CCs for the facets ranged from .96 to 1.00 (Mdn = .99) (Table 4). All CCs were clearly above .90, which indicates that the structure observed for the entire sample was very close to the normative structure of Aluja et al.'s (2010) study.
Factor loadings and congruence coefficients after Procrustes rotation for the total sample
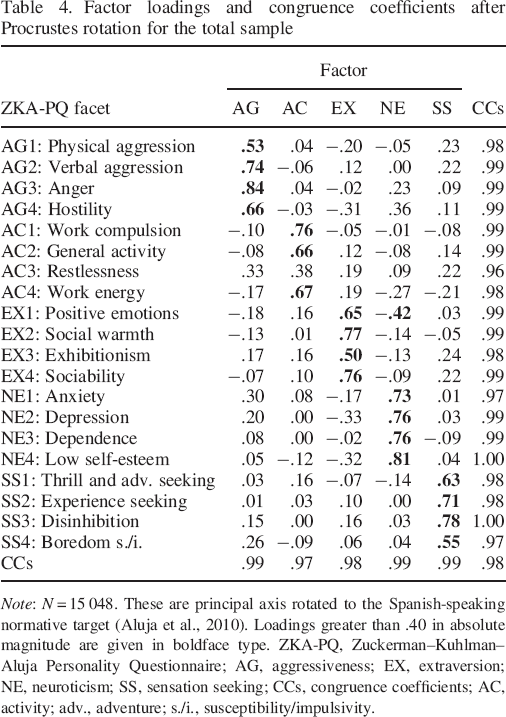
Note: N = 15 048. These are principal axis rotated to the Spanish–speaking normative target (Aluja et al., 2010). Loadings greater than .40 in absolute magnitude are given in boldface type. ZKA–PQ, Zuckerman–Kuhlman–Aluja Personality Questionnaire; AG, aggressiveness; EX, extraversion; NE, neuroticism; SS, sensation seeking; CCs, congruence coefficients; AC, activity; adv., adventure; s./i., susceptibility/impulsivity.
In order to assess structural replicability across the 23 samples, a principal axis factor analysis with orthogonal rotation on the 20 facet scales considering five factors was conducted for each sample. Each loading matrix was then subjected to an orthogonal Procrustes rotation using the normative Spanish structure as the target. As indicated in Table 5, the total CCs across samples ranged from .94 to .99 (Mdn = .98). For factors, CCs ranged from .89 to .99 (Mdn = .98). In fact, only the CC of activity was slightly lower than .90 in Senegal. All other CCs were equal to or above .92. CCs for facets ranged from .71 to 1.00 with a .98 median. For countries, median CCs for facets were equal to or above .97. In fact, some coefficients were lower only for restlessness and boredom and/or for China and Senegal. Regarding the total of the 460 facet CCs, only 15 were equal to or below .90 (3.26%), and five were equal to or below .80 (1.08%). Excluding these two facets and two countries, CCs for facets ranged from .88 to 1.00 with a .98 median (only two facet CCs were slightly below .90, 0.01% of the total number of CCs). These results indicate that the structure of the revised AFFM replicates very well across all cultures and samples.
Congruence coefficients for each country or sample and each personality dimension
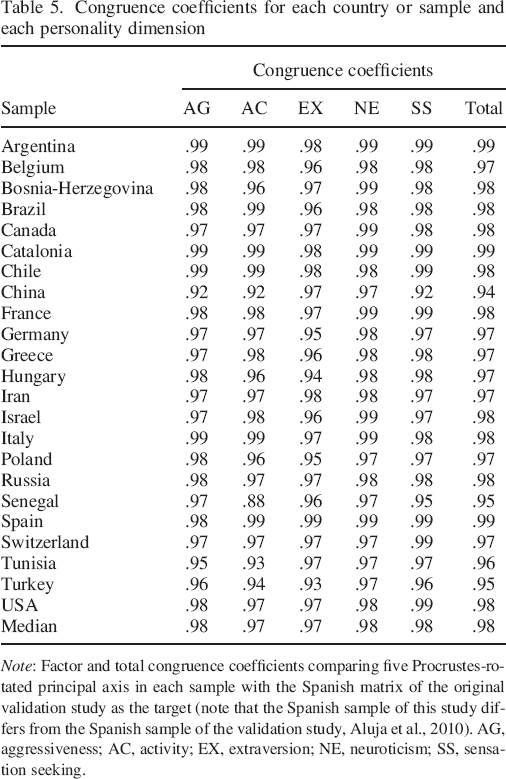
Note: Factor and total congruence coefficients comparing five Procrustes–rotated principal axis in each sample with the Spanish matrix of the original validation study as the target (note that the Spanish sample of this study differs from the Spanish sample of the validation study, Aluja et al., 2010). AG, aggressiveness; AC, activity; EX, extraversion; NE, neuroticism; SS, sensation seeking.
Measurement invariance across cultures
The structure for each factor in the overall sample was assessed by computing a confirmatory factor analysis and was associated with adequate fit indices, except the χ2/df that was too high, which may be due to the very large total sample size (N = 15 048). The overall structure of each factor was supported by the following fit indices: aggressiveness, χ2/df = 108.95, CFI = .935, TLI = .915, RMSEA = .085; activity, χ2/df = 84.01, CFI = .942, TLI = .923, RMSEA = .076; extraversion, χ2/df = 89.40, CFI = .953, TLI = .938, RMSEA = .077; neuroticism, χ2/df = 90.04, CFI = .953, TLI = .938, RMSEA = .081; sensation seeking, χ2/df = 77.15, CFI = .941, TLI = .922, RMSEA = .071. The level of invariance was assessed using multi–group confirmatory factor analyses. As indicated in Table 6, all CFIs and TLIs for configural and metric invariance indicate an adequate fit (≥0.908). Values are below the threshold for scalar invariance for each domain (CFI < .845 and TLI < .852). In all cases, the RMSEA was very low (≤.030). Concerning the χ2/df, it was below 5 for the configural and metric invariance of the sensation–seeking dimension and slightly higher than 5 (χ2/df ≤ 6.28) for the configural and metric invariance of the other four dimensions. Change in the CFI between configural and metric invariance was below .01 for activity and neuroticism and very close to this value for the other three dimensions (≤.014). Changes in the TLI and RMSEA between configural and metric invariance were always far below .01 and .05, respectively. Scalar invariance was associated with inadequate fit values (χ2/df ≥ 10.34, CFI ≤ .845, TLI ≤ .852), only RMSEA values were adequate. Changes in CFI and TLI values between metric and scalar invariance were all very high (≥.076). Changes in χ2 were also all very high (≥9242.54) and very significant. Only ΔRMSEA between metric and scalar invariance remained below the threshold. Mean age and age distribution were quite different from one sample to the other. Finally, controlling for age did not affect measurement invariance results. The different factors of the revised AFFM seemed to reach configural and metric invariance, but not scalar invariance.
Level of invariance across the 23 samples for each personality dimension
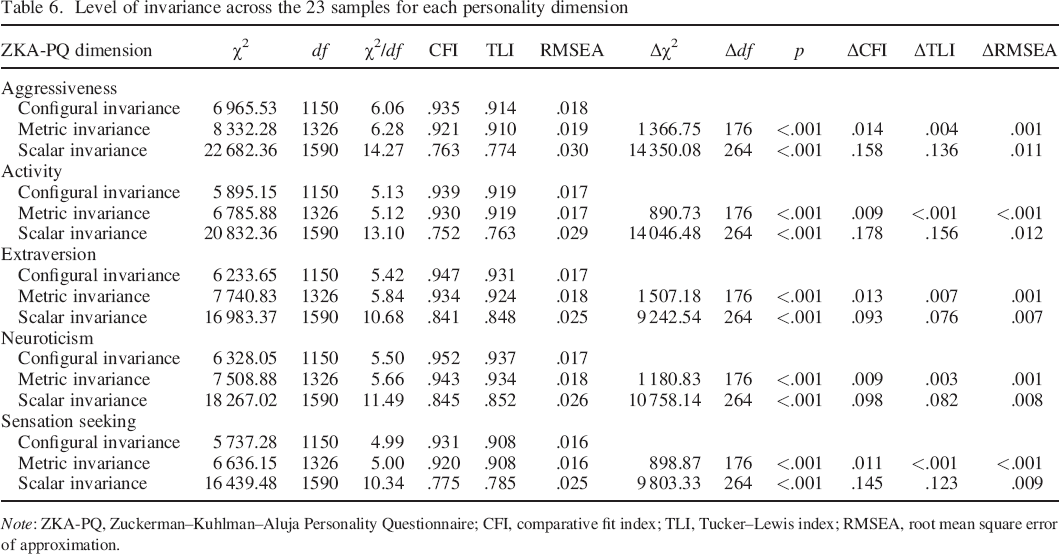
Note: ZKA–PQ, Zuckerman–Kuhlman–Aluja Personality Questionnaire; CFI, comparative fit index; TLI, Tucker–Lewis index; RMSEA, root mean square error of approximation.
The fact that the five main dimensions do not reach scalar invariance seems to suggest that items do function slightly differently from one culture to the other. However, bias at the item level could cancel out at the facet level (e.g. an acquiescence bias can cancel out if a scale includes positively and negatively keyed items). For this reason, we also assessed the measurement invariance across cultures of all dimensions at once considering facets as the observed variables. Configural, χ2/df = 11.06, CFI = .755, TLI = .707, RMSEA = .026; metric, χ2/df = 10.53, CFI = .745, TLI = .722, RMSEA = .025; and scalar, χ2/df = 14.08, CFI = .612, TLI = .619, RMSEA = .030, invariance were all three associated with relatively poor fit indices except the RMSEAs, but these indices were similar to that observed in the validation study by Aluja et al. (2010). More interesting is the fact that the changes in the CFIs, TLIs and RMSEAs were all small between configural and metric invariance (ΔCFI and ΔTLI ≤ .01 and ΔRMSEA = .001) but much larger between metric and scalar invariance (ΔCFI and ΔTLI > .01), suggesting again that the scales of the ZKA–PQ do not reach scalar invariance and that the possible differential item functioning does not cancel out at the facet level.
Discussion
The aim of this study was to assess the replicability of the revised AFFM and of the ZKA–PQ. The current data indicate that internal consistencies and the relationship with demographic variables, used as person–related context variables (Van de Vijver, & Leung, 1997), were quite similar across cultures even if the mean age of the samples was quite different from one country to the other. The overall revised alternative five–factor structure did replicate very well across cultures with a median total CC of .98, when comparing each country or sample's loading matrix with the normative Spanish loading matrix of the study by Aluja et al. (2010). The lowest total CC was observed for China and was .94, which is still very high according to the rules of thumb (Haven & ten Berge, 1977; McCrae et al., 1996). A series of multi–group confirmatory factor analyses confirmed that each of the five factors reached configural and metric equivalence, suggesting that each factor and its facets assessed the same construct across cultures. However, these factors and facets do not seem to reach scalar equivalence, and the differential item functioning does not appear to cancel out at the facet level. This result is in line with four recent studies on the measurement invariance of personality questionnaires across cultures (Church et al., 2011; Johnson et al., 2008; Nye et al., 2008; Zecca et al., 2013) that suggested that mean scores may not be compared across cultures and that culture–specific norms should be considered. When culture–specific norms are available, the ZKA–PQ is certainly a useful tool for research and practice (mean scores and standard deviations for women and men for each sample are available in Table 2 for each main personality dimension and in Appendix 1 for each facet scale).
The replicability of the factorial structure and scale internal consistencies were slightly lower for some African and Asian countries as already observed in other studies (McCrae et al., 2005a; Zecca et al., 2013). In this study, a factor CC equal to or below .90 was only observed for the activity dimension in Senegal, and a facet CC equal to or below .80 was only observed for restlessness in China, Senegal and Turkey and for boredom in China and Senegal. Regarding internal consistencies, the only countries with more than two facets with internal consistencies lower than .60 were China and Senegal. Notably, these two facets were already associated with lower internal consistencies in the original validation study (Aluja et al., 2010). This difference observed for certain African and Asian countries may not be attributed to some translation bias considering that the version used in Senegal was the previously validated French version (Rossier et al., 2012). Zecca et al. (2013) suggested that the lower internal consistencies observed in certain African countries may be due to the fact that French is usually not the studied population's first spoken language. Moreover, the French spoken in Africa may present some minor differences with the French spoken in Europe and Canada. However, in China, people answered a questionnaire in their first language, and the French version seems to have similar psychometric properties in quite different countries such as Belgium and Canada (Rossier et al., 2012). Considering the positive correlations between the median internal consistencies and Hofstede's (2001) individualism cultural dimension, the explanation suggested by Piedmont et al. (2002) that internal consistencies tend to be lower in collectivistic than individualistic cultures thus seems the most plausible, considering that both the Chinese and Senegalese cultures can be considered as collectivistic.
This study shows that the revised AFFM replicates well across cultures just as Eysenck's PEN model (Barrett et al., 1998) or the FFM (McCrae et al., 2005a). The FFM and Eysenck's PEN model share two dimensions (neuroticism and extraversion), and ‘agreeableness (and to a lesser extent conscientiousness) are primaries which form part of psychoticism’ (Eysenck, 1992, p. 668). The overlap between these two personality models is thus quite high. The FFM and the AFFM have four dimensions in common, and only the openness to experience dimension of the FFM differs from the activity dimension of the AFFM. It is interesting to observe that the different aforementioned personality models replicate well across cultures, suggesting that all three could be universal. This can only be true if these models can be integrated into a larger framework that has yet to be defined. This could, however, also be due to the fact that the structure may result from the item selection. In this case, all carefully developed and properly translated personality inventories should replicate well across cultures. If that is so, the universality of personality models can simply not be tested by studying the cross–cultural replicability of the factorial structure of well–designed personality measurements. However, it is useful to note that some personality models do not seem to replicate well across cultures, such as Cattell's 16 personality factor model (Aluja, Rossier, García & Verardi, 2005; Rossier, 2005). If we consider that a larger framework may explain the replicability of the PEN model, the FFM, and the AFFM, a six–factor model could be considered. A hierarchical three–layer structure could also be envisaged with a large number of traits, five to six main personality dimensions and two or three higher–order personality dimensions.
After a review of the lexical studies of personality structures, Ashton and Lee (2001) claimed that lexical studies suggest considering six dimensions. They were later able to confirm this six–factor structure by conducting a lexical study simultaneously in seven languages (Ashton et al., 2004). These six factors are known as the HEXACO model (Ashton & Lee, 2007). In future studies, it would be interesting to compare several personality measurements, developed in different parts of the world, like the Chinese personality assessment inventory (Cheung, Leung, Fan, Song, Zhang, & Zhang, 1996), the NEO–PI–R, the HEXACO personality questionnaire, the South African Personality Inventory (Hill et al., 2013) and the ZKA–PQ in a sample of representative cultures from all five continents (North and South America, Europe, Africa, Asia, and Australia). This type of study could analyse the commonalities and differences between these models, analyse the culturally replicable or specific personality traits and determine if the HEXACO personality traits cover these culturally replicable traits. Such a study could also investigate if culture–level personality profiles are consistent across instruments by using a unique and large sample from different cultures. If these profiles are consistent, it would be very interesting to study if their relationships with other economical, geographical and cultural dimensions are meaningful. Another option would be to replicate the study by Ashton et al. (2004) and conduct a lexical study in a set of representative countries or languages or even to combine both emic (or culture–specific) and etic (or universal) approaches in a large set of cultures (Valchev, Nel, Van de Vijver, Meiring, de Bruin & Rothmann, 2012). All these studies could contribute to specify the aforementioned hierarchical three–layer personality structure. The first level could include DeYoung's (2006) stability and plasticity dimensions, which are similar to Digman's (1997) α and β metatraits, but could also include the three factors identified by de Raad et al. (2010): Extraversion, agreeableness, and conscientiousness. The second layer could be a combination of the FFM and the AFFM and corresponds to a structure that would be similar to the HEXACO model. The third layer would include a relatively large number of facets. Metatraits would be more stable across cultures than dimensions of the second layer, which would be more stable than the facet scales. More culture specificities should be observed in the lower layers. To study this structure, a first step might simply be to compare the HEXACO personality model, the FFM and the AFFM across a sample of cultures.
Analyses of the measurement invariance show that the revised AFFM reaches overall configural and metric invariance but not scalar invariance. This means that facet scales assess the same conceptual dimensions across languages and cultures using a similar metric but that the scales‘ origin varies across languages and cultures. For this reason, mean scores of facet scales and of higher–order dimensions across cultures, nations, languages or samples may not be compared, and language—and even in some case culture–specific norms—should be considered (Duarte & Rossier, 2008). Moreover, we can also mention that the aggregate mean personality profile observed in the present study seemed to be quite different from the profiles observed by Allik and McCrae (2004) using the FFM framework. For example, we did not observe that Western cultures scored higher on extraversion. In our study, the highest scores were observed in Turkey (M = 122.38) and Chile (M = 122.30) and the lowest in Poland (M = 106.11) and the USA (M = 107.78). This suggests that to analyse aggregate mean personality profiles across cultures, a very large set of cultures should be considered simultaneously, and not only 23, and that the results could be quite different according to the personality measurement used, suggesting that the scales of two different personality inventories are too different to capture the very small differences between the aggregate mean personality profiles across cultures (Schmitt et al., 2007). Concerning the measurement invariance issue, it has to be noted that Meade, Johnson, and Braddy (2008) recently suggested using an alternative cut–off value of .002 instead of .01 to assess CFI changes. Using this stricter cut–off value, the instrument would only reach configural invariance. It is interesting to note that Rossier et al. (2012) validated the French version of the ZKA–PQ in a French–speaking population from four different countries, Canada, Belgium, France and Switzerland, and observed that the ZKA–PQ reached measurement invariance across these four countries using a unique language version. The four samples of this study were very similar, for example, in terms of age. The results of the present study suggest that measurement invariance is more difficult to reach with different language forms, cultures separated by large cultural distance, and dissimilar samples in terms of age distribution for instance. The translation process might for example induce small variations in terms of item difficulty. It would also be important to further investigate under which conditions cross–cultural comparisons are possible in order to allow more subtle comparisons of person–environment interactions. Indeed, most studies about measurement invariance of personality inventories found that they did not reach full invariance, in particular when mean differences across samples were large. Moreover, personality traits are inferred from peoples‘ description of their own usual behaviours, and the relationship between people's personality disposition and behaviours is not direct. Indeed, as suggested by the five–factor theory (McCrae & Costa, 1999) or by Rossier (2015b), the expression of personality traits is regulated by so–called characteristic adaptations (within the five–factor theory frame) or by regulation processes according to Rossier (2015b), regulating this expression and allowing taking into account requirements and expectations of social and cultural contexts. Thus, the environment might have an impact on the expression of personality traits, allowing it to act as a moderator of the relationship between dispositions and behaviours.
Although the sample size of this study and the number of cultures involved is large, the fact that samples are quite different in terms of mean age should be considered as a weakness. Indeed, 20 samples were quite diverse in terms of age with 9 slightly older and 11 slightly younger samples. Three samples included a large number of college or university student–age participants. Age was of course controlled whenever possible, but these differences might have induced some bias. One option would have been to include only university students in each country, with a problem of poor generalizability of the results obtained. The best option would have been to have a representative sample from each country. This ideal option would have been very expensive and probably not even feasible in certain countries without an up–to–date population register and was thus not a possibility for this study. For this reason, we tried to have a convenience sample, as diverse as possible for each country. The translation process also led to some language form specificities, pertaining in particular to the keying of some items. Therefore, certain forms are not totally equivalent. Despite these weaknesses, the present study clearly shows that the revised AFFM replicates well across cultures and samples and can be used in a diversity of cultures. Moreover, this study also demonstrates that ZKA–PQ's 17 different language forms are valid translations, most particularly the 11 new translations. The ZKA–PQ including five factors and 20 facets is thus certainly a useful tool for researchers and practitioners from a variety of cultures.
To conclude, this study showed that the internal consistencies are adequate for almost all scales in each country, even if consistencies were globally lower in collectivistic countries. The correlation between the revised AFFM factors and facets and two person–related context variables was stable across cultures. Interestingly, the effect sizes associated with gender differences were globally lower compared with those associated with age differences. The overall factorial structure replicated well across cultures with total CCs all equal to or above .94. An evaluation of the level of invariance for each factor across samples confirmed the configural invariance of these dimensions but also suggested that these dimensions reached metric equivalence but not scalar invariance. These results showed that the AFFM replicates well across cultures and might be considered as universal and that the ZKA–PQ is a valid instrument that can be used in a variety of cultural settings, although country–specific or language–specific norms have to be considered. We have now in our field different personality models that seem to be universal. These models can be a chance to analyse phenomena using different perspectives or an opportunity to identify an integrative framework.
Footnotes
Notes
Acknowledgements
This research was supported by the Spanish Ministry of Science and Innovation (grant no. PSI2008–00924/PSIC). This research was performed within the framework of DURSI Consolidated Group 2009 SGR 809. Jérôme Rossier's collaboration was partially made within the framework of the National Competence Center in Research LIVES financed by the Swiss National Science Foundation. Anton Aluja and Angel Blanch, second and third authors, designed the study, developed the software to collect the data online and contributed to the statistical analysis. Jérôme Rossier, first author, contributed to the data analysis and wrote the manuscript with the help of the second and third authors. Anton Aluja coordinated the study. All co–authors collaborated in the ZKA–PQ translation, adaption and diffusion of the different language versions to various countries. All authors contributed and approved the final manuscript.