
Abstract
The present study examined altruistic behaviour using broad personality traits (the Big Five) and the narrow personality trait of cultural adjustment (multicultural personality) while controlling for social justice attitudes and other demographic variables. Using an analogue version of a modified dictator game, 153 participants were required to divide a variable amount of money between themselves and a hypothetical recipient who was treated unfairly in a prior dictator game (based on results from a separate sample). We varied the race (Black and White) and gender (male and female) of the fictional recipient to present the individual as either advantaged or disadvantaged in society. Participants were randomly assigned to one of three conditions with the recipient presented as (i) a White man, (ii) a White woman, or (iii) a Black man. A separate sample of 71 participants rated recipients as treated unfairly and as representing a marginalized group. Results showed that subscales of the Multicultural Personality Inventory predicted giving behaviour above and beyond the variance accounted for by broad personality traits and attitudes towards social justice. The discussion focuses on implications for research in social justice based on cultural adaptation and personality. Copyright © 2016 European Association of Personality Psychology
In–group bias, the process whereby members of a society confer advantage to those individuals considered to be a part of their group (Ben–Ner, McCall, Stephane, & Wang, 2009; Hewstone, Rubin, & Willis, 2002; Tajfel, Billig, Bundy, & Flament, 1971; Yamagishi & Mifune, 2009), is frequently distributed along clearly observed identity characteristics that define particular social groupings such as race (Rae, Newheiser, & Olson, 2015; Ratcliff, Vescio, & Dahl, 2015), ethnicity (Tanaka & Camerer, 2015), and gender (Ratcliff et al., 2015). Consequently, marginalized or disadvantaged groups frequently experience deleterious psychological (Pascoe & Richman, 2009), physiological (Williams & Mohammed, 2009), and economic effects (Bloch, 1966) from the discrimination that results from in–group bias. In addition to being harmful, cross–cultural research has demonstrated that in–group bias is negatively correlated with prosocial behaviour (Smith, 2015). Thus, disadvantaged groups within a society both experience the harmful effects of discrimination and receive less help from members of advantaged groups. One strategy to promote the welfare of disadvantaged groups and thereby increase equity within a society would be to examine those factors that influence altruistic attitudes and behaviour of individuals from advantaged groups towards individuals from disadvantaged groups.
One such factor may be personality. Few studies have investigated the interaction between personality and social influences on behaviour, although the constructs have been studied widely as independent constructs. Moreover, given that many environmental issues for disadvantaged groups (e.g. living in relatively homogeneous, unintegrated communities; working outside of a nation's benefit system) stem from policy decisions made by individuals, there is utility in focusing on the influence of individual differences in making economic decisions.
There is compelling theoretical and empirical evidence that human personality is hierarchical in structure (McAdams & Pals, 2006; McCrae & Costa, 2008; Rushton, Bons, & Hur, 2008). For the purposes of this study, we focus on the putative distinction between broad personality traits and more narrow personality traits. Broad–level personality traits, such as the Big Five (extraversion, neuroticism, agreeableness, conscientiousness, and openness to experience), predict relatively small effect sizes regarding individual behaviour across almost in all situations. In contrast, empirical evidence suggests that narrow–matrix personality traits (or characteristic adaptations) predict larger effect sizes in individual behaviour in specific situations (e.g. Paunonen & Ashton, 2001). Thus, it seems probable that narrow personality traits have a substantial impact on individual altruistic behaviour towards members of a perceived out–group.
Multicultural Personality
One narrow–matrix personality trait likely to affect altruistic behaviour between individuals from different social groups is multicultural personality. Broadly, multicultural personality can be conceptualized as an individual's ability to successfully adapt and interact with culturally diverse others or environments (Ramirez, 1995, 1999). Van der Zee and Van Oudenhoven (2000, 2001) operationalized multicultural personality by developing the Multicultural Personality Questionnaire (MPQ). The MPQ assesses an individual's ability to successfully run a business, maintain stable mental health, and interact with individuals in a new cultural environment. There is an extensive body of research on the MPQ and its predictive qualities (for a review, see Ponterotto & Fietzer, 2014). For instance, the MPQ predicts ethnic prejudice (Nesdale, De Vries Robbé, & van Oudenhoven, 2012), post–traumatic stress disorder (Herrera & Owens, 2015), and cultural adjustment abroad (Van Erp, Giebels, van der Zee, & van Duijn, 2011; van Oudenhoven, & van der Zee, 2002). However, conceptually and psychometrically, the MPQ is circumscribed to individuals moving from their countries of origin to new environments in foreign countries. Moreover, as the instrument was intended for use in organizational psychology, it primarily was designed to assess cultural adjustment from the perspective of success in the workforce. Thus, the MPQ is suboptimal for assessment of individuals within their native country involved in interactions in a non–employment setting.
In contrast, the hygiology model (Ponterotto, 2010; Ponterotto et al., 2014) defines multicultural personality as individual differences between those who (i) successfully adapt to new or different environments regardless of the individual's culture of origin and (ii) strive to improve the status of disadvantaged groups within a society. Thus, the model applies to all individuals, regardless of group membership, culture of origin, or cultural environment. As an example, based upon his actions to improve the lot of the untouchables in India, Mahatma Gandhi would presumably score highly on multicultural personality, whereas an individual who demands homogeneity through oppression such as Adolf Hitler would presumably score low on the measure. The model presumes evolutionary and developmental bases. Evolutionarily, those ancestral humans open to new experiences sought out other cultural groups and developed a tolerance or even an appreciation for new ways of thinking. This increased acceptance of differences naturally generalized to the engagement in prosocial behaviour towards the unheard or disadvantaged within their group. As tolerance of novel perspectives increased within the group, the increase in divergent thinking towards problem solving allowed for the tolerant group to outcompete other groups. Although unlikely to be a linear process, the success of the tolerant group meant that prosocial and openness to experience components of personality were more likely to be selected. Of course, in times of stress towards the group (e.g. during a scarcity of resources or threat from a competing group), it seems likely that openness to difference would be a liability. Hence, multicultural personality became a narrow–matrix trait that tends to influence behaviour during times of less stress. Thus, given that systemic in–group bias is frequently based upon identity characteristics between two groups (e.g. race, ethnicity, and gender), it is probable that multicultural personality would predict prosocial treatment of out–groups.
The Multicultural Personality Inventory (MPI; Ponterotto et al., 2014) is a seven–factor model designed to operationalize the hygiology model of multicultural personality. The Racial and Ethnic Identity (RID) factor assesses an individual's sense of belonging to their racial and ethnic group. Individuals low on this scale tend to ignore their race or ethnicity, shunning thought and behaviour different from their own. Individuals high on this scale have integrated their race and ethnicity into their identity, acknowledging and celebrating differences in thought and behaviour. A sample item is ‘I am aware of the history of my racial group(s) in this country’. The Social Justice Activism (SJA) factor assesses whether an individual actively promotes tolerance and acceptance of diversity within a society. A sample item is ‘I speak out against oppression that I see (e.g., racism, sexism, homophobia, ageism)’. Psychological Health (PH) assesses the optimism and emotional stability of an individual. A sample item is ‘I am very comfortable taking charge in school or work situations’. Connectedness and Spirituality (CS) assesses how connected an individual believes the world is. A sample item is ‘In times of stress I rely on my sense of spirituality as a coping mechanism’. Humour (HUM) assesses an individual's ability to laugh in positive situations (i.e. at one's self). A sample item is ‘I enjoy reading humorous and comedic articles and books’. Opposite Gender/Sexual Orientation Connection (OGC) assesses how well an individual works with the members of the opposite gender and of different sexual orientations. A sample item is ‘I have very close friends who are gay or lesbian’. Finally, Culturally Diverse Friendships (CDF) assesses how well an individual relates to others perceived as culturally different from himself or herself. A sample item is ‘I have very close friends who represent diverse ethnic groups’. Strong evidence exists for the reliability of the MPI and the validity of its internal structure. Ponterotto et al. (2014) found the MPI correlated positively as predicted with measures of self–esteem, self–efficacy, cognitive flexibility, and attitudes towards diversity.
Social Justice Attitudes
Given that attitudes towards either (i) the preservation of a society's hierarchical structure or (ii) a just society offer competing explanations for individual differences in altruistic behaviour towards disadvantaged groups, we consider the selection of these variables in the present study. In terms of assessing an individual's desire to maintain the status quo, two constructs feature prominently. Social Dominance Orientation (SDO; Pratto, Sidanius, Stallworth, & Malle, 1994) is defined as the degree that an individual prefers inequality among social groups, while Right Wing Authoritarianism (Altemeyer, 1981) is defined as the degree to which individuals prefer the maintenance of historically White (and presumably Western) values and institutional systems along with aggression and submission to authoritarianism. Although these constructs powerfully differentiate between individuals in terms of intolerance and maintenance of social status, it remains unclear whether they adequately distinguish individuals in terms of prosocial behaviour, as they demonstrated mixed results in predicting altruistic behaviour between individuals in mixed–motive games (Haesevoets, Folmer, & van Hiel, 2015). Thus, given the extra resources required to add additional variables to the study, it is beyond the scope of the present study to examine whether preference of inequality is a distinct variable from preference for equality (although see Ho et al., 2012 for an alternative perspective).
Justice sensitivity (Schmitt, Baumert, Gollwitzer, & Maes, 2010) assesses whether an individual perceives injustice during an event as a victim, perpetrator, observer, or beneficiary, with subscales rating each potential viewpoint. Research using the Justice Sensitivity Inventory (JSI) has found that the observer subscale has high internal consistency reliability and correlates with measures relevant to the present study such as empathy (Schmitt, Gollwitzer, Maes, & Arbach, 2005). However, questions about the factor structure and sample validity of the instrument make it ill suited for the present study. In terms of factor structure, exploratory factor analytic data of the four–factor model was based on a convenience sample of 327 participants and no statistics are presented in the literature that can be evaluated. Schmitt et al. did report a principal axes analysis for a three–factor version of the JSI using a representative sample of 2384 participants, but this version demonstrated problematic fit for two of the three factors. Moreover, the confirmatory factor analytic evidence presented reported misfit of the model (Schmitt et al., 2010). Given that the sample size was sufficiently large and that the authors used item parcels and split halves of odd and even items in an attempt to find successful fit of the test, the reported fit statistics were either inadequate or indicated perfect fit, both of which suggest structural problems with the model. Finally, studies examining the validity of the JSI used exclusively German samples, making its generalization to populations from other countries uncertain.
Another way to measure individuals‘ behaviour towards disadvantaged groups is through the construct of social justice attitudes. Measures of social justice attitudes assess how likely an individual is to work towards addressing unfairness towards certain groups within a society. Recently, a number of instruments have been developed to assess social justice attitudes (Corning & Myers, 2002; Nilsson, Marszalek, Linnemayer, Bahner, & Misialek, 2011; Torres–Harding, Siers, & Olson, 2012). Of these scales, the Social Issues Advocacy Scale (SIAS; Nilsson et al.) exhibits the most convincing psychometric evidence of its factor structure, reliability, and relationship with other variables (Fietzer & Ponterotto, 2015). Further, it measures extraneous variables applicable to the present study of issues of justice among citizens of the USA, including political awareness, social advocacy, awareness of social issues, and discrimination.
Dictator Games
The measurement of fairness by humans towards one another originated in the field of behavioural economics (Camerer, 2003). Researchers designed various interactive games involving the assignment of power and money to study participants to assess the impact of these variables on human behaviours, including perceptions of fairness and giving behaviour. Hundreds of experiments have examined numerous iterations of behavioural economic games. Two iterations of interest to the present study are ultimatum games and dictator games. In an ultimatum game, participants are divided into proposers and recipients. Proposers are given an amount of money (e.g. $10) to divide between themselves and the recipient however they wish. After the money is offered, recipients are given the opportunity to either accept the amount offered (in which case both parties retain the amount as divided by the proposer) or reject the amount offered (in which case neither party receives any money). A dictator game is the same as an ultimatum game, except that the recipient does not have an opportunity to reject the amount offered by the proposer. Researchers have found that participants recognize that the recipient in dictator games has significant potential to be treated unfairly (List, 2007; List & Cherry, 2008) and that individuals tend to engage in prosocial behaviour across diverse ethnic and cultural groups (Henrich et al., 2005). Further, researchers have used economic games to determine a potential mechanism that drives in–group bias, as more homogeneous groups have been found to give more because these groups have greater access to more stringent punishments towards self–serving individuals within a community than individuals from more heterogeneous groups (Habyarimana, Humphreys, Posner, & Weinstein, 2007).
There is substantial scholarship that has used dictator games to study intergroup behaviour. Researchers have generally demonstrated that social distance between two individuals predicts the amount given in a dictator game (Baldassarri & Grossman, 2013), with greater social distance between individuals, meaning less is given (typically interpreted as indicating less altruistic behaviour). A recent meta–analysis expanded upon this finding, demonstrating that people are generally more cooperative with recipients representing their in–group as opposed to discriminatory towards an out–group member and that social distance has a larger effect in simultaneous but not sequential exchanges (Balliet, Wu, & de Dreu, 2014). However, an ethnographic study by Gil–White (2004) found no in–group bias between two different ethnic Mongolian groups, finding instead that perceptions of damage to an individual's reputation were more explanatory of giving behaviour. Moreover, Abascal (2015) demonstrated that giving behaviour changed depending on the group examined, with giving behaviour between Black and White people changing depending on the description of a third group (Hispanics) introduced to participants. Taken together, the evidence suggests that social distance is likely a major explanatory factor for differential giving in dictator games, but not the only one.
It is perhaps surprising then that there is relatively little research on the influence that self–reported individual differences may contribute. One exception that focuses on broad personality traits is a study by Ben–Ner, Putterman, Kong, and Magan (2004), who found that differences on Agreeableness and Neuroticism predicted differences in reciprocity behaviour during a two–stage dictator game. A more recent study of 222 undergraduates found that personality profiles of the broad traits appeared to affect giving behaviour in a dictator game (Ben–Ner & Kramer, 2011). A third study assessed the impact of broad traits of 75 undergraduates on prosocial orientation using a series of altered dictator games and found that the most giving individuals were high on Openness and low on Neuroticism and Extraversion (Brocklebank, Lewis, & Bates, 2011).
Regarding more narrow–matrix characteristic adaptations, researchers have found in student samples that higher levels of justice sensitivity predicted more equitable distributions of money in dictator games between individuals (Baumert, Schlösser, & Schmitt, 2014; Fetchenhauer & Huang, 2004). Another promising strand of research found that honesty–humility predicted giving behaviour in dictator games (Hilbig, Thielmann, Hepp, Klein, & Zettler, 2015; Hilbig, Thielmann, Wührl, & Zettler, 2015). However, we could find no study that has examined a measure of cultural adjustment compared with broad personality traits as a predictor of giving behaviour in dictator games.
The Present Study
The current study examines whether narrow traits of cultural adjustment predict individual altruistic behaviour towards disadvantaged groups in a modified dictator game while controlling for broad personality traits and social justice attitudes. No study to our knowledge has investigated the relationship of cultural adjustment and giving behaviour in dictator games when the recipient is from a historically disadvantaged group within a society. We used the hygiology model of multicultural personality to measure cultural adjustment and a modified dictator game to examine individual differences in prosocial behaviour. We hypothesized that multicultural personality would predict individual behaviour towards disadvantaged groups above and beyond that of broad personality traits (the Big Five) and social justice attitudes. Specifically, as scores in individual scales of the MPI increased, we predicted that participants would give more money to participants perceived as disadvantaged.
Material and Methods
Participants
Participants were recruited in two ways: from a volunteer subject pool at an academic institution and classroom recruitment. Participants were recruited from two postsecondary institutions located in the Northeastern United States, one a private military institution and the other a private, religious institution. Of the 178 participants who completed the study, 153 provided data that were complete and usable. The average age of participants was 21.6 years (ranging from 18 to 52, SD = 5.60). The sample was predominantly female (59.5%) and White (81.0%), followed by Hispanic/Latino (4.6%), Black (3.9%), East Asian (3.3%), biracial (3.3%), multiracial (3.3%), and Pacific Islander (0.7%). In terms of education completed, the majority of the sample was of undergraduate status (83.6%), with the remainder reporting that they were in graduate school. The sample identified as primarily Christian (60.1%), followed by Agnostic (15.0%), Atheist (9.8%), Jewish (3.9%), and Buddhist (0.7%), with 10.5% not reporting their religious identity.
Materials
Dictator game
To measure altruistic behaviour towards disadvantaged groups, we used a modified version of a dictator game. The purpose of the original dictator game was to determine whether fairness was relevant to economic interactions (Kahneman, Knetsch, & Thaler, 1986). In the study by Kahneman et al., 76% of 161 students divided the pool of money evenly between themselves and a stranger, and 74% preferred to reward a fair allocator while punishing an unfair allocator, despite an economic incentive in the study to leave the unfair allocator unpunished. Thus, it seems that people inherently understand that the distribution of money in dictator games is based on the fairness of the person in the dictator role. A meta–analysis of 129 dictator game studies found that the results of dictator games hold regardless of the amount of money involved (Engel, 2011), and Fehr and Schmidt (1999) and Fetchenhauer and Huang (2004) found results held regardless of whether only a small percentage of participants were selected by lottery to receive the amount they distributed to themselves.
In the present study, the dependent variable was measured by how much money participants acting as dictators—called proposers in the vignette—gave to hypothetical recipients who were presumably viewed as treated unfairly due to their demographic characteristic (either race or gender) in a vignette. To establish this unfair treatment, participants read the following vignette:
You are participating in a three person game which lasts for two rounds. Each person is randomly assigned a different role each round. The roles are Proposer, Recipient, and Observer. The Observer's role is to watch the other two participants. For each round, $10 is allocated to the Proposer to divide between the Proposer and the Recipient in $1 increments. The participants then keep the money as it was divided by the Proposer. As an example, a Proposer might choose to keep $8 and give the Recipient $2.
At this point, the other two hypothetical characters playing the game are introduced. One character is always John, a White man aged 31 years who plays the Proposer in the first round and the Observer in the second round. The other character presented is 33 years old and is (A) Jamal, a Black man, (B) Jane, a White woman, or (C) James, a White man. The participant then read,
During the first round, you are randomly selected to be an observer and two others, John and [Jamal, Jane, James], are the participants. John is randomly selected to be the Proposer, meaning that [Jamal, Jane, James] is the Recipient. John decides to give himself $9 and [Jamal, Jane, James] $1. During the second round, you and [Jamal, Jane, James] are participants while John is the Observer. You are given $10 to divide between yourself and [Jamal, Jane, James]. How much to do you give [Jamal, Jane, James]?
The perceived social status of the recipient acts as the independent variable in the study, which varied between advantaged status (White man) and two disadvantaged statuses (Black man and White woman). We chose the disadvantaged statuses of Black man and White woman because both are emblematic of racism and sexism, in that when many people in the USA think of racism, they picture discrimination towards a Black man, and when they think of sexism, they picture a White woman (Inman & Baron, 1996). Additional disadvantaged identity statuses (e.g. Black woman, gay man, and Asian woman) should be investigated, but the present study focused on these two to determine (i) whether there was an effect in the study based on emblematic identity statuses and (ii) to maintain adequate levels of power while preventing an increase in participants to problematic levels in terms of researcher resources. Finally, some would consider that disadvantage may be cumulative, implying that being disadvantaged in terms of race and gender (i.e. a Black woman) may be more disadvantaged than individuals marginalized in only one category. We did not include a Black woman because inclusion of this level to the independent variable would answer a question unrelated to the focus of the present study (i.e. whether disadvantage relative to identity status can be cumulative), without necessarily addressing the present study's focus on individual differences on giving behaviour.
Demographic questionnaire
The demographic questionnaire asked participants to state their age, gender, race, ethnicity, highest level of education completed, religion, approximate household income, and the number of people living in their household.
Multicultural Personality Inventory
We used the seven–factor, 70–item MPI (Ponterotto et al., 2014) to measure multicultural personality. Participants rated items on a five–point scale from 1 (strongly disagree) to 5 (strongly agree). Ponterotto et al. found empirical evidence for the internal structure, convergent and discriminant validity, and incremental validity of the MPI. Black–Giardino et al. (2016) found strong evidence for the 4– and 8–week test–retest reliability of the MPI. The PH subscale of the MPI predicts the distally related variables of self–esteem, life satisfaction, self–efficacy, and cognitive flexibility. The RID, SJA, and CDF subscales predict the proximally related variables of contact with diversity, comfort with cultural differences, and a relativistic appreciation of cultural similarities and differences. There is clear evidence that the MPI is distinguishable from measures of social desirability, and its factors demonstrate evidence of reliable internal consistency. For the present study, coefficient αs were .84 for RID, .88 for SJA, .90 for PH, .87 for CS, .75 for HUM, .73 for OGC, and .74 for CDF, ranging from moderate to excellent based on the classical test theory developed ‘Reliability Matrix for Estimating the Sufficiency of Internal Consistency Measures’ (cf. Ponterotto & Ruckdeschel, 2007).
Big Five Inventory
The Big Five Inventory (BFI; Benet–Martínez & John, 1998; John, Donahue, & Kentle, 1991; John, Naumann, & Soto, 2008) is a 44–item scale that measures the Big Five personality traits: Extraversion, Neuroticism, Conscientiousness, Agreeableness, and Openness. The scale uses prototypical short phrases to assess the personality dimensions of participants, with items rated by participants on a five–point Likert–type scale with anchors from 1 (disagree strongly) to 5 (agree strongly). There is evidence for the validity of the BFI across cultures, as its psychometric properties remain robust when it is translated into other languages (e.g. Spanish: Benet–Martínez & John, 1998; Dutch: Denissen, Geenen, van Aken, Gosling, & Potter, 2008) or when it is administered to sub–cultures within the USA (e.g. African–Americans: Worrell & Cross, 2004). A multitrait–multimethod confirmatory factor analysis of the BFI with two other prominent instruments measuring the Big Five found that the BFI was superior in terms of fit indices, suggesting that it provides the most parsimonious assessment of the Big Five (John & Srivastava, 1999). The BFI has demonstrated robust evidence of reliability internally and across time: coefficient αs range from .79 to .88, and 3–month test–retest reliabilities of the BFI range from .80 to .90 (Benet–Martínez & John, 1998). For the present study, coefficient αs were .85 for Extraversion, .72 for Agreeableness, .81 for Conscientiousness, .85 for Neuroticism, and .69 for Openness.
Social Issues Advocacy Scale
To measure social justice attitudes, we used the SIAS (Nilsson et al., 2011), a 21–item self–report scale with four factors: Political and Social Advocacy (PSA), Political Awareness (PA), Social Issues Awareness (SIA), and Confronting Discrimination (CD). Items are rated using a five–point Likert–type scale with anchors at 1 (strongly disagree) and 5 (strongly agree). Researchers have found strong evidence for the internal structure of the SIAS, its convergent validity, and its discriminant validity from measures of self–esteem and life satisfaction (Beer, Spanierman, Greene, & Todd, 2012; Nilsson et al., 2011). Coefficient αs in the current study were .89 for PSA, .88 for CD, .86 for PA, and 0.86 for SIA.
Social distance
To calculate social distance, we divided race into two groups: White people and people of colour. This process made the tenuous assumption that all people of colour would identify more with another individual disadvantaged for race (i.e. the Black man) than with individuals who identified as White. Further, given the relative racial homogeneity of the sample, this division preserved the power of the sample. Social distance was then calculated as a nominal variable with three levels: (0) no distance defined as the participant and recipient sharing racial and gender characteristics; (1) short distance defined as the participant and recipient sharing either racial or gender characteristics but not both; and (2) long distance defined as the participant and recipient sharing neither racial nor gender characteristics. Thus, a participant identifying as a White woman in the Black male condition would be assigned a 2 and an African–American woman assigned to the Black male condition would be assigned a 1.
Procedure
Participants were solicited via email and in person to participate in the proposed study. They were informed that participation permitted entrance into a raffle (1 in 10 odds) to keep the amount of money they gave to themselves during the study. After consenting to the study, participants clicked on an Internet link to www.surveymonkey.com and read the dictator game vignette.
Participants were randomly assigned to one of three groups (percentages for each group are in parentheses): (1) disadvantaged race (recipient is a Black man: 29.4%), (2) disadvantaged gender (recipient is a White woman: 40.1%), and (3) advantaged race and gender (recipient is a White man: 30.1%). An error created unequal distribution of participants to each level of the independent variable. Although with small numbers between cells this is a problem, with larger numbers between cells, the difference between the two distribution methods becomes negligible. Further, this distribution method meant that each participant had a truly equal chance of being selected for each category. Thus, it seems likely that extraneous variables were sufficiently controlled by this process.
Manipulation check
A manipulation check randomly assigned 71 participants demographically similar to the main sample to one of six dictator games that replicated the game described in the main analysis. Three of the dictator games involved the Black male recipient and the other three involved the White male recipient. The amount given to the recipients in the first round of the modified dictator game varied from $1, $3, and $5, resulting in six levels of the independent variable. An analysis of variance with the different amounts was given to recipients as the independent variable and a question of whether the recipient received a fair deal (using a five–point Likert–type scale) found a statistically significant difference between groups, F(2, 66) = 18.043, p < .001. Post–hoc tests (Tukey's honestly significant difference) found that recipients given either $1 or $3 were considered to be treated unfairly than recipients given $5. A t–test found that participants viewed the Black male recipient as representing a marginalized group compared with the White male recipient, t(67) = 3.851, p < .001.
Results
All data were analysed with Statistical Package for the Social Sciences (SPSS) version 22.0 (IBM Corp. Released, 2013). Missing values were equivalent to less than 5% of the total cases across all variables and thus could be ignored (Meyers, Gamst, & Guarino, 2006). However, listwise deletion in SPSS resulted in only 129 of the 153 cases being usable, resulting in a loss of statistical power. Thus, mean substitution was imputed for missing values on the MPI, BFI, and SIAS items to preserve statistical power.
Preliminary analyses revealed that the school samples differed on gender, χ2(1) = 47.199, p < .001, with one school having more women (85%) and the other school more men (70%). After Bonferroni correction, the school samples also differed between SJA, t(151) = 6.765, p < .001, and SIA, t(151) = 6.536, p < .001. Participants from the religious institution had higher self–reported SJA scores (mean = 4.10) than participants from the military institution (mean = 3.50) and higher SIA scores (mean = 4.33 compared with 3.63). Point–biserial correlations between gender, school, SJA, and SIA found significant correlations between gender and SJA (r = .45), gender and SIA (r = .21), gender and school (r = −.56), school and SJA (r = −.48), and school and SIA (r = −.46). Further analysis of school differences using only men found significant differences on SIA, t(60) = 4.087, p < .001, but no differences among other variables. Similar results were found using only women while comparing schools, with only SIA as significant, t(89) = 4.063, p < .001. Thus, in the current sample, school and gender were included as independent variables in the regression.
Age as a variable was severely positively skewed, to the point that transformations of the variable (i.e. square root, log, and inverse) did not correct for skewness of the variable. Inclusion of the variable in the model caused the model to violate the statistical assumption of proportional odds. Given that the variable was not statistically significant and its inclusion did not affect the statistical significance of other variables or of the overall omnibus test, Age was excluded from the regression analyses. Table 1 provides a summary of descriptive statistics for each variable in the main analysis.
Summary of descriptive statistics for primary study variables
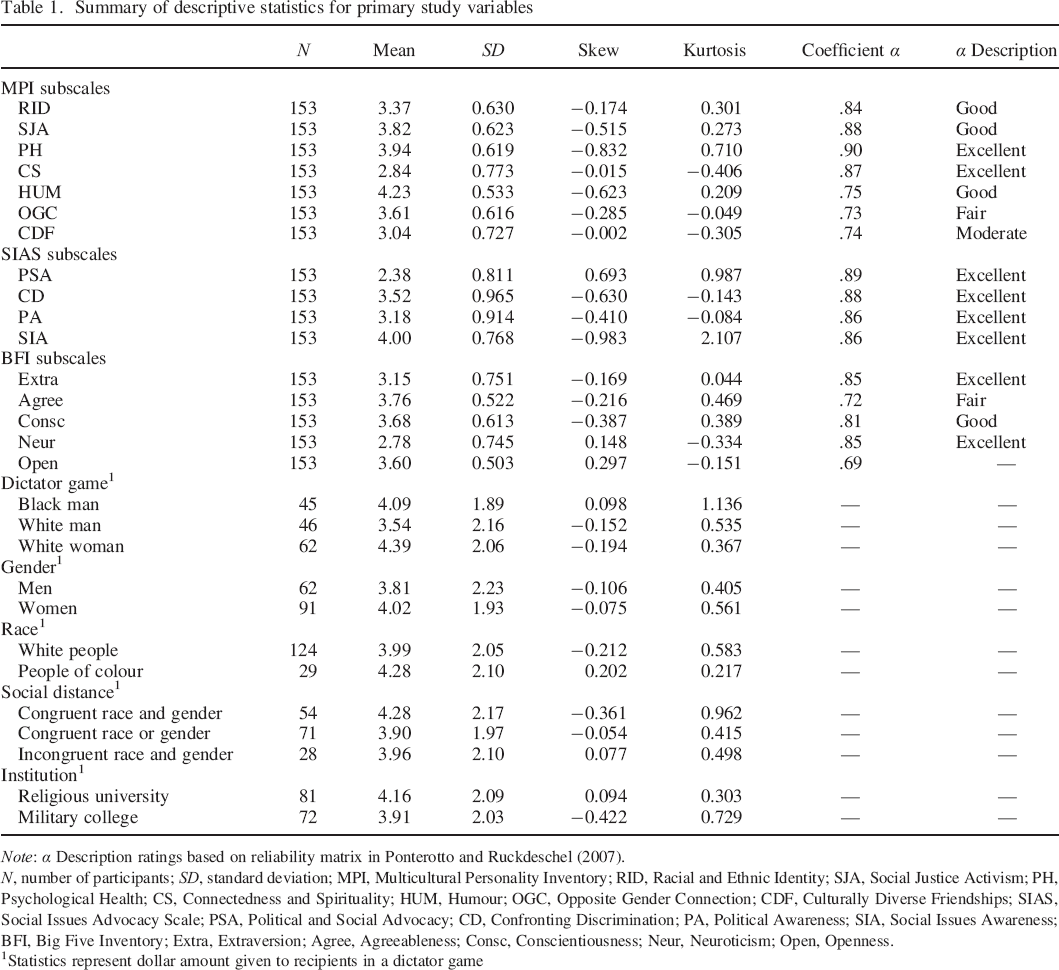
Note: α Description ratings based on reliability matrix in Ponterotto and Ruckdeschel (2007).
N, number of participants; SD, standard deviation; MPI, Multicultural Personality Inventory; RID, Racial and Ethnic Identity; SJA, Social Justice Activism; PH, Psychological Health; CS, Connectedness and Spirituality; HUM, Humour; OGC, Opposite Gender Connection; CDF, Culturally Diverse Friendships; SIAS, Social Issues Advocacy Scale; PSA, Political and Social Advocacy; CD, Confronting Discrimination; PA, Political Awareness; SIA, Social Issues Awareness; BFI, Big Five Inventory; Extra, Extraversion; Agree, Agreeableness; Consc, Conscientiousness; Neur, Neuroticism; Open, Openness.
Statistics represent dollar amount given to recipients in a dictator game
Table 2 provides a summary of correlations between the variables included in the study. The amount of money given by participants to recipients correlated significantly with SJA from the MPI, r = .23. As expected, SJA correlated significantly with PSA, r = .27, CD, r = .35, and SIA, r = .47. PH correlated strongly with Neuroticism from the BFI, r = −.75. PSA is strongly correlated with PA, r = .65.
Correlations between the amount given to recipients, the MPI subscales, the SIAS subscales, and the BFI subscales
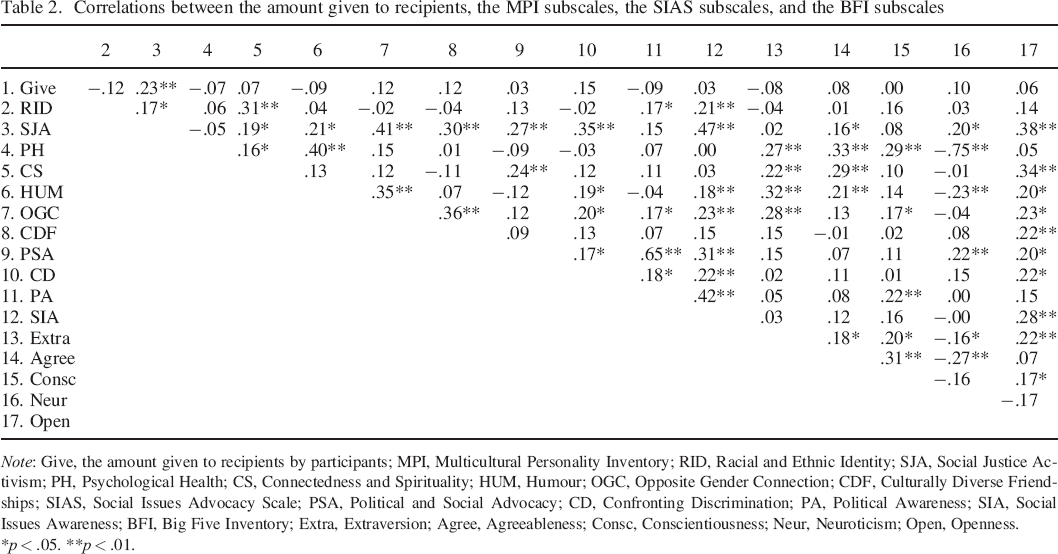
Note: Give, the amount given to recipients by participants; MPI, Multicultural Personality Inventory; RID, Racial and Ethnic Identity; SJA, Social Justice Activism; PH, Psychological Health; CS, Connectedness and Spirituality; HUM, Humour; OGC, Opposite Gender Connection; CDF, Culturally Diverse Friendships; SIAS, Social Issues Advocacy Scale; PSA, Political and Social Advocacy; CD, Confronting Discrimination; PA, Political Awareness; SIA, Social Issues Awareness; BFI, Big Five Inventory; Extra, Extraversion; Agree, Agreeableness; Consc, Conscientiousness; Neur, Neuroticism; Open, Openness.
p < .05.
p < .01.
A cumulative odds ordinal logistic regression with proportional odds (Hosmer, Lemeshow, & Sturdivant, 2013) was run to determine the effect of multicultural personality, social justice attitudes, and broad personality traits on the amount given to recipients of varying racial and gender statuses in the modified dictator game. Owing to the large number of covariates in the study and because ordinal regression analysis does not permit a hierarchical imputation of covariates, data analysis proceeded in a series of steps with fit indices used to evaluate nested models. First, we conducted three separate ordinal regressions. For all three analyses, the dependent variable was the amount given by participants to the recipient and the independent variables were the advantaged status of the recipient (Black man, White woman, and White man), gender, race, school attended, and social distance. The covariates were divided according to construct into three categories (MPI, SIAS, and BFI), with each loaded into the model separately for analysis. In the second step, given that multicultural personality was the variable of interest, we examined the MPI with either the SIAS or BFI simultaneously to determine whether relationships held while maintaining adequate statistical power.
The MPI–only model met the assumption that there were proportional odds in the dependent variable as assessed by a full likelihood ratio test comparing the fitted model with a model with varying location parameters, χ2(126) = 113.498, p = .78, but 91% of cells had zero frequencies. However, the final model was statistically significant above the intercept–only model, χ2(14) = 25.291, p = .032. RID, SJA, and HUM were statistically significant covariates. A decrease in RID was associated with an increase in the odds of giving more money to the recipient, with an odds ratio of 0.58 [95% confidence interval (CI), 0.35 to 0.97], χ2(1) = 4.265, p = .039. An increase in SJA was associated with an increase in the odds of giving more money to the recipient, with an odds ratio of 2.63 (95% CI, 1.36 to 5.01), χ2(1) = 8.194, p = .004. A decrease in HUM was associated with an odds ratio of 0.49 (95% CI, 0.25 to 0.96), χ2(1) = 4.322, p = .038. Neither the SIAS–only model, χ2(11) = 15.137, p = .176, nor the BFI–only model, χ2(12) = 10.613, p = .562, were statistically significant. Table 3 provides a summary of each model.
Ordinal logistic regressions with the MPI and MPI–SIAS scales regressed onto the amount given to recipients as the dependent variable
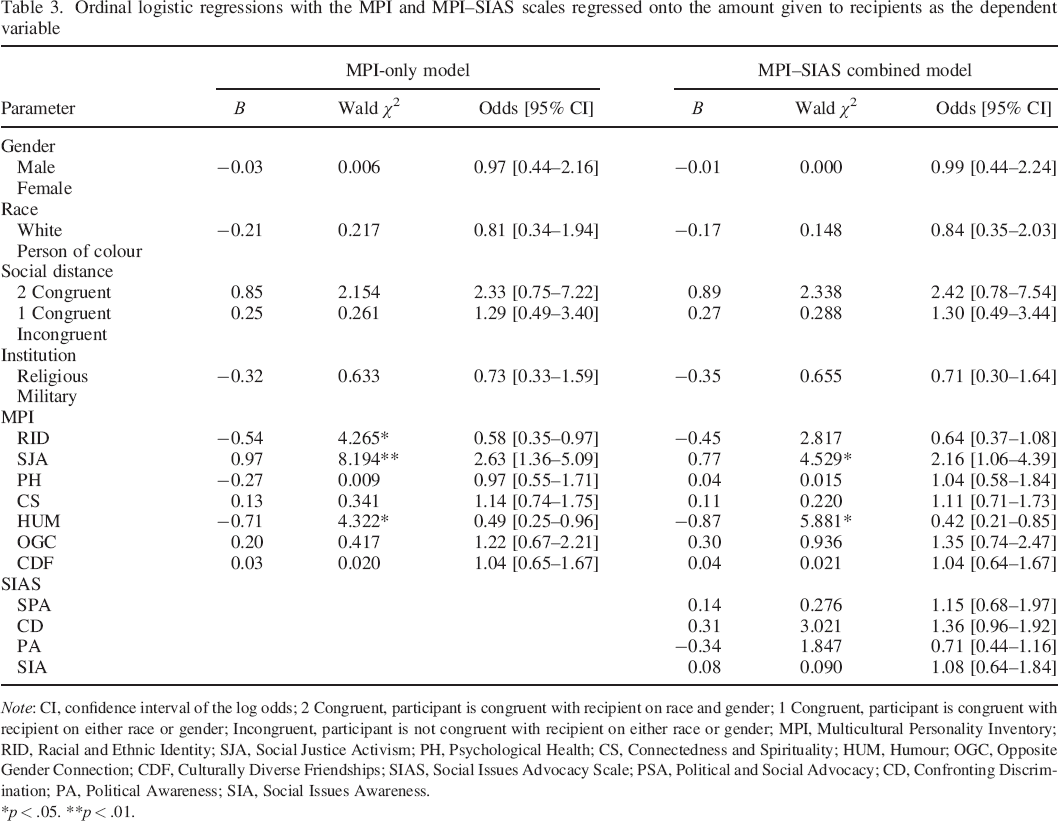
Note: CI, confidence interval of the log odds; 2 Congruent, participant is congruent with recipient on race and gender; 1 Congruent, participant is congruent with recipient on either race or gender; Incongruent, participant is not congruent with recipient on either race or gender; MPI, Multicultural Personality Inventory; RID, Racial and Ethnic Identity; SJA, Social Justice Activism; PH, Psychological Health; CS, Connectedness and Spirituality; HUM, Humour; OGC, Opposite Gender Connection; CDF, Culturally Diverse Friendships; SIAS, Social Issues Advocacy Scale; PSA, Political and Social Advocacy; CD, Confronting Discrimination; PA, Political Awareness; SIA, Social Issues Awareness.
p < .05.
p < .01.
The MPI–BFI combined model did not meet the assumption of proportional odds in the dependent variable, χ2(171) = 514.814, p < .001, and was not statistically significant, χ2(19) = 27.095, p = .102. The MPI–SIAS combined model did not have enough statistical power to determine whether it met the assumption of proportional odds in the dependent variable. However, the overall model was statistically significant, χ2(18) = 29.587, p = .042, and two covariates were statistically significant. Specifically, an increase in SJA was associated with an odds ratio of giving more money to the recipient of 2.16 (95% CI, 1.06 to 4.39), χ2(1) = 4.529, p = .033, and a decrease in HUM was associated with an odds ratio of 0.42 (95% CI, 0.21 to 0.85), χ2(1) = 5.881, p = .015. Comparison of fit statistics between the MPI–only model and MPI–SIAS combined model reveals minimal improvement of fit of the more complex model. The −2 log likelihood for the MPI–only model was 516.618 compared with 512.322 of the MPI–SIAS model. The Nagelkerke pseudo–R2 and Cox and Snell pseudo–R2 were .157 and .152, respectively, for the MPI–only model, and .181 and .176 for the MPI–SIAS model. Thus, the MPI–SIAS model did not explain that much more variance than the MPI–only model. Applying the rules of parsimony, we selected the MPI–only model as the model that best fit the data.
To further parse the results between the disadvantaged groups, we conducted three analyses of covariance with planned contrasts examining the disadvantaged statuses against the advantaged status. The amount given to recipients was the criterion variable; disadvantaged status was the grouping variable; and SJA, RID, or HUM was the predictor. For SJA, the overall model was statistically significant, F(3, 149) = 3.704, p = .013, r2 = .069, although planned contrasts showed no difference between levels of the independent variable. For RID, the overall model was not statistically significant, F(3, 149) = 2.469. However, planned contrasts revealed that as RID increased, the amount given to White men significantly decreased compared to that given to White women, p = .026. The same trend appeared comparing Black men with White men but did not attain statistical significance, p = .180. For HUM, the overall model was not statistically significant, F(3, 149) = 2.119, p = .100. Planned contrasts found that as HUM increased, the amount given to White men significantly decreased compared with the amount given to White women.
Discussion
The aim of the present study was to determine whether individual differences in cultural adjustment predicted altruistic behaviour towards individuals from disadvantaged groups using a modified dictator game. Results of the study partially supported the hypothesis. Three of the MPI scales—SJA, RID, and HUM—significantly predicted participant giving behaviour to recipients of disadvantaged status, lending support to the hygiology theory of multicultural personality (Ponterotto, 2010) and providing evidence of the predictive validity of the MPI (Ponterotto et al., 2014). However, only SJA demonstrated results congruent with a priori predictions of the direction of effect. As SJA increased, the odds that a larger amount given to all three recipients are increased, suggesting that participants perceived each recipient as being treated unfairly, regardless of race or gender. Although there were no statistically significant differences between the groups, White men were given the lowest amount on average. Thus, the more that individuals perceived themselves as advocating for social justice, the more money they gave to recipients.
The manner in which RID predicted behaviour was unexpected. As RID increased, participants gave less to all three groups, with a statistically significant difference between White men and White women (and a nearly statistically significant difference between White men and Black men). It seems that as participants increasingly identified with their race and/or ethnicity, the more indifferent they became towards the unfairness experienced by all three groups, with particular indifference towards the White man. Given that racial identity theory predicts that individuals in the advanced stages of racial identity ‘generally represent a high self–esteem with regard to one's own racial identity coupled with a balanced, cognitively complex, social justice–oriented, and engaging attitude towards those of different races’ (Ponterotto, 2010, p. 24), these results initially appear inconsistent with the hygiology theory. One explanation may be that RID is not a measure of advanced stages of racial identity development such as internalization (cf. Cross & Vandiver, 2001), but instead a measure of earlier stages that reflects more polarized approaches to dealing with racial issues (i.e. favouring one race over another in some way). Perhaps SJA represents a closer measure of advanced stages of racial identity development, given that it predicted a similar outcome regardless of race. Further research should explore the relationships between racial identity theory and the MPI to explicate these findings.
The result that most confounded predictions was that as HUM increased, the amount given to the White man decreased compared with the amount given to the White woman. This suggests that as individuals increasingly identify as having a sense of humour, they are less inclined to give money to White men perceived as treated unfairly. The hygiology model of multicultural personality predicts that humour is linked with cognitive flexibility and self–awareness (Ponterotto, 2010); this result suggests that increased endorsement in a sense of humour, at least as measured by the MPI, is less related to altruistic behaviour for members of advantaged groups. It is tempting to posit that social distance played a role, but race, gender, nor social distance was statistically significant in the model. Indeed, the difference between the average amounts given to the White man and White woman by men ($0.63) was nearly equal with the difference given by women ($0.83). Instead, given that humour often derives from a situation not meeting expectations, it may be that those individuals that perceive themselves as having a sense of humour take delight in watching the individual with the most advantage (i.e. the White man) get some form of comeuppance, whereas more tragic figures (i.e. those of a disadvantaged status) are perceived as being mistreated and the individual responds more empathically.
Interestingly, broad personality traits (i.e. the Big Five) and general attitudes towards social justice did not predict giving behaviour. That the SJA predicted altruistic behaviour towards disadvantaged individuals while the SIAS scales did not may have occurred owing to differences in what each scale measures. The SIAS scales focus primarily on awareness of social issues and using political action to agitate for change (Nilsson et al., 2011). Although one scale, CD, appears conceptually similar to the SJA scale of the MPI, it has only three questions and consequently may not have generated enough variance among respondents to become a significant predictor. Given these results, it would be interesting to compare constructs such as SDO and justice sensitivity with the MPI on giving behaviour. Along similar lines, recent studies have found that the trait of honesty–humility significantly predicts giving behaviour in dictator games (Hilbig, Thielmann, Hepp, et al., 2015; Hilbig, Thielmann, Wührl, et al., 2015), and it would be instructive to examine how multicultural personality interacts with this trait using a similar experimental design as well.
One implication of this study is that cultural adjustment predicts how one interacts with disadvantaged members of society. Therefore, one would expect individuals with high trait levels of multicultural personality to be more altruistic towards marginalized groups within a society in addition to race and gender. This likely includes other identity characteristics (i.e. sexual orientation, religious affiliation, and ethnicity) and statuses (e.g. homelessness and socio–economic status).
Beyond group interactions between native members of a society, cultural adjustment may predict how members within a society react towards members foreign to the community. For example, cultural adjustment may predict individual attitudes towards immigration. One salient example is the debate surrounding the immigration of refugees from Syria to various countries in Europe. The results from this study suggest that the variety of reactions towards refugees from the natives within each country is at least partially explainable by multicultural personality, and that those with higher trait scores of multicultural personality would be more willing to provide assistance to refugees. Given that Ponterotto (2010) predicts that multicultural personality can be facilitated through increasing interaction by an individual in new cultural environments, it may explain why a country such as Germany has overall favourable ratings towards immigrants compared with other European countries. Germans have had to acclimate to the integration of East and West Germany and, as the primary economic force in Europe, have welcomed immigrant help from Turkey and other countries. Thus, it makes sense that many Germans would feel more amenable to an influx of refugees than other countries in Europe.
Limitations of the present study
One limitation of the modified dictator game is that there is no condition assessing how much money participants would give to recipients if the recipients were treated fairly during the first round of the game (e.g. given $5 during the first round). Knowing this would provide a baseline that would permit the assessment of ‘pure’ attitudes towards individuals from disadvantaged groups by examination of the average differences between similar conditions. This value could then be compared with the amount participants gave to recipients who were treated unfairly. Another limitation of the modified game is that it did not assess the perceived degree of disadvantage of recipients by participants. For instance, Black women may be perceived as more disadvantaged than Black men and White women as they have two identity characteristics (Black and female) considered to be disadvantages. However, Black women were not included as a level of the independent variable, an issue that future studies should explore.
From a measurement perspective, it is presumptive to have grouped individuals from Asian, Black, and Latino race and ethnicities as people of colour as a way to measure social distance. Although it is plausible that individuals native to the USA identifying as non–White racial and ethnic statuses align with the plight of Black Americans, it is not a universally demonstrated phenomenon and represents an area of further study. Specifically, future studies might benefit from using homogeneous samples in terms of race, gender, or both to better control for the effects of social distance.
The study lacked sufficient power to detect potential effects of social distance in responding to disadvantaged status in terms of race. Similarly, the biased sampling that included mostly women from a religious higher educational institution located in a major metropolitan area and mostly men from a military higher educational institution located in a rural area presents potential confounding variables in understanding differences in the response process by participants. For instance, it may be that individuals attending a military school are more traditionalist in their worldview and so gave the White female recipient more money not because they perceived her as disadvantaged but because this recipient is viewed as a ‘damsel in distress’ who needs to be rescued. The sample was overrepresented by White women; the recipient given the most money was the White woman. A similar effect may have appeared for the Black male recipient had more Black men and women been included as participants. Future studies should examine whether the effect observed in the present study is robust with respect to a greater focus on social distance between the race and gender of the participant and recipient.