
Abstract
Economists estimate that 47% of US jobs will be computerized in the future. This paper tests the prospective role of a comprehensive range personality factors on selection into more (or less) computerizable jobs. We used a US representative high school sample (N = 346 660) and a longitudinal design. At baseline, we measured social background, intelligence, personality traits and vocational interests. In two follow–ups (11 and 50 years later), we recorded occupations and coded their probability of being computerized based on the skills required and technological developments. Multiple regressions showed that, regardless of social background, people who were more intelligent, mature, interested in arts, and sciences at baseline, and selected into jobs that had a lower probability of computerization. On average, a one standard deviation increase in each of these traits predicted an average of 4 percentage points drop in the probability of one's job of being computerized. At the US population level, this is equivalent with saving 5.8 million people from losing their future careers to computerization. Most effects replicated across time. Path analyses showed that educational attainment mediated these effects and some direct effects remained. This highlights the importance of personality on occupational selection and in shaping the labour market. Copyright © 2017 European Association of Personality Psychology
Keywords
Thou aimest high, Master Lee. Consider thou what the invention could do to my poor subjects. It would assuredly bring to them ruin by depriving them of employment, thus making them beggars. (Queen Elizabeth I, 1589; as cited in Acemoglu & Robinson, 2012, p. 182f)
In 1589, William Lee, the inventor of the stocking frame knitting machine, travelled to London seeking patent protection for his invention, hoping to relieve workers of hand–knitting. To his dismay, Queen Elizabeth I not only rejected his request, but she also warned him of the dangers of his invention and what it could do to employment. Eventually, the hosiers’ guilds’ opposition to Lee's invention was so strong that Lee had to leave Britain and seek a patent from France instead, which he eventually received. Fast forward to 2016 and we can observe great popular anxiety regarding the impact that artificial intelligence (including driverless cars and 3D printers) could have on employment. Furthermore, economic data combined with data on machine learning and mobile robotics seem to support these popular fears. Specifically, economists predict that, barring political roadblocks, 47% of US jobs are at high risk for being computerized (i.e. automated by means of computer–controlled equipment) over the next 20 years; notably, in this context, a ‘high risk’ job is defined as a job that has a probability of computerization higher than 70% (Frey & Osborne, 2013). Likely, many workers who are currently in jobs at high risk for computerization will be adversely affected as the labour market changes, but solutions to the resulting unemployment and falling wages are beyond the scope of this paper. However, personality psychology can make an essential contribution when it comes to one key question: Which individual–level personality characteristics, measured in youth, predict later selection into jobs that have a lower probability of being computerized? The reason this is a key question is that it may inform the kinds of training interventions we should seek to ensure that future generations will be prepared for the jobs that will be available as labour markets change (i.e. jobs that have a low probability of being computerized). To investigate the extent to which personality characteristics predicted people's later selection into jobs with a lower probability of being computerized, the present study used a longitudinal design (with two follow–ups, one in young adulthood and one at the end of people's careers) and a representative US sample of 346 660 high school students.
Another key question that societies around the world will face, as artificial intelligence displaces more and more workers and we shift towards knowledge–based economies, is as follows: Can our current educational system properly prepare individuals for the changing labour market or do societies need to invest more in training specific personality characteristics that may help individuals be more prepared for future jobs and that may not be currently trained in the context of traditional education? To address this question, we tested whether the ‘transactional model’ (Heckman, 2006) accurately described the data. According to the transactional model, individual differences in personality only impact job outcomes through their effect on education, where education is measured as the level of traditional education attainment (Heckman, 2006). However, if we found that individual differences in personality showed direct effects on people's selection into less computerizable jobs (over and above their indirect effects through traditional educational attainment) that would suggest that the effect of personality on job computerizability is not fully explained by traditional education, which may further imply that there might be room to improve education. For instance, we might be able to improve the outcomes of education by extending education to include the training of personality characteristics (assuming these characteristics were malleable through interventions, which we will return to in the Discussion section).
In sum, this paper sought to uncover to what extent individual differences (pertaining to three different broad categories of personality, i.e. intelligence, personality traits and vocational interests) predicted people's selection into more (or less) computerizable jobs over the lifespan, and whether these effects could be fully explained by traditional educational attainment alone. In doing so, we hoped to uncover personality factors that might help prepare workers for the emerging labour market. More broadly, the goal of this research was to investigate the role of personality on selection into social roles (in this case, different types of jobs) over the lifespan. We took an integrative theoretical approach, combining past work from sociology, economics and psychology, to investigate the role of personality on occupational selection and in shaping the labour market.
Technological advances and the labour market
Despite century–old fears that technological advances would bring a ‘jobless future’, technological progress has had two competing effects on employment (Aghion & Howitt, 1994). First, as technology substituted for labour, jobs were indeed destroyed and workers were displaced and forced to reallocate their labour supply. However, the second phase of this process has always been a capitalization effect, meaning that more companies entered industries where productivity was relatively high (thanks to the cheap labour brought about by automatization), thus leading to the creation of more jobs in those sectors. Historically, the capitalization effect has been predominant, as economies were always able to find new uses for labour. One key question in this process is what kind of new labour is needed as technological advances are introduced, and how can societies adapt to these changes by providing individuals with optimal training opportunities? The answer to this question has varied historically. For example, the 19th century Industrial Revolution, powered by the steam engine, led to an increased demand for unskilled labour in factory assembly lines (Clark, 2008), whereas the 20th century technological advances led to an increased demand for relatively educated office workers, as more office machines were introduced (Krueger, 1993). Although the capitalization effect has been predominant historically, it is possible that the pace at which computers will displace labour in the future might outrun the pace at which we can create new uses for labour (Keynes, 2010). Historically, we could create new uses for labour by means of acquiring new skills through education (Goldin & Katz, 2009). However, recent data show that the demand for educated workers has decreased, even though the supply of educated workers has increased (Beaudry, Green, & Sand, 2016). This suggests that education (as it is currently acquired in the US system) may no longer provide the full extent of training that is required to adequately prepare people for jobs that are low in computerizability. The natural question becomes, what kinds of skills are required by jobs that are low in computerizability?
Historically, manual and cognitive routine tasks were the only kinds of tasks susceptible to computerization, where a routine task is a task that can be defined and specified through a clear set of coded rules (Autor & Dorn, 2013). However, owing to advances in machine learning and the widespread availability of big data, non–routine manual and cognitive tasks are now also susceptible to computerization (Brynjolfsson & McAfee, 2011). For example, non–routine cognitive tasks are already being computerized in medicine and law. Oncologists at Memorial Sloan–Kettering Cancer Center are using IBM's Watson computer to provide cancer treatment diagnosis (Cohn, 2013), and sophisticated algorithms applied to big data are gradually taking over tasks regularly performed by paralegals (Markoff, 2011).
Although many non–routine tasks, both cognitive and manual, have become increasingly computerizable in the 21st century, several engineering bottlenecks still remain, and they pertain to three different categories (Frey & Osborne, 2013): perception and manipulation tasks (i.e. tasks that require finger dexterity, manual dexterity, and working in a cramped work space and awkward positions), creative intelligence tasks (i.e. tasks that require the creation of original and useful ideas), and social intelligence tasks (i.e. tasks that require a human connection and ‘common sense’, such as social perceptiveness, negotiation, persuasion, assisting, and caring for others). Thus, the probability of each job of being computerized over the next decades will partly depend on the extent to which the respective job requires workers to perform tasks that are part of these engineering bottlenecks. But who are the people who select (or are selected) into jobs that have a lower likelihood of being computerized? In other words, which combination of personality factors might be ideal for selection into occupations that are likely to dominate future labour markets? Understanding this could be key in creating future training programmes and new uses for human labour.
Personality factors relevant for occupational outcomes
The answer to the question ‘Which factors are most important in predicting occupational outcomes and selection over the lifespan?’ has traditionally varied across fields of research and individual researchers. Thus, some studies, especially within psychology, have focused on individual differences, especially on cognitive abilities (Gottfredson, 2002; Heckman, 2006; Kuncel, Hezlett, & Ones, 2004; Schmidt & Hunter, 2004); others, especially within sociology, have focused on demographic factors, such as parental socio–economic status (SES), age, race and gender (Bradley & Corwyn, 2002; Caro, Cortina, & Eccles, 2015; Heckman, Stixrud, & Urzua, 2006; Schnabel, Alfeld, Eccles, Köller, & Baumert, 2002); and others, especially within economics, have used more proximal predictors, such as educational attainment, to predict income and occupational prestige (e.g. Heckman, 2006). Despite recent attempts to bridge these different research traditions (Damian, Su, Shanahan, Trautwein, & Roberts, 2015; Shanahan, Bauldry, Roberts, Macmillan, & Russo, 2014; Spengler et al., 2015; Stoll et al., 2016), the vast majority of research remains fragmented and findings are generally siloed in their respective fields and sub–fields. As a result, there is very little integrative work available where multiple categories of individual difference predictors are systematically tested and evaluated with respect to their predictive validity on occupational selection and outcomes. Instead, each field and subfield of research tends to focus on one major category of predictors. Because one of the goals of this paper was to provide a systematic overview and test of the predictive validity of a broad array of individual differences on occupational selection (in particular, selection into less computerizable jobs), we needed an overarching theoretical framework to guide our research. We chose the neo–socioanalytic model of personality, which was developed to link the fields of personality and organizational behaviour (Roberts, 2006).
The neo–socioanalytic model proposes that personality consists of four ‘units of analysis’ or domains—traits, values and motives, abilities, and narratives—which are intended to subsume most categories of individual differences (Roberts & Wood, 2006). The trait domain refers to enduring patterns of thoughts, feelings, and behaviours that people exhibit. There are several trait taxonomies available, the most popular being the Big Five structure (i.e. Openness, Agreeableness, Conscientiousness, Neuroticism, and Extraversion). The values and motives domain refers to all things that people think desirable, that is, what they would like to do or what they would like to have. This category includes motives and needs, as well as values, vocational interests, preferences, and goals. Vocational interests, which is the motivational trait we will focus on in this paper, refers to the kinds of interests that people show early on with regard to types of preferred activities. The best–known taxonomy of interests is Holland's RIASEC taxonomy (Holland, 1959, 1997), which groups vocational interests into six broad categories, that is, realistic, investigative, artistic, social, enterprising and conventional. The abilities category includes general intelligence. The narratives category focuses on the devices people use to tell the stories they use to understand themselves and their environments (McAdams, 1993). Narratives include people's significant memories and life experiences that have been integrated in a self–defining framework.
According to the neo–socioanalytic model of personality (Roberts & Wood, 2006), the aforementioned four units of analysis are presumably interrelated and influenced by genetics. Furthermore, these four areas of personality are presumably reflected in identity (measured via self–reports) and reputations (measured via observer reports). In turn, identities and reputations shape people's life outcomes, including occupational outcomes. In sum, the neo–socioanalytic model provides us with a framework that is ideal for understanding the role of personality in occupational selection, where personality is understood as a broad collection of traits, motives, abilities and narratives. One of the model's main predictions is that each unit of analysis should show incremental validity in predicting important life outcomes over time. Thus, this model informed our a priori selection of the relevant personality predictors of occupational selection.
Extensive research across psychological areas has shown that each of the different personality units of analysis is highly relevant in predicting selection into social roles and occupational outcomes over the lifespan (Roberts, 2006). However, very little research has used predictors drawn from multiple personality units of analysis in the same study (but see Stoll et al., 2016), and no study to our knowledge has investigated predictors of selection into more (or less) computerizable jobs. Because in this study we focused on predictors pertaining to the first three categories of the neo–socioanalytic model (i.e. intelligence, personality traits and vocational interests), we review subsequently relevant research.
When predicting occupational outcomes at the individual level over the lifespan, most past research has focused on three core outcomes: educational attainment, income and occupational prestige. This research is informative to the present study because Frey and Osborne (2013) showed that jobs that have a higher likelihood of being computerized tend to pertain to lower income and occupational prestige categories, and to require lower levels of education. A job low in computerizability will additionally require skills that represent engineering bottlenecks for computerization (i.e. skills pertaining to perception and manipulation, creativity, and social intelligence). Thus, although education, prestige, and income are expected to be related to job computerizability (Frey & Osborne, 2013), job computerizability is a different construct worthy of investigation. To exemplify, consider that the job ranked the lowest in computerizability across all occupations is ‘recreational therapist’ (with a median wage of $45 890 in 2015 and a bachelor degree requirement for entry); because of the specific skills required in this job, it was ranked considerably lower in risk of computerization than other jobs that are higher in educational requirements, wages and prestige, such as ‘psychologist’, which was ranked 17th, or ‘dentist’, which was ranked 19th (Frey & Osborne, 2013). However, given the lack of previous research on the personality predictors of job computerizability, we will review later research pertaining to related occupational outcomes, such as education, income, and prestige.
Meta–analytic findings (Roberts, Kuncel, Shiner, Caspi, & Goldberg, 2007), as well as recent large longitudinal studies on representative samples from the USA and Europe (Damian et al., 2015; Spengler et al., 2015), have shown quite robustly that parental SES predicts better future work outcomes, and that intelligence and personality traits (high maturity and extraversion) added incremental validity in predicting better work outcomes. Furthermore, Su (2012) showed that vocational interests added incremental validity above and beyond personality traits, in predicting work outcomes 11 years later. Specifically, Su (2012) found that an interest in things and people was detrimental to educational attainment, income, and occupational prestige, whereas interests in arts, sciences, business, and leadership were favourable. More recently, Stoll et al. (2016) replicated some of these findings on a German sample, showing that vocational interests had incremental validity in predicting occupational outcomes over the lifespan.
Thus, when predicting occupational outcomes such as educational attainment, income, and occupational prestige, past research has found individual differences in intelligence, personality traits, and vocational interests to show incremental validity over and above background factors. Because the aforementioned occupational outcomes have been found to relate to job computerizability (Frey & Osborne, 2013), we hypothesized that personality factors (i.e. personality traits, intelligence, and vocational interests) should show incremental validity (over and above social background factors) in predicting job computerizability over the lifespan (we refer to this as the ‘additive’ model). Furthermore, because educational attainment has been found to relate to job computerizability (Frey & Osborne, 2013), and because educational attainment has been previously shown to mediate the link between background and personality predictors on occupational outcomes (e.g. Heckman, 2006; Spengler et al., 2015), we also tested a mediation model, where we predicted that educational attainment would mediate some of the effects on job computerizability (we refer to this as the ‘transactional’ model).
Present study
The present study used a large representative longitudinal data set (N = 346 660) to test the prospective role of background factors and individual differences on selection into more (or less) computerizable jobs over the lifespan. The study had three measurement points. At baseline, when all the predictor variables were collected, the participants were in high school. Using the baseline measurements, we predicted job computerizability 11 and 50 years later. To select relevant baseline predictors, we used past research and theory from sociology, economics, and psychology and took an integrative approach. Thus, we identified several relevant categories of predictors: social background, including parental SES, gender, age, and race; cognitive abilities (i.e. intelligence); personality traits; and vocational interests. Although we are not aware of any past research that has investigated the role of these categories of predictors on job computerizability, past research has investigated the role of these predictors on other occupational outcomes (i.e. educational attainment, income, and occupational prestige), which have been associated with low job computerizability (Frey & Osborne, 2013). Thus, we made the following predictions. First, in line with sociological and economic theories (e.g. Heckman, 2006; Shanahan et al., 2014), as well as with the fact that jobs low in computerizability are likely to be highly cognitive non–routine jobs (Frey & Osborne, 2013), we expected that higher levels of parental SES and intelligence would be related to lower job computerizability over the lifespan. Second, given past research on occupational outcomes (e.g. Damian et al., 2015; Stoll et al., 2016), we expected that personality traits and vocational interests would prospectively predict job computerizability, over and above background factors and intelligence. Third, in line with past research and theory (e.g. Heckman, 2006; Spengler et al., 2015), we expected that educational attainment would mediate some of the links between background factors, individual differences and job computerizability, although we had no explicit expectations about the significance of the direct and indirect paths, given the lack of previous research on job computerizability.
In sum, the present study is novel in several ways: (i) it is the first study to look at predictors of job computerizability; (ii) it uses a wide array of predictors, consistent with theories from psychology, sociology, and economics; and (iii) it tests the additive model, as well as the transactional model, with mediation via educational attainment. The present study also has several methodological benefits that ensure replicability and the robustness of the results: (i) we used a longitudinal design; (ii) we used a large representative sample; and (iii) we used three waves of data (baseline, 11th–year follow–up, and 50th–year follow–up), which allowed us to conduct an internal replication and test the robustness of the effects over the entire lifespan. In addition to testing the robustness of our effects, the internal replication (i.e. comparing the results at the 11th–year follow–up with those at the 50th–year follow–up) can also help disentangle competing hypotheses regarding the stability of the effects over the lifespan. For example, it is possible that effects are over–estimated over shorter timespans, because longer timespans allow for the accumulation of more ‘error’, in which case, we should find smaller effects at the 50th–year follow–up than at the 11th–year follow–up. On the other hand, it is possible that the effects are under–estimated over shorter timespans, because longer timespans allow for a deepening of certain effects (e.g. if you obtain a job that requires social skills, you practice interacting with people, and you become better at it over time, which then allows you to advance to a higher position that requires even more social skill), in which case we should find larger effects at the 50th–year follow–up than at the 11th–year follow–up. Finally, because the outcome variable is measured in a meaningful raw metric, that is, the probability of each job of being computerized, the results can easily be interpreted in this raw metric for the sake of better understanding individual–level average effects, as well as potential population–level effects.
Methods
Participants
The data came from Project Talent (Wise, McLaughlin, & Steel, 1979), a longitudinal study that started in 1960 with a 5% representative sample of America's high school students. Over 440 000 students in grades 9 through 12, coming from 1300 schools, participated, of which 377 016 cases are now available (346 660 of which were coded as ‘credible’ and thus used in all our analyses, as described in the Data Analysis section), which make up one of the largest nationally representative samples currently available. Several follow–up studies were conducted: 1st, 5th, 11th, and 50th years after the original assessment. In the present study, we used data from the original survey (Baseline), from the 11th–year follow–up (Year 11), and from the 50th–year follow–up (Year 50) to test the role of demographics, personality traits, intelligence, and vocational interests on later selection into more (or less) computerizable jobs (we only looked at the last two follow–ups because they were the only ones where most participants were old enough to have jobs). The response rate for the 11th–year follow–up was about 22% (N = 85 342, out of which 81 912 were coded as credible and therefore used in our analyses). Participants in the 50th–year follow–up were selected using the following procedures. First, a pilot subsample of 4879 participants was randomly selected from a 10% random subsample of the schools that were originally surveyed. Next, using a wide variety of tracking methods (Stone, Scott, Battle, & Maher, 2014), the project team managed to locate 84.8% of the random pilot subsample: 15.5% were deceased, 50.3% were located with an address and verified and 19% were located with an address and not verified. Survey materials were mailed to the presumably surviving subjects whose address had been identified (i.e. 3462 people). Of these, about 56% responded to the survey and were included in the final data set of the 50th–year follow–up (N = 1952, out of which 1858 were coded as credible and therefore used in our analyses).
The participant demographics across the three waves used were as follows: (i) the gender distribution was stable across the three time points, with 52% women; (ii) the race/ethnicity distribution was also fairly similar across waves with 95.5% Whites/Caucasians at baseline, 96.8% Whites/Caucasians at the 11th–year follow–up, and 95.3% at the 50th–year follow–up; and (iii) the ages were on average 16 years old at baseline (with participants ranging from 9th to 12th grades), 27 years old at the 11th–year follow–up, and 67 years old at the 50th–year follow–up.
These data are publicly accessible, and they belong to the American Institutes for Research (AIR). Although we are prevented from sharing these data ourselves owing to contractual obligations, information on how to obtain the Project Talent data files is available on the AIR website (http://www.air.org/).
Measures
The original survey (Baseline) recorded the students’ demographics (parental SES, age cohort, race, and gender), personality traits, cognitive abilities, and vocational interests. The 11th–year follow–up (Year 11) recorded educational attainment and job titles. The 50th–year follow–up (Year 50) recorded job titles. Later, we describe each of the measures used in the present study, the original coding procedures and the transformations we performed. Descriptive statistics and inter–correlations among all the variables in the study can be found in Table 1.
Descriptive statistics and inter–correlations between all the variables in the study
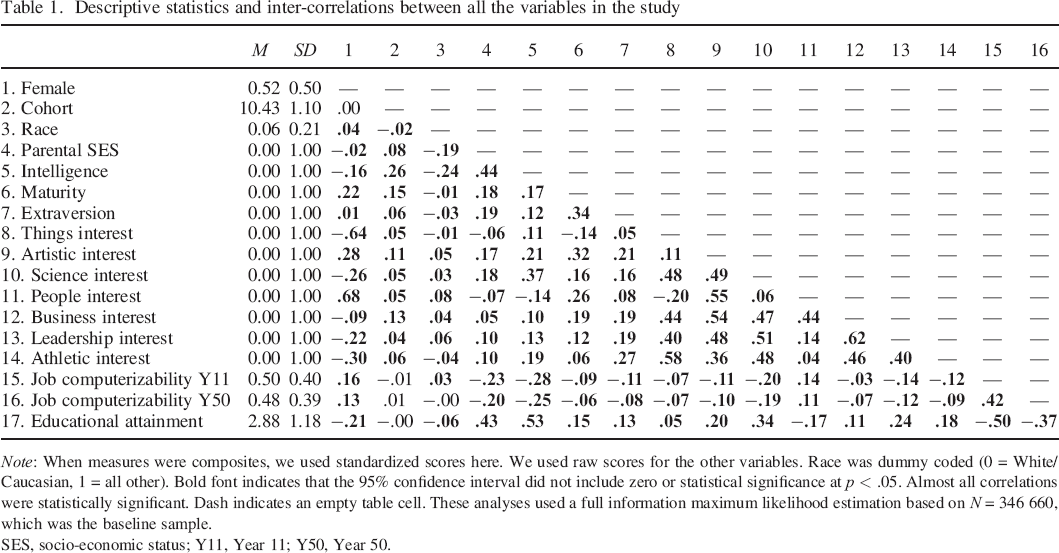
Note: When measures were composites, we used standardized scores here. We used raw scores for the other variables. Race was dummy coded (0 = White/Caucasian, 1 = all other). Bold font indicates that the 95% confidence interval did not include zero or statistical significance at p < .05. Almost all correlations were statistically significant. Dash indicates an empty table cell. These analyses used a full information maximum likelihood estimation based on N = 346 660, which was the baseline sample.
SES, socio–economic status; Y11, Year 11; Y50, Year 50.
Demographic measures (baseline)
Four demographic measures were included in the analyses as there are well–documented effects of these variables on occupational outcomes, so we expected them to be relevant to the selection into more (or less) computerizable jobs: gender, age cohort, parental SES, and race/ethnicity. Gender was coded as male = 0, female = 1. For parental SES, we used the original composite (Wise et al., 1979), which included answers to nine questions regarding home value, family income, number of books in the house, number of appliances, access to media, availability of a private room for the child, father's job status, father's education, and mother's education (α = .69). These are all frequently used indicators of SES in the family of origin (Galobardes, Shaw, Lawlor, Lynch, & Smith, 2006). Age cohort represents the grade (9th, 10th, 11th, or 12th) that participants were in at the original survey. It was coded as a numeric variable ranging from 9 to 12, with a larger number standing for an older cohort. Cohort was an important variable because all participants took the same tests at baseline even though they belonged to different age groups; thus, cognitive ability test scores for instance vary quite a bit, with the older students scoring better. Race/ethnicity was coded using a 1 to 9 scale (the original labels were 1 = White/Caucasian, 2 = Black/African–American, 3 = Asian American, 4 = Native American, 5 = Mexican–American, 6 = Puerto Rican–American, 7 = Eskimo, 8 = Cuban, 9 = Unknown). Because the numbers in each of the non–Caucasian racial categories were very low, we recoded race into a dummy variable where 0 was ‘White/Caucasian’ and 1 was ‘Other’.
Cognitive ability (baseline)
Project Talent contains a set of scales that represent different content domains of cognitive abilities, including verbal, quantitative, and visualization and spatial abilities. Following past research (e.g. Wai, Lubinski, & Benbow, 2009) and the radex model of cognitive ability, which organizes ability in three subdomains—verbal, mathematical, and spatial—Su (2012) developed composite measures for these three abilities (also Damian et al., 2015).
The verbal ability composite (α = .88) consists of three scales: Vocabulary, English Composite, and Reading Comprehension. The math ability composite (α = .87) consists of four scales: Mathematics Information, Arithmetic Reasoning, Introductory Mathematics, and Advanced Mathematics. The spatial ability composite (α = .80) consists of four scales: Two–Dimensional Spatial Visualization, Three–Dimensional Spatial Visualization, Mechanical Reasoning and Abstract Reasoning. Inter–correlations among the ability composite measures were .63, .60, and .73 for math–spatial, verbal–spatial, and math–verbal, respectively.
To reduce multicollinearity in our analyses, we computed an overall cognitive ability index, which was used for all the analyses, and which was obtained by averaging the standardized scores of the three indices (verbal, math, and spatial).
Personality traits (baseline)
The Project Talent Personality Inventory (PTPI) included 150 items from which 10 different scale composites were scored and recorded. The Vigour scale measures the physical activity level of a person. The Calmness scale measures the ability to react to emotional situations in an appropriate manner without extreme emotions. The Mature Personality scale measures the ability to get work done efficiently and to accept assigned responsibility. The Impulsiveness scale measures the tendency to make quick decisions without full consideration of the outcomes. The Self–Confidence scale measures one's feelings of social acceptability and the willingness to act and think independently. The Culture scale measures the tendency to recognize the value of aesthetic things, and to display refinement and good taste. The Sociability scale measures the tendency to enjoy being with people. The Leadership scale measures activities such as taking charge and seeking out responsibilities. The Social Sensitivity scale measures the propensity to put oneself in another's place. Finally, the Tidiness scale measures the desire for order and neatness in one's environment. For each item, participants rated how well the item described them on a 5–point scale (‘extremely well’ to ‘not very well’). The full list of items, as well as instructions for scale construction, can be found in Table S10 (see Supporting Information). Item–level data are unfortunately not available to researchers today for the entire sample (only for 4% of the sample), which is why we relied on the scale scores computed by the Project Talent staff.
In previous work on independent participant samples of a similar age (Pozzebon et al., 2013), we established the validity and reliability of the 10 PTPI scales, and we identified how the 10 PTPI scales relate to modern Big Five inventories (e.g. John, Donahue, & Kentle, 1991). Thus, Self–Confidence (α = .78) and Calmness (α = .87) are most reflective of Emotional Stability; Sociability (α = .83), Vigour (α = .86), and Leadership (α = .79) are most reflective of Extraversion; Culture (α = .81) is best reflective of Openness; Social Sensitivity (α = .85) reflects Agreeableness; and Mature Personality (α = .93), Impulsiveness (α = .72; reverse scored), and Tidiness (α = .86) reflect Conscientiousness (for reliabilities and construct validation, see Pozzebon et al., 2013).
Because the 10 PTPI scales, as well as the Big Five composites derived from the 10 PTPI scales, are highly inter–correlated (Damian et al., 2015; Damian & Roberts, 2015), which would increase multicollinearity in our analyses, in the present study, we used the higher–order factors of the 10 PTPI scales. We factor analysed the 10 scales using principal axis factoring with a varimax rotation, and we obtained two factors: maturity (which is essentially a conscientiousness factor, with the highest factor loadings for tidiness, mature personality, culture, social sensitivity, and calmness) and extraversion (with the highest loadings for vigour, sociability, and leadership). We used the resulting factor scores (computed with the regression method) throughout the analyses presented in this paper. Because we used the factor residuals, instead of computing two new scales, we cannot provide reliability coefficients. The full results of the factor analysis can be found in Table S7 (see Supporting Information). To further validate these two higher–order factors, we used publicly available data from the PTPI validation study by Pozzebon et al. (2013). The data we used to validate the two factors consisted of an independent sample of about 1000 people who were matched in demographics with the original Project Talent sample. We computed the 10 PTPI scale scores in the same way in which the Project Talent staff computed the original scale scores, and we factor analysed the 10 PTPI scale scores using the same procedure we used in the original data. The factor structure found in the validation study can be found in Table S8 (see Supporting Information), and it mapped very well onto the factor structure found in the Project Talent data. In addition to the PTPI measure, the validation study also included three different measures of the Big Five personality traits: the Midlife Development in the United States Personality Scale (Rossi, 2001), the International Personality Item Pool ‘version’ of the Revised NEO Personality Inventory (Costa & McCrae, 1992; Goldberg et al., 2006), and the Big Five Inventory (John et al., 1991). As in the Project Talent data, we computed factor residuals (using the regression method), and we correlated them with the Big Five measures to establish convergent and discriminant validity. As can be seen in Table S9, the Maturity factor was most highly correlated with Conscientiousness, whereas the Extraversion factor was most highly correlated with Extraversion across the three different measures of the Big Five. Thus, the two factors showed good convergent and discriminant validity, in an independent sample, so we used the two–factor residuals computed in the Project Talent sample (Maturity and Extraversion) throughout the analyses presented in this paper.
Vocational interests (baseline)
The Project Talent original survey included an extensive interest inventory that consisted of 205 items that were split into two. The first part included 122 items that spanned across a wide range of occupations (e.g. lawyer, nurse, and shoemaker) and asked participants to rate how much they would like that kind of work, on a 5–point scale ranging from 1 (dislike very much) to 5 (like very much). The second part included 83 items that spanned across a wide range of activities (e.g. teach children, invest money, and solve puzzles) and asked participants to rate how much they would like each of these activities, using the same 5–point scale. The full list of items can be found Table S11. 1 In previous research, Su (2012) factor analysed these items and concluded that a seven–factor solution was most representative of the Project Talent interest inventory and most consistent with previous research. The seven interest factors identified by Su (2012) were as follows: (i) things (i.e. interests in working with things or tools or in the outdoors); (ii) arts (i.e. interests in creative expression, including fine and performing arts); (iii) science (i.e. interests in sciences and research, including natural sciences, medical sciences, and mathematics); (iv) people (i.e. interests in serving and helping people); (v) business (i.e. interests in business activities, including business management, sales, finances, and accountancy); (vi) leadership (i.e. interests in leadership positions in the government or other public sector bodies); and (vii) athletic (i.e. interests in various sports, such as baseball, track, swimming, and fishing). To obtain overall indices of the participants’ self–reported interests within each of the seven interest factors identified, Su (2012) created mean scores for each factor, using all the items that loaded on that factor and that had loadings than .40 and cross–loadings smaller than .35. For the present paper, we used the resulting interest scores reflecting overall interests on each of the seven factors (things, arts, science, people, business, leadership, and athletic). These factors map on quite well onto Holland's RIASEC taxonomy (Holland, 1959, 1997), which groups vocational interests into six broad categories, that is, realistic (similar to interests in things and athletics), investigative (similar to science interests), artistic, social (similar to people interests), enterprising (similar to business and leadership interests), and conventional (no correspondence).
Educational attainment (Year 11)
At the 11th–year follow–up (Year 11), participants answered several questions regarding their educational pursuits and outcomes, based on which the Project Talent staff coded an ‘amount of education’ variable, using a 12–point scale. Thus, in the original coding, scores 0 through 4 referred to high school dropouts (each happening in a different grade from 8 to 12, respectively); scores 5 and 6 referred to high school graduates who had no post–high school education or some post–high school education, but no college; score 7 referred to high school graduates who had some college experience, but no college degree; scores 8 and 9 referred to college graduates who had no further grad school experience, or some grad school experience, but no graduate degree; scores 10 and 11 referred to master's graduate who had no further graduate education or some graduate education, but no further degree beyond the master's; and finally, score 12 referred to holders of doctoral or law degrees. As can be seen from this original coding, the amount of education scale was not well balanced, and it was biased towards high school dropouts. To address this issue, we recoded the amount of education variable as follows. Scores 0–4 became 1 (high school dropout), scores 5–6 became 2 (high school graduate, no college), score 7 became 3 (high school graduate, some college), scores 8–9 became 4 (college degree), scores 10–11 became 5 (master's degree), and score 12 became 6 (PhD). Using this new coding scale, the mean of amount of education in the sample (N = 346 660) was 2.88, with a standard deviation of 1.18, which means that the average person in the sample, at Year 11 (i.e. 11 years after being first surveyed in high school), had graduated high school and may have had some college experience, but no college degree. This new scale also implies that, on average, the distance between each scale unit translates into about 2 years of education. 2
Job computerizability (Year 11)
To measure job computerizability at Year 11, we used the participants’ self–reported job titles at the 11th–year follow–up. The job titles were collected using a free response format. Next, trained raters assigned Occupational Information Network (O*NET) codes to the written job titles using the publicly available online database: http://www.onetonline.org/. The O*NET is a comprehensive system for collecting, organizing, and describing data on occupational characteristics and worker attributes developed by the US Department of Labor, and it is currently the primary source of job information in the USA (Peterson, Mumford, Borman, Jeanneret, & Fleishman, 1999; Peterson et al., 2001). The O*NET project team consisted of government–contracted consulting firms and representatives from the Department of Labor. They collected comprehensive job analysis information from thousands of incumbents using a generic taxonomy. The taxonomy included assessments of occupation–specific worker characteristics, requirements, and experience (Peterson et al., 1999; Peterson et al., 2001). Thus, extensive information is now available for about 925 jobs, and the publicly available database includes job titles, synonym titles, and associated O*NET codes, which can then be used to match specific job titles with their coded characteristics. It was essential for us to re–code the self–reported job titles in our data into O*NET codes, because the O*NET database contains several key measures that were used to obtain job computerizability scores (Frey & Osborne, 2013).
In the first phase of transforming self–reported job titles into O*NET codes, two trained raters independently assigned an O*NET code to each written job title by using the search tool available in the online database. Agreement reached 64% in this phase, meaning that the two independent raters assigned the exact same O*NET code for 64% of the written job titles, which is impressive given that each code for each job had to be selected out of 925 options, some of which were very similar to each other. Next, the two raters met and resolved their disagreements through discussion (most disagreements were very minor, where the two O*NET codes initially selected were very similar to each other and often interchangeable, because they indicated jobs from the same occupational category). Upon discussion, the two raters agreed on 94% of the assigned O*NET codes. Finally, two new independent raters read through the remaining 6% of job titles and resolved any remaining disagreements.
In the second phase, using the O*NET codes, we matched each job title available in the Project Talent data with a previously validated measure of job computerizability (Frey & Osborne, 2013). 3 To obtain and validate job computerizability scores for each O*NET job title (i.e. to calculate the probability of any given job of being computerized), Frey and Osborne (2013) used two strategies. First, a team of expert economists and machine–learning scientists subjectively hand labelled a subset of the occupations with a 0 if they were not automatable and a 1 if they were automatable; these subjective ratings were only assigned where the experts were highly certain of the label and they were based on the variety of tasks each job involved (as described in the extensive O*NET description available in the database for each job). Second, Frey and Osborne (2013) used a more objective ranking of the jobs based on the mix of knowledge, skills, and abilities that each job required. Specifically, each O*NET job had been previously rated (on 7–point scales) by experts and workers on numerous occupation–specific requirements. The O*NET database consists of hundreds of such measurements, which are publicly available and widely used in research (e.g. Crouter, Lanza, Pirretti, Goodman, & Neebe, 2006; Johnson & Allen, 2013). The nine criteria that were used by Frey and Osborne (2013) to rank the jobs on computerizability were selected based on the corresponding bottlenecks to computerization, as defined by extensive theory from economics, robotics, and machine learning (e.g. Jensen, Kletzer, Bernstein, & Feenstra, 2005). Given the state of technological advancement in 2013, when the scores were computed, the nine bottlenecks (i.e. measures where computers could not perform very well and were unlikely to perform well in the near future) were as follows: finger dexterity, manual dexterity, cramped work space and awkward positions, originality, fine arts, social perceptiveness, negotiation, persuasion, assisting, and caring for others. An overall score was computed for each job. Although both the aforementioned methods used for obtaining job computerizability scores had been previously validated (Blinder, 2009; Jensen & Kletzer, 2010; Jensen et al., 2005), they each had advantages and disadvantages. Thus, Frey and Osborne (2013) used a probabilistic classification algorithm to cross–validate their methods and obtain final job computerizability scores, based on both methods. We used the latter in the present research, so each job computerizability score represented the probability (0 to 1) of each job of being completely automatized (i.e. taken over by a computer). 4
Job computerizability (Year 50)
To measure job computerizability at Year 50, we used the participants’ self–reported job titles at the 50th–year follow–up, and the same procedures used at Year 11. 5 In the first phase, two trained raters independently assigned an O*NET code to each written job title by using the search tool available in the online database. Agreement reached 60% in this phase, meaning that the two independent raters assigned the exact same O*NET code for 60% of the written job titles. Next, the two raters met and resolved their disagreements through discussion, reaching agreement on 97% of the assigned O*NET codes. Finally, two new independent raters read through the remaining 3% of job titles and resolved any remaining disagreements. In the second phase, using the O*NET codes, we matched each job title reported by the participants with a previously validated measure of job computerizability (Frey & Osborne, 2013), the same measure used at Year 11.
Data analysis
Participants were excluded prior to all analyses based on response credibility. Specifically, we only analysed cases that were coded as credible on the original response credibility index (Wise et al., 1979). This credibility index was computed based on a Screening scale, which included questions such as ‘How many days are in a week?’ that should have been answered easily by anyone who did not suffer from a reading problem, a clerical problem in recording answers, general slowness, or a lack of cooperation. Out of the 377 016 cases available at baseline, 346 660 cases were coded as credible and thus used across all our analyses. Owing to the longitudinal design of this study and the long timespans covered, we had missing data at both subsequent waves. To better understand how participants who stayed in the study at each wave differed from the participants who dropped out, we conducted several attrition analyses, which we present in Tables S1 and S2 which can be found in the Supporting Information. We present the results of these analyses in the next section. Because participants who stayed in the study differed systematically from participants who dropped out, we dealt with missing data in two different ways. First, in all of our subsequent analyses, we used the full information maximum likelihood (FIML) approach (maximum likelihood estimation with robust standard errors) to obtain parameter estimates and standard errors that accounted for the missing data (and that were also robust to the non–normality of the data). In this approach, all the model covariates were used to predict the missing data. The FIML procedure has been shown to handle missing data in a computationally efficient way and to be superior to traditional strategies (e.g. listwise deletion; Enders, 2010; Enders & Bandalos, 2001). All analyses presented in the results section were conducted using version 6 of
To provide a full picture of the links between individual differences and job computerizability over the lifespan, we specified several sets of regression models (three sets at each wave) and two saturated path models that included mediation via educational attainment (one at each wave). In the hierarchical multiple regression models, we tested the incremental validity of personality traits and vocational interests on job computerizability at Year 11 and Year 50, respectively. Thus, Model Set A included the following predictors measured at baseline: demographic variables, parental SES, and intelligence. Model Set B added personality trait predictors measured at baseline (over and above the Model Set A predictors), and Model Set C added vocational interest predictors measured at baseline (over and above Model Set B predictors). The outcome variables across models were job computerizability measured at Year 11 and at Year 50, respectively. In sum, these regression models, which can be found in Table 2, present average individual–level independent effects of the predictor variables on the outcome, where the outcome represents the probability of each job of being computerized (i.e. job computerizability).
Regression analyses predicting job computerizability 11 and 50 years later
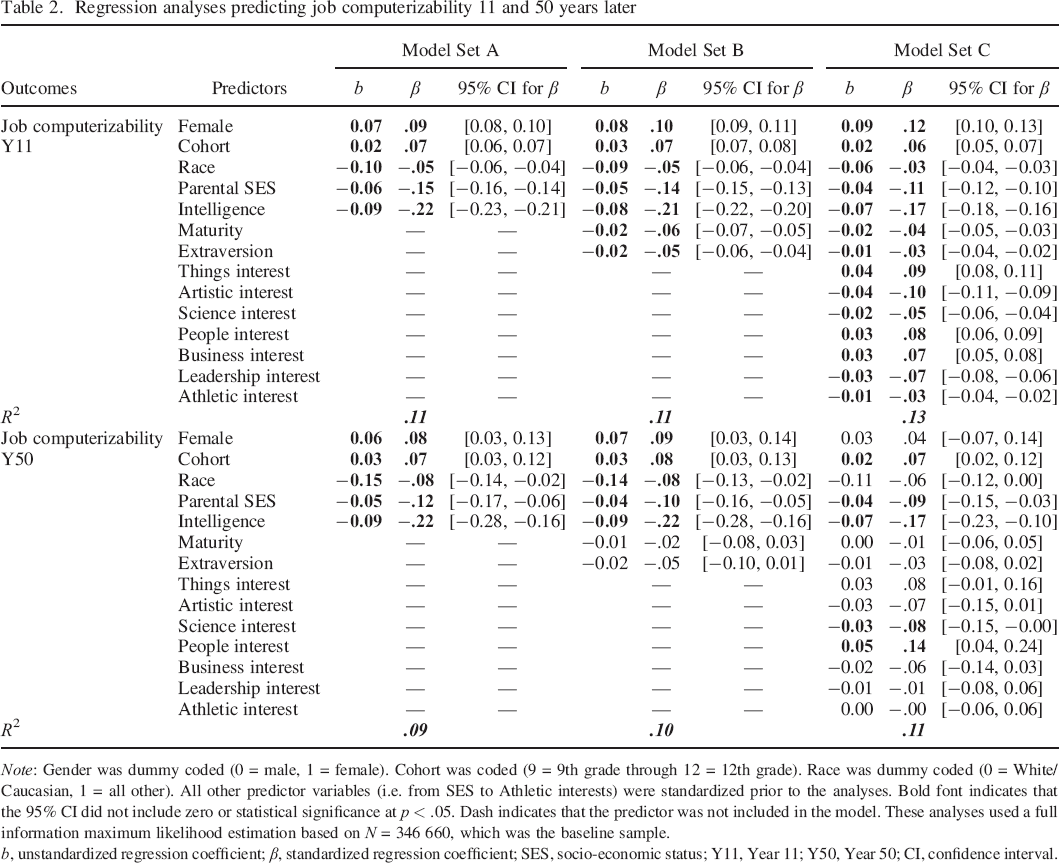
Note: Gender was dummy coded (0 = male, 1 = female). Cohort was coded (9 = 9th grade through 12 = 12th grade). Race was dummy coded (0 = White/Caucasian, 1 = all other). All other predictor variables (i.e. from SES to Athletic interests) were standardized prior to the analyses. Bold font indicates that the 95% CI did not include zero or statistical significance at p < .05. Dash indicates that the predictor was not included in the model. These analyses used a full information maximum likelihood estimation based on N = 346 660, which was the baseline sample.
b, unstandardized regression coefficient; β, standardized regression coefficient; SES, socio–economic status; Y11, Year 11; Y50, Year 50; CI, confidence interval.
Next, we estimated two path models that included all the baseline predictors from the regression analyses (i.e. the predictor variables included in regression Model Set C) and job computerizability at Year 11 and at Year 50 as main outcome variables of interest, respectively. In addition, we specified years of education measured at Year 11 as a mediator between all other predictors and job computerizability at Year 11 and at Year 50, respectively, to test whether educational attainment mediated the effects of our predictors on selection into more (or less) computerizable jobs over the lifespan. In these path models, every predictor was allowed to have both a direct path and an indirect path (via years of education at Year 11) to the outcome variables (i.e. job computerizability at Year 11 and Year 50). To evaluate the direct and indirect effects of the predictors, we ran a mediation (path) analysis. In such a model, the total effect of a predictor variable on an outcome variable can be decomposed into a direct effect and an indirect effect or mediated effect. The latter effect represents an effect that is transmitted via the mediator. We computed bias–corrected bootstrap confidence intervals (CIs) for the model parameter estimates to assess the significance of the direct, indirect, and total effects of the predictors on the outcomes. This method accounts for the expected non–normality of the sampling distribution of the mediation effect (MacKinnon, Lockwood, Hoffman, West, & Sheets, 2002). In addition, we computed the proportion of the total effect of the predictors that were mediated by educational attainment as a measure of effect size (cf. Kelley & Preacher, 2012).
All the data analysis scripts necessary to reproduce these results are openly available at the following address: https://osf.io/a6m2g/. Furthermore, all the output files can be found at the same address in case the reader is interested in exact p–values for each of our effects, in addition to the effect sizes and 95% CIs that we report in this paper.
Results
Attrition analyses
In the attrition analyses, we tested mean–level differences in all the variables measured at baseline between participants who dropped out and those who stayed in the study at the Year 11 and Year 50, respectively.
The first set of attrition analyses (Table S1) was based on actual study participation at each wave, regardless of whether the participants had occupational data available (which was our outcome of interest). The second set of attrition analyses (Table S2) was based on whether participants had occupational data available at follow–ups or not. We considered that the latter set of attrition analyses was necessary, because those were the participants who were available for analyses when using listwise deletion to deal with missing data. The first set of attrition analyses (Table S1) showed that participants who stayed in the study at the two follow–ups had similar gender and race distributions to those who dropped out but differed on some baseline variables; specifically, at the Year 11, participants who stayed (vs. those who dropped) were older, higher on parental SES, more intelligent, more mature, and more interested in science (r = .10–.34); at the Year 50, participants who stayed (vs. those who dropped) were higher in intelligence (r = .22). All other attrition effects were smaller than an r of .10.
The second set of attrition analyses (Table S2), which was based on the availability of occupational outcomes at the follow–ups, showed that participants who stayed in the study and had occupational outcomes available at the two follow–ups were similar in race distribution to those who dropped out but differed on some baseline variables. Specifically, at the Year 11, there were fewer women available in the sample (35.2%), which is not surprising given the historical context (i.e. many young women did not have jobs in the seventies). In line with historical trends of women joining the labour force, this problem is remedied by Year 50, where 50% of the sample that participated and had occupational outcomes available consisted of women. Furthermore, at Year 11, participants who stayed and had job outcome data available (vs. those who dropped) were higher in parental SES, more intelligent, and more interested in things, science, people, leadership, and athletics (r = .11–.36); at the Year 50, participants who stayed and had job outcome data available (vs. those who dropped) were higher in intelligence and science interests (r = .10–.19). All other attrition effects were smaller than an r of .10. 6 As described earlier, we dealt with missing data by using FIML estimation, and we checked the robustness of our effects by re–running all the analyses using listwise deletion. There were no meaningful differences between the two procedures, so we present subsequently the results using FIML estimation (listwise deletion results can be found in our Supporting Information; see Tables S3 through S6, which correspond to Tables 4, respectively).
Inter–correlations
Table 1 shows the means, standard deviations, and correlations of all the variables included in this study. We observed that individual differences in intelligence, personality traits, and vocational interests measured at baseline were significantly related to job computerizability 11 and 50 years later, and these links were stable across time. Specifically, a higher level of intelligence in adolescence was related to selection into less computerizable jobs 11 and 50 years later (r = −.28 and r = −.25, respectively). Similarly, higher levels of maturity and extraversion at baseline were related to lower job computerizability 11 and 50 years later (for maturity, r = −.09 and r = −.06, respectively; and for extraversion, r = −.11 and r = −.08, respectively). Higher levels of interests in things, arts, science, business, leadership, and athleticism, and lower levels of interests in people, were also related to lower levels of job computerizability later, and the effects were consistent across 11 and 50 years. These correlations suggest that individual differences in intelligence, personality traits, and interests may be important predictors for selection into more (or less) computerizable jobs over the lifespan. However, because many of these predictors were inter–correlated, as can be seen in Table 1, we wanted to establish their incremental validity (or independent effects) in predicting job computerizability. Furthermore, demographic factors also appeared to be related to job computerizability; that is, women (r = .16 to .13), racial minorities (r = .03 to .00; note that only the first effect, Year 11, is statistically significant here) and people with a lower parental SES (r = −.23 to −.20) tended to select (or be selected) into more computerizable jobs. Thus, it became apparent that these demographic factors needed to be controlled for in the prediction equations. These results led us to the next step of our analyses, in which we conducted hierarchical multiple regressions where demographic factors and individual differences predicted job computerizability at Year 11 and Year 50. Table 1 also shows that all the baseline measurements were related to educational attainment 11 years later, and educational attainment was related to job computerizability both concurrently (r = −.50) and prospectively (r = −.37), where more education was related to selection into jobs with a lower likelihood of being computerized. These findings set the stage for the third step of our analyses, in which we conducted path analyses, where educational attainment measured at Year 11 was the mediator of the links between baseline predictors and job computerizability outcomes 11 and 50 years later.
Prospective effects of personality on job computerizability
Table 2 presents the results from several hierarchical multiple regression analyses. Across the analyses, all the predictors were measured at baseline, whereas the outcome (i.e. job computerizability) was measured either 11 years later or 50 years later. To test the incremental validity of individual differences over background factors in predicting job computerizability, we conducted three sets of models. In Model Sets A, we included demographic predictors, parental SES, and intelligence, because these are the constructs that economic models would predict to be essential for selection into more (or less) computerizable jobs, given that these jobs are likely to be primarily highly cognitive non–routine jobs (Frey & Osborne, 2013). As can be seen from Table 2, the effects replicated across waves (Year 11 and Year 50) and the effect sizes were stable across time. Specifically, the analyses showed that being a woman (β = .09, 95% CI [0.08, 0.10] at Year 11; β = .08, 95% CI [0.03, 0.13] at Year 50) and being from an older cohort (β = .07, 95% CI [0.06, 0.07] at Year 11; β = .07, 95% CI [0.03, 0.12] at Year 50) was associated with selection into more computerizable jobs. In contrast, being from a higher SES family (β = −.15, 95% CI [−0.16, −0.14] at Year 11; β = −.12, 95% CI [−0.17, −0.06] at Year 50) and being more intelligent (β = −.22, 95% CI [−0.23, −0.21] at Year 11; β = −.22, 95% CI [−0.28, −0.16] at Year 50) were associated with selection into less computerizable jobs. Interestingly, being racially diverse was also associated with entering less computerizable jobs (β = −.05, 95% CI [−0.06, −0.04] at Year 11; β = −.08, 95% CI [−0.14, −0.02] at Year 50), which was not the case in the correlation analyses (Table 1), and which suggests that diversity might provide a benefit, but only when socio–economic background is held constant. 7 Notably all these effects were independent of each other and statistically significant.
In Model Sets B, we tested the incremental validity of personality traits (maturity and extraversion) over and above demographics, parental SES, and intelligence in predicting job computerizability 11 and 50 years later. As shown in Table 2, being more mature and more extraverted during adolescence predicted selection into less computerizable jobs 11 years later (β = −.06, 95% CI [−0.07, −0.05] and β = −.05, 95% CI [−0.06, −0.04], respectively), regardless of one's background or intelligence, and these effects were statistically significant. The effects found at Year 50 were consistent with those found at Year 11 (β = −.02, 95% CI [−0.08, 0.03] and β = −.05, 95% CI [−0.10, 0.01], respectively), with the effect size for extraversion being equal to that found at Year 11, but the estimates at Year 50 were measured with a lower precision (as can be seen from the wider CIs), because of the smaller sample size, and they were not statistically significant.
In Model Sets C, we tested the incremental validity of vocational interests (i.e. things, artistic, science, people, business, leadership, and athletic) over and above demographics, parental SES, intelligence, and personality traits in predicting job computerizability 11 and 50 years later. As shown in Table 2, being more interested in things, people, and business during adolescence predicted selection into more computerizable jobs 11 years later, whereas being more interested in arts, science, leadership, and athletics predicted selection into less computerizable jobs 11 years later. Most of these effects replicated at Year 50. Specifically, an interest in things (β = .09, 95% CI [0.08, 0.10] at Year 11; β = .08, 95% CI [−0.01, 0.16] at Year 50) and people (β = .08, 95% CI [0.06, 0.09] at Year 11; β = .14, 95% CI [0.04, 0.24] at Year 50) consistently predicted selection into more computerizable jobs across waves, whereas an interest in arts (β = −.10, 95% CI [−0.11, −0.09] at Year 11; β = −.07, 95% CI [−0.15, 0.01] at Year 50) and science (β = −.05, 95% CI [−0.06, −0.04] at Year 11; β = −.08, 95% CI [−0.15, −0.00] at Year 50) consistently predicted selection into less computerizable jobs. However, despite similar effect sizes, owing to the less precise estimation available at Year 50, only the effects of scientific and people interests on job computerizability were statistically significant at Year 50.
In sum, Model Sets A showed that social background factors and intelligence predict occupational selection, whereas Model Sets B and C demonstrated that personality traits and vocational interests showed incremental validity over and above demographics, SES, and intelligence when predicting selection into more (or less) computerizable jobs 11 years later. Furthermore, most effects found at Year 50 were consistent with the effects found at Year 11, although the effects had wider CIs at Year 50. Overall, these findings showed that personality factors are relevant for predicting selection into more (or less) computerizable jobs over the lifespan, but the effects were more precisely estimated over 11 as opposed to 50 years. Having established that personality factors are relevant in predicting job computerizability over the lifespan, the next goal was to better understand these effects in meaningful raw metrics.
Raw metrics interpretation of the prospective effects of personality on job computerizability at the individual and population levels
To facilitate the interpretation of the results, Table 2 also provides unstandardized regression coefficients. Given that all continuous predictors were standardized prior to the analyses, the unstandardized regression coefficients represented the average individual–level effects for a one standard deviation increase in each predictor variable. The outcome variable was kept in its raw metric, namely, the probability of each job of being computerized (i.e. each participant reported their job and each job had a probability of computerizability assigned to it, based on previous research in economics; this outcome variable took values anywhere between 0 and 1, where zero implied that the respective job had a zero probability of being computerized and 1 meant a 100% probability of being computerized). Thus, each unstandardized regression coefficient can be understood as a percentage–point change in job computerizability. For example, in Model C in Table 2, we can see that artistic interests predicted selection into less computerizable jobs 11 years later (b = −0.04); this means that, on average, if an individual increased in artistic interests by one standard deviation, they would be likely to select (11 years later) into a job with a lower probability of being computerized and that probability would be lower by 4 percentage points. More concretely, let us assume that someone with an average level of artistic interests was likely to select (11 years later) into a job that had an 11% probability of being computerized, such as a ‘hairdresser’ (for a table of job titles and their probabilities of computerization, see the Appendix in Frey & Osborne, 2013); now, let us assume this person's level of artistic interests increased by one standard deviation; in this case, the model predicts the person is now likely to select (11 years later) into a job with a 7% probability of being computerized, such as a ‘musician or a singer’ (a drop of 4 percentage points in their future job's probability of being computerized). Although specific examples such as this one can be useful, it is important to remember that the model only specifies average individual–level effects. In other words, for a one standard deviation increase in artistic interests, there is an average of 4 percentage points drop in the probability of one's future job of being computerized. However, the effect is likely to differ across specific individuals, and it is likely to differ at different levels of job computerizability.
To summarize the effects in Table 2, using the raw metric interpretation, it appears that a one standard deviation increase in intelligence predicted an average drop of 7 percentage points in job computerizability 11 years later, followed by artistic interests, where a one standard deviation increase predicted an average drop of 4 percentage points, leadership interests with a drop of 3 percentage points, and maturity and scientific interests with a drop of 2 percentage points each. A one standard deviation increase in interests in people, however, predicted a 3 percentage point increase in the probability of job computerizability 11 years later. At Year 50, the effect of intelligence replicated, and a one standard deviation increase scientific interests predicted a 3% drop in future job computerizability, whereas a one standard deviation increase in interests in people predicted a 5% increase in future job computerizability.
The next question was how do these average individual–level effects translate to the population level? Fortunately, the law of large numbers offers a clear solution. Imagine someone's specified intelligence level prepared them for a job that has a 70% probability of being computerized (i.e. 30% probability of not being computerized), and now imagine this person increased in intelligence by one standard deviation; according to our model, this person is now prepared to obtain a job later on that has a 63% probability of being computerized (37% probability of not being computerized). Now imagine we did this for 100 people, all meant to obtain jobs with a 70% probability of being computerized. Before everyone increased in intelligence, according to the law of large numbers, 30 of these people would have gotten to keep their jobs in the future, whereas after everyone increased in intelligence by one standard deviation, 37 will get to keep their future jobs (because everyone's probability of keeping their future job increased by 7 percentage points). In other words, the population–level effect of an intelligence increase of one standard deviation is equal to the average individual–level effect multiplied by the total number of jobs (in this example, .07 * 100, or 7 extra people who get to keep their future jobs who would not have otherwise been able to do so owing to computerization). If we translated this effect to the entire US employment, which according to the US Bureau of Labor Statistics was 145.55 million as of January 2017, an increase in intelligence of one standard deviation, across the entire US population, would be equivalent to saving 10.19 million people from losing their future careers to computerization. Similarly, an increase of one standard deviation in maturity or in scientific interests, across the entire US population, would each be equivalent to saving 2.9 million people from losing their future careers to computerization.
Having established that personality factors are relevant in predicting job computerizability over the lifespan and that the effects are large enough to be meaningful at the individual level and can be huge at the population level, the next goal was to test the transactional model. In other words, can the effects be fully explained through their effect via educational attainment?
Are the prospective effects of personality on job computerizability mediated by educational attainment?
To test whether the links demonstrated in Table 2, between individual differences and job computerizability over the lifespan, followed the transactional model (i.e. mediation by educational attainment), we tested two path models, one for each outcome variable, where educational attainment at Year 11 was the mediator, and job computerizability at Year 11 and at Year 50, respectively, was the main outcome of interest. The results of these analyses are reported in Table 3, which presents the effects of each predictor measured at baseline on educational attainment at Year 11, as well as the direct effects (i.e. when controlling for educational attainment at Year 11) of all the baseline predictors on job computerizability 11 and 50 years later, respectively, and the effect of educational attainment on the outcomes. As can be seen from Table 3, most baseline measurements (with the exception of extraversion and business interests) independently and significantly predicted educational attainment at Year 11; the largest effects found were that women (β = −.23, 95% CI [−0.24, −0.22]) and people interested in things (β = −.26, 95% CI [−0.27, −0.25]) tended to have a lower educational attainment, whereas people from wealthier families (β = .21, 95% CI [0.20, 0.21]) and people higher in intelligence (β = .38, 95% CI [0.37, 0.39]) tended to have higher levels of educational attainment. Furthermore, having attained higher levels of education at Year 11 was concurrently and prospectively related to selection in less computerizable jobs (β = −.46, 95% CI [−0.47, −0.45] and β = −.27, 95% CI [−0.37, −0.17], respectively). Table 3 also shows that most baseline predictors had statistically significant direct effects on job computerizability at Year 11, over and above their indirect effect through education. Of the direct effects found at Year 11, the direct effects of extraversion, artistic and people interests were consistent at Year 50 in terms of effect size, although only the latter effect was also statistically significant at Year 50. Specifically, we found that extraversion (β = −.03, 95% CI [−0.04, −0.03] at Year 11; β = −.03, 95% CI [−0.08, 0.02] at Year 50) and artistic interests (β = −.06, 95% CI [−0.07, −0.04] at Year 11; β = −.04, 95% CI [−0.12, 0.04] at Year 50) predicted selection into less computerizable jobs, whereas people interests (β = .05, 95% CI [0.03, 0.06] at Year 11; β = .11, 95% CI [0.01, 0.21] at Year 50) predicted selection into more computerizable jobs, over and above the indirect effects through educational attainment.
Results of path analyses

Note: Teenage predictors of educational attainment 11 years later and of job computerizability 11 and 50 years later. Gender was dummy coded (0 = male, 1 = female). Cohort was coded (9 = 9th grade through 12 = 12th grade). Race was dummy coded (0 = White/Caucasian, 1 = all other). Education was coded on a 1–6 scale, where each scale point represented about 2 years of additional education. All other predictor variables (i.e. from SES to Athletic interests) were standardized prior to the analyses. Bold font indicates that the 95% CI did not include zero or statistical significance at p < .05. Dash indicates that the predictor was not included in the model. These analyses used a full information maximum likelihood estimation based on N = 346 660, which was the baseline sample.
b, unstandardized regression coefficient; β, standardized regression coefficient; SES, socio–economic status; Y11, Year 11; Y50, Year 50; CI, confidence interval.
To better understand the effects of the predictors on the Year 11 and Year 50 outcomes, as well as the mediation effects through education, Table 4 presents the effect decomposition (direct, indirect, and total effects) for each variable in the study (where the total effect is the sum of the direct and the indirect effects, the indirect effect is the mediation effect through education and the direct effect is the effect of the predictor on the outcome once the indirect effect through education is taken into account). As Table 4 shows, at Year 11, that almost all the effects of the predictors on job computerizability (except for extraversion and business interests) were significantly mediated by educational attainment measured at Year 11. The percentage of the total effect mediated was on average 75%, when looking across all variables, and 66%, when looking at personality traits and interests only. These findings support the transactional model, whereby social background and individual differences are important for selection into more (or less) computerizable jobs owing to their effect on educational attainment. However, Tables 3 and 4 also clearly showed that statistically significant direct effects remained on job computerizability at Year 11, even after accounting for the indirect effects through education. Specifically, maturity, artistic and people interests had the lowest percentages of their total effects on job computerizability mediated by educational attainment (about 47% on average), and extraversion and business interests only showed direct effects on job computerizability and no evidence for mediation through education. Thus, being a woman and being interested in people and business predicted selection into more computerizable jobs 11 years later, even after accounting for their indirect effects through education; moreover, being wealthier, more mature, more extraverted, and more interested in things, arts, and leadership were related to selection into less computerizable jobs 11 years later, even after accounting for their indirect effects through educational attainment. In sum, this mediation analysis suggests that individual differences measured in adolescence predicted job computerizability 11 years later, even after accounting for their indirect effects through educational attainment, thus emphasizing even further the importance of individual differences in job selection.
Standardized direct, indirect, and total effects of predictors measured during teenagehood on job computerizability 11 and 50 years later (mediation by educational attainment)
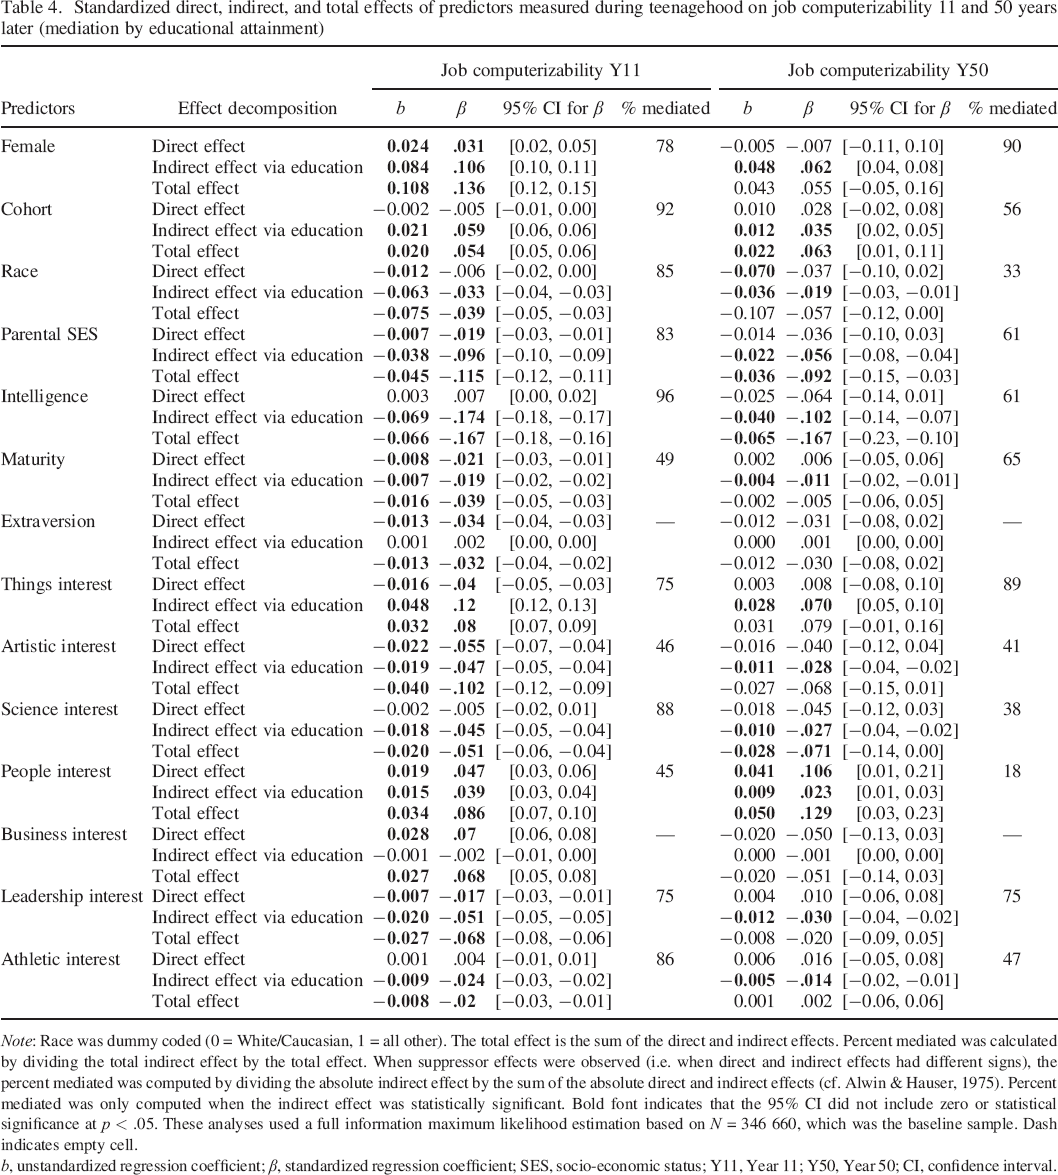
Note: Race was dummy coded (0 = White/Caucasian, 1 = all other). The total effect is the sum of the direct and indirect effects. Percent mediated was calculated by dividing the total indirect effect by the total effect. When suppressor effects were observed (i.e. when direct and indirect effects had different signs), the percent mediated was computed by dividing the absolute indirect effect by the sum of the absolute direct and indirect effects (cf. Alwin & Hauser, 1975). Percent mediated was only computed when the indirect effect was statistically significant. Bold font indicates that the 95% CI did not include zero or statistical significance at p < .05. These analyses used a full information maximum likelihood estimation based on N = 346 660, which was the baseline sample. Dash indicates empty cell.
b, unstandardized regression coefficient; β, standardized regression coefficient; SES, socio–economic status; Y11, Year 11; Y50, Year 50; CI, confidence interval.
These findings were partially replicated at the 50th–year follow–up. As Table 4 shows, almost all the effects of the predictors on job computerizability at Year 50 (except for extraversion and business interests) were significantly mediated by educational attainment measured at Year 11. The percentage of the total effect mediated was on average 56%, when looking across all variables, and 53%, when looking at personality traits and interests only. These findings bring further support to the transactional model, whereby social background and individual differences are important for selection into more (or less) computerizable jobs owing to their effect on educational attainment. However, unlike at Year 11, most direct effects on job computerizability at Year 50 did not hold after accounting for education, with the exception of extraversion, artistic and people interests, which had effects consistent with those found at Year 11 (i.e. extraversion and artistic interests were related to selection into less computerizable jobs, whereas people interests were related to selection into more computerizable jobs, even after accounting for its indirect effect through educational attainment). In sum, these results supported the transactional model (e.g. Heckman, 2006), where educational attainment mediates the effects of background and individual differences on job outcomes over the lifespan, but they also suggest that individual differences in personality traits and interests may impact occupational selection above and beyond the impact they have through educational attainment.
Discussion
With the advent of machine learning, sensors, mobile robotics, and big data, computers can now displace more jobs than ever before. Unlike in recent history, jobs displaced by computers are no longer confined to routine jobs; instead, computers can now perform a wide variety of non–routine manual and cognitive tasks. According to economists, over the next two decades, the labour market will face a serious challenge, computers being expected to displace 47% of the current US employment (Frey & Osborne, 2013). To adapt to the changing labour market, societies will need to equip future generations of workers with skills that will help them select into jobs that have a low probability of being computerized. To do so, we need to know which factors predict selection into jobs low in computerizability. To address this question, we used a large longitudinal sample to test the prospective role of personality factors (i.e. intelligence, personality traits, and vocational interests) over and above social background factors (i.e. gender, race, age, and parental SES) in predicting job computerizability over the lifespan (i.e. 11 and 50 years later, respectively).
We found that, regardless of social background, people with higher levels of intelligence, higher levels of maturity and extraversion, higher interests in arts and sciences, and lower interests in things and people tended to select (or be selected) into less computerizable jobs 11 years later. Furthermore, all these effects were consistent with the effects found 50 years later. These findings are in line with past theory in psychology, sociology, and economics, in that they showed the predictive validity of social background factors, as well as the incremental validity of various personality factors in predicting occupational selection. These findings are also in line with what we might expect given the ‘profile’ of a job low in computerizability, that is, a job that requires workers to perform non–routine cognitive tasks, such as creative intelligence tasks (i.e. tasks that require the creation of original and useful ideas) and social intelligence tasks (i.e. tasks that require a human connection and ‘common sense’, such as social perceptiveness, negotiation, persuasion, assisting, and caring for others).
One finding that may seem surprising at a first glance is the positive link between interests in people and job computerizability, which replicates across the two follow–ups. It might seem surprising because tasks that require social intelligence were listed as one of the engineering bottlenecks that block computerizability (Frey & Osborne, 2013), and it seems to go against our other finding that extraversion was negatively related to job computerizability. However, considering the historical context when the vocational interest measure was collected (i.e. 1960, the beginning of the Computer Revolution, which saw an increase in demand for clerks who could operate office electronics), as well as some of the items included in the interest scales, it becomes apparent that interests in people mapped quite well onto wanting to become an office clerk, someone who interacts with people, but mostly performs routine tasks with the help of an office machine. Most of these jobs are now computerizable, because information processing has become so cheap and effective that workers who perform highly cognitive non–routine tasks (e.g. scientists) can now perform themselves (with the help of a computer) most of the more routine tasks that would regularly be performed by an assistant or an office clerk.
The first set of findings from our prediction models reflect an additive perspective on predictors of computerizability in which it is assumed multiple factors from many domains all contribute to work outcomes. In addition to testing the additive model, we also tested the transactional model, where educational attainment mediated the link between baseline predictors and later job computerizability. We found support for this model, with educational attainment being a statistically significant mediator of most links, but we also found direct effects of our predictors on later job computerizability, indicating the importance of training personality traits like maturity and extraversion, and vocational interests in arts and sciences, beyond what the current educational system trains. This is in line with recommendations from America's National Bureau of Economic Research (Heckman & Kautz, 2014), where researchers predicted that interventions to change personality traits will become increasingly important as the labour market changes. As more jobs become computerized, societies must find new uses for labour, which means that workers will need to learn new skills to stay employed. Thus, Heckman and Kautz (2014) predict that personality traits such as perseverance, sociability, and curiosity will become increasingly important because they are correlated with the employees’ ability to adapt to new situations and acquire new skills.
This brings up an important question: How malleable are personality traits, and can they be changed through interventions? The neo–socioanalytic model (Roberts & Wood, 2006), which we introduced earlier, predicts that investment in social roles can be a driving factor for personality development (i.e. social investment principle). Supporting this prediction, several studies have shown that work experiences themselves are related to changes in personality traits that would decrease the probability of ending up in a job slated for computerizing (e.g. Hudson, Roberts, & Lodi–Smith, 2012; Le, Donnellan, & Conger, 2014; Roberts, Caspi, & Moffitt, 2003). More importantly, a recent review demonstrated that clinical interventions resulted in marked shifts in the personality trait of neuroticism, with smaller but still significant effects on extraversion and conscientiousness, demonstrating that interventions could change personality traits (Roberts et al., 2017). The aggregate research therefore supports the neo–socioanalytic model and the broader idea that identifying the personality traits most relevant for worker preparedness for the changing labour market could be the first step in developing future interventions.
Our study had several theoretical and methodological strengths. First, to our knowledge, this study is unique in testing the prospective predictors of job computerizability over the lifespan. Second, in doing so, we used an integrative approach, combining theory from psychology, sociology, and economics, and therefore, we used a wide array of theoretically relevant predictors. Third, we tested competing models, that is, the additive model versus the transactional model. Our study also has several strengths from a methodological standpoint. First, we used a longitudinal design, which is essential for investigating the predictive power of individual differences on outcomes, as it avoids measurement artefacts (e.g. shared measurement variance) and it helps us better understand the robustness of the effects over time (given that we used two follow–ups separated by 40 years in between). Another methodological advantage was that we used a large representative sample, which allowed us to estimate our effects more precisely. Furthermore, the use of two follow–ups allowed us to conduct an internal replication, to test the robustness of our effects, and to test two competing hypotheses regarding the developmental patterns of the effects (i.e. attenuation vs. accentuation of the effects over the lifespan). We found that some, but not all the effects, replicated from Year 11 to Year 50, and all the effects tended to be smaller or less reliable at Year 50, than at Year 11 (supporting the attenuation hypothesis). There are several alternative explanations for these findings: (i) personality changed over the lifespan, and thus, the personality traits measured in adolescence were less predictive of selection into certain jobs 50 years later (as opposed to 11 years later); (ii) as people stayed in their careers longer, they got promoted and occupied more leadership–type positions (which are less computerizable, regardless of the type of occupation), which may have had less to do with their interests in adolescence and more with the trajectory of many careers, which transition from using technical skills to people skills in leadership positions; and (iii) the Year 50 data consisted of a much smaller participant sample, which may have made our estimates less accurate. The present data cannot distinguish between these alternative explanations, but future studies should try to disentangle them by using longitudinal designs with more measurement points and by looking at the link between personality change over time and job computerizability, to better understand developmental patterns. Finally, another methodological advantage of the present paper is the use of meaningful raw metrics on the outcome variable, which highlights the magnitude of the effects. For example, we found that, regardless of social background, people who were more intelligent, mature, interested in arts, and sciences in adolescence, selected into jobs that had a lower probability of computerization later in their lives. On average, a one standard deviation increase in each of these traits predicted an average of 4 percentage points drop in the probability of one's job of being computerized. At the US population level, this is equivalent with saving 5.8 million people from losing their future careers to computerization.
Limitations
Despite the aforementioned strengths, the present study also has several limitations. First, this study only used self–reports in order the assess personality traits and vocational interests. Future longitudinal studies should include both self–reports and other–reports, to ensure measurement accuracy. Second, the personality trait measure available in Project Talent was not ideal; as it was pointed out previously (Major, Johnson, & Deary, 2014; Pozzebon et al., 2013), the PTPI does not differentiate very well between the Big Five personality traits, and thus, we cannot be confident that the results would replicate with modern personality measures. Third, these data were collected more than 50 years ago, and the American education system has changed in important ways since then, which means that some of our effects might not replicate in more recent cohorts. Fourth, the raw job title data were not available at Year 11, so we had to rely instead of 250 job categories that were assigned to the participants by the Project Talent staff; this likely increased the error variance in our models. Fifth, this research did not investigate why the links between individual differences and job computerizability may exist; future studies should investigate the underlying mechanisms, as well as the link between personality change and selection into more (or less) computerizable jobs, as well as at the impact that working in these jobs has on personality change. Sixth, as the attrition analyses presented in Tables S1 and S2 showed, the samples available at the follow–ups differed systematically from the samples that dropped out. Specifically, the people who stayed in the study were more intelligent, higher in parental SES, had higher levels of vocational interests, and most importantly they had jobs, since our outcome of interest was the type of job people had. It is possible that each of these factors impacted our effect estimates, although it is difficult to assess in what way. For example, as there was an overlap between the variables that affected both attrition and computerizability, the effects may have been attenuated owing to range restriction. On the other hand, the inclusion of all people and the full range could have led to unknown modifications of the effects.
In addition to the aforementioned limitations, there are also some issues with the interpretation of the findings and their potential implications. First, we must emphasize that all the effect estimates in our models are average individual–level estimates. This means, for example, that a one standard deviation increase in intelligence will not predict a 7 percentage point drop in the probability of computerization of one's future job at every level of the job distribution or for every individual. In fact, the effect will vary at every level and for every individual, but the average of those effects will be 7 percentage points. Second, the present results do not speak to the effectiveness of potential personality interventions on the labour market. For example, it is reasonable to assume that if we could somehow increase everyone's intelligence level, we could obtain a generation of people who had a higher level of ability that would prepare them for less computerizable jobs. However, the same assumption cannot be made for a variable like parental SES, where people are inherently ranked, and where the rank compared with others (and not the specific level) matters in producing better occupational outcomes. In other words, regarding parental SES, even if we increased everyone's level, there would still be a ranking in place that would provide advantages to some but not others on the labour market. This might not be the case with personality characteristics, where a necessary threshold level might be what is needed for people to be prepared for new labour market. Another issue is that, upon intervening on personality characteristics (e.g. artistic or scientific interests), we might end up with more people who are prepared for the new labour market, but the labour market might simply not be able provide so many jobs to accommodate all the adequately prepared individuals (in others words, perhaps we simply do not need that many scientists or artists). Even in this case, however, more people might have a ‘fighting chance’ if adequately trained, so then the selection factor will become a new skill, yet to be discovered. Finally, the present findings are less useful when thinking of how to avoid mass unemployment when it comes to people who are already hired in highly computerizable jobs. Instead, we hope that our findings can start a conversation on how personality factors predict later selection into more (or less) computerizable jobs, because that might inform us on which skills might be relevant in preparing young people for future labour markets. In other words, the motivation of our paper is not so much about pushing people who are already employed into less computerizable jobs, but about finding out which skills might be essential for someone who wants to be successful in the future in finding a job (which will likely be a job low in the probability of being computerized); in other words, which personality factors (and to what extent) might make people more prepared for the jobs of the future. These findings could be used to affect educational policy and personality interventions.
Conclusion
We showed, in a 50–year longitudinal study of a large nationally representative sample of 346 660 people, that personality traits and vocational interests in adolescence, in addition to parental SES and intelligence, matter in predicting selection into more (or less) computerizable jobs in young and old adulthood. We found that, regardless of social background, people with higher levels of intelligence, higher levels of maturity and extraversion, higher interests in arts and sciences, and lower interests in things and people tended to select (or be selected) into less computerizable jobs 11 and 50 years later. Furthermore, we brought evidence for the transactional model, where educational attainment mediated some of the effects. However, direct effects of personality predictors on job computerizability remained even after accounting for the indirect effects through educational attainment, thus highlighting the importance of personality predictors on occupational selection. This suggests that perhaps traditional education is not fully equipped to address the upcoming changes in the labour market and that perhaps we should consider training personality characteristics that will help prepare people for future jobs (i.e. jobs low in computerizability), as computers displace old jobs. If this is indeed the trend that the labour market will take in upcoming years, an upside would be that future jobs will likely be more interesting, less routine, constantly changing, and challenging and will require skills that are uniquely human.
Acknowledgements
This research uses data from Project Talent, a project directed by the AIR. Information on how to obtain the Project Talent data files is available on the AIR website (http://www.air.org/) and from Susan Lapham (
Supporting info item
Supporting info item, per2103-sup-0001-Data_S1 - Whose Job Will be Taken Over by a Computer? The Role of Personality in Predicting Job Computerizability over the Lifespan
Supporting info item, per2103-sup-0001-Data_S1 for Whose Job Will be Taken Over by a Computer? The Role of Personality in Predicting Job Computerizability over the Lifespan by Damian Rodica Ioana, Spengler Marion, Roberts Brent W. and Jokela MarkusDr. in European Journal of Personality
Table S1. Attrition analyses based on actual study participation at Y11 and Y50, independent from availability of responses on the dependent variable.
Table S2. Attrition analyses based on dependent variable response availability at Y11 and Y50, respectively (samples used in analyses that employed listwise deletion).
Table S3. Descriptive statistics and inter-correlations between all the variables in the study, using lisewise deletion to deal with missing data.
Table S4. Regression analyses predicting job computerizability 11 and 50 years later, using listwise deletion to deal with missing data.
Table S5. Results of path analyses. Teenage predictors of educational attainment 11 years later and of job computerizability 11 and 50 years later, using listwise deletion to deal with missing data.
Table S6. Standardized direct, indirect, and total effects of predictors measured during teenagehood on job computerizability 11 and 50 years later (mediation by educational attainment), using listwise deletion to deal with missing data.
Table S7. Rotated Factor Matrix for the PTPI Scales in the Project Talent Sample.
Table S8. Rotated Factor Matrix for the PTPI Scales in the Pozzebon et al. (2013) PTPI Validation Study.
Table S9. Correlations between the PTPI Personality Factors (Maturity and Extraversion) and Established Personality Scales using publicly available data from Pozzebon et al. (2013).
Table S10. Project Talent Personality Inventory Instructions and Items.
Table S11. Project Talent Interest Items.
Table S12. Results of path analyses, unstandardized, bootstrapped. Teenage predictors of educational attainment 11 years later, and of job computerizability 11 and 50 years later.
Table S13. Standardized direct, indirect, and total effects of predictors measured during adolescence on job computerizability 11 and 50 years later (mediation by educational attainment), unstandardized, bootstrapped.
Footnotes
Notes
References
Supplementary Material
Please find the following supplemental material available below.
For Open Access articles published under a Creative Commons License, all supplemental material carries the same license as the article it is associated with.
For non-Open Access articles published, all supplemental material carries a non-exclusive license, and permission requests for re-use of supplemental material or any part of supplemental material shall be sent directly to the copyright owner as specified in the copyright notice associated with the article.