
Abstract
Researchers applying clustering methods have found that the five most commonly studied personality traits (the ‘Big Five’) appear to form three prototypes, known as resilient, undercontrolled, and overcontrolled (RUO) personality types. The analysis has been replicated cross–nationally, and the results have been reasonably robust. However, these findings do not necessarily imply discontinuities or non–linearities in the Big Five data. We study whether the RUO types can arise from typical Big Five intercorrelations alone. We used data from a previous meta–analysis of inter–trait correlations (N = 144 117 participants) and simulated normally distributed observations with this correlation structure. Applying three different clustering algorithms (k–means, hierarchical agglomerative, and model based) with three–cluster solutions to the simulated data, we examined whether the known correlations alone can give rise to the RUO typology. The simulated results were compared with previous empirical findings. A simple multivariate normal distribution with the Big Five correlation structure was sufficient to generate the RUO typology in three–cluster solutions for all the three clustering methods. Contrary to the RUO typology ‘carving personality description at its joints’, linear correlations typical for correlations among Big Five traits can create RUO types even in the absence of any points of discontinuity. Copyright © 2017 European Association of Personality Psychology
Introduction
The factorial structure of personality traits has been studied extensively based on continuously distributed traits (Allport, 1937; John, Naumann, & Soto, 2008). The most widely used five–factor model consists of higher–order traits of Openness, Conscientiousness, Extraversion, Agreeableness, and Neuroticism (Digman, 1990; John et al., 2008; McCrae & Costa, 2003). Another line of research has examined whether people can be clustered empirically into distinct prototypical personality types. Evidence from multiple studies shows that the five personality dimensions appear to form three prototypes, known as resilient, undercontrolled, and overcontrolled (RUO) personality types (Asendorpf, Borkenau, Ostendorf, & Van Aken, 2001; Asendorpf & van Aken, 1999; Robins, John, Caspi, Moffitt, & Stouthamer–Loeber, 1996). A resilient–type person is one with a lower than average Neuroticism and higher than average value in the four other traits, whereas the Overcontrolled type has the opposite pattern. The undercontrolled personality type is most often observed to have higher than average Openness, Extraversion, and Neuroticism and lower than average Conscientiousness and Agreeableness. The prototypes have been replicated in several different linguistic and cultural traditions (e.g. Alessandri et al., 2014; Klimstra, Hale, Raaijmakers, Branje, & Meeus, 2010; Meeus, Van de Schoot, Klimstra, & Branje, 2011; Pesonen et al., 2008; Robins et al., 1996; Specht, Luhmann, & Geiser, 2014) and thereby appear reasonably robust (but see Asendorpf, 2002 for a discussion on failed replications).
Despite all efforts towards a personality system of uncorrelated traits, the actual measures do show non–trivial correlations between traits (DeYoung, Quilty, & Peterson, 2007; van der Linden, te Nijenhuis, & Bakker, 2010). At first sight, moderate trait intercorrelations seem unrelated to the question of prototype clusters, and with model–based (finite mixture model) clustering methods and correct number of estimated cluster, this is indeed the case (Fraley & Raftery, 2002; MacKay, 2003; McLahlan & Peel, 2000). However, the clustering methods used in research on personality typologies have often relied on older clustering algorithms (e.g. Alessandri et al., 2014; Asendorpf et al., 2001). A known problem with methods such as k–means clustering is that they lack representation for the size and shape of clusters, and mere correlations between the measures can therefore give rise to spurious clusters (see, e.g., chapters 20 and 22 in MacKay, 2003). Furthermore, even model–based clustering methods can give rise to replicable spurious clusters when a wrong number of clusters is specified, and researchers have argued for the use of models with cluster numbers that do not provide strictly the best fit to data in terms of the applied information criteria (e.g. Alessandri et al., 2014).
Figures 1 and 2 demonstrate the issue in a two–dimensional case. The upper–left panels give an example of simulated uncorrelated data (spherical; Figure 1) and correlated data (Figure 2). The other panels show 50 two–cluster solutions from three different widely used clustering methods. When one is estimating two cluster centres and the ‘true’ underlying data have only one spherical cluster, ‘replicable and robust’ results are unattainable (Figure 1). However, when the underlying data have only one correlated cluster of observations, the two cluster centres arising from the algorithms are highly ‘replicable and robust’ (Figure 2). A crucial difference between the newer model–based and the older k–means and Ward's algorithms is that the older methods are based on spherical cluster representations and favour two clusters in this example when comparing models with different numbers of clusters; the newer method ‘models’ elliptic clusters and therefore correctly favours a single elliptic cluster when comparing models with different numbers of cluster (Figure 3; see Appendix for explanation of model selection criterion).
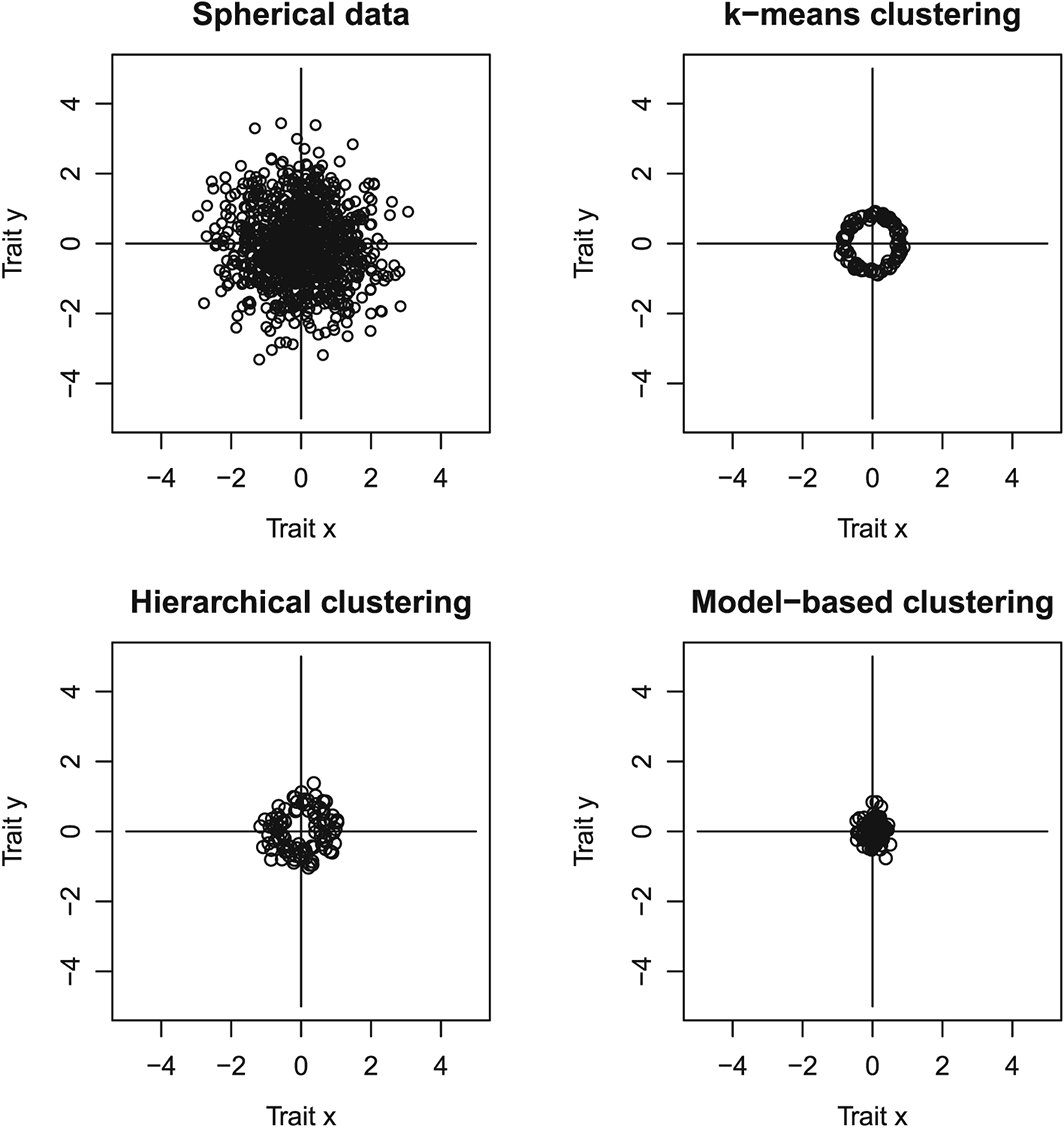
Illustration of properties of clustering algorithms in uncorrelated data. The upper–left panel shows 1000 observations of spherical (uncorrelated) example data. The remaining panels plot cluster means arising when two–cluster clustering solutions are estimated for 50 simulated datasets of the same kind using three different clustering methods. It is unlikely that the 50 simulated researchers using any of the three methods would end up in a theory of two robust personality clusters when the data are spherical, or uncorrelated. The situation changes dramatically for the correlated data (see Figure 2).
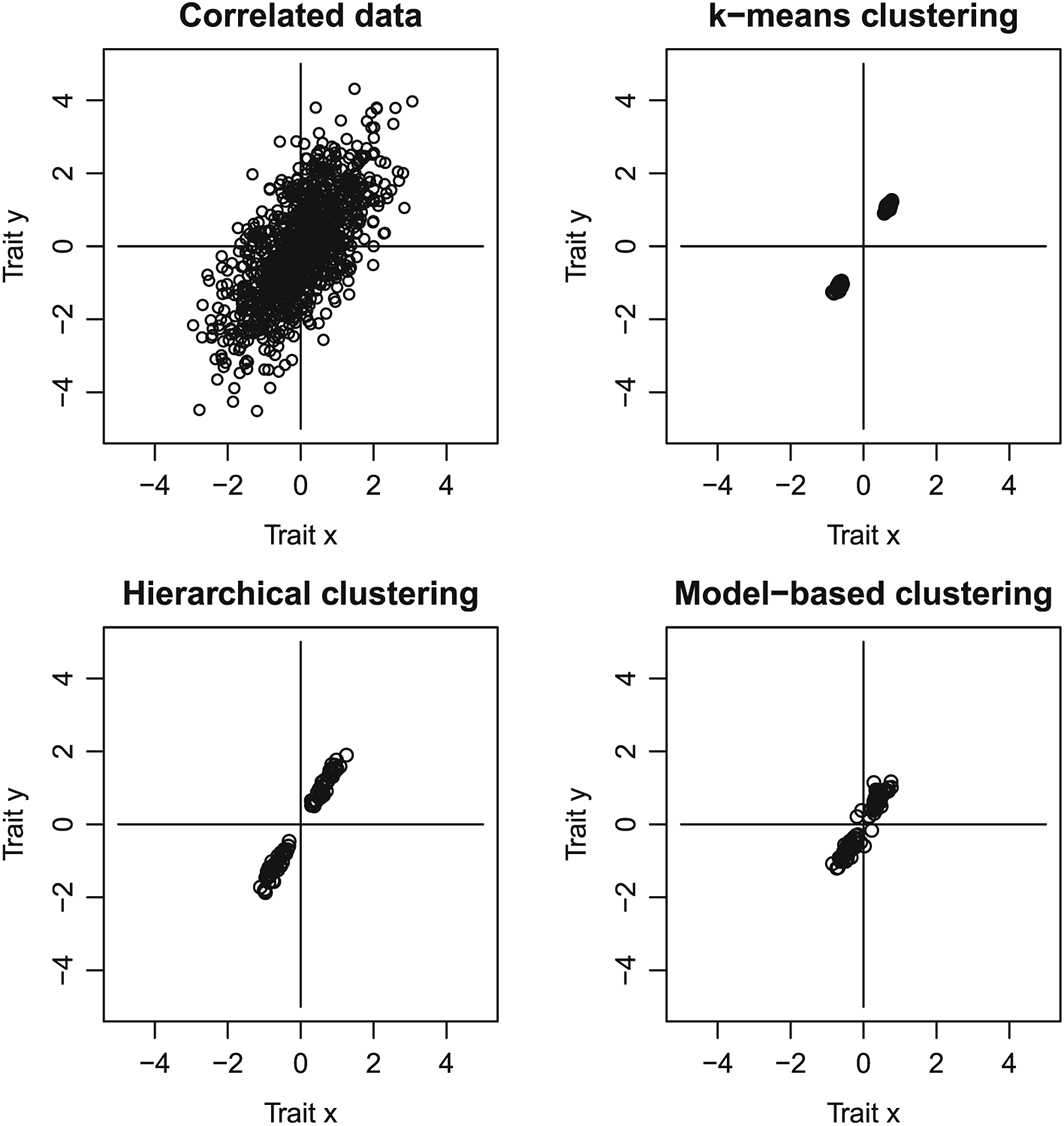
Illustration of properties of clustering algorithms in correlated data. The upper–left panel shows 1000 observations of correlated data. The remaining panels plot cluster means arising when two–cluster clustering solutions are estimated for 50 simulated datasets of the respective kind using three different clustering methods. All three methods systematically place the cluster centres in only two out of the four quadrants.
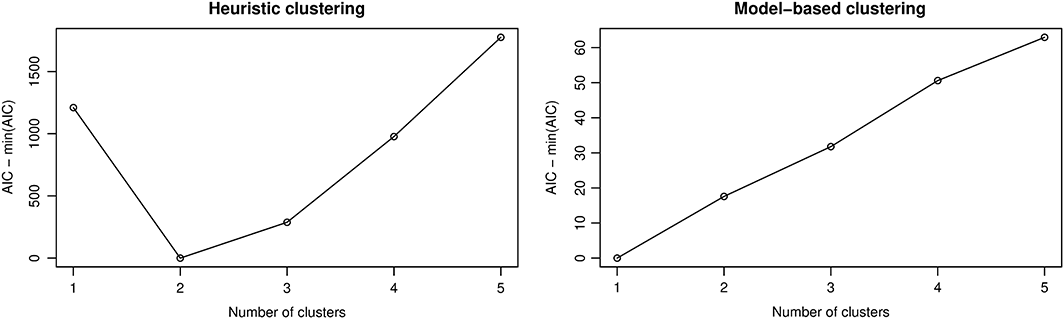
Akaike's information criterion (AIC) for heuristic and model–based clustering. A dataset of 10 000 observations was simulated similarly as in Figure 2. Clustering models with one through five clusters were estimated either using k–means or model–based clustering algorithm. The k–means cluster presentation is similar to that in the Ward's method (i.e. spherical). Although the cluster centres are derived differently, both the heuristic methods would favour two clusters (minimum AIC achieved for two–cluster model), whereas the model–based method correctly detects that there is just a single cluster in the data.
In exploratory cluster analysis, choosing an appropriate number of clusters is a very difficult task that depends on specifying the correct model (Alessandri et al., 2014; Asendorpf et al., 2001; Fraley & Raftery, 2002; MacKay, 2003). We seek to answer a more restricted question: do the observed intercorrelations of the Big Five traits suffice to give rise to RUO topology in three–cluster solutions? Given the properties of the clustering methods used to infer the RUO personality types, the mere intercorrelations of the Big Five traits might underlie the personality prototypes, but this is not self–evident and will be tested here. If the RUO typology does not arise from known intercorrelations of traits, then the typology may reflect some non–linear processes that give rise to distinct personality types. If, however, the RUO typology can arise from simple linear correlations, the value of the typology would be undermined, giving further support for continuous models of personality and psychopathology (e.g. Haslam, Holland, & Kuppens, 2012; Kotov et al., 2017; Krueger & Markon, 2014; Markon, Chmielewski, & Miller, 2011; Tyrer, Reed, & Crawford, 2015; Widiger & Mullins–Sweatt, 2009).
The aim of this contribution is not to argue that personality clusters, taxa, or other non–linearities would not exist or that clustering methods should never be used. The aim is to argue that clusters can arise from linear correlations in the absence of any discontinuity in the data, unless these correlations are taken in account by use of proper method or removed prior to the analysis (e.g. by ‘sphering’ of data as in Hyvärinen, Karhunen, & Oja, 2001). In many ways, normal distribution is the simplest, or most parsimonious, explanation of data; for example, it is the maximum entropy distribution (assumes the least structure for a given covariance; Cover & Thomas, 2006, p. 254), results from summed independent influences, and is the standard model for errors in experiment (Klenke, 2008). Relying on categorical data is not simply an alternative for linear correlations with equal but different strengths and weaknesses. When underlying taxon does not exist, use of categorical formulations has been criticized on many grounds, time and again (Kotov et al., 2017; Maxwell & Delaney, 1993; Royston, Altman, & Sauerbrei, 2006; van der Sluis, Posthuma, Nivard, Verhage, & Dolan, 2013).
Method
Data
Correlation estimates between the Big Five dimensions used in this simulation study were drawn from published data. First, we made use of the estimates from a recent meta–analysis of 212 studies and 144 117 individuals (van der Linden et al., 2010). These represent a comprehensive literature search on all correlations for measures of ‘Big Five’ or ‘five–factor model’ personality traits. Second, as a validation and sensitivity analysis, we used correlation matrix from the Eugene–Springfield community sample of 481 individuals (DeYoung et al., 2007). DeYoung et al. (2007) recruited the sample by mail from a list of homeowners, and they fulfilled NEO–PI–R questionnaire (Revised NEO Personality Inventory). Most participants in the sample identified themselves as White people, and they spanned age range from 20 to 85 years (mean was 52.5 and SD 12.6) and all educational levels. Table 1 summarizes these two correlation matrices.
Meta–analytic (above diagonal) and community–sample (below diagonal) correlations used in simulation of multivariate normal datasets
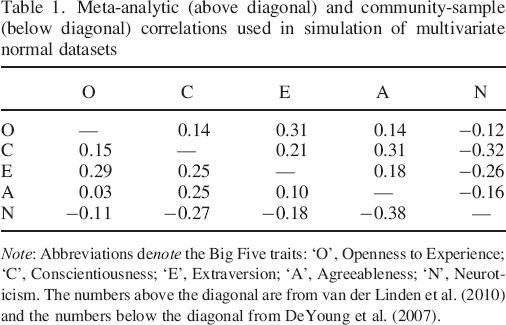
Note: Abbreviations denote the Big Five traits: ‘O’, Openness to Experience; ‘C’, Conscientiousness; ‘E’, Extraversion; ‘A’, Agreeableness; ‘N’, Neuroticism. The numbers above the diagonal are from van der Linden et al. (2010) and the numbers below the diagonal from DeYoung et al. (2007).
The previously observed correlation matrices were used to generate 10 000 five–dimensional multivariate normally distributed observations with the given correlation structure and mean vector of zeros. These simulated individuals were studied by k–means cluster analysis. Because we simulated the data from a single multivariate normal distribution, we knew that no true clusters existed in the data.
As an empirical point of comparison, we used average cluster centres from a four–nation study by Alessandri et al. (2014). They used samples of college students from Italy (n = 322), the USA (n = 499), Spain (n = 420), and Poland (n = 235), striving to replicate the findings of Asendorpf et al. (2001) cross–nationally.
In the very end, we use a full dataset from the International Personality Item Pool (IPIP) project to compare clustering solutions in correlated and correlation–removed data (Goldberg et al., 2006). The data are freely available (http://personality–testing.info/_rawdata/) and contain information from 19 719 independent individuals’ responses to the 50–item IPIP Big Five Factor Markers personality measure (http://personality–testing.info/tests/IPIP–BFFM/). The data have been gathered through an online form and then distributed for research purposes and, at the time of writing, were last updated on 18 May 2014.
Statistical procedure
All computations were performed in R software, Linux 64–bit version 3.2.2, and a full R script for the analyses is provided as Supporting Information. Multivariate random vectors were generated using the ‘mvtnorm’ package. Having generated the simulated participants’ Big Five profiles (five–dimensional random vectors; N = 10 000), we fitted the k–means clustering algorithm (‘kmeans’ R–function) with three clusters (i.e. k = 3) and default options. This entire procedure of simulating the data and running the k–means clustering algorithm was repeated 100 times, and the average cluster centres/means and their 95% confidence intervals were plotted, yielding our main results. In addition to the k–means algorithm, we repeated the entire procedure using a version of Ward's hierarchical, or agglomerative, clustering as implemented in the ‘hclust’ function of the ‘stats’ R package (with method ‘ward.D’). Two closely related but slightly different versions of Ward's algorithm exist in the literature, and we used the one based on Euclidian distances rather than their squares (Murtagh & Legendre, 2014). We also replicated our analysis using model–based clustering as implemented in the ‘mclust’ R package, version 5.2 (Fraley & Raftery, 2002; McLahlan & Peel, 2000). This method seeks initial values by agglomerative clustering and then fits a mixture of multivariate Gaussian distributions using expectation–maximization algorithm (Dempster, Laird, & Rubin, 1977).
The patterns of cluster centres were compared with the average RUO personality prototypes found by Alessandri et al. (2014). In addition to visual comparison, we used pattern distance based on Euclidian/Frobenius norm, the Euclidian distance between the cluster centres. Differences for distances across conditions were compared using (exact enumeration) permutation tests.
As a minor inconvenience, the clustering algorithm may label the clusters differently for different instances of the 100 repetitions. For consistent results, we relabelled the clusters in each run so that the first cluster (related to ‘resilient’ type) had the lowest Neuroticism mean among the three clusters, the second cluster (related to ‘overcontrolled’ type) had the lowest Extraversion mean, and the third was the remaining cluster, or a random remaining cluster if both Neuroticism and Extraversion were lowest in the same cluster (a very rare occurrence in samples with Eugene–Springfield correlation structure; never occurred for data simulated with the meta–analytic correlations). Notice that clusters are renamed also in empirical research, often based on their similarity with the RUO types. Thus, our procedure can be thought of as simulating results from 100 identical replication studies.
Usually researchers make several different kinds of sensitivity analyses for determining the optimal number of clusters in cluster analysis and their replicability across different runs of the algorithm (Alessandri et al., 2014; Asendorpf et al., 2001; Fraley & Raftery, 2002; MacKay, 2003). However, different indicators have often been inconsistent in past research, and yet researchers have tended to argue for three clusters (Alessandri et al., 2014). To keep things simple, we just wanted to test if three–cluster solutions generally replicate the RUO personality structure when applied to a dataset with the Big Five correlation structure but no real clusters. Finally, we also studied the relative importance of trait correlations versus cluster relabelling in the ensuing k–means solution by gradually decreasing the trait intercorrelations—at zero correlations, any systematic clustering must be due to the relabelling.
The simulation studies establish that correlations are sufficient to create RUO clusters under certain methods, but not that they necessarily create them in raw, real data. Points of discontinuity (or rarity) could exist alongside the correlations. To further assess whether RUO types necessarily arise from trait correlations, we estimated three–cluster k–means clustering solutions in the original IPIP data and in whitened, or sphered, IPIP data; 95% bootstrap percentile confidence intervals of cluster means were derived from 2000 bootstrap resamples (Efron & Tibshirani, 1993). Whitening is an invertible linear transformation that removes correlations and standardizes the variables, but does not render multiple clusters into a one cluster. Mathematically, if S is observed covariance, S = UDU′ its eigendecomposition, and X the original n–by–5 data matrix (n is sample size), then the matrix product XUD−1 yields a whitened, uncorrelated dataset (e.g. Hyvärinen et al., 2001). Clusters that are produced by correlations only should vanish after whitening.
Results
Figure 4 presents the average k–means cluster centres for the simulated data with the correlation structure derived from the previous meta–analysis and compares those with the average results from the cross–national replication of RUO types. It is fair to say that this replicates the RUO personality types quite well. The same held for hierarchical agglomerative clustering (Figure 5) and for model–based clustering using a mixture of three multivariate Gaussian distributions (Figure 6). Also the Eugene–Springfield correlation structure yielded the RUO types (Figure 7). In summary, three–cluster solutions resulted in RUO personality types when the clustering methods were applied to strictly continuously (multivariate normally) distributed simulated data having experimentally observed Big Five intercorrelations.
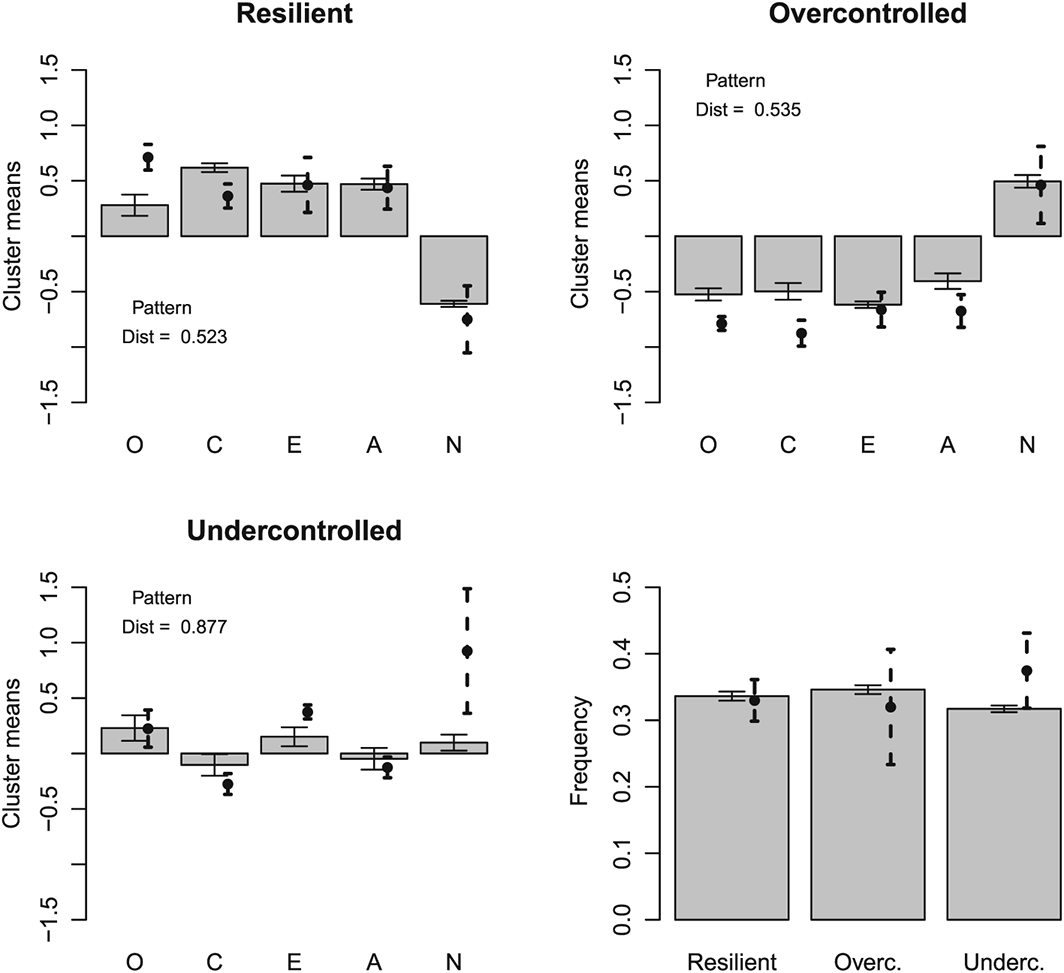
Clusters from previous empirical study and simulated k–means cluster means. Bars give simulated means and cluster sizes, with whiskers denoting 95% Wald confidence intervals. The dashed–line whiskers give confidence intervals for the cross–national empirical study of resilient, undercontrolled, and overcontrolled types (n = 4 nations). Pattern distance (‘dist’) is the Euclidian distance between observed and simulated cluster centres. O, Openness to Experience; C, Conscientiousness; E, Extraversion; A, Agreeableness; N, Neuroticism.
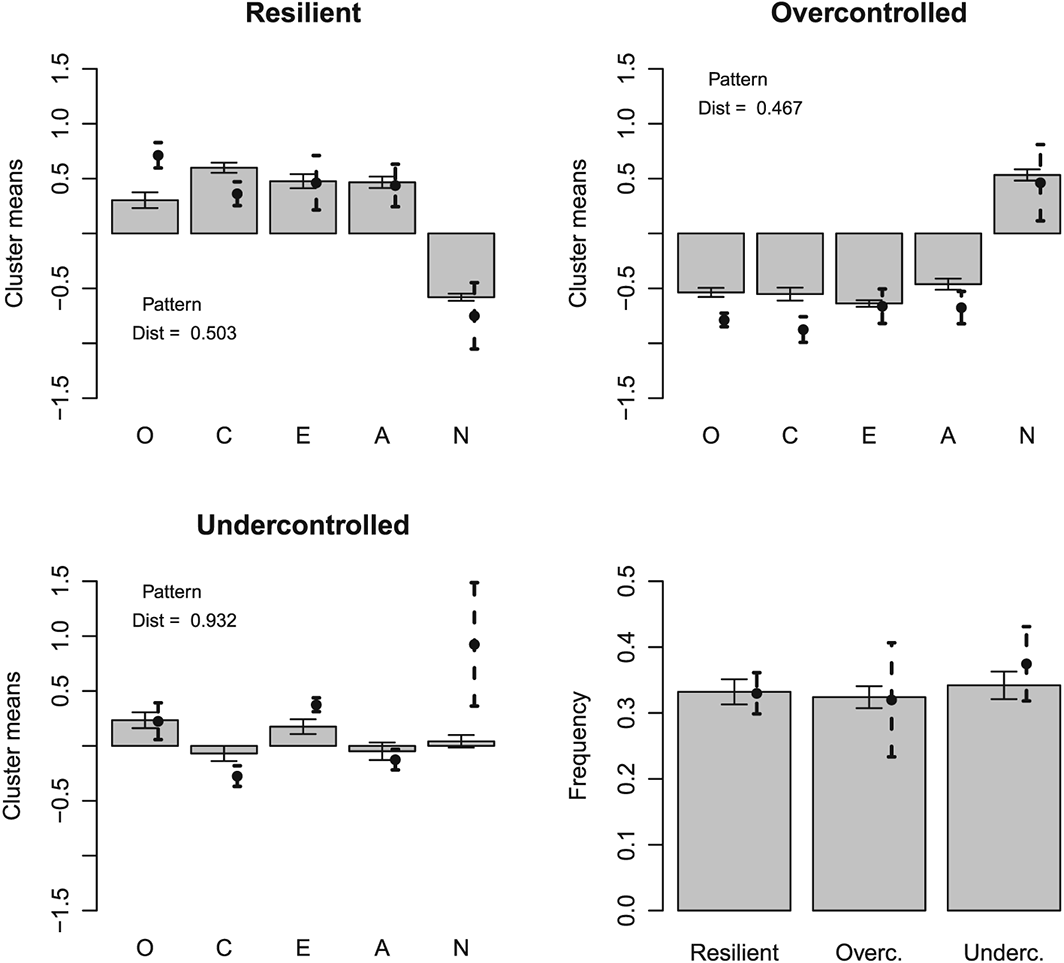
Clusters from previous empirical study and simulated hierarchical agglomerative cluster means. This analysis replicates the analysis of Figure 4, demonstrating that the results are similar for the hierarchical agglomerative clustering as for the k–means algorithm. O, Openness to Experience; C, Conscientiousness; E, Extraversion; A, Agreeableness; N, Neuroticism.
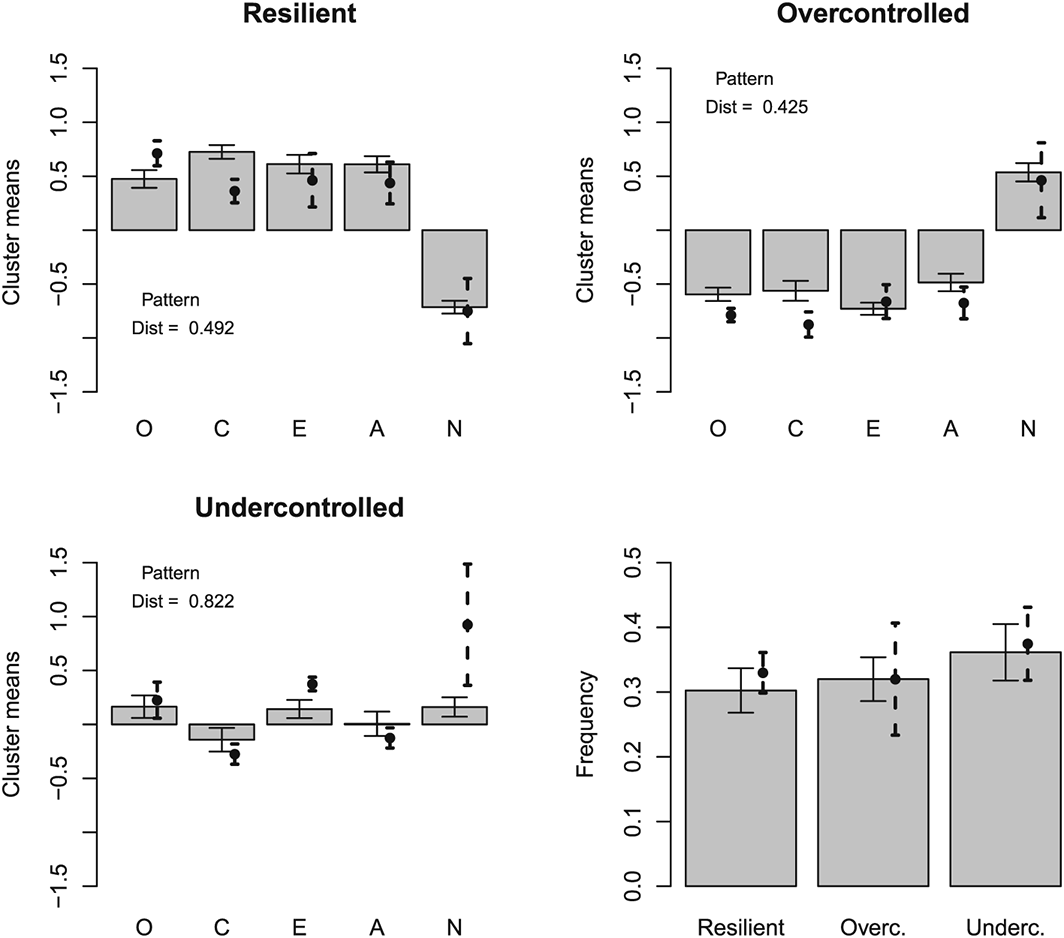
Clusters from previous empirical study and simulated model–based cluster means. This analysis replicates the analysis of Figure 4, demonstrating that the results are similar for the model–based clustering as for the k–means algorithm. O, Openness to Experience; C, Conscientiousness; E, Extraversion; A, Agreeableness; N, Neuroticism.
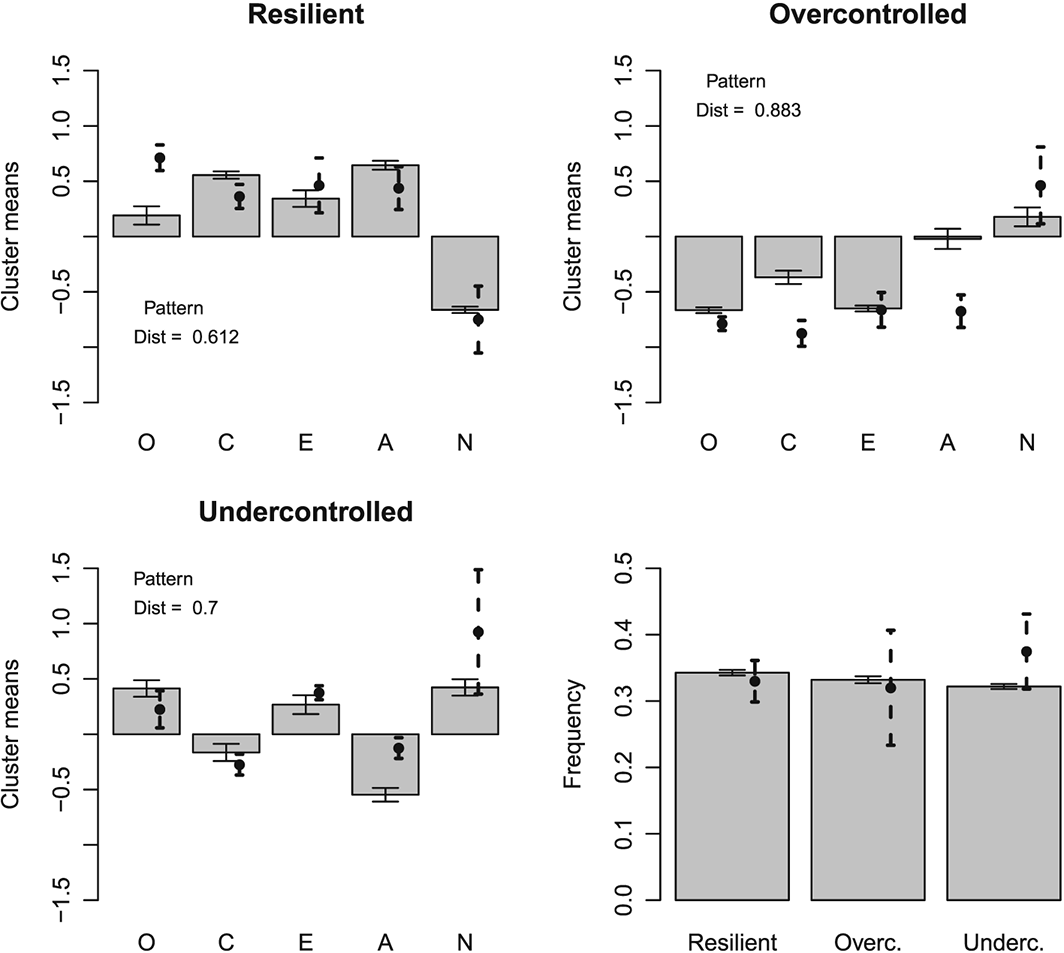
Simulated k–means cluster means for correlations drawn from the Eugene–Springfield study. This replicates the findings of Figure 4 to verify that they do not derive from differences between correlation structures of the study populations in the meta–analysis and to provide a sensitivity analysis. Only correlations of the simulated data were changed in comparison with Figure 4. O, Openness to Experience; C, Conscientiousness; E, Extraversion; A, Agreeableness; N, Neuroticism.
When the meta–analytic trait correlations (Table 1) were diluted by multiplying them with a coefficient less than one, the cluster means found from simulated data using k–means algorithm were gradually drawn towards zero, except for the traits that were used to designate the cluster label (Figure 8). This latter effect is a sampling bias caused by the procedure of cluster relabelling. The RUO pattern is strikingly persistent at the face of diluting trait correlations, which illustrates the importance of the statistical effects of cluster relabelling. Nevertheless, the distance between simulated and observed cluster means was higher for zero–correlation simulation (resilient = 1.056, undercontrolled = 0.739, and overcontrolled = 1.494) than for the observed–correlation simulation (resilient = 0.483, undercontrolled = 0.830, and overcontrolled = 0.558), suggesting that also the trait correlations are an important determinant of the cluster solutions. Correlations had a statistically significant contribution for resilient and overcontrolled clusters (p = 0.016 and p = 0.028, respectively), but not for undercontrolled cluster (p = 0.578).
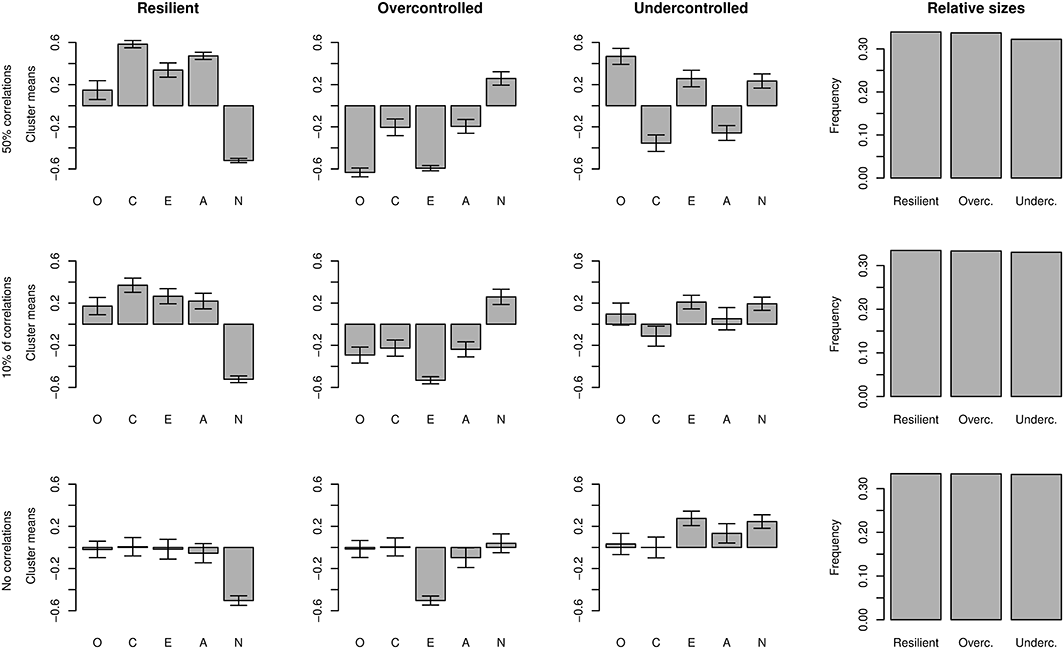
The k–means cluster means for attenuated correlations. The first row shows the analysis of Figure 2 when all trait correlations were multiplied by 1/2, the second row when multiplied by 1/10, and the last row without any trait correlations. Whiskers denote 95% Wald confidence intervals. O, Openness to Experience; C, Conscientiousness; E, Extraversion; A, Agreeableness; N, Neuroticism.
In the ‘three–means’ analysis of the full IPIP data, resilient and overcontrolled types replicated reasonably well over the bootstrap resamples, whereas the undercontrolled type did not (Figure 9, top row of panels). None of the types were distinguishable after whitening of the data, and only the effects of selection based on Neuroticism and Extraversion (i.e. cluster relabelling) consistently replicated across the bootstrap resamples (Figure 9, bottom row). This strongly suggests that all clustering in the IPIP data is due to either trait correlations or cluster relabelling.
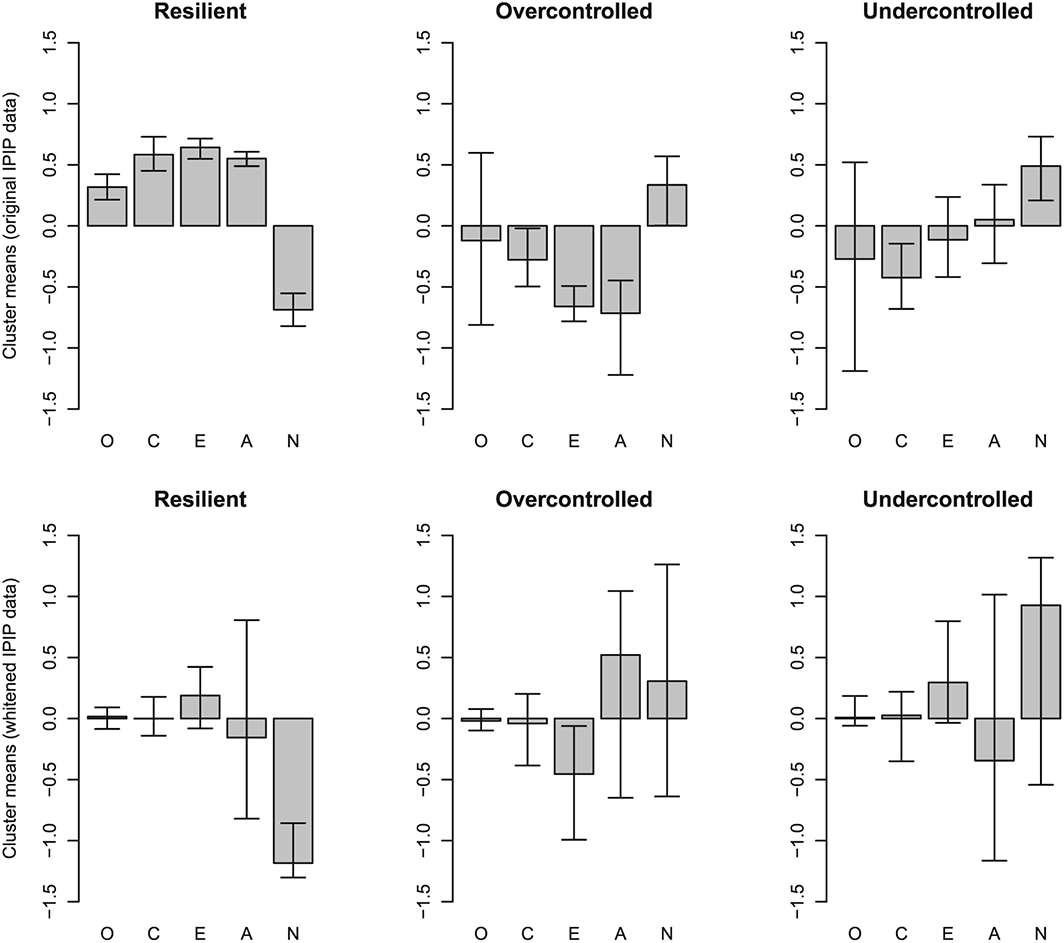
Three–cluster k–means analysis of the IPIP open–access data on Big–Five factor markers personality traits. Top row of panels: clusters and 95% bootstrap percentile confidence intervals as derived from the original IPIP data. Bottom row of panels: clusters and confidence intervals based on IPIP data after a linear whitening transformation, that is, after removing trait correlations. IPIP, International Personality Item Pool; O, Openness to Experience; C, Conscientiousness; E, Extraversion; A, Agreeableness; N, Neuroticism.
Discussion
The results of this simulation study show that the RUO personality types can result merely from the intercorrelations of the Big Five traits. The findings rise a concern that RUO personality types could be an epiphenomenon of the Big Five correlation structure instead of genuine data point clustering. Similar concerns may apply to other clusters of personality types reported in the literature (e.g. Herzberg & Roth, 2006). Even if there were no other structure in the data than a multivariate normal distribution with the observed intercorrelations of the Big Five traits, three–cluster solutions would suggest the RUO personality prototypes. In this case, the highly replicable prototypes would be seen as a matter of re–expressing (categorizing) the data by discarding information rather than as a matter of ‘carving personality description at its joints’ (Alessandri et al., 2014; Asendorpf et al., 2001). Note, however, that our analysis does not indicate that categorical prototypes could not exist—only that more care is needed in their analysis to avoid confounding with simpler factorial structures (cf. last paragraph of the Introduction).
Because normal distribution is a maximum entropy distribution for a given mean vector and covariance matrix, and therefore contains less a priori structure than alternative distributions (Cover & Thomas, 2006), other things being equal, it is the simplest explanation of Big Five correlations. Therefore, one should be hesitant about alternative explanations of Big Five correlations without being able to show that they actually represent the data better than the usual Big Five model, or that some non–statistical arguments favour the alternative. Thus far, the proponents of the RUO typology have mainly concentrated on demonstrating the replicability and consistency of the typologies across samples (Alessandri et al., 2014; Asendorpf et al., 2001). We demonstrated here that the types can be a consequence of the replicable and consistent correlations between the Big Five traits and of the standard practice of cluster relabelling (DeYoung et al., 2007; van der Linden et al., 2010).
A bimodal trait distribution would be a finding that would suggest a typology underlying the trait. Asendorpf et al. (2001) sought for these but concluded that ‘the expected bimodal pattern for overcontrol and undercontrol when the resilient type was dropped from analysis was found only for the Q–sort data. In all other 22 cases, the distribution was unimodal.’ Also more formal taxometric methods have generally failed to find support for any personality typologies, excluding schizotypal personality (Haslam et al., 2012). Psychometricians have called for more rigour in tests of the dimensional (or factorial) structure of personality (Borsboom, 2006), and it is only appropriate to extend that concern to typologies. All the more so because the discussion on typologies versus continua is topical for the oncoming revisions to clinical personality disorder diagnoses, wherein several researchers argue for the removal of diagnoses based on typologies (Kotov et al., 2017; Krueger & Markon, 2014; Tyrer et al., 2015; Widiger & Mullins–Sweatt, 2009).
Although not directly pertinent to the present argument, it is of interest to note that modern psychometric developments are not restricted to kinds versus continua, but can cover ground between these extremes, as well as go beyond that debate (Borsboom et al., 2016; De Boeck, Wilson, & Acton, 2005; Kotov et al., 2017; Masyn, Henderson, & Greenbaum, 2010). For example, (i) factor mixture models make assumptions that can be seen as intermediate to older cluster (or latent class) models and factor models; (ii) graded membership models assume typologies but allow varying degrees of membership in these; and (iii) network models posit dynamic systems that allow sudden, typology–like state transitions in some individuals to coexist with gradual, continuous transitions in others (Borsboom et al., 2016). The Big Five traits were derived from cross–sectional between–individual differences, which may not correspond to personality processes within individuals (Asendorpf, 2002; Cramer et al., 2012; Molenaar & Campbell, 2009). While novel psychometric tools and emerging longitudinal data hold much promise for personality research when properly applied, they do not lift the risk of confounded assumptions and, in isolated applications, may even increase it. Risk of misinterpretation can be minimized (i) by understanding the distributional implications of the models, (ii) by comparing sufficiently many models so that a range of implied distributions are covered, and (iii) by examining absolute fit of the model. An anonymous reviewer also suggested a solution to the cluster relabelling problem: if a systematic relabelling method is applied, it can be also repeatedly applied to simulated data without true clusters thereby creating a ‘null’ distribution; then any ‘true’ cluster means are required to differ from that null distribution (an idea reminiscent of Horn's parallel analysis criterion; Horn, 1965).
Much of the discussion on psychometric choices is actually about natural order of things or about aetiology, which is probably why Asendorpf et al. (2001) entitled their RUO–typology paper using the phrase ‘carving personality description at its joints’; an obvious reference to Plato's classic metaphor of ‘carving nature at its joints’. For purposes of natural science, ‘Occam's razor’ is a frequently applied ‘carving tool’. The maxim states that if one can explain a phenomenon without assuming this or that hypothetical entity, then there are no grounds for assuming it (Russell, 1945, p. 472). Although most would intuitively agree that multiple distributions (correlated or not) represent more entities than a single correlated distribution, rigorous mathematical (Bayesian and information theoretic) justifications exist as well (Cover & Thomas, 2006; MacKay, 2003). In this sense, typologies should be discarded in favour of dimensional representation when exchangeable in terms of fit. This does not deny potentially useful purposes for typologies, such as their cognitive ergonomy when treating high–dimensional phenomena, or their utility in making a decision between treating and not treating a patient. However, the potential benefits of using typologies should be weighed against potential losses in the form of frustrating the scientific progress (Borsboom et al., 2016; Kotov et al., 2017) and in terms of statistical bias and loss of power (Maxwell & Delaney, 1993; Royston et al., 2006; van der Sluis et al., 2013).
In conclusion, this study demonstrated that a simple multivariate normal distribution with the Big Five correlation structure is sufficient to generate the RUO types when a researcher forces for three clusters and relabels them according to their resemblance with previous findings, as is commonly carried out. It was also shown that the clusters replicable in the IPIP open–access data via such means could not be found after applying a linear transformation that removes correlations but no other types of clustering. Formal comparison of alternative model–based clustering solutions would be a principled way to detect genuine normally distributed clusters despite correlations in the data, but even there, a careful power analysis for establishing sufficient sample size is advisable. Sometimes researchers have forced solutions with other number of clusters than that supported by model–selection criteria, and we showed that in such case, even model–based clustering may support replicable but non–existent RUO types. It remains to be shown by explicit model comparison and/or theoretical argumentation if personality types provide any practical advantages over continuous scores as models of natural reality (methods for making a choice between treating and not treating are likely to remain important in clinical work).
Declaration of conflict of interest
The authors declared no potential conflicts of interest with respect to the research, authorship, and/or publication of this article.
Acknowledgements
We thank Dr Fartein Ask Torvik for valuable feedback and the Emil Aaltonen Foundation (Emil Aaltosen Säätiö) for financial support of the manuscript preparation. The sponsor had no role in writing of the manuscript, design of analyses, or decision to submit the manuscript for publication.
Supporting info item
Supporting info item, per2117-sup-0001-Data_S1 - A Parsimonious Explanation of the Resilient, Undercontrolled, and Overcontrolled Personality Types
Supporting info item, per2117-sup-0001-Data_S1 for A Parsimonious Explanation of the Resilient, Undercontrolled, and Overcontrolled Personality Types by Rosenström Tom, Jokela Markus and Kandler Christian in European Journal of Personality
Data S1
Supporting info item
Footnotes
Among other methods, Akaike's information criterion (AIC) has been used to select for the correct number of clusters in a cluster analysis (Alessandri et al., 2014). Although selecting number of clusters was not a topic of this study, we demonstrate here using AIC as an example that the model–based and ad hoc clustering methods diverge with respect to it, despite providing qualitatively similar results when using the same number of clusters. Alessandri et al. (2014) defined AIC for cluster models according to Burnham and Anderson (2004). They examine rescaled AIC values
To illustrate the differences of model–based clustering and the heuristic, spherical cluster methods (k–means and Ward's clustering), we simulated one more dataset exactly as in Figure 2, only with 10 000 observations to minimize sampling variation in AIC estimates. Figure 3 shows AIC for heuristic and model–based methods. As evident, the heuristic methods would suggest two clusters to accommodate the spherical cluster assumption with the elliptic/correlated data, whereas the model–based clustering method that estimates also the cluster correlations correctly suggests only a single–cluster model.
References
Supplementary Material
Please find the following supplemental material available below.
For Open Access articles published under a Creative Commons License, all supplemental material carries the same license as the article it is associated with.
For non-Open Access articles published, all supplemental material carries a non-exclusive license, and permission requests for re-use of supplemental material or any part of supplemental material shall be sent directly to the copyright owner as specified in the copyright notice associated with the article.