
Abstract
The Dictator Game, a face valid measure of altruism, and the Trust Game, a face valid measure of trust and trustworthiness, are among the most widely used behavioural measures in human cooperation research. Researchers have observed considerable covariation among these and other economic games, leading them to assert that there exists a general human propensity to cooperate that varies in strength across individuals and manifests itself across a variety of social settings. To formalize this hypothesis, we created an S–1 bifactor model using 276 participants’ Dictator Game and Trust Game decisions. The general factor had significant, moderate associations with self–reported and peer–reported altruism, trust, and trustworthiness. Thus, the positive covariation among economic games is not reducible to the games’ shared situational features. Two hundred participants returned for a second session. The general factor based on Dictator Game and Trust Game decisions from this session did not significantly predict self–reported and peer–reported cooperation, suggesting that experience with economic games causes them to measure different traits from those that are reflected in self–assessments and peer–assessments of cooperativeness. © 2018 European Association of Personality Psychology
Introduction
Economic games in which participants make decisions about whether to share money with anonymous strangers have revolutionized researchers’ understanding of human cooperation (Baumard, André, & Sperber, 2013; Bowles & Gintis, 2011; Camerer, 2003). Recently, scholars have reported strong covariation among different economic game paradigms (Peysakhovich, Nowak, & Rand, 2014; Yamagishi et al., 2013). Does this covariation reflect the fact that individual differences in a single trait underlie individual differences in many different types of cooperative behaviour? To answer this question, we assessed whether the variance common to different economic games is associated with different cooperative traits—altruism, trust, and trustworthiness—measured using different methods—self–report, peer–report, and charitable behaviour.
The Dictator Game and Trust Game
The Dictator Game (DG; Forsythe, Horowitz, Savin, & Sefton, 1994; Kahneman, Knetsch, & Thaler, 1986) and the Trust Game (TG; Berg, Dickhaut, & McCabe, 1995) have had an especially strong influence on many scholars’ views of people's willingness to cooperate with non–kin. The DG involves two participants—a ‘Dictator’ and a ‘Recipient’. The Dictator is given a monetary endowment and decides whether to send money to the Recipient; the Recipient, in contrast, has no endowment and does nothing other than receive the Dictator's monetary transfer, which he or she retains as income. The game is typically played anonymously and for one round only. Dictators on average transfer around 30% of their endowment (Engel, 2011). Some researchers (e.g. Andreoni & Miller, 2002; Edele, Dziobek, & Keller, 2013) view transfers in the DG as an indication of altruism, whereas other researchers (e.g. Camerer & Thaler, 1995; Fehr & Schmidt, 1999) view transfers as reflective of fairness.
The TG also involves two participants—a ‘Truster’ and a ‘Trustee’—both of whom start the game with endowments of the same amount. The Truster can transfer money to the Trustee, and any money transferred is multiplied by a constant before being deposited in the Trustee's account (we dub this decision TGsend). Next, the Trustee decides how much of the money that he or she received to send back to the Truster (we dub this decision TGreturn). Positive transfers from the Truster are usually interpreted as a measure of trust because the Truster benefits from transferring money only if the Trustee chooses to return to the Truster more money than he or she originally sent to the Trustee. Likewise, return transfers in the TG are typically interpreted as indicative of trustworthiness because the Truster has no recourse if the Trustee chooses not to return any money (Berg et al., 1995; Camerer, 2003; Johnson & Mislin, 2011). Typically, Trusters transfer roughly half of their endowments, and Trustees return a little more than a third of the multiplied proceeds to the Truster (Johnson & Mislin, 2011). In a typical set–up, money transferred to the Trustee is multiplied by three. Consequently, a return of more than a third of money received by the Trustee makes the Truster better off than if he or she had never transferred money in the first place.
Is cooperativeness context–specific?
Labelling the DG, TGsend, and TGreturn as measures of altruism, trust, and trustworthiness, respectively, implies that each game has unique features that evoke psychological processes that are not operative in other games. Recently, researchers have tested whether decisions in various economic games are also reflective of a construct that is operative across many cooperative situations (Baumert, Schlösser, & Schmitt, 2013; Blanco, Engelmann, & Norman, 2010; Brocklebank, Lewis, & Bates, 2011; Haesevoets, Folmer, & Van Hiel, 2015; Yamagishi et al., 2013). Peysakhovich et al. (2014) provided a representative example. In their study, 576 participants played one round each of four ‘cooperation’ games: the DG, TGsend, TGreturn, and a fourth game called the Public Goods Game in which participants increase the size of a public monetary fund when they spend money from their own individual endowments. To test for discriminant validity, Peysakhovich et al. (2014) also had participants play one round each of a series of ‘punishment’ games. The authors conducted an exploratory factor analysis and found that decisions in cooperation games loaded on one factor while decisions in punishment games loaded on a second factor.
From these data, Peysakhovich et al. (2014) concluded ‘that there is a domain–general and temporally stable inclination towards paying costs to benefit others, which we dub “the cooperative phenotype” ’ (p. 1). They also added the important caveat that the cooperation games are not interchangeable: ‘Note that we do not argue that these cooperation games are entirely driven by just [a] single motivation: for example, some games are influenced by expectations about others’ behaviour or preferences for reciprocity, equity and/or efficiency, while others are not. Our key result is that a substantial shared input to each of the cooperation decisions appears to be a domain–general trait of prosociality’ (p. 3). What Peysakhovich et al. (2014) imply here is that unique situational elements of each game have an influence on the extent to which people decide to take action that benefits their interaction partner. For instance, perhaps whether cooperative preferences manifest in the TGsend depends on individual differences in the belief that the Trustee is also cooperative (Thielmann & Hilbig, 2014).
Unfortunately, the nuanced thesis that Peysakhovich et al. (2014) endorse implies a measurement model—the bifactor model (Reise, 2012)—that they did not fit to their data. The bifactor model is a structural equation model that specifies that the covariance among a set of measurements is the joint product of (i) a ‘general’ latent variable that directly causes scores on the measurements and (ii) multiple ‘specific’ factors, which are latent variables that cause the residual covariances among subsets of measurements with similar content (Reise, 2012). The appropriate type of bifactor model for studies in which all participants complete a set of related measures is the S–1 bifactor model (Eid, Geiser, Koch, & Heene, 2017). The S–1 bifactor model treats one subset of indicators as the reference domain for the general factor, causing the general factor to represent the true–score variance of the reference domain's first indicator. Whereas the indicators from the reference domain do not also load on a specific factor, the other subsets of indicators load both on the general factor and on their own specific factor. The general factor is not allowed to correlate with the specific factors, but the specific factors may correlate with each other. The general factor is interpreted as the core construct (e.g. altruistic motivation), while the specific factors represent either narrow sub–constructs (e.g. a desire to help needy others vs. a desire to respect others’ wishes) or methodological factors (e.g. the type of situation in which helping occurred). To fit an S–1 bifactor model, researchers must have at least three indicators per specific factor; because Peysakhovich et al. (2014) had participants play only one round of each game, it would not have been possible for them to identify an S–1 bifactor model.
Are cooperation games narrow or broad?
Even if cooperation game behaviour adheres to an S–1 bifactor model, it would remain an open question whether the general factor reflects the operation of the single cognitive system that guides decision–making in most cooperation situations. The positive covariance among cooperation games could instead be caused by a cognitive system that is uniquely responsive to the features that the games have in common, such as windfall endowments, anonymous interaction partners, or limited prospects for future interaction. Researchers can distinguish between these two possibilities by estimating the generalizability of individual differences in cooperation game behaviour. If game–specific features are solely responsible for correlations among cooperation games, then game behaviour should succeed in predicting cooperative behaviour only in other game–like situations. But if the shared variance among cooperation games represents a broad trait to some extent, then cooperation games should predict cooperative behaviour even in very different settings, such as repeated interactions involving earned resources with known others (Baumert et al., 2013).
To demonstrate that the common variance among economic games represents a broad trait, Peysakhovich et al. (2014) reported that an average of participants’ transfer decisions in the DG, TGsend, TGreturn, and Public Goods Game predicts self–reported endorsement of cooperation values, which are presumably relevant to all situations in which people could cooperate. However, the authors did not observe a correlation between average cooperation in the games and self–reports of past cooperative behaviour, raising the possibility that the shared variance among cooperation games may have limited relevance in everyday life. This null finding is not unique to Peysakhovich et al. (2014): Many authors have noted conspicuously low relationships between cooperation games and non–game measures of putatively similar traits (Galizzi & Navarro–Martínez, 2018; Glaeser, Laibson, Scheinkman, & Soutter, 2000; Gurven & Winking, 2008), leading Voors, Turley, Kontoleon, Bulte, and List (2012, p. 310) to wonder, ‘perhaps a general cross–situational preference for pro–social behavior does not exist?’
A less sceptical explanation for why individual differences in game cooperation have low generalizability is that error variance and variance specific to particular games attenuate the associations between cooperation games and non–game measures. To address this issue, researchers could partial out error variance by creating a latent variable of economic game behaviour and partial out game–specific variance using an S–1 bifactor model. However, even if the shared variance among cooperation games was measured without error, it would still predict non–game cooperation only modestly in the likely scenario that it reflects a broad trait to only a limited extent. Personality psychologists have noted that single behaviours must be aggregated with many other trait–relevant behaviours enacted in dissimilar situations before they can reliably predict how a person will behave in general (Clark & Watson, 1995; Epstein & O'Brien, 1985; Rushton, Brainerd, & Pressley, 1983). Because a composite of cooperation games aggregates similar behaviour across only similar situations, it is likely that only a sliver of variance from the composite represents a broad trait. The variance specific to the game situation and the variance specific to the non–game measures limit the strength with which this sliver of variance can correlate with non–game measures of cooperation (Ahadi & Diener, 1989).
Even when cooperation games do predict self–reported cooperation (for a review, see Zhao & Smillie, 2015), one could argue that cooperation games and self–report questionnaires present similar situations. Both measurement methods, for example, might evoke socially desirable responding among participants who have a desire to appear moralistic in study settings (Hoffman, McCabe, & Smith, 1996; Paulhus & John, 1998). If so, then participants who wish to save face will both share money in cooperation games and report possessing cooperative traits on self–report questionnaires, even if they do not typically behave cooperatively. One way to circumvent self–presentation concerns that are activated while participating in a study is to use the judgments of peer informants as criterion measures. Especially when aggregating among multiple, well–acquainted peers, peer–reports are often more accurate predictors of behaviour than are self–reports, presumably because the former are not contaminated by participants’ self–presentation concerns (Kolar, Funder, & Colvin, 1996). Recently, Thielmann, Zimmermann, Leising, and Hilbig (2017) found that peer–reports of fairness have incremental validity beyond self–reports in predicting DG transfers, a proof of concept that peer–reports can add value to the human cooperation literature.
The present study
In the present study, we assessed the external validity of the DG, TGsend, and TGreturn by testing whether their common variance reflects individual differences in a trait that is active across a number of different contexts in which people may behave cooperatively. To do so, we assessed the viability of an S–1 bifactor model representing participants’ decisions in several rounds of the DG, TGsend, and TGreturn. Next, we used the general factor of cooperative behaviour that emerged from the S–1 bifactor model to predict self–reports and peer–reports of several different facets of cooperativeness—altruism, trust, and trustworthiness. If the covariation among cooperation games reflects a broad individual difference variable that correlates with many different types of cooperative behaviour, we reasoned then that the general factor should predict self–reports and peer–reports of altruism, trust, and trustworthiness.
Methods
Recruitment
We recruited 221 University of Miami students and 55 community members of Miami–Dade county (191 women; Mage = 21.67, SDage = 7.47). The descriptive statistics for behaviour in each of the cooperation games (Table 1) is consistent with meta–analytic estimates from similar populations (Engel, 2011; Johnson & Mislin, 2011), indicating that our sample is likely representative of the population from which they were sampled. We are not aware of any systematic influence that the populations from which we sampled would have on results, other than that university students have been found to transfer less in the DG and return less in the TG than other adults (Engel, 2011; Johnson & Mislin, 2011).
Descriptive statistics of measures analysed in present study
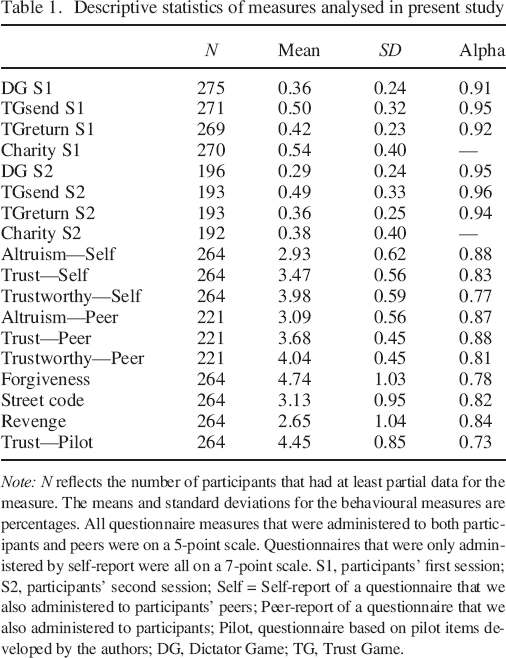
Note: N reflects the number of participants that had at least partial data for the measure. The means and standard deviations for the behavioural measures are percentages. All questionnaire measures that were administered to both participants and peers were on a 5–point scale. Questionnaires that were only administered by self–report were all on a 7–point scale. S1, participants’ first session; S2, participants’ second session; Self = Self–report of a questionnaire that we also administered to participants’ peers; Peer–report of a questionnaire that we also administered to participants; Pilot, questionnaire based on pilot items developed by the authors; DG, Dictator Game; TG, Trust Game.
Our sample size allowed us to detect medium–sized effects (r = 0.17) with 80% power. In addition, sample sizes larger than 250 yield correlations that (i) have stabilized within a tolerable degree of uncertainty (Schönbrodt & Perugini, 2013) and (ii) provide a reasonable basis for specifying the structural equation models of present interest (Wolf, Harrington, Clark, & Miller, 2013). To qualify for the study, participants had to provide the e–mail addresses of five people who knew them well enough to complete personality questionnaires about them, whom we contacted after participants had completed both sessions (or after it was clear that they would not attend a second session). Participants were offered a $10 show–up payment for each session they attended, in addition to opportunities to earn more money during the study sessions. We stopped collecting data after we had achieved our planned sample size of having 200 participants return at least a week later to complete the behavioural measures (i.e. the DG, TGsend, TGreturn, and charitable donations), but not the self–report measures, again. Correlations and mean differences between decisions made during the first and second sessions are reported in the companion paper to this manuscript (McAuliffe, Forster, Pedersen, & McCullough, 2018). The results we report in the succeeding text are from participants’ first session. However, as a robustness check, we also report how results differ when using the behavioural data from participants’ second session. Our data collection plan and protocol were preregistered at https://osf.io/siqyz/.
Procedure
The study took place over 55 laboratory sessions, each with four to 14 participants (M = 8.75, SD = 2.26). Participants were each seated in a private cubicle with a computer. They wore headphones to hear audio recordings of the instructions, which were simultaneously displayed in text. The protocol was run through a computer script using E–Prime (Schneider, Eschman, & Zuccolotto, 2002); the scripts are available here: https://osf.io/6n3yq/. The measures are described in the succeeding text in the order that they were administered. See Table 1 for descriptive statistics and the Supporting Information for histograms of all measures analysed in this paper. Items from the questionnaire measures can be viewed here: https://osf.io/g5cxj/.
Cooperation games
Participants were told that they were going to play some games involving real money with the other participants. Furthermore, participants learned that all game decisions would be anonymous and that they would play any given game with a specific partner only once. Participants were then given instructions about how to play the DG (which was described as ‘Game 1’ to the participants). Participants were told that they would play multiple rounds of the DG as Decision–Maker (although they were not told how many). They also learned that they would be Recipients of other participants’ decisions, although they would not observe the outcome of these rounds. Finally, participants were told that Recipients would not receive feedback on how much money they received after each round but instead would learn how much they had earned over the course of all the games after they had completed the session.
Participants played six rounds of the DG. In these games, the Dictator had an endowment of $0.50 in the first, second, and fifth rounds and $1.00 in the third, fourth, and sixth rounds. Transfer options ranged between $0.00 and the endowment amount in $0.05 increments. Endowments differed between rounds to attenuate the extent to which shared variance among different rounds would reflect making a sharing decision with a certain amount of money. We also believed that changing the endowment amount would reduce residual correlations among the games by reducing the extent to which participants viewed each decision as equivalent.
Participants then learned how to play the TGsend (referred to as ‘Game 2’ in the experiment), which involved a ‘First Mover’ (the Truster) and a ‘Second Mover’ (the Trustee), both of whom received equal endowments (see in the succeeding text). Participants were told that they would play multiple rounds of the game (although not how many) as the First Mover. Participants were also told that Second Movers would be allowed to transfer only money that they received, not money from their original endowment.
Participants played six rounds of the TGsend. The Truster had an endowment of $0.40 in the first round, $0.80 in the second round, $0.60 in the third round, $0.30 in the fourth round, $0.70 in the fifth round, and $0.50 in the sixth round. Transfer options ranged between $0.00 and the endowment amount in $0.05 increments. Transfers from the Truster were multiplied by three before being put in the Trustee's account.
After participants had made six decisions as First Mover, they were told that they had subsequently been assigned to serve as Second Movers for six different First Movers who had made decisions as they had been making their own decisions as First Movers. Participants then proceeded to complete each of those six rounds as Second Mover. In cases where the First Mover had not transferred any money to them, the screen merely reported this outcome, and participants moved on to the next round.
The raw scores for the TGreturn are not comparable across participants because different participants started with different amounts of money. Thus, we transformed all raw scores to percentages. We found that a logit transformation made the TGreturn data less normal, so we analysed raw percentages instead. A Shapiro–Wilks test revealed that the TGreturn percentage distribution departed from normality, but not severely, W = 0.981, p < 0.001.
We took several steps to follow best practices for collecting economic game data. Consistent with norms in experimental economics, the study did not involve any deception. During the 10 sessions in which fewer than seven participants were present, we told participants either that some of their interactions would be repeated (but that they would not know which ones) or that some of their interactions would be with a research assistant who was making random decisions (although that they would not know which ones those were). We assessed the robustness of models in which cooperation games predicted scores on questionnaire measures by rerunning them without data from participants who attended a session that had fewer than seven participants present. No qualitative differences were found (see the R code to run these models). To prevent participants from clicking through the instructions without paying attention, the computer program did not allow participants to continue through the instructions until the audio recording of the instructions had ended. Also, participants watched an example round of each game after they had read the instructions for that game. Last, to minimize error variance from accidental clicks or failures of comprehension, the program did not automatically enact participants’ transfer decisions. Instead, participants were shown the monetary consequences of their transfer decisions and were then forced to confirm that they indeed wanted the presented outcomes for themselves and the interaction partner.
Self–report measures
Participants who were attending their first session also completed several self–report questionnaires. The first questionnaire was a random selection of 20 items from the Big Five Inventory (John, Donahue, & Kentle, 1991). The goal in including these items was to use factor analysis to derive a measure of response acquiescence. Analyses involving these items will be reported in a different paper.
We sought to measure trait trustworthiness with McCullough, Swartwout, Shaver, Carter, and Sosis's (2016) modified version of Evans and Revelle's (2008) propensity to trust scale, which retained the seven items that McCullough et al. found to have the highest item–total score correlations. Responses were measured on a 5–point rating scale (1 = strongly disagree, 2 = disagree, 3 = neither agree nor disagree, 4 = agree, 5 = strongly agree). Example items include ‘I would never cheat on my taxes’ and ‘I listen to my conscience’.
We sought to measure trait trust with the Trust facet of the NEO personality inventory (Costa, McCrae, & Dye, 1991), which contains 10 items measured on a 5–point rating scale (1 = strongly disagree, 2 = disagree, 3 = neither agree nor disagree, 4 = agree, 5 = strongly agree). Example items include ‘I trust what people say’ and ‘I suspect hidden motives in others’ (reverse–coded).
We sought to measure trait altruism with the self–report altruism scale (Rushton, Chrisjohn, & Fekken, 1981), a 20–item act–frequency scale. Participants indicated how often they have engaged in various prosocial acts on a 5–point rating scale (1 = never, 2 = once, 3 = more than once, 4 = often, 5 = very often). Example items include ‘I have done volunteer work for a charity’ and ‘I have helped an acquaintance move households’. For one item, ‘I have given a stranger a lift in my car’, we allowed to participants to indicate if they did not have a car; if they so indicated, we considered their data missing for that item. This self–report altruism scale is similar to the cooperation behaviour measure used by Peysakhovich et al. (2014).
Next, participants completed items related to demographics. In addition to asking about gender and age, several items ask about participants’ childhood neighbourhood. Analyses relating to childhood environment will be reported in a different paper.
We also included three questionnaires, all utilizing a 7–point rating scale (1 = strongly to 7 = strongly agree) that tap ‘transgression attitudes’ or how people react to transgressors who harm them. Their inclusion allows us to test whether the cooperation games reflect facets of cooperation other than the constructs they were intended to measure—namely, altruism, trust, and trustworthiness. The first measure reflects revenge attitudes and contains seven items (e.g. ‘If someone treats me badly, I feel I should treat them even worse’) from previously published scales (Brezina, Agnew, Cullen, & Wright, 2004; Eisenberger, Lynch, Aselage, & Rohdieck, 2004). The second questionnaire contains 10 items aggregated from multiple sources (Brezina et al., 2004; Eisenberger et al., 2004; Stewart, Schreck, & Simons, 2006) and measures endorsement of ‘street code’ beliefs (e.g. ‘Sometimes, you have to fight to uphold your honor or put someone in his or her place’). The third scale included seven items about attitudes toward forgiveness (Berry, Worthington, O'Connor, Parrott, & Wade, 2005) such as ‘I try to forgive others even when they don't feel guilty for what they did’.
The revenge, forgiveness, and street code items were intermixed with 10 additional items on trust that we developed (e.g. ‘I feel I can depend on most people I know’), measured on a 7–point rating scale (1 = strongly to 7 = strongly agree). Because the scale is not validated and we did not have peer informants complete it (see in the succeeding text), we refer to it as the ‘pilot trust’ scale. All references to self–reported trust refer to the NEO facet scale unless explicitly noted otherwise. We do utilize the pilot trust scale in the exploratory section of the Results section, however. Its inclusion allows us to test whether our conclusions about trust generalize to self–reported indicators of trust other than the NEO items, an assumption that is typically not tested but is necessary for drawing conclusions about the construct of interest (Hilbig, Moshagen, & Zettler, 2016). See the Supporting Information for analyses involving transgression attitudes and the pilot trust measure.
Charitable giving
After completing the self–report measures, participants were shown how much they had earned from the cooperation games. They then learned that they would watch videos from three different charities and that after each video, they would have the opportunity to donate as much money from their game earnings (but not their show–up payment) as they wished (in $0.05 increments) to each of the three charities. The charity videos were from Oxfam, Feeding America, and International Rescue Committee, were each about two minutes long, and were presented in random order. Because participants knew up front that how much money they would have in later donation decisions would depend on their previous donation decisions, we did not regard the three charitable donation decisions as statistically independent. Instead, we created charitable giving scores for each participant by computing the percentage of their total earnings that they donated to charity (regardless of which charity or charities they chose to benefit). We logit–transformed these charity percentage scores, which improved their normality. We included this charitable giving measure to study the extent to which cooperation game decisions generalize to a situation that features needy beneficiaries but is otherwise similar.
Participants alerted a research assistant when they completed the study. Then, they were clandestinely awarded the amount of earned money they had chosen not to donate to the three charities, rounded up to the nearest dollar, plus the $10 show–up payment. We donated the money that participants had allotted to each charity in lump sums after the study was completed. In total, participants donated $2978 to charity.
Peer–report measures
After each participant had completed his or her laboratory sessions, we sent e–mails to the participant's five nominated informants with an offer of a $5.00 Amazon.com gift card for completing a set of standard personality questionnaires about the participant who had nominated him or her. The e–mail included a link to a Qualtrics survey that included the self–report measures of altruism, trust, and trustworthiness, re–worded to refer to the participant in the third person (e.g. ‘He/she distrusts people’). On the peer version of the self–report altruism scale, peers could indicate ‘I don't know’ (which we treated as missing data) if they were not at all confident in making a judgment about the frequency of the target's helping behaviour. Five hundred eighty–seven peer informants (221 family members, 316 friends, 36 romantic partners, and 14 other acquaintances) completed the questionnaires. On average, participants had 2.13 peer informants (SD = 1.51); 55 participants did not have any peer informants. We averaged across informants to obtain each item score.
Results
All analyses were conducted using the lavaan (Rosseel, 2012) and psych (Revelle, 2017) packages in R version 3.1.2 (R Core Team, 2014). See the Supporting Information for a discussion of the discrepancies between the reported analyses and the preregistered analyses. The data (https://osf.io/jckvq/) and the syntax (https://osf.io/5zuq7/) can be found on the Open Science Framework. All tests were two–tailed with an alpha value of 0.05.
In all analyses, we used maximum likelihood estimation with robust standard errors (Huber–White) and a scaled test statistic (asymptotically equal to the Yuan–Bentler test statistic). We used full information maximum likelihood estimation to handle missing data. See the Supporting Information for evidence that the use of full information maximum likelihood estimation is appropriate for the present data.
Do the cooperation games predict non–game cooperation?
No. Before assessing the viability of a general cooperation factor, we examined whether we could find evidence that a common trait underlies different types of cooperative behaviour even when modelling the DG, TGsend, and TGreturn separately. We estimated the zero–order associations among all our cooperation measures by creating latent variables for each of the cooperation games, self–reports, and peer–reports. We could not estimate zero–order correlations between charitable giving and other variables simply by creating a latent variable because we did not have enough statistically independent charitable giving observations. Instead, we included charitable giving as an observed variable and regressed each of the latent cooperation variables on it (see Table 2 for results).
Zero–order correlations between all measures of altruism, trust, and trustworthiness
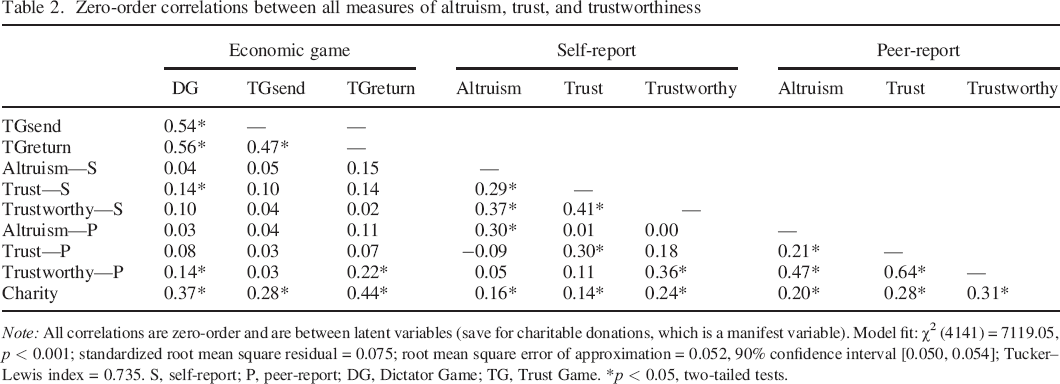
Note: All correlations are zero–order and are between latent variables (save for charitable donations, which is a manifest variable). Model fit: χ2 (4141) = 7119.05, p < 0.001; standardized root mean square residual = 0.075; root mean square error of approximation = 0.052, 90% confidence interval [0.050, 0.054]; Tucker–Lewis index = 0.735. S, self–report; P, peer–report; DG, Dictator Game; TG, Trust Game.
p < 0.05, two–tailed tests.
None of the economic game measures were consistently associated with the non–game measures. Indeed, the results do not even support the games’ face–valid score meanings: The DG did not significantly correlate with self–reported and peer–reported altruism (rs = 0.03–0.04), the TGsend did not significantly correlate with self–reported or peer–reported trust (rs = 0.04–0.10), and the TGreturn did not correlate with self–reported trustworthiness (r = 0.02), although it did correlate with peer–reported trustworthiness (r = 0.21). The games were all significantly correlated with charitable giving (rs = 0.27–0.44), but these correlations may represent shared situational variance (i.e. making a sharing decision in response to an experimenter's prompt in a one–shot, anonymous laboratory setting). On the positive side and consistent with prior research (Hubbard, Harbaugh, Srivastava, Degras, & Mayr, 2016), charitable giving had a significant, positive relationship with all economic game, self–report, and peer–report measures (rs ≥ 0.14), which provides some evidence that there exists a general tendency to behave cooperatively that transcends specific contexts. See the Supporting Information for evidence that charitable giving is also associated with transgression attitudes and the pilot trust measure.
Does an S–1 bifactor model provide adequate fit to economic game data?
Yes. We first assessed the fit of the simplest model possible—a one–factor model (Figure 1)—using confirmatory factor analysis. Although Peysakhovich et al. (2014) appeared to endorse a bifactor model, a well–fitting one–factor model would also be consistent with the existence of a broad trait of cooperativeness. The fit of the one–factor model was inadequate, χ2 (135) = 1123.44, p < 0.001; standardized root mean square residual (SRMR) = 0.170; root mean square error of approximation (RMSEA) = 0.163, 90% confidence interval (CI) [0.156, 0.170]; Tucker–Lewis index (TLI) = 0.587.
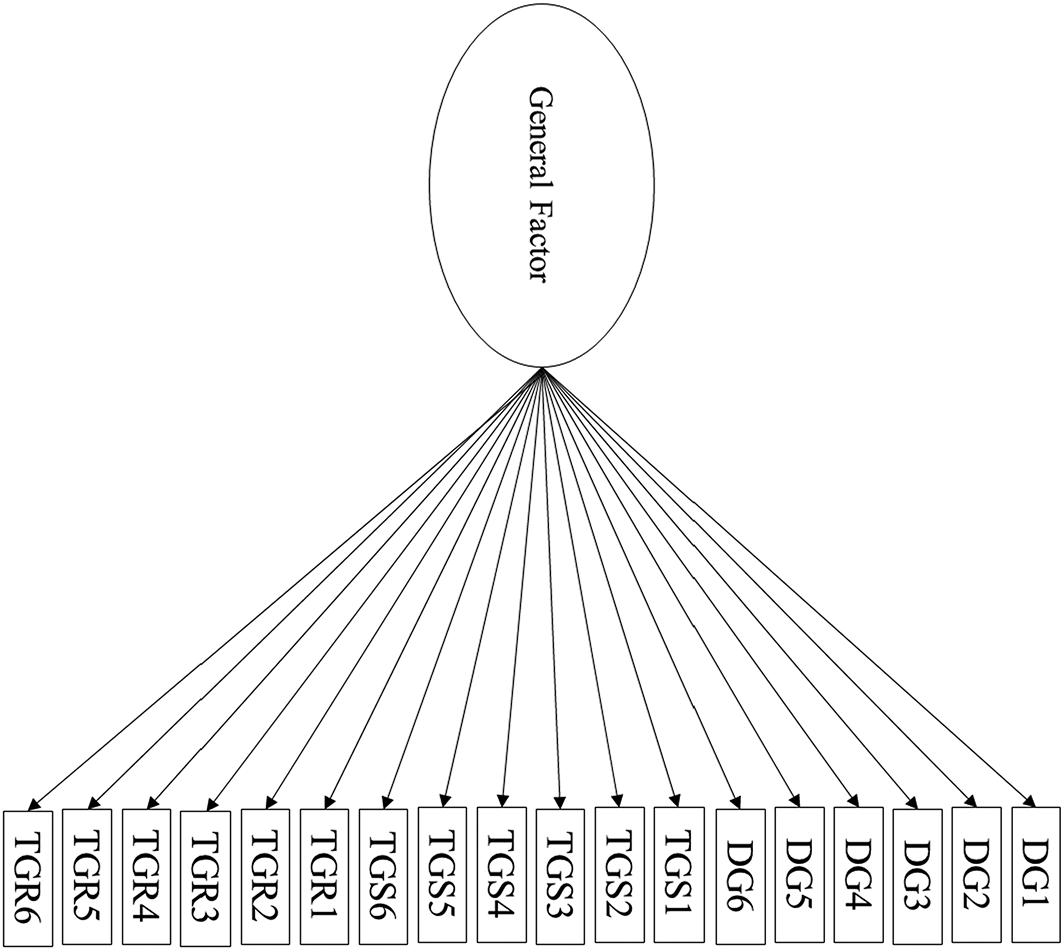
One–factor model of economic games. All factor loadings, variances, and admissible correlations are estimated, but not shown here.
We then conducted a minimal residual exploratory factor analysis with an oblimin rotation to determine how many factors would be required to achieve a balance of good fit and parsimony (Fabrigar, Wegener, MacCallum, & Strahan, 1999). It was necessary to extract three factors from an exploratory factor analysis to achieve adequate fit, χ2 (201) = 235.450, p < 0.001; RMSR = 0.02; RMSEA = 0.071, 90% CI [0.057, 0.080]; TLI = 0.957. We then used parallel analysis with 1000 simulated data sets to assess how many factors to extract (O'Connor, 2000). Three eigenvalues accounted for significantly more variance than randomly generated eigenvalues (Figure S1), suggesting that there are three substantive factors.
Next, we used confirmatory factor analysis to create a three–factor model (Figure 2). Model fit was adequate, χ2 (132) = 174.32, p = 0.008; SRMR = 0.031; RMSEA = 0.034, 90% CI [0.021, 0.045]; TLI = 0.982. All items loaded highly on their respective factors in the three–factor model (0.78–0.94; all reported factor loadings are standardized). The factors correlated with each other strongly (rs = 0.53–0.63), consistent with the operation of a general factor that explains their covariance.
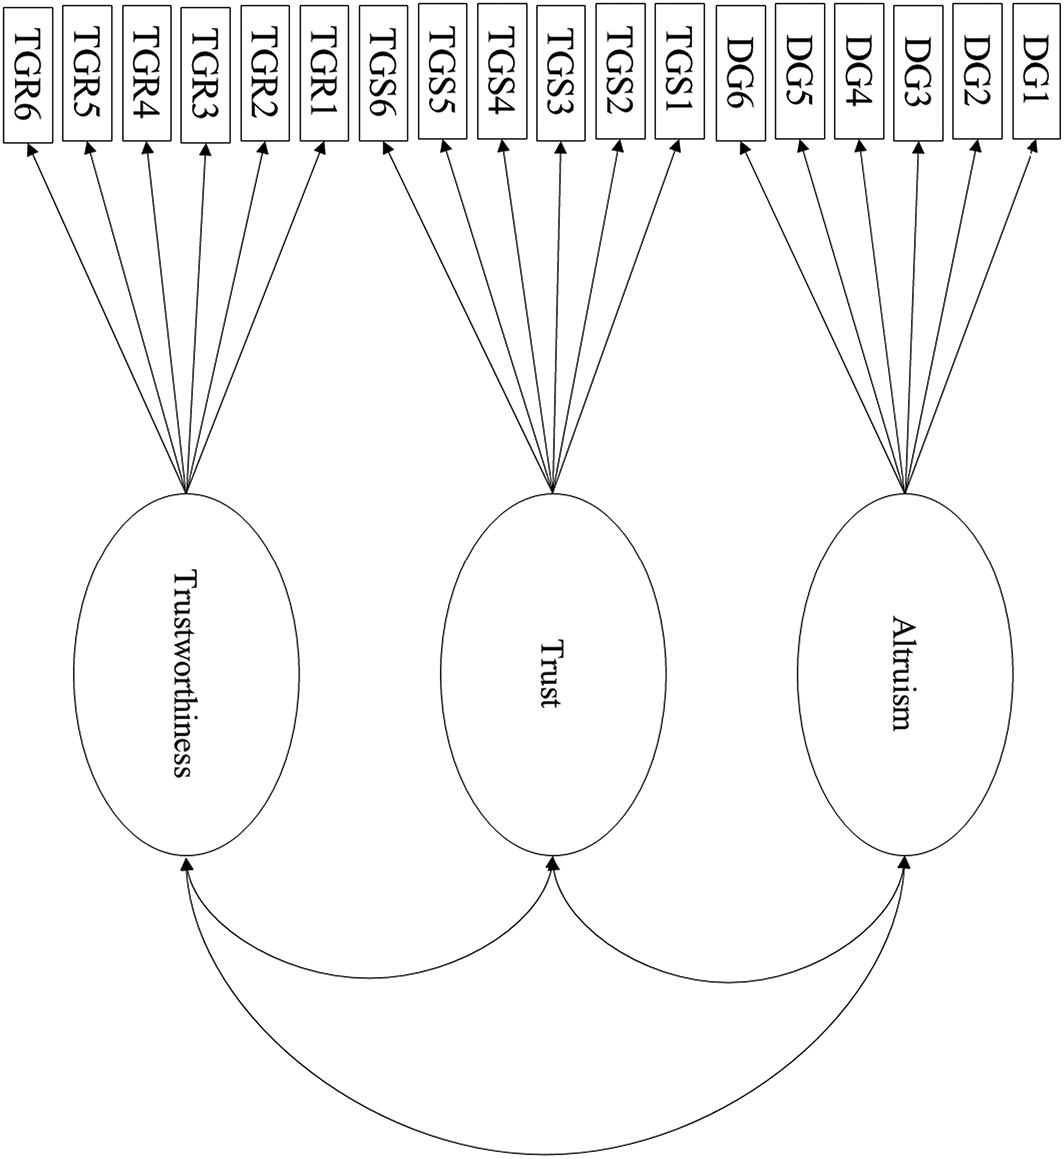
Three–factor model of economic games. All factor loadings, variances, and admissible correlations are estimated, but not shown here.
To achieve our goal of modelling the shared variance among the DG, TGsend, and TGreturn, we reparametrized the three–factor model using an S–1 bifactor model, which represents the general factor as the variance that one game shares with the other two games (Eid et al., 2017; Figure 3). Under reasonable parameter constraints, the S–1 bifactor model has the same model fit as its corresponding correlated factor model and identical fit regardless of which measure is chosen as the reference domain (Geiser, Eid, & Nussbeck, 2008). As stated previously, the S–1 bifactor model requires the selection of a reference domain, which defines the general factor and is not modelled with a specific factor. Because model fit could not distinguish a three–factor model from any bifactor S–1 model, we chose a reference domain based on which game most likely has the largest share of variance attributable to a broad cooperation trait. Of the three game situations, the TGreturn has relevance to the widest set of cooperation situations because considerations of reciprocity, equity, and equality all dictate compensating the Truster for risking his or her own endowment to create a mutual benefit. In the DG, in contrast, there is an obligation to share based on distributive justice, but this obligation is weakened by the fact that the random assignment to roles makes the inequality procedurally just. In the TGsend, people may receive praise for attempting to increase group welfare, but failures to do so are not generally met with disapprobation (Bicchieri, Xiao, & Muldoon, 2011). Consequently, we selected the TGreturn as the reference domain, χ2 (122) = 161.48, p = 0.010; SRMR = 0.028; RMSEA = 0.034, 90% CI [0.021, 0.046]; TLI = 0.982, and tested whether the general factor significantly correlates with individual differences on the questionnaire measures.
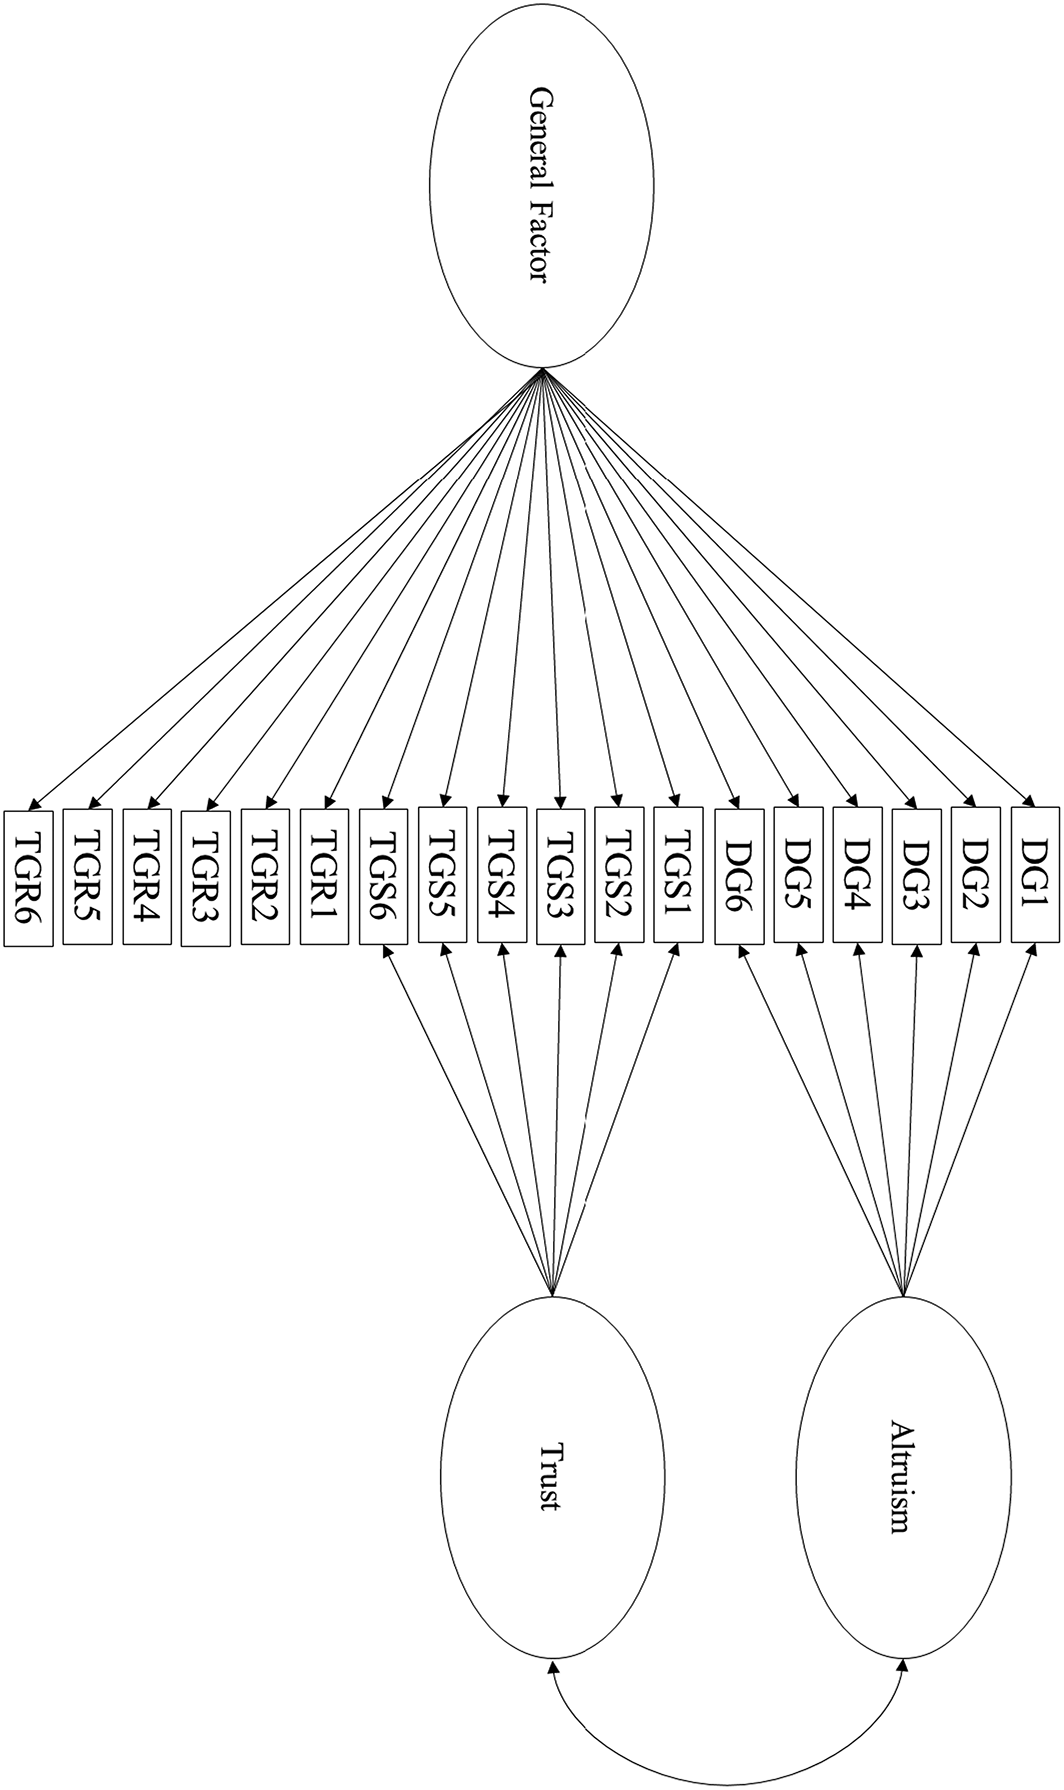
S–1 bifactor model of economic games. All factor loadings, variances, and admissible correlations are estimated, but not shown here.
Does the general factor predict non–game cooperation?
Yes. (See also the Supporting Information for analyses showing that the general factor was positively associated with the pilot trust measure, negatively associated with revenge motives and street code beliefs, but not associated with forgiveness.) A model in which the general factor predicted the self–reports and peer–reports of altruism, trust, and trustworthiness simultaneously did not converge, so we ran separate models for each type of outcome. See Table 3 for the model fit and regression estimates from each of these three models.
General factor from the first session predicting self–reported and peer–reported altruism, trust, and trustworthiness
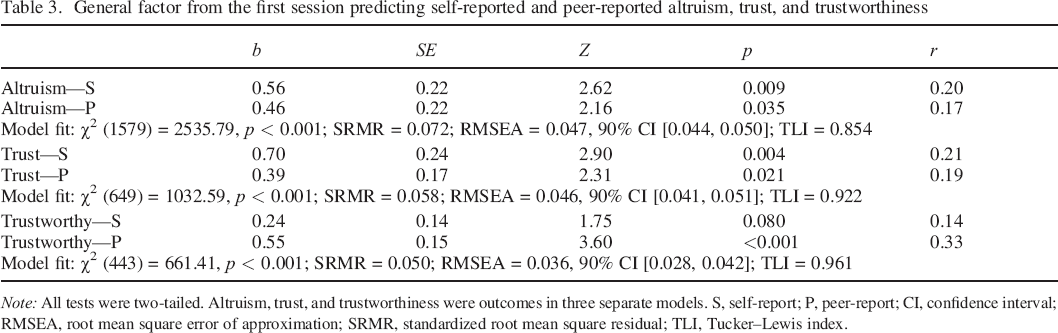
Note: All tests were two–tailed. Altruism, trust, and trustworthiness were outcomes in three separate models. S, self–report; P, peer–report; CI, confidence interval; RMSEA, root mean square error of approximation; SRMR, standardized root mean square residual; TLI, Tucker–Lewis index.
The general factor significantly predicted self–reported altruism (r = 0.20) and peer–reported altruism (r = 0.17). Adding the DG and TGsend specific factors as predictors in the regression models did not improve model fit, χ2 (4) = 0.40, p = 0.983, and neither of the group factors significantly predicted self–reported or peer–reported altruism. The general factor significantly predicted self–reported trust (r = 0.21) and peer–reported trust (r = 0.19). Adding the group factors to the regression model did not improve model fit, χ2 (4) = 1.43, p = 0.839, and none of the group factors significantly predicted any out of the outcomes. Finally, the general factor marginally predicted self–reported trustworthiness (r = 0.14) and significantly predicted peer–reported trustworthiness (r = 0.33). Adding the specific factors to the regression model did not improve model fit, χ2 (4) = 4.35, p = 0.361, and neither specific factor had a significant association with self–reported or peer–reported trustworthiness.
Did the general factor from the second session predict non–game cooperation?
No. If behaviour in cooperation games and charitable giving tasks reflect a temporally stable disposition, then behaviour from participants’ second session should evince the same associations with the questionnaire measures as did behaviour from the first session. If behaviour from participants’ first session does not reflect a stable disposition, however, then occasion–specific factors would explain the correlations between the behavioural measures and the self–report measures. (In contrast, situational factors specific to the first session should not be responsible for the associations between the behavioural measures and the peer–report measures, as the latter were completed by different people and were collected only after participants had completed their final session.) To explore the extent to which the associations we observed were specific to participants’ first session, we reran our analyses using the game and charitable giving decisions from participants’ second session.
First, we were interested in whether charitable giving decisions at participants’ second session would still predict the self–reports and peer–reports of altruism, trust, and trustworthiness (see Table 4 for model fit and results). As might be expected if situational influences were responsible for the relationships between charitable giving at the first session and the self–reports, charitable giving at the second session did not significantly predict self–reported altruism, trust, or trustworthiness (rs = −0.02–0.08). However, charitable giving also did not predict peer–reported altruism (r = 0.10) or trust (r = 0.07), which cannot be explained by situational influences common to participants’ first study session. Charitable giving did, however, still predict peer–reported trustworthiness (r = 0.25). Analyses presented in the Supporting Information show that charitable giving at the second session still predicted revenge motives and street code beliefs but did not predict forgiveness or the pilot measure of trust.
Charity from the second session predicting self–reported and peer–reported altruism, trust, and trustworthiness
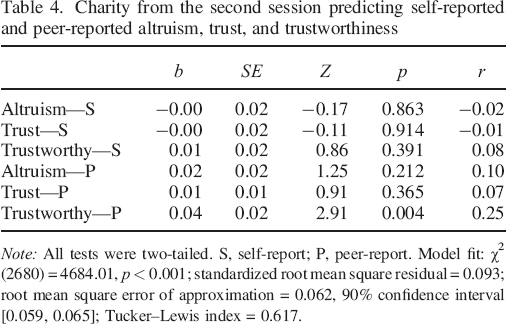
Note: All tests were two–tailed. S, self–report; P, peer–report. Model fit: χ2 (2680) = 4684.01, p < 0.001; standardized root mean square residual = 0.093; root mean square error of approximation = 0.062, 90% confidence interval [0.059, 0.065]; Tucker–Lewis index = 0.617.
Next, we confirmed that the S–1 bifactor model in the second session with the TGreturn as the reference domain still exhibited good approximate fit, χ2 (122) = 172.24, p = 0.002; SRMR = 0.026; RMSEA = 0.045, 90% CI [0.033, 0.057]; TLI = 0.971. We then assessed whether the general factor from the second session still predicted self–reported and peer–reported cooperation. Supplemental analyses reveal that the general factor was still negatively associated with revenge attitudes but had null associations with the pilot trust measure, street code beliefs, and forgiveness. See Table 5 for model fit and regression estimates from three structural equation models in which we regressed the altruism, trust, and trustworthiness measures, respectively, on the general factor.
General factor from the second session predicting self–reported and peer–reported altruism, trust, and trustworthiness
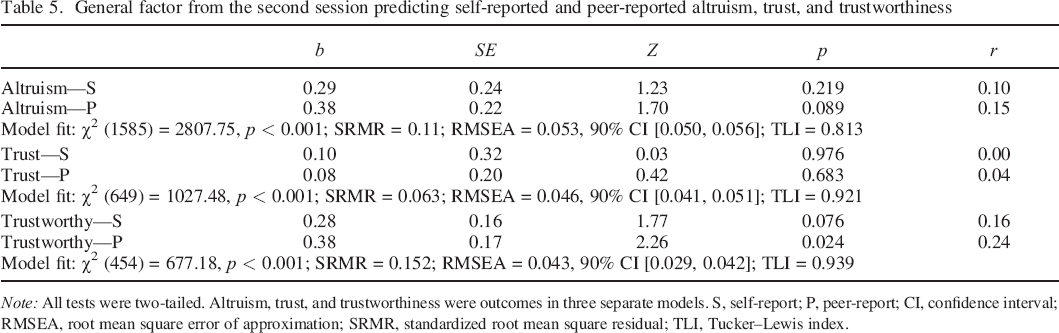
Note: All tests were two–tailed. Altruism, trust, and trustworthiness were outcomes in three separate models. S, self–report; P, peer–report; CI, confidence interval; RMSEA, root mean square error of approximation; SRMR, standardized root mean square residual; TLI, Tucker–Lewis index.
The general factor did not significantly predict self–reported altruism (r = 0.10) or peer–reported altruism (r = 0.15). Adding the DG and TGsend specific factors as predictors in the regression models did not improve model fit, χ2 (4) = 0.40, p = 0.983, and neither of the group factors significantly predicted any out of the outcomes. The general factor was not significantly associated with self–reported trust (r = 0.00) or peer–reported trust (r = 0.04). Finally, the general factor marginally predicted self–reported trustworthiness (r = 0.16) and significantly predicted peer–reported trustworthiness (r = 0.24). Adding the specific factors to the regression model improved model fit, χ2 (4) = 11.39, p = 0.022. The primary difference was that the DG specific factor significantly predicted peer–reported trustworthiness, r = 0.32, b = 0.49, SE = 0.16, Z = 3.09, p = 0.002, whereas the general factor became a non–significant predictor, r = 0.08, b = 0.12, SE = 0.17, Z = 0.47, p = 0.474.
Overall, neither the general factor nor charitable giving from participants’ second session replicated the associations between behaviour from the first session and the questionnaire measures. These findings could mean that the correlations between behaviour from participants’ first session and the self–reports were caused by occasion–specific factors. However, the fact that behaviour at the second session also did not correlate with peer–reported cooperation suggests a more general explanation, such as that a broad disposition to cooperate was relevant to sharing decisions at the first but not the second session.
Discussion
Researchers rely heavily on the DG and TG to test theories about the evolution and maintenance of human cooperation (Baumard et al., 2013; Bowles & Gintis, 2011). But does behaviour in any one cooperation game speak to how people will behave in other contexts? On one hand, decisions in different cooperation games positively covary (Peysakhovich et al., 2014; Yamagishi et al., 2013). But on the other hand, this positive manifold may merely reflect the fact that the different games share similar features. If so, then it is either the case that a broad tendency to cooperate does not exist or that it does exist but does not cause cooperation game decisions. Either way, researchers would not have licence to make generalizations about human cooperation based on decisions in cooperation games.
We found that charitable giving correlated with all cooperation game, self–report, and peer–report cooperation measures, suggesting that a general disposition toward cooperation does exist. To test whether positive covariation among game decisions reflects this general disposition, we fitted an S–1 bifactor model to the DG and both decisions in the TG, which were each measured six times. We had the TGreturn represent the general factor because it contains more features that facilitate sharing money than do the DG and TGsend. The general factor had medium–sized associations with non–game measures of altruism, trust, and trustworthiness, including peer–reports. The general factor's association with self–reported trustworthiness was only marginally significant and smaller than its association with peer–reported trustworthiness, which could mean that peers are either abler or more motivated to provide accurate reports of trustworthiness (Thielmann et al., 2017). The general factor also (negatively) predicted revenge attitudes, suggesting that it is relevant to types of cooperation other than altruism, trust, and trustworthiness. The general factor and charitable giving from participants’ second session had much less success in predicting scores on the questionnaire measures, however, suggesting that a broad tendency to cooperate had less influence on behaviour during this session.
What does the general factor represent?
The good model fit and predictive power of the general factor provide evidence of cross–situational consistency in cooperativeness but do not point to the underlying psychological process. In speculating on how to interpret the general factor, it makes sense to focus on what the TGreturn has in common with most situations in which people make decisions about whether to cooperate. One possibility is that the TGreturn evokes a desire to maintain a cooperative reputation. Failing to cooperate often results in estrangement, causing non–cooperators to lose out on the long–term benefits of sociality (Baumard et al., 2013). Even in contemporary environments in which many market transactions and online interactions occur between strangers, formal institutions such as the police and informal institutions like Yelp provide incentives to behave cooperatively. Possibly, then, the reason people share in cooperation games, report behaving cooperatively in everyday in self–reports, and are perceived as cooperative by their peers is that they are concerned with appearing to be cooperative to others.
It may seem odd to posit that a desire to uphold a cooperative image underlies the general factor given that the material and social benefits of cooperation have been dampened or removed from cooperation games. A viable alternative explanation for the general factor that attaches great weight to this misgiving is that it represents an intrinsic valuation of cooperativeness (Baumard et al., 2013; Camerer & Thaler, 1995; Fehr & Schmidt, 1999). However, sharing declines considerably in modified cooperation games where decision–makers can keep the endowment without revealing to the experimenter or potential beneficiary that they made a selfish decision (Cain, Dana, & Newman, 2014; Franzen & Pointner, 2012; Thielmann, Heck, & Hilbig, 2016; Winking & Mizer, 2013). This finding implies that most participants who share in the standard versions of cooperation games do not possess an intrinsic desire to be altruistic or fair. Rather, participants share to prevent others from believing that they are stingy, even when they cannot be sanctioned or readily identified.
A possible reason why participants worry about social evaluation in cooperation games is that they do not incorporate the situation's incentive structure into their decision–making process. Instead, decisions to cooperate may be based on a habit that is positively reinforced in daily life (Rand, Greene, & Nowak, 2012; Yamagishi, Terai, Kiyonari, Mifune, & Kanazawa, 2007). Cooperative habits develop because the short–term benefits of selfishness are outweighed by the long–term costs of losing social partners. Rather than try to ascertain whether selfishness would be detected and punished in every situation, many people are motivated to simply avoid the costlier error by cooperating (Delton, Krasnow, Cosmides, & Tooby, 2011). This ‘social heuristics hypothesis’ predicts that participants will share money in cooperation games unless they take the time to fully appreciate their unique incentives. In line with this prediction, meta–analytic evidence suggests that experimentally increasing reliance on habitual decision–making relative to deliberative decision–making increases sharing in cooperation games (Rand, 2016). A notable exception is that deliberation does not reduce cooperation in games in which cooperation can enhance personal welfare even in an anonymous, one–shot setting. For example, Trusters who are in a deliberative mindset do not send less in the TGsend, probably because they still believe that their generosity will be reciprocated.
Of course, just as people develop cooperative habits that match the incentives of everyday life, they can also acquire habits that match the incentives of cooperation games. Indeed, the decisions of participants who report having experience with cooperation games are less affected by manipulations of reliance on habit versus deliberation (Rand et al., 2014). Also, in the companion paper to the present paper (McAuliffe et al., 2018), we reported that participants transferred less in the DG, TGreturn, and charitable giving task (but not in the TGsend) during their second session. We inferred that participants learned from the first session that the behavioural tasks do not offer material or reputational incentives to cooperate.
Why did behaviour from the second session not predict scores on the questionnaire measures?
The habituation process that occurred between participants’ two sessions may even be able to explain why the general factor and the charitable giving task from the second session had limited ability to predict scores on the questionnaire measures: If the cooperative behaviour reported in the questionnaire measures was motivated by a habit–based desire to uphold a cooperative reputation, then the self–reports and peer–reports should not correlate well with decisions that are based on an appreciation that the laboratory setting does not offer reputational incentives to cooperate. An alternative explanation for why behaviour at participants’ second session was not associated with the questionnaire measures is that the second session had insufficient statistical power. Consistent with this alternative explanation, a comparison of the regression coefficients and standard errors in Tables 3 and 5 reveals that one of the associations at the second session is non–significantly larger than the corresponding association from the first session (viz. general factor and self–reported trustworthiness) while others are only non–significantly smaller (e.g. general factor and self–reported altruism). But precision is likely not the whole the story: Even though only 200 of 276 participants returned for the second session, there was still 80% power to detect correlations as small as r = 0.20. Therefore, a lack of statistical power cannot explain, for example, why decisions from the second session did not replicate correlations between the general factor from the first session and self–reported trust (r = 0.21). Further, this correlation was significantly smaller at the second session, as were many of the correlations between charitable giving and the questionnaire measures (compare Tables 2 and 5).
A second alternative is that the behavioural measures do not reflect stable dispositions. However, the correlations between the same behavioural measures across occasions were substantial (rs = 0.60–0.71; McAuliffe et al., 2018). Moreover, if the cooperation games and charitable giving task do not reflect stable traits, then the behavioural decisions from the first session should have also failed to predict the self–reports and peer–reports. On the other hand, situational factors that were common to the participants’ first session may explain the correlations between behavioural measures from that session and the questionnaire measures. But this possibility cannot explain why the peer–reports, which were collected after participants completed their second session and involved different people, correlated with behavioural measures at the first session but not the second session. Overall, we cannot definitively conclude that habituation to the laboratory setting explains why behaviour at the second session was not attributable to a broad tendency to cooperate, but it is a plausible hypothesis worth testing in future research.
Were our standards of evidence too low?
Some researchers may object that the correlations we observed were too meagre to count as evidence of a broad cooperative disposition. For example, Haesevoets et al. (2015, p. 450) concluded that ‘dispositional variables do not yield substantial behavioural effects in the different [cooperation] games’ based on three findings. First, the average correlation among the seven games they examined (including the DG and TGsend) was r = 0.22. Second, two factors (that were correlated at r = 0.45) had to be extracted to explain the covariance among the games. Last, correlations between the factors and self–reports of constructs such as social value orientation (i.e. how much one values others relative to the self) had absolute magnitudes that ranged between r = 0.15 and 0.30. Haesevoets et al. (2015) said that these correlations ‘were small or moderate’ (p. 450) based on the small amount of variance explained (i.e. r2 < 0.10) and Cohen's (1992) conventions for effect size magnitudes (r = 0.10 is small; r = 0.30 is medium; r = 0.50 is large). We observed stronger correlations among cooperation games (rs = 0.47–0.56) than did Haesevoets et al. (2015), but we too had to extract multiple factors to explain the covariance among cooperation games. Furthermore, the significant associations between the general factor and questionnaire measures that we observed were, with one ‘medium’ exception, ‘small’ by Cohen's standards.
For several reasons, both the Haesevoets et al. (2015) results and our results are exactly what one would expect if a broad trait was responsible for cooperation game decisions. First, Clark and Watson (1995, p. 316) recommend that indicators of a broad trait should have an average inter–item correlation of about r = 0.15–0.20. The average inter–game correlation of r = 0.22 that Haesevoets et al. (2015) found is thus entirely consistent with the goal of reliably sampling the full breadth of a broad disposition. If anything, the strong covariation among cooperation games that we observed (the average inter–item correlation for the 18 game decisions was r = 0.51, and the average correlation among the first decisions of each game was r = 0.37) was reason to doubt that the general factor would predict cooperation in situations other than anonymous, one–shot social interactions. Second, when two measures are correlated via an unobserved common cause, the appropriate effect size is r, not r2 (Ozer, 1985). It is therefore misleading to conclude that an average inter–game correlation of r = 0.22 means that ‘on average, only 4.84% of the variance of behaviour in one particular game can be explained by behaviour in another game’ (Haesevoets et al., 2015, p. 450). More to the point is that, on average, 22% of the variability in each of the seven games is attributable to a common construct. Third, Gignac and Szodorai (2016) found that r = 0.20 represents the 50th percentile of effect sizes in individual differences research, with vanishingly few studies finding effects as large as r = 0.50. Based on these findings, they recommended that Cohen's (1992) standards for a small, medium, and large effect size be revised to be 0.10, 0.20, and 0.30, respectively. By these standards, many of the correlations in both studies were medium or large. Fourth, the large correlations among latent game factors that both we and Haesevoets et al. (2015) observed imply that a higher order trait could explain the factors’ covariance. Fifth, Ahadi and Diener (1989) have shown that behaviours that have as few as three sources of variance and only one source of variance in common cannot correlate at magnitudes much higher than r = 0.30. Each cooperation game probably has at least four sources of variance: A broad trait that is active in most cooperation situations, a narrower trait that is active in all cooperation games, an even narrower trait that is active in only some cooperation games, and measurement error (Thielmann, Böhm, & Hilbig, 2015). So, even in latent variable models in which measurement error is excised, correlations around 0.20 or 0.30 are strong evidence that two measures have a substantial source of variance in common. Similar comments apply to the Haesevoets et al. (2015, p. 451) finding that controlling for self–reports of cooperative traits did not eliminate the correlations among cooperation games: Because the games are related both through a broad disposition and game–specific traits, one cannot expect that partialing out only variance attributable to a broad disposition would be sufficient to eliminate the associations among cooperation games. Overall, the Haesevoets et al. (2015) medium–sized correlations, like the ones we observed, support the existence of a broad tendency to cooperate.
Methodological implications
Our results have implications for best practices with regard to testing hypotheses about human cooperation. First, some researchers (Galizzi & Navarro–Martínez, 2018; Gurven & Winking, 2008; Voors et al., 2012) have set up cooperation games to fail tests of validity by using behaviour in dissimilar situations or questionnaires of broad breadth as criterion measures. The principle of symmetry, which states that two measures will only correlate strongly when they measure the same construct at the same level of generality (Epstein & O'Brien, 1985; Wittmann & Klumb, 2006), predicts that individual cooperation games should have limited ability to predict cooperation in dissimilar situations. Researchers should only use individual games as exogenous variables when they want to predict cooperation in similar situations. Researchers who want to predict individual differences in a general tendency to cooperate should use an aggregate of participants’ decisions across a broader sample of cooperative situations. These recommendations were corroborated by our finding that the general factor had more predictive validity than any game considered alone. It may have had even stronger relations with an even greater number of constructs if we had included other cooperation games, such as the Public Goods Game and the Prisoner's Dilemma Game. In contrast, the DG and TGsend specific factors had little chance of predicting scores on the relatively broad questionnaire measures because they represent the presumably narrow situational elements that are present in the DG and TGsend, respectively, but not in the TGreturn.
Our results also suggest that charitable giving in response to researchers’ solicitations in the laboratory is an efficient way to measure a broad propensity toward cooperation. Charitable giving measured in this fashion may have broad relevance to cooperation because people approve of charitable giving for many reasons, such as considerations of need, inequity, identification with the cause, and wanting to ‘pay it forward’ (Bekkers & Wiepking, 2011). And in line with the notion that broad cooperativeness reflects a desire to maintain a positive reputation, solicitations to donate strongly evoke socially desirable responding (Andreoni, Rao, & Trachtman, 2017; Fielding & Knowles, 2015), perhaps because there are so many reasons to justify it. In contrast, spontaneous decisions to donate to charity may have entirely different motives (e.g. receiving a tax break or an intrinsic desire to help the beneficiaries) and presumably would not reliably reflect the broad tendency investigated here.
Finally, the fact that cooperation behaviour from the second session did not reliably predict scores on the questionnaire measures suggests that researchers should recruit participants whose level of experience with anonymous social interactions is consistent with their measurement goals. Researchers who desire to measure broad cooperativeness should recruit from populations that do not have experience with cooperation games. For instance, community members with little exposure to psychological research may be an ideal population. But if researchers desire to study how people behave when they have acclimated to an anonymous setting, they should sample populations that have experience with cooperation games. Online samples, such as those recruited from Amazon.com's Mechanical Turk, may be more appropriate for this latter goal (Rand et al., 2014).
Did we use appropriate validation targets?
The associations between the general factor and the questionnaire measures provide evidence of cross–situational consistency in cooperation only if the self–report and peer–report measures we used are valid. Although the questionnaires we used have survived psychometric scrutiny (Costa et al., 1991; Evans & Revelle, 2008; Glaeser et al., 2000; Mooradian, Renzl, & Matzler, 2006; Rushton et al., 1981), our belief in their validity is corrigible. The fact that the general factor predicted scores on the pilot trust questionnaire provides some initial evidence that our results are not artefacts of the specific criterion measures we used. Nevertheless, confidence in the present results would increase if they conceptually replicated using different, well–validated questionnaire measures.
Many studies have assessed the correspondence between game behaviour and real–life cooperation using self–report measures (Zhao & Smillie, 2015). A strength of our design is that we also used peer–reports, which circumvent participants’ self–presentation concerns (Kolar et al., 1996). However, the fact that the peer–reports came mostly from friends and family members, who generally have positive views of the participants, may have limited their validity. Aggregating reports from peers who both like and dislike participants would increase their generalizability by reducing range restriction and broadening the types of situations in which participants have been observed. Future researchers could maximize the validity of their peer–reports by asking participants to recommend informants with whom they have had varying amount of conflict.
Our choice of outcome measures was also imperfect in that we only collected self–reports and peer–reports of the constructs that the DG, TGsend, and TGreturn are designed to measure—altruism, trust, and trustworthiness. The fact that the general factor significantly predicted self–reports of street code beliefs and revenge tendencies but not trait forgiveness shows that it is broader than the constructs that were factored to create it, but not broad enough to capture every aspect of cooperative behaviour (at least as measured by self–report). Determining just how broad the general factor is will require including measures of yet further cooperative tendencies, such as trait fairness, which numerous authors have linked to cooperation game decisions (Baumert et al., 2013; Thielmann & Hilbig, 2015; Zhao, Ferguson, & Smillie, 2017).
Even if the questionnaire measures we used are adequate for measuring broad dispositions, they did not capture individual differences in the DG and TGsend specific factors. Future researchers who create hierarchical models of cooperation games should include questionnaire measures that tap relatively specific dispositions. For instance, the expectation of reciprocity is relevant to the TGsend (Pfattheicher & Böhm, 2017), but not to the TGreturn or DG. Consequently, the TGsend specific factor may have more success in predicting scores on a questionnaire measure of how likely strangers are to behave in a trustworthy way in anonymous interactions (Pletzer, Balliet, Joireman, Kuhlman, Voelpel, & Van Lange, 2018). The DG specific factor may reflect the fact that only the decision–maker receives a windfall, a situational feature that the TGsend and TGreturn do not possess. Modified DGs reveal that Dictators share money in part because they do not believe that they rightfully own the money (Oxoby & Spraggon, 2008). However, because the assignment of roles in the standard DG is random, keeping the money conforms to procedural justice. Perhaps the variance unique to the DG represents the extent to which participants believe that inequality is fair so long as it came about via an impartial process.
Conclusion
In summary, we found empirical support for the hypothesis that the positive covariance among DG and TG decisions not only reflects a narrow dimension of cooperation but also measures a broad trait that is expressed in many types of social interactions in which people have the capacity to improve the welfare of other people. Creating a general factor of cooperative behaviour using an S–1 bifactor model provided more consistent validity evidence than has been found in many previous studies that have tried to link cooperation games to non–game measures. We hope that future researchers will conduct tests to determine whether the general factor represents a desire to maintain a cooperative reputation or perhaps some other motive that is relevant to many different types of cooperative behaviour. More generally, we hope that researchers who use economic games will make greater use of formal psychometric techniques to test theories of human sociality.
Acknowledgements
Research was supported by a grant from the John Templeton Foundation (award no. 29165) to M. E. McCullough. Research was sponsored by the Army Research Laboratory and was accomplished under cooperative agreement number W911NF–18–2–0194. The views and conclusions contained in this document are those of the authors and should not be interpreted as representing the official policies, either expressed or implied, of the Army Research Laboratory or the US Government. The US Government is authorized to reproduce and distribute reprints for Government purposes notwithstanding any copyright notation herein. Many thanks to Julie Berhane and Ilyssa Salomon for their extensive efforts in managing participant recruitment and collecting peer reports. Thanks also to Adriana Guzman, Sean Ryan, Anting Yang, and Daniel Katan for assistance with data collection on many a sunny Saturday afternoon. We are also grateful towards Kiara Timpano for allowing us to utilize her laboratory space when we ran large sessions.
Supporting info item
Supporting info item, per2180-sup-0001-supp - Does Cooperation in the Laboratory Reflect the Operation of A Broad Trait?
Supporting info item, per2180-sup-0001-supp for Does Cooperation in the Laboratory Reflect the Operation of A Broad Trait? by McAuliffe William H.B., Forster Daniel E., Pedersen Eric J., McCullough Michael E. and Baumert Anna in European Journal of Personality
Supporting info item
Supporting info item, per2180-sup-0002-PER_Open_Practices_Disclosure_Form_PER 2180 - Does Cooperation in the Laboratory Reflect the Operation of A Broad Trait?
Supporting info item, per2180-sup-0002-PER_Open_Practices_Disclosure_Form_PER 2180 for Does Cooperation in the Laboratory Reflect the Operation of A Broad Trait? by McAuliffe William H.B., Forster Daniel E., Pedersen Eric J., McCullough Michael E. and Baumert Anna in European Journal of Personality
Open Practices Disclosure
References
Supplementary Material
Please find the following supplemental material available below.
For Open Access articles published under a Creative Commons License, all supplemental material carries the same license as the article it is associated with.
For non-Open Access articles published, all supplemental material carries a non-exclusive license, and permission requests for re-use of supplemental material or any part of supplemental material shall be sent directly to the copyright owner as specified in the copyright notice associated with the article.