
Abstract
The power motive predicts influential social behaviour; however, its heterogeneous conceptualisations have produced inconsistent results. To overcome this problem, we developed and validated a unitary taxonomy of social power motives based on established delineations of social hierarchies: the dominance, prestige, and leadership account. While we could measure these motives both reliably and distinctively (study 1), we also showed they strongly related to a common power desire (study 2). Assessing their nomological networks (studies 3 and 4), we demonstrated distinct associations between the dominance motive (D: wanting to coerce others into adhering to one's will) and anger and verbal aggression; the prestige motive (P: wanting to obtain admiration and respect) and the fear of losing reputation and claiming to have higher moral concerns; the leadership motive (L: wanting to take responsibility in and for one's group) and emotional stability and helping behaviour. Furthermore, while D uniquely predicted agonistic/retaliatory behaviour in dictator games (study 5), L uniquely predicted the attainment of higher employment ranks in various professions (study 7). Finally, at least to some degree, P and L related positively, and D negatively to prosocial donating behaviour (study 6). This taxonomy represents a novel and powerful approach to predicting influential social behaviour. © 2018 European Association of Personality Psychology
General Introduction
Powerful individuals such as Stalin, Stephen Hawking, or Angela Merkel have, or have had, substantial influence on our lives, for example, by threatening war, making ground–breaking discoveries, or governing our countries. Understanding the motives behind this impactful behaviour of powerful people or the people yet to obtain power would arguably facilitate its prediction and thus opens up possibilities to mediate or support it (e.g. Heckhausen & Heckhausen, 2008). One such motive has been proposed to be a desire for power itself—the power motive—defined as a personality disposition energising, directing, and maintaining behaviour concerned with ‘having impact on others, arousing strong emotions in others, or maintaining reputation and prestige’. (Winter, 1988, p. 510; Heckhausen & Heckhausen, 2008). On the one hand, multiple studies could confirm the power motives’ predictive validity regarding power relevant variables such as the preference for (Jackson, 1984) and successful attainment of high–power professions (e.g. Winter, 1988), or the participation in competitive sports (Winter, 1973; see Schmalt & Heckhausen, 2008, for an overview). On the other hand, associations between such variables could be quite different depending on which power motive scale researchers applied (Engeser & Langens, 2010). This has been attributed to the power motives’ fairly heterogeneous definition (Engeser & Langens, 2010; see also: McClelland, 1970; Schönbrodt & Gerstenberg, 2012). Thus, to better predict potentially influential behaviour of people aspiring power, a clear taxonomy of different desires to obtain power is needed. In this research, we aim to achieve exactly this by proposing and preliminarily validating an account of differentially predictive desires for dominance, prestige, and leadership (DoPL) subsumed under the general power motive.
Recent advances in social hierarchy research provide a strong theoretical framework to differentiate power motive components (e.g. Cheng & Tracy, 2014; Henrich & Gil–White, 2001; Magee & Galinsky, 2008). Social hierarchies describe a rank ordering of individuals resulting in asymmetrical access to resources, attention, and control over others; in other words, different degrees of power (e.g. Chase, Tovey, Spangler–Martin, & Manfredonia, 2002; Magee & Galinsky, 2008). Crucially, researchers have proposed that individuals simultaneously reside in different kinds of hierarchies in which they are ranked according to qualitatively different attributes such as dominance or prestige (i.e. dominance vs. prestige account; e.g. Cheng & Tracy, 2014; Henrich & Gil–White, 2001; Maner & Case, 2016; see also Bischof, 2008). Whereas a higher rank in a dominance hierarchy is obtained through forcing deference (e.g. by intimidation and coercion of others; cf. Stalin), a higher rank in a prestige hierarchy is obtained through voluntary deference (e.g. through the admiration and respect for one's valued skills and knowledge; cf. Stephen Hawking). In addition to dominance and prestige, we propose that individuals can also obtain power through leadership, a concept related to dominance and prestige rankings but functionally distinct (e.g. de Waal–Andrews, Gregg, & Lammers, 2015). We propose leadership shows in taking initiative and responsibility in order to direct a group to common group goal (cf. Angela Merkel). This supplies a leader with a unique kind of power that is granted as well as claimed in order to achieve this group goal. As leaders can be ranked on different levels, we propose a leadership hierarchy based on the extent to which a person takes responsibility/initiative and directs others’ activities towards a common group goal.
In summary, although all social hierarchies provide power to the people on top, they can be discriminated by three qualitatively different power sources (i.e. being forcefully taken, voluntarily given, or being granted as a necessity). In the following, we will further elaborate on these hierarchies and outline how their adaptive benefits supported the evolving of three hierarchy–specific motives to obtain power: dominance, prestige, and leadership.
Dominance motive (D)
The capacity and propensity to form dominance hierarchies probably evolved among animals living in groups in order to reduce potentially dangerous competition for scarce resources such as food or mating partners (e.g. Bischof 2008; Cheng & Tracy, 2014; Henrich & Gil–White, 2001; Moosa & Ud–Dean, 2011). Dominance hierarchies are arguably the simplest form of social hierarchy as they are merely based on one member of the group being able to force another member into submission (e.g. through superior physical strength). As such, fairly stable dominance rankings based on the number of victories/defeats in dyadic contests can be observed in simple animals such as crayfish (Fero & Moore, 2008), lizards (Bush, Quinn, Balreira, & Johnson, 2016), or birds (Valderrábano–Ibarra, Brumon, & Drummond, 2007). Moreover, they can often be observed in more human–like species such as monkeys (e.g. Gammell, de Vries, Jennings, Carlin, & Hayden, 2003) but also humans (e.g. Cheng & Tracy, 2014; Henrich & Gil–White, 2001; von Rueden, Gurven, & Kaplan, 2008). Importantly, actual fights among conspecifics are often costly for both parties; therefore, many dominance contests are settled by fear–inducing threatening means that are arguably used to different degrees among primates, including humans. These means include displays of aggression, dominant body postures, glares, vocal pitch, verbal threats, emotional blackmailing, or deception (Cheng, Tracy, Ho, & Henrich, 2016; Kyl–Heku & Buss, 1996; Mazur, 1985; Sell, Tooby, & Cosmides, 2009).
Some scholars have argued that dominance hierarchies are more prevalent among men than among women (e.g. Bischof–Köhler, 2011; Bischof, 2008) as some means of exerting dominance (e.g. through physical size) are evolutionary more applicable to men than women, at least for most primates. Accordingly, most studies linking dominance rank to reproductive success, or proxies for reproductive success, rely exclusively on male monkeys and humans (e.g. Cowlishaw & Dunbar, 1991; Ellis, 1995; Snyder, Kirkpatrick, & Barrett, 2008; von Rueden, Gurven, & Kaplan, 2011; but see Pusey, Williams, & Goodall, 1997). Nonetheless, some means of exerting dominance can be used by men and women alike (e.g. emotional blackmailing, deception, and verbal aggression) that could increase this person's fitness. Thus, although weaker, dominance hierarchies might also exist among women. Given that dominance–related behaviours are observed in a wide variety of species and that position within such a hierarchy has been linked to reproductive advantage, it seems clear that there is an evolutionary basis for such behaviours. Allport (1937) and Bischof, 2008 have argued that these kind of evolutionary–driven behaviours might underlie functionally autonomous motives that energise short–term goal attainment (e.g. acting dominant) to keep the underlying beneficial behavioural patterns refreshed even if this does not always lead to long–term goal attainment (e.g. power). In line with this, we define a functionally autonomous dominance motive (D) as a desire to coerce others into adhering to one's will.
Prestige motive (P)
Besides dominance hierarchies, scholars have argued that evolution selected for a second kind of hierarchy, most commonly termed prestige hierarchy (e.g. Bischof, 2008, Cheng & Tracy, 2014; Henrich & Gil–White, 2001; Magee & Galinsky, 2008). Prestige hierarchies are based on the voluntary deference to higher ranking members as a function of admiration and respect for these individuals’ valued skills and knowledge (e.g. Henrich & Gil–White, 2001). Rudimentary forms of this can be observed in the animal kingdom (e.g. Stammbach, 1988); however, human–specific prestige hierarchies have evolved beyond the mere trading of deference (e.g. grooming and support) for food between less and more skilled conspecifics (Henrich & Gil–White, 2001). More specifically, only humans are argued to have been able to truly acquire and pass on to their offspring expert motor skills and behavioural objectives. Thus, natural selection would have favoured individuals who could obtain access to experts by wooing them with their admiration, respect, and voluntary deference (in short, conferring prestige). Having prestige, in turn, would become evolutionarily beneficial for the person who has it (Henrich & Gil–White, 2001).
Some studies could show links between higher prestige ranks and increased reproductive success. For example, observations of hunter–gatherer tribes have suggested a link between foraging skills and reproductive success, beyond the mere surplus in food, but rather mediated by signalling these superior foraging qualities themselves (e.g. Gurven & von Rueden, 2006; Henrich & Gil–White, 2001; Kaplan & Hill, 1985; Smith, 2004). Thus, similar to the dominance motive, we propose that selection pressures resulted in a functional autonomous prestige motive (P), defined as a desire to be admired and respected primarily for one's skills and knowledge. We say ‘primarily’ because, although holding that in most cases the prestige motive relates to admiration for specific skills and knowledge, we propose that sometimes the motive can manifest itself as a general/unspecified desire for admiration and respect (cf. status hierarchies; Magee & Galinsky, 2008). 1
Leadership motive (L)
Similar to dominance and prestige hierarchies, researchers have proposed an evolutionary theory of leadership, which can be defined as a process of taking initiative and responsibility for one's group and directing it towards a common group goal (Van Vugt, 2006). The evolutionary theory holds that, as social group living has presented considerable and varied coordination problems (e.g. when and where to gather food, defending the group, and when and where to move), natural selection would have favoured propensities to adopt leader and follower roles, because concerted (as opposed to uncoordinated) actions were more likely to increase group members’ fitness (Maynard–Smith, 1982; Van Vugt, 2006). Depending on group sizes, leadership can occur at several levels (e.g. leader of hunter group/leader of tribe and sergeant/major/general; e.g. Chen & Bliese, 2002); thus, like dominance and prestige, it can be conceptualised as hierarchical.
Based on modern leadership theory, we propose that ranks in these leadership hierarchies are obtained through dynamic processes of granting and claiming (DeRue & Ashford, 2010). Natural selection might have favoured granting processes to be influenced by leader–specific attributes such as dominance or prestige and claiming processes to be influenced by individuals’ desires to lead. More precisely, scholars (e.g. Maner, 2017; Van Vugt, 2006) argued that it would have been adaptive for groups to grant leadership to individuals which seemed most capable to achieve specific group goals. For example, whereas in times of war or crisis, people preferred dominant leaders who could enforce group cohesion (Kakkar & Sivanathan, 2017) during peace times people seemed to prefer leaders inviting cooperation, conceivably based on voluntary deference (Spisak, Dekker, Krüger, & van Vugt, 2012; see also Ho, Shih, & Walters, 2012). 2 Although in some cases leaders might take on leadership positions merely as they have been asked to do so [e.g. see Chan & Drasgow, 2001: social–normative motivation to lead (MTL)] more than often attaining leadership positions also depends on the degree to which they have been claimed (e.g. DeRue & Ashford, 2010; Sorrentino & Boutillier, 1975). One driving force behind such claiming has been captured in Chan and Drasgow's (2001) affective MTL, describing a desire to lead purely as one enjoys doing so. 3 Natural selection might have favoured individuals having such desires as they predict the attainment of leadership positions (Luria & Berson, 2013) which in turn have been linked to greater reproductive success (Jokela & Keltikangas–Järvinen, 2009).
Similar to the unique power sources in dominance and prestige hierarchies (Cheng & Tracy, 2014; Henrich & Gil–White, 2001), we argue that higher ranking members of leadership hierarchies are supplied with a specific kind of power. Based on the process of granting and claiming as well as the core requirements to leadership (Van Vugt, 2006), we propose a leader's power is neither strictly forced nor voluntarily given but granted as a necessity to achieve a common group goal. This kind of legitimised power could be demonstrated in group tasks in which members accepted leaders’ directions to achieve a common group goal if they believed these leaders had been democratically elected (i.e. having been granted leadership by a group; French & Raven, 1959; Raven & French, 1958).
In summary, evolutionary theory stresses the adaptive value for human groups to have organised themselves into hierarchical structures of leaders and followers. We proposed dynamic processes of granting and claiming underlie rank attainment in these hierarchies that supply higher ranking members with a unique source of power granted by the group as a necessity to reach a common goal. Moreover, whereas individuals may be granted leadership based on their dominance and prestige, individuals may claim leadership as a function of their desire to lead. Such desires have been shown to predict leadership attainment which in turn increased reproductive success. Thus, mirroring the evolutionary argument for dominance and prestige motives and expanding on the affective MTL's (Chan & Drasgow, 2001) pure enjoyment to lead by including Van Vugt's (2006) evolutionary core elements of leadership, we propose a functionally autonomous leadership (L) motive as a desire to take initiative and responsibility in one's group to direct it to a common group goal.
Individual differences in dominance, prestige, and leadership motives
Although stronger DoPL motives are arguably linked to increasing a person's fitness, adaptive pressures likely fostered a differentiation in these motives to support a variety of strategies to secure the survival of one's genes (e.g. D. M. Buss, 2009). Obviously the intensities of DoPL motives are not directly linked to an individual's capabilities, but rather variation in these motives across individuals (and perhaps within individuals over time) provides the raw material for selective advantage in aggregate. As an idealised example, high dominance motives would, on average, be evolutionarily detrimental to individuals ill–equipped to elicit threats (e.g. smaller/weaker individuals) as they would waste energy on unsuccessful domination attempts and likely be injured as a result. Thus, a uniformly strong dominance motive in a population would be maladaptively to all but the (temporarily) strongest individuals. A distribution of this motive, however, would provide alternative strategies. For example, lower dominance–motivated individuals (i.e. being more agreeable; John, Naumann, & Soto, 2008) could maximise their fitness through being valued as trusted friends and coalition partners (e.g. Nettle, 2006). Similarly, prestige desires are to some degree linked to costly signalling (i.e. individuals have to invest in acquiring the attributes they want to be admired for) that might be more or less affordable to varying individuals (e.g. Hardy & Van Vugt, 2006; Henrich & Gil–White, 2001). Moreover, high prestige–motivated individuals might be more vulnerable to narcissistic admiration (e.g. Back et al., 2013) that benefits having many short–term mates (i.e. maximising offspring quantity) but hindering maintaining long–term relationships (i.e. maximising offspring quality, conceivably a low–prestige motive strategy; D. M. Buss & Schmitt, 1993; Campbell & Campbell, 2009). Individual differences in the leadership motive might be particularly driven by frequency–dependent selection (e.g. D. M. Buss, 2009). Leaderless groups would have less chances of survival (e.g. Maynard–Smith, 1982; Van Vugt, 2006); thus, fitness for each group member would increase if some would adopt leadership roles (i.e. having high leadership desires) and even more would adopt follower roles (i.e. having low leadership desires). Finally, similar to conceptually related personality traits such as extraversion, DoPL motives are likely polygenic (e.g. Lukaszewski & Roney, 2011). Thus, as more genes influence phenotypic expressions of DoPL motives, more natural mutations occur, increasing phenotypic variance (e.g. D. M. Buss, 2009).
Previous power motive distinctions and attempts to measure hierarchy–relevant motives
Importantly, we are not the first scholars to propose different power motive components. In a first attempt, researchers proposed the power motive could be divided into personalised/self–serving (p power) and socialised/other–serving power (s power) components (Magee & Langner, 2008; McClelland, 1970; Winter & Stewart, 1978). However, the interpretations of p and s power have been different because of their broad definitions and lack of a clear theoretical framework. For example, whereas some conceptualised s power as being doubtful about one's influence and regard it as dangerous or flawed (e.g. Magee & Langner, 2008; McClelland, 1970), others only stress s power's hope to gain power (Wang & Sun, 2016). Whereas some regard desires to impress others or showing unsolicited helping behaviour as defining parts of p power (e.g. Magee & Langner, 2008), others do not include this but conceptualise it as an abuse of power or general belief that some people should be superior to others (e.g. Torelli & Shavitt, 2010). In a second attempt, judging by the power motive's definition and a cluster analysis of power motive items, Schönbrodt and Gerstenberg (2012) concluded that there are two components to the power motive, control and prestige. Further applying the framework of approach and avoidance motives (e.g. Elliot & Thrash, 2002), they proposed two distinct power avoidance components: a fear to lose control and a fear to lose reputation/prestige. However, somewhat less consistently, they proposed a single power approach component, a hope to gain power, encompassing both control and prestige aspects. In summary, although researchers have acknowledged that the power motive is a heterogeneous construct, a clear theoretical framework to distinguish between different components of the power motive remained elusive.
We are also not the first scholars investigating motives related to DoPL. Nonetheless, none of the previous scales measuring these motives show a clear distinction between all three motives or their motivational content was somewhat unclear. For example, Cheng, Tracy, and Henrich (2010) developed a questionnaire to measure people's dispositional dominance and prestige strategies. Whereas the dominance–strategy items showed a great resemblance with the dominance motive (e.g. ‘I enjoy having control over others’.), the prestige–strategy items described a state of having prestige rather than a desire to gain prestige (e.g. ‘Members of my group respect and admire me’.). Maner and Mead (2010) utilised a subset of the Achievement Motive Scales (Cassidy & Lynn, 1989) to measure dominance and prestige desires. Here, at face–value, the prestige scale seemed to match our prestige definition. The dominance scale did not seem to measure dominance desires as defined by Henrich and Gil–White (2001) nor as measured by Cheng et al. (2010) but seemed to be more concerned with leadership desires (e.g. ‘I would make a good leader’.). Thus, previous scales to measure DoPL motives did not seek to clearly differentiate between these three concepts.
Overview of studies
In the present research, we tested the validity of our DoPL account of social power motives. In study 1, we showed that a three–factor solution of previously selected DoPL questionnaire items (Studies SX1–SX3) provided a good model fit in confirmatory factor analyses and outperformed all two–factor or one–factor solutions. These DoPL motives explained more than 80% of variance (shared among or unique to each motive) in two established power motive scales (study 2). To situate the DoPL motives within their respective nomological networks, we tested their associations with other motives, personality traits, and self–reported behaviour (study 3) as well as self–reported moral concerns (study 4). To demonstrate the DoPL scales’ predictive and discriminant validity, we could show D's unique predictive power regarding dictator game behaviour (study 5), differential effects of the DoPL motives when predicting charitable donations (study 6), and L's unique predictive power regarding workers’ employment ranks (study 7). Studies 3, 5, and 6 were preregistered; studies 2, 4, and 7 were not. Data for the latter studies were collected alongside other studies that determined their sample sizes. As we were not sure how large a sample we could use when we started data collection for studies 2, 4, and 7, we did not preregister them. Nonetheless, as findings in each of these studies could be confirmed across multiple independent samples, this supports their reliability and replicability. Reproducible R–scripts, codebooks, and data for all our studies can be found here: https://osf.io/uxtq2/.
Study 1: Confirmatory Factor Analyses
To statistically distinguish and distinctively measure the DoPL motives, we conducted several exploratory factor analyses (Studies SX1–SX3) on responses to a pool of 57 items selected from existing power motive scales (e.g. Personal Value Questionnaire: McClelland, 1991; Unified Motive Scales, UMS, power: Schönbrodt & Gerstenberg, 2012) or created to match the DoPL motives’ definitions. Based on high primary factor loadings, no cross–loadings >0.25, broad concept coverage, and an even distribution of ABCD 4 aspects of motives (cf. Wilt & Revelle, 2015), we selected 10 items for each DoPL scale (30 items total). Moreover, we created 6–item and 4–item short scales for each motive by the same requirements (Table 3). Here, we wanted to assess the model fit of these DoPL scales as well as some alternative models using confirmatory factor analysis (CFA).
Method
Participants
Participants for this study came from sample #1 (n = 400; see Table 1 for more information and sample size rationale).
List of all five samples of participants used in studies for the DoPL scales’ confirmatory factor analysis (1), assessing the DoPL scales’ relationship with other power motive scales (2), investigating the DoPL scales’ nomological net (3) and relationship to morality (4), giving behaviour in dictator games (5), charitable donating behaviour (6), the relationship between the DoPL scales and employment ranks (7)
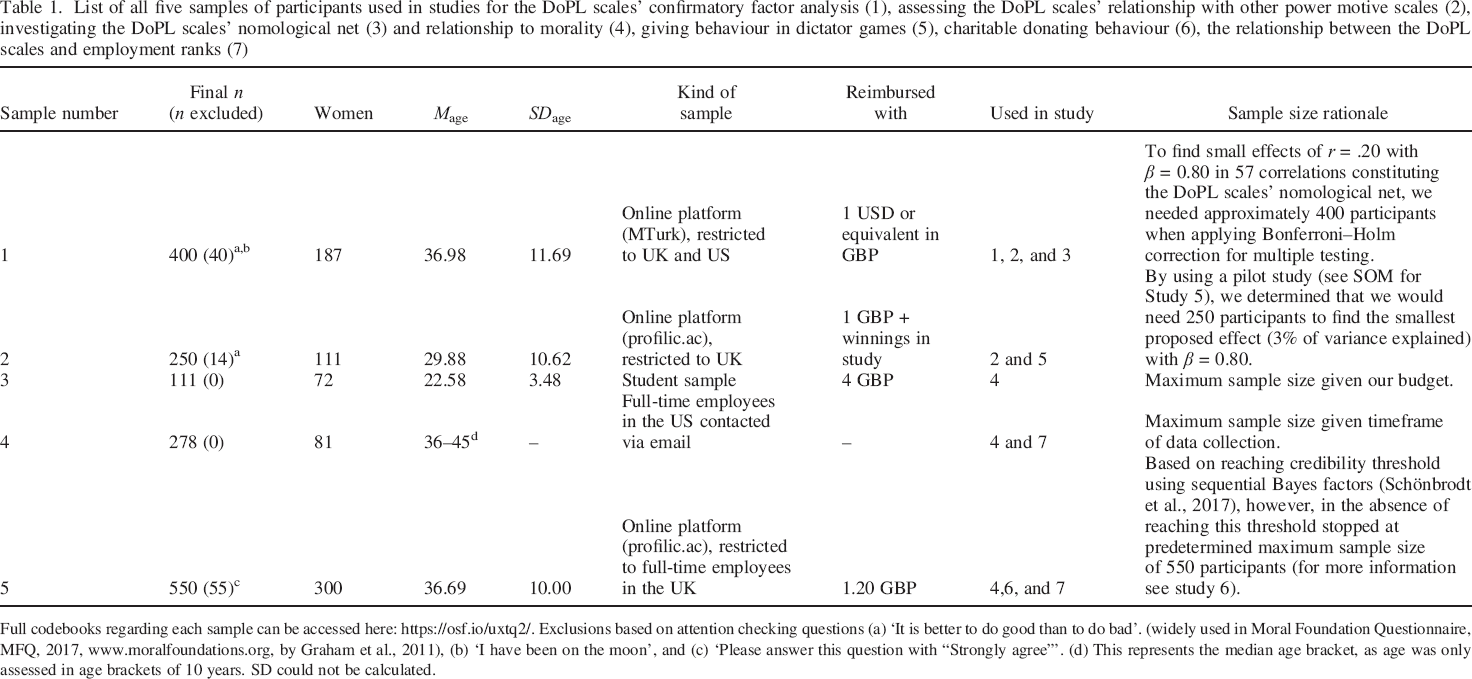
Full codebooks regarding each sample can be accessed here: https://osf.io/uxtq2/. Exclusions based on attention checking questions (a) ‘It is better to do good than to do bad’. (widely used in Moral Foundation Questionnaire, MFQ, 2017, www.moralfoundations.org, by Graham et al., 2011), (b) ‘I have been on the moon’, and (c) ‘Please answer this question with “Strongly agree”’. (d) This represents the median age bracket, as age was only assessed in age brackets of 10 years. SD could not be calculated.
Material and procedure
The 30 DoPL items were selected based on results of previous exploratory factor analyses (Studies SX1–SX3) and consisted of either statements or goals measured on 6–point Likert scales with the anchors ‘Strongly disagree’, ‘Disagree’, ‘Slightly disagree’, ‘Slightly agree’, ‘Agree’ and ‘Strongly agree’ (for statements) and ‘Not important to me’, ‘Of little importance to me’, ‘Of some importance to me’, ‘Important to me’, ‘Very important to me’, and ‘Extremely important to me’ (for goals; cf. Schönbrodt & Gerstenberg, 2012). These items were intermingled with 13 additional DoPL items as well as items for the UMS motive scales for achievement, affiliation, power, intimacy, fear of losing reputation, and fear of losing control (Schönbrodt & Gerstenberg, 2012). Afterwards, participants filled in several self–report scales to investigate the DoPL scales’ nomological network (see study 3).
Results
All 4–item, 6–item, and 10–item scales showed sufficient internal consistencies (Cronbach's αs = .83–.96; Table 2) and, with the exception of the 4–item dominance scale being right skewed, were normally distributed (Figure SX2). Moreover, whereas each of the 4–item, 6–item, and 10–item versions showed moderately sized correlations among the DoPL scales, .39 < rs < .53, the different lengths of each DoPL scale showed almost perfect correlations, .94 < rs < .99. None of these correlations differed across gender (Table 2); however, men generally had higher mean dominance scores than women, 5.58 < ts < 5.85, ps < .001, 0.55 < ds < 0.58 (Table S1).
Zero–order correlations of 10–item, 6–item, and 4–item version for each DoPL scale in subdiagonal and separately for male/female in superdiagonal
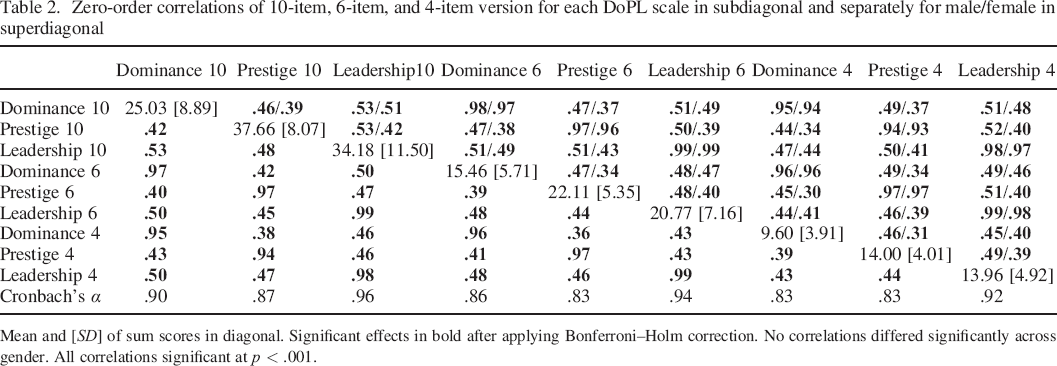
Mean and [SD] of sum scores in diagonal. Significant effects in bold after applying Bonferroni–Holm correction. No correlations differed significantly across gender. All correlations significant at p < .001.
To assess and compare model fit across all scales, we conducted CFAs for each of the 4–item, 6–item, and 10–item version of the DoPL scales (Tables 3 and 4). Model fit was evaluated based on comparative fit indices (CFIs), Tucker–Lewis Index (TLI), root mean square error of approximation (RMSEA), and the standardised root mean square residual (SRMR). For CFI and TLI, values between >.90 to .95 and, for RMSEA and SRMR, values of <.08 were taken as indicative of good fit (Hu & Bentler, 1999; Murray, McKenzie, Kuenssberg, & Booth, 2015; van de Schoot, Lugtig, & Hox, 2012). Whereas the 6–item scales showed a good fit, CFI and TLI >0.920, RMSEA and SRMR <0.075, the 10–item and 4–item scales fit slightly worse meeting some but not all thresholds (Table 4; see also Table 3 for all items and factor loadings based on these CFAs).
Statement and goal (in italics) items of the DoPL scales with factor loadings of the 10–item, 6–item, and 4–item scales based on CFA (first loadings of each scale fixed to 1)
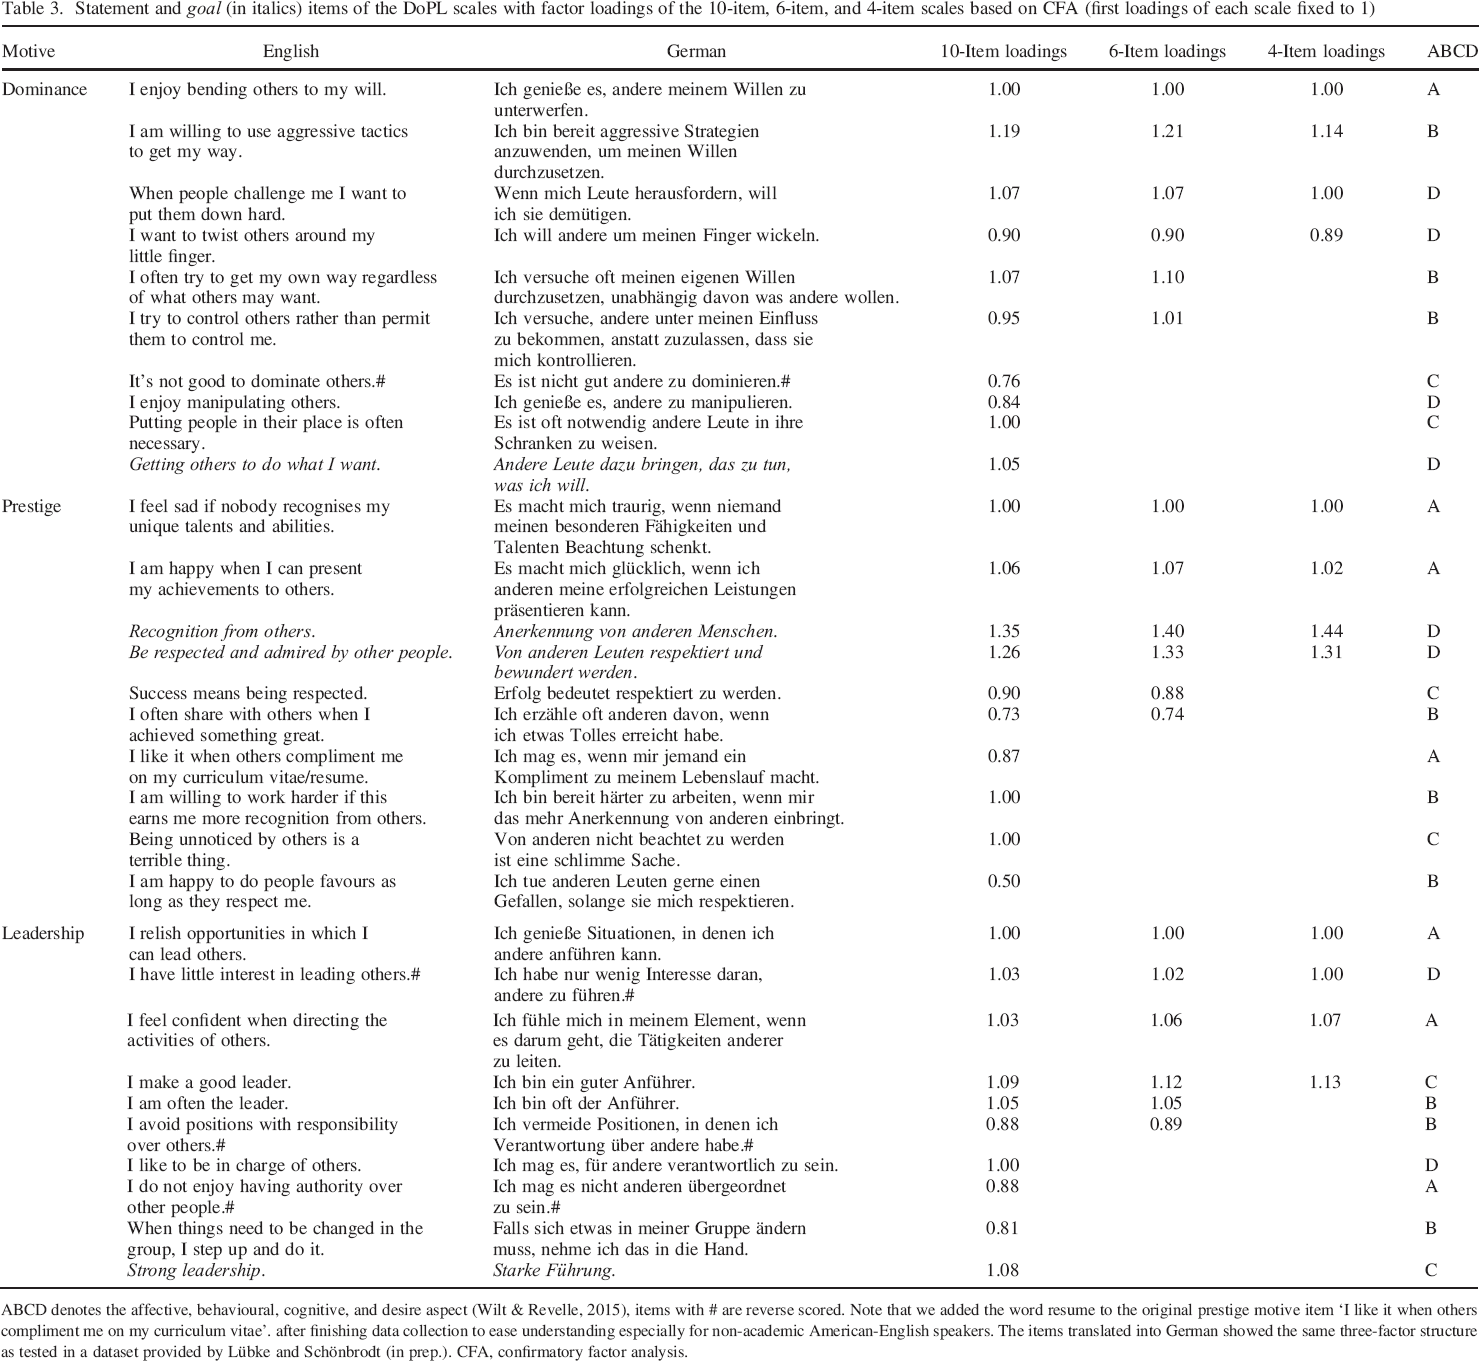
ABCD denotes the affective, behavioural, cognitive, and desire aspect (Wilt & Revelle, 2015), items with # are reverse scored. Note that we added the word resume to the original prestige motive item ‘I like it when others compliment me on my curriculum vitae’. after finishing data collection to ease understanding especially for non–academic American–English speakers. The items translated into German showed the same three–factor structure as tested in a dataset provided by Lübke and Schönbrodt (in prep.). CFA, confirmatory factor analysis.
Fit indices for CFAs with the 10–item, 6–item, and 4–item versions of the DoPL scales (CFA10, CFA6, and CFA4) forcing a three–factor solution, several two–factor solutions based on the 6–item versions of the DoPL scales (CFA6DP, CFA6PL, CFA6DL), a one–factor solution based on the 6–item versions of the DoPL scales (CFA6SI), and a three–factor solution with an additional bifactor onto which all items loaded based on the 6–item versions of the DoPL scales (CFA6BI)
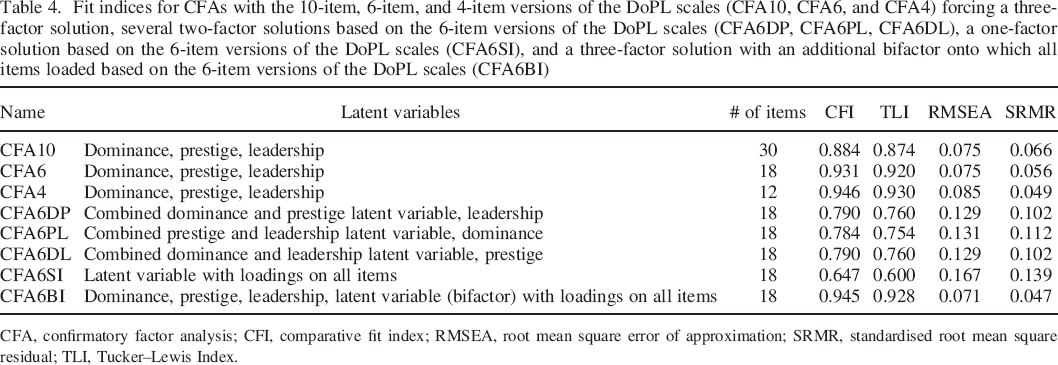
CFA, confirmatory factor analysis; CFI, comparative fit index; RMSEA, root mean square error of approximation; SRMR, standardised root mean square residual; TLI, Tucker–Lewis Index.
Based on the best fitting model with 6–items per DoPL scale (CFA6), we created a range of alternative models, including several two–factor models, a one–factor model, and a three–factor model with a bifactor onto which all items loaded. None of the two–factor models or the one–factor model showed adequate model fits, CFIs and TLIs <0.790, RMSEAs and SRMRs >0.129. Notably, the three–factor model with a bifactor (CFA6BI) fit better, CFI and TLI >0.928, RMSEA and SRMR <0.071, than a model without bifactor (CFA6). We believe this bifactor to represent the common hope to gain power in the DoPL motives, which is substantiated by the DoPL scales’ very high correlations, .59 < rs < .85, with the general power motive (Schönbrodt & Gerstenberg, 2012; see study 2). To investigate the bifactor's strength relative to the specific subscale factors, we calculated several indices recommended by Murray et al. (2015), which showed that the DoPL items more strongly reflected specific factors as opposed to the bifactor. For example, the explained common variance (ECV; Reise, 2012) was higher for the specific factors, ECV = 0.53, than the bifactor, ECV = 0.47; the worst split–half reliability (Revelle, 1979) was higher for individual subscales, β = 0.71 to 0.84, than the bifactor, β = 0.64 (Table S2).
Discussion
In several CFAs, we confirmed the three–factor structure in the 10–item (i.e. 10 items per DoPL scale), 6–item, and 4–item versions of the DoPL scales. Based on these results, all DoPL scales can be used, although the 6–item scales showed the best fit while the 10–item and 4–item scales showed a slightly worse fit. In the following studies, we only report results regarding these 6–item scales; nonetheless, findings regarding the 10–item and 4–item scales were very similar (see additional analysis in our open data set https://osf.io/uxtq2/).
Further CFAs testing two–factor and one–factor models showed insufficient fits and were therefore discarded; however, the fit of a model including the DoPL factors and a bifactor onto which all items loaded was better than the fit of a model without this bifactor. This bifactor likely represents a common hope to gain power inherent in all three DoPL scales. However, given the strong unique influence of the DoPL subscales, we recommend not using weighted subscale scores as, for example, one might mask a negative relationship of a specific DoPL scale with some external variable if the general factor has a strong positive relationship with this variable (e.g. DeMars, 2013; Murray et al., 2015). Rather, to account for the DoPL scales’ shared variance, we recommend conducting linear multiple regressions with all DoPL scales in the same model to obtain residualised/unique effects (Vize, Collison, Miller, & Lynam, 2018) and, for comparison, report correlations of the individual DoPL scales with the external variable.
Study 2: Dominance, Prestige, and Leadership Motives in Relation to the Power Motive
As we conceptualised the DoPL motives as different components of a general power motive (Heckhausen & Heckhausen, 2008; Winter, 1973) in this study, we wanted to demonstrate that the DoPL motives could explain most of the variance in two established power motive scales and further investigate each of the DoPL motives’ unique and shared contribution to this explained variance. For this, we picked the UMS power (Schönbrodt & Gerstenberg, 2012), a modern scale composed of the best items from a range of power motive scales, and Personality Research Form dominance (PRF dominance; Jackson, 1984), the oldest, most widely used power/dominance scale (Mayer, Faber, & Xu, 2007). Notably, PRF dominance does not include prestige aspects but this is to some extent captured in a separate scale called ‘social recognition’ (PRF social recognition). As the item content of both UMS power and PRF dominance scales seemed to be mostly centred on leadership (despite their labels), we hypothesised most of the variance (shared and unique) to be explained by L. 5
Method
Participants
Participants for this study came from sample #1 (n = 400) and #2 (n = 250; Table 1).
Material and procedure
Sample #1 data only included DoPL scales and UMS power but not PRF dominance and PRF social recognition (see Table 1 and https://osf.io/uxtq2/ for complete codebooks). Participants in sample #2 (Table 1) first provided demographic information and then filled in a questionnaire consisting of the 10–item DoPL scales intermingled with UMS power, UMS affiliation, UMS intimacy, UMS achievement (Schönbrodt & Gerstenberg, 2012), PRF dominance, and PRF social recognition 6 (Jackson, 1984). After that, participants played four rounds of a dictator game (see study 5) and were then fully debriefed.
We pooled data from samples #1 and #2 for all analyses involving the DoPL scales and UMS power; analyses involving the DoPL and the PRF scales were only based on sample #2's data. In both samples, we only report data regarding the 6–items DoPL scales (i.e. six items per DoPL scale).
Results
All DoPL motives correlated moderately with each other, .41 < rs < .44. Moreover, all DoPL motives correlated strongly with UMS power, .59 < rs < .85, and moderately to strongly with PRF dominance, .39 < rs < .89. As hypothesised, the correlations between L and UMS power, r = .85, as well as PRF dominance, r = .89, were very high, and PRF social recognition correlated highly with P, r = .64, but showed only small correlations with the other two DoPL motives, .23 < rs < .24 (Table 5).
Zero–order correlations between DoPL scales, two power motive scales (UMS power and PRF dominance), and PRF social recognition
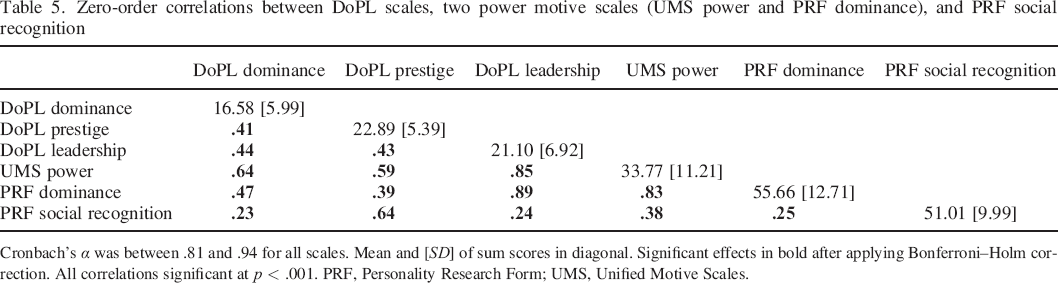
Cronbach's α was between .81 and .94 for all scales. Mean and [SD] of sum scores in diagonal. Significant effects in bold after applying Bonferroni–Holm correction. All correlations significant at p < .001. PRF, Personality Research Form; UMS, Unified Motive Scales.
To investigate shared variance between the DoPL motives, UMS power, and PRF dominance, we conducted two commonality analyses using R's yhat package (Nimon, Lewis, Kane, & Haynes, 2008; Table 6). The DoPL motives explained 84% of the variance in UMS power and 81% in PRF dominance. As hypothesised, L was the biggest contributor of both unique and shared variance (i.e. shared with other DoPL motives) for both UMS power and PRF dominance. However, whereas D and P had a sizeable unique contribution to explaining the variance in UMS power, their contribution to explaining the variance in PRF dominance was almost entirely shared with the respective other DoPL motives.
Commonality analysis of UMS power (upper table) and PRF dominance (lower table) for the total variance explained by the DoPL scales in UMS power (R2 = 0.84) and PRF dominance (R2 = 0.81)
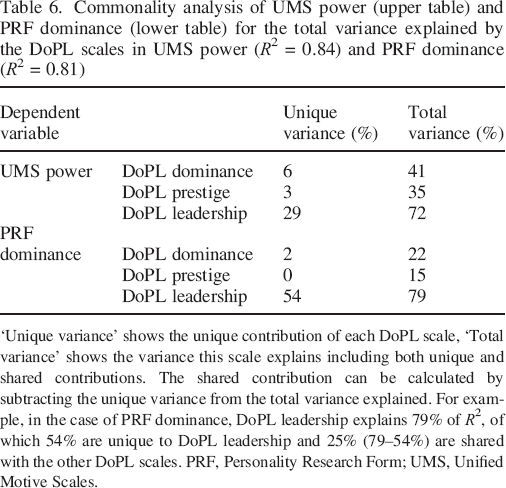
‘Unique variance’ shows the unique contribution of each DoPL scale, ‘Total variance’ shows the variance this scale explains including both unique and shared contributions. The shared contribution can be calculated by subtracting the unique variance from the total variance explained. For example, in the case of PRF dominance, DoPL leadership explains 79% of R2, of which 54% are unique to DoPL leadership and 25% (79–54%) are shared with the other DoPL scales. PRF, Personality Research Form; UMS, Unified Motive Scales.
Discussion
The DoPL motives explained 84% and 81% of the variance in the UMS power (Schönbrodt & Gerstenberg, 2012) and the PRF dominance (Jackson, 1984) scales, respectively, demonstrating very strong relationships with established power motive scales. As expected, L explained the most unique and shared variance in, and had the highest correlation with, both power motive scales. As both of these scales are unidimensional constructs, it is perhaps little surprising that they largely focussed on one particular aspect of power; in this case, leadership. The small relationship between PRF dominance and P is also not surprising, as prestige aspects are not covered by PRF dominance but by a separate scale: PRF social recognition (Jackson, 1984). This latter scale correlated highly with P, although the two scales show some differences: PRF social recognition seems to aim more at social acceptance (e.g. ‘I will not go out of my way to behave in an approved manner’. reverse–coded). Because the DoPL motives explained most of the variance in UMS power and PRF dominance, we believe that these scales measure, to varying degrees, distinct components of the general power motive.
Study 3: Nomological Networks
To show convergent and divergent validity of the DoPLs scales, we situated them in their nomological networks (Cronbach & Meehl, 1955). Thus, based on our conceptualisation of the DoPL motives, we predicted their relationships with personality traits and attitudes (BIG 5: John et al., 2008; narcissistic rivalry and admiration: Back et al., 2013; social dominance orientation: SDO, Pratto, Sidanius, Stallworth, & Malle, 1994), other motives (achievement, affiliation, intimacy, fear of losing control, and fear of losing reputation: Schönbrodt & Gerstenberg, 2012), self–reported behaviour (anger and verbal aggression: A. H. Buss & Perry, 1992; helping behaviour: Penner, Fritzsche, Craiger, & Freifeld, 1995; porn consumption) as well as the number of leading positions in the last 5 years. Note, although we made an effort to base all of our hypotheses on sufficient theoretical foundations, this was not possible in all cases; hence, these correlations are to some extent exploratory and in some cases, we could not make a clear prediction at all. To increase rigour, we thus preregistered our sample size and hypotheses regarding the correlations of the nomological networks (https://osf.io/rge59/). Here, we lay out our view of the expected nomological network relationships via a (somewhat idealised) view of a person driven by each of the DoPL motives (see SOM for Study 3 for a more detailed description and hypothesised sizes of correlations).
Dominance motive (D) predictions
Someone driven to dominate others and avoid being dominated in turn (rfear of losing control > 0; Schönbrodt & Gerstenberg, 2012) is likely to willingly seek out social interaction to pursue this goal (rextraversion > 0) and treat others poorly in such interactions (ragreeableness < 0; cf. John et al., 2008). To be able to dominate others, they likely desire to improve the skills needed to do to so (rachievement > 0; Schönbrodt & Gerstenberg, 2012), are angrier, and show more aggressive behaviour (ranger/raggression > 0; Henrich & Gil–White, 2001) but might also try to satisfy their dominance desires by proxy, for example, by watching someone else dominating another person sexually (rporn consumption > 0; e.g. Heckhausen & Heckhausen, 2008; cf. Bridges, Wosnitzer, Scharrer, Sun, & Liberman, 2010; Wright, Sun, Steffen, & Tokunaga, 2015). Moreover, a dominance–motivated person likely thinks (inappropriately) highly of themselves, particularly in comparison to those whom they (seek to) dominate (rnarcisstic rivalry/rnarcissistic admiration > 0; Back et al., 2013), and believes it is socially appropriate to treat others in this way to benefit oneself/one's group (rSDO > 0; cf. Pratto et al., 1994). As these antisocial attributes might make long–term social relationships difficult, dominance–motivated individuals might not strongly value making friends (raffiliation ≥ 0; Schönbrodt & Gerstenberg, 2012) and are likely even opposed to close intimate relationships (rintimacy < 0; Wurst et al., 2017). Contrarily to prestige–motivated individuals, a dominance–motivated person is not dependent on others’ evaluation to obtain power (rfear of losing reputation = 0; Henrich & Gil–White, 2001), which should make this person's emotional well–being independent of others’ judgement (rneuroticism = 0; John et al., 2008). We made no predictions regarding openness or conscientiousness. We also made no prediction for helping behaviours. This is because such may counteract effects of threatening someone (e.g. Cheng et al., 2010) but on the other hand, when mixed with aggression, could also lead to an ‘attachment trap’ (Bischof, 2008, p. 471) in which the victim perceives the perpetrator as a source of security, thus being beneficial for dominance–motivated people. Finally, given the weak relationships found between dominance and leadership emergence (e.g. Judge, Bono, Ilies, & Gerhardt, 2002), we predicted either no or a weak positive relationship with the number of leadership positions in the last 5 years.
Prestige motive (P) predictions
A prestige–driven person should be similar to a dominance–driven person in some ways and different in several others. While they should also seek out social interactions to satisfy their motive (rextraversion > 0), they would likely treat others in a much more positive fashion (ragreeableness > 0; Garden, Hu, Zhan, & Yao, 2017) and value mutually respectful, healthy relationships (raffiliation/rintimacy > 0; Schönbrodt & Gerstenberg, 2012; Wurst et al., 2017). This dependence on others for satisfaction of this motive, and possibly fearing their judgement (rfear of losing reputation > 0; Miller et al., 2015), might make a prestige–driven person somewhat emotionally dependent on external factors (i.e. neurotic), but emotional instability may also be detrimental to obtaining and maintaining prestige (rneuroticism ≥ 0; Cheng et al., 2010). Prestige–driven people are also likely to seek out opportunities to impress and to diligently work to obtain skills/abilities that are impressive to others (ropenness/rconscientiousness/rachievement > 0; Blickle, 1996; Lee & Klein, 2002; Schönbrodt & Gerstenberg, 2012). Similarly, a prestige–driven person will value being perceived as unique, impressive, and charming (rnarcissistic admiration > 0; Back et al., 2013) but will not desire to devalue or subjugate others (rnarcissistic rivalry = 0; Back et al., 2013) and thus will not generalise such behaviours to social norms (rSDO = 0; Henrich & Gil–White, 2001). This lack of dominance desires might also show in less fear of being controlled and less gratification from viewing sexual domination of others (rfear of losing control/rporn consumption = 0; Heckhausen & Heckhausen, 2008; Schönbrodt & Gerstenberg, 2012). Whereas taking on leadership positions and showing helping behaviour have been linked to obtaining admiration (Bai, 2017; Cheng et al., 2010; Henrich & Gil–White, 2001) and might thus be shown by a prestige–motivated individual (rhelping behaviour/rleadership positions > 0), aggressive behaviour can either be positively (e.g. when directed at a group's opponent; Bischof, 2008) or negatively evaluated (e.g. causing within group conflict; ranger/raggression = 0; Henrich & Gil–White, 2001).
Leadership motive (L) predictions
A leadership–motivated individual should seek out social interactions with people they could potentially lead (rextraversion > 0; Costa & McCrae, 1992; Goldberg et al., 2006); thus, this person should be interested in increasing their social circle (raffiliation > 0; Schönbrodt & Gerstenberg, 2012) and benefit less from few close relationships (rintimacy = 0; Schönbrodt & Gerstenberg, 2012). Leadership status can be achieved/maintained both by cooperative (e.g. Cogliser, Gardner, Gavin, & Broberg, 2012) and/or antagonistic behaviours (ragreeableness = 0; ranger/raggression > 0; Judge et al., 2002; Schwarzmüller, Brosi, Spörrle, & Welpe, 2017; Waasdorp, Baker, Paskewich, & Leff, 2013) but will benefit most from confidence and emotional stability, as opposed to the lack thereof (rneuroticism < 0; Hill & Ritchie, 1977; Judge et al., 2002). Given this middle ground between cooperation and aggression, an aspiring leader should to some degree value social norms supporting dominance (rSDO > 0; French & Raven, 1959). Improving their skill set should increase their chance to lead (rachievement > 0; Schönbrodt & Gerstenberg, 2012) and whereas achieving a leadership position should strongly satisfy their leadership desires (rleadership positions > 0; Chan & Drasgow, 2001) watching pornography should not (rporn consumption = 0). Having obtained a leadership position, a leadership–motivated individual should fear to lose it again (rfear of losing control > 0; rfear of losing reputation ≥ 0; Howell & Shamir, 2005; Schönbrodt & Gerstenberg, 2012). As leadership involves responsibility taking this person should show prosocial helping behaviour in their larger social group (rhelping behaviour > 0; Van Vugt, 2006). Although narcissistic admiration correlates positively with self–assignment of leadership roles (Back et al., 2013), the social emergence and maintenance of leadership would not likely/typically benefit from overt, extreme narcissism (rnarcissistic rivalry/rnarcissistic admiration ≥ 0; Grijalva, Harms, Newman, Gaddis, & Fraley, 2015). We made no predictions for conscientiousness and openness.
Method
Participants
Participants for this study came from sample #1 (n = 400; Table 1).
Material and procedure
After filling in the DoPL scales and UMS scales for power, affiliation, achievement, intimacy, fear of losing control, and fear of losing reputation (Schönbrodt & Gerstenberg, 2012), participants filled in the following validation scales in this fixed order: (1) intermingled Big Five personality variables (John et al., 2008; Rammstedt & John, 2007), (2) Narcissism Admiration and Rivalry Questionnaire (Back et al., 2013), (3) SDO (Pratto et al., 1994), (4) intermingled anger and verbal aggression scales (A. H. Buss & Perry, 1992), (5) self–reported helping behaviour scale (Penner et al., 1995), (6) one question about average weekly pornography consumption in hours, and (7) one question about the number of leadership positions in the last 5 years (see Table S4 for more details). All measures were standardised for analysis.
Results
Preregistered analysis (correlations)
Correlations of r ≥ |.15| were significant at p < .05 after applying correction for multiple comparisons (see Table 7 for complete overview of results). DoPL scales’ correlations with DVs did not differ significantly across gender (Table S5). As predicted, D correlated small to moderately negatively with agreeableness, r = −.34, and positively with extraversion, r = .23. It did not correlate with neuroticism, openness, or conscientiousness, rs < |.10|. Further, it correlated positively and strongly with both narcissistic admiration, r = .55 (somewhat higher than expected), and rivalry, r = .64. As hypothesised, D correlated moderately with SDO, r = .34. Regarding other motives, D showed the predicted small positive correlations with achievement, r = .24, and fear of losing control, r = .22. The correlations with affiliation desires, r = .33, and fear of losing reputation, r = .19, were somewhat higher than expected. As opposed to the predicted negative correlation, D showed a zero correlation with intimacy desires, r = .01. Regarding self–reported behaviour, D showed the predicted moderate to strong correlations with verbal aggression, r = .54, anger, r = .35, and porn consumption, r = .28. D did not correlate with helping behaviour, r = .04, and showed a small correlation with the number of leading positions in the last 5 years, r = .19.
Relationship of Dom (inance), Pre (stige), and Lead (ership) motives with nomological network variables as zero–order correlations and in multiple regressions including all DoPL motives in the same model
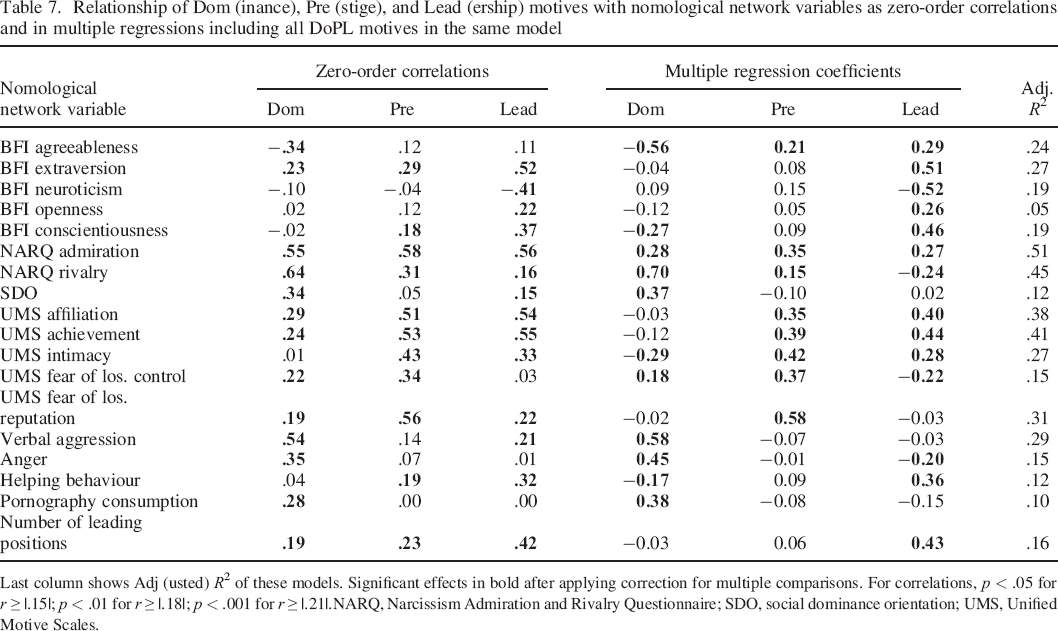
Last column shows Adj (usted) R2 of these models. Significant effects in bold after applying correction for multiple comparisons. For correlations, p < .05 for r ≥ |.15|; p < .01 for r ≥ |.18|; p < .001 for r ≥ |.21|.NARQ, Narcissism Admiration and Rivalry Questionnaire; SDO, social dominance orientation; UMS, Unified Motive Scales.
Opposed to our prediction, P did not correlate significantly with agreeableness, neuroticism, or openness, rs < |.12|. Nonetheless, it showed the predicted small correlation with conscientiousness, r = .18, and a somewhat smaller–than–predicted correlation with extraversion, r = .29. P showed the expected strong and positive relationship with narcissistic admiration, r = .58, but also a stronger–than–expected relationship with narcissistic rivalry, r = .31. As hypothesised, P did not correlate with SDO, r = .05. Further, as hypothesised, P correlated strongly with desires for affiliation, achievement, and fear of losing reputation, .53 < rs < .56, and stronger than expected with desires for intimacy, r = .43, and the fear of losing control, r = .34. Following our predictions, P did not correlate with verbal aggression, anger, or porn consumption, rs < |.14| and showed a small correlation with the number of leading positions, r = .23. The positive relationship between P and helping behaviour was somewhat smaller than expected, r = .19.
As hypothesised, L did not correlate with agreeableness, r = .11, correlated positively and strongly with extraversion, r = .52, and showed a negative but stronger–than–expected relationship with neuroticism, r = −.41. Moreover, L correlated moderately with openness, r = .22, and conscientiousness, r = .37. L was much stronger related to narcissistic admiration, than we expected, r = .56, and a little bit stronger than expected to narcissistic rivalry, r = .16; however, showed the predicted small relationship with SDO, r = .15. Whereas L's relationships with desires for affiliation, r = .55, achievement, r = .55, intimacy, r = .33, and the fear of losing reputation, r = .22, were all stronger than hypothesised, its relationship with the fear of losing control was smaller than expected, r = .03. L showed the hypothesised small correlation with verbal aggression, r = .21, but opposed to our prediction, no correlation with anger, r = .01. As hypothesised, L did not correlate with porn consumption, r = .00, but correlated moderately with helping behaviour, r = .32, and the number of leading positions, r = .42.
Exploratory analysis (regression models)
To account for the shared variance among the DoPL motives, which is probably largely because of a general hope to gain power in all DoPL motives (see study 1), we conducted linear regressions including all three DoPL motives as IVs and each nomological network variable as DV (Table 7). 7 These results can be understood as power desires unique to each DoPL motive, and we will thus refer to them as residualised effects (cf. Vize et al., 2018). Here and in the following research, we treat effect sizes of β = |0.05| as small, β = |0.25| as moderate, and β = |0.45| as large (Peterson & Brown, 2005). Accounting for the DoPL, scales’ shared variance generally augmented the differences between them. For example, whereas agreeableness, β = −0.56, p < .001, and intimacy desires, β = −0.29, p < .001, were negatively related to residualised D, they were positively related to residualised P and L, βs > 0.21, ps < .001. Whereas conscientiousness, β = −0.27, p < .001, and helping behaviour, β = −0.17, p = .030, were negatively related to residualised D, they were unrelated to residualised P, βs = 0.09, ps = 1, and positively related to residualised L, β = 0.46, p < .001, and β = 0.36, p < .001, respectively. Moreover, after controlling for shared variances, only residualised D predicted SDO, β = 0.37, p < .001, and verbal aggression, β = 0.58, p < .001, only residualised P predicted the fear of losing reputation, β = 0.58, p < .001, and only residualised L predicted extraversion, β = 0.51, p < .001, and the number of leading positions, β = 0.43, p < .001.
Discussion
To locate the DoPL scales within their nomological networks, we investigated their relationships with a range of relevant personality traits, attitudes, other motives, and self–reported behaviour. In line with our hypotheses, the most distinct attributes of highly dominance–motivated individuals were being disagreeable, verbally aggressive, often angry, interested in their in–group being superior to out–groups, and watching a significant amount of pornography. Highly leadership–motivated individuals seemed to be very extraverted, emotionally stable, reported more helping behaviour, and held many leading positions in the last 5 years. Highly prestige–motivated individuals showed the strongest fears to lose reputation, had high desires for intimacy, and, together with leadership–motivated people, showed high desires for affiliation and achievement. Notwithstanding, some hypotheses could not be confirmed. Most strikingly, D and L were more strongly related to narcissistic admiration, P was more strongly related to narcissistic rivalry than we had hypothesised. This indicates people desiring power are generally more narcissistic than we had anticipated (cf. Zeigler–Hill et al., 2018). Whereas we had predicted L to relate to the fear of losing control and P being unrelated to it, P turned out to predict the fear of losing control; L did not. This seems to match a pattern of leadership–motivated individuals being more self–confident (i.e. high emotional stability and only small fears of losing reputation) as compared with prestige–motivated individuals (i.e. high fears of losing control and reputation; cf. Bischof, 2008). Moreover, we had predicted prestige–motivated individuals to report more helping behaviour as this might signal higher morals and might thus increase others’ admiration for them (e.g. Bai, 2017); nonetheless, this relationship was weak (see General Discussion section).
When shared ‘hope for power’ desires among the DoPL scales were accounted for, their relationships to the nomological network variables were somewhat more nuanced. For example, whereas in zero–order correlations, only D related negatively to agreeableness; taking into account shared DoPL influences, residualised P and residualised L related positively to agreeableness while residualised D still predicted it negatively. This highlights weaker non–shared relationships of agreeableness with P and L (e.g. Cogliser et al., 2012; Garden et al., 2017). Whereas all DoPL motives related positively to extraversion and the number of leadership positions in zero–order correlations, all of this variance was explained by residualised L, indicating that residualised L predicted extraversion and leadership positions above and beyond D and P (cf. Costa & McCrae, 1992; Goldberg et al., 2006). Whereas both P and L showed zero–order correlations with helping behaviour and D did not, after controlling for shared influences, residualised D predicted helping behaviour negatively, residualised P was unrelated, and residualised L stayed positively related, which indicates specific antagonistic and prosocial tendencies in D and L, respectively (e.g. Cheng et al., 2010; Van Vugt, 2006). In sum, the DoPL scales showed many predicted and differential relationships with variables constituting their nomological networks; however, not all of our hypotheses could be confirmed and some differences only showed after shared desires for power had been controlled for. Thus, additional studies are needed to further delineate the DoPL scales’ nomological network differences (study 4) and to demonstrate the DoPL scales’ discriminant and predictive validity (studies 5 to 7).
Study 4: Dominance, Prestige, and Leadership Motives and Moral Concerns
To expand the DoPL scales’ nomological networks, in particular regarding the prestige motive, we investigated the DoPL scales’ relationship with self–reported moral concerns. Morals can be delineated along five trans–cultural foundations: caring for and not harming others (harm), being fair to others (fairness), favouring one's in–group (in–group), obeying authorities (authority), and abstaining from disgusting things/actions (purity; Graham et al., 2011; Haidt & Graham, 2007; Shweder, Much, Mahapatra, & Park, 1997). The propensity to hold these morals likely developed through evolutionary adaptions at a group level (e.g. Bai, 2017) as morals represented codes of conduct, which would have benefitted societies by aiding their maintenance and survival (e.g. Alexander, 2007). Thus, adaptive pressures might have selected for people valuing moral individuals (e.g. through voluntary deference/admiration) as well as for individuals to at least appear moral in order to reap these benefits (e.g. Bai, 2017; Cheng & Tracy, 2014). As this kind of reward represents strong incentives to prestige–motivated people, we predicted P to be positively related to higher endorsement of moral concerns. We made no a priori predictions regarding D and L.
Method
Participants
Participants for this study came from samples #3, #4, and #5 (Table 1), yielding a combined sample of n = 939.
Material and procedure
Moral concerns were measured with the Moral Foundation Questionnaire (Graham et al., 2011) with six items per moral concern/foundation (e.g. ‘Compassion for those who suffer is the most crucial virtue’. for the harm foundation). The DoPL scales were measured with the 10–item DoPL scales (samples #3 and #4) and the 6–item DoPL scales (sample #5); however, as with all other studies, we only report results regarding the 6–item DoPL scales (i.e. six items per DoPL motive). All scales were embedded in studies focussing on different research questions: Sample #3, the relationship between the DoPL motives and employment ranks (see study 7) and differences in unconscious motives for dominance and prestige (reported elsewhere); sample #4, the relationship between power and moral disengagement (reported elsewhere); and sample #5, the relationship between the DoPL motives and charitable giving (see study 6) and employment ranks (see study 7). Any experimental manipulation in these studies was performed after questionnaire data had been obtained. More information regarding all measures and procedures applied across all three samples can be found here: https://osf.io/uxtq2/. All measures were standardised for analysis.
Results
As previously found, the DoPL scales correlated moderately with each other, .27 < rs < .35, ps < .001, and showed sufficient internal consistencies (Cronbach's αs = .79 to .89). In line with the published literature (e.g. Graham et al., 2011), internal consistencies of moral concerns were somewhat lower (Cronbach's αs = .65 to .75) and correlations ranged from uncorrelated to strongly correlated, .04 < rs < .68 (Table 8). After pooling all three samples, P showed the predicted positive but small correlations with all five moral concerns, .10 < rs < .25, ps < .007. Whereas D correlated small and negatively with concerns for harm, r = −.18, p < .001, and fairness, r = −.10, p = .008, it correlated small and positively with concerns for in–group, authority, and purity, .11 < rs < .16, ps < .008. L showed the same pattern with a small and negative relationship to harm concerns, r = −.07, p = .046, a descriptively negative but non–significant relationship to fairness concerns, r = −.04, p = .215, and small and positive relationships to concerns for in–group, authority, and purity, .14 < rs < .18, ps < .001 (Table 9). DoPL scales’ correlations with moral concerns did not differ significantly across gender (Table S6).
Zero–order correlations and Cronbach's αs of five moral concerns
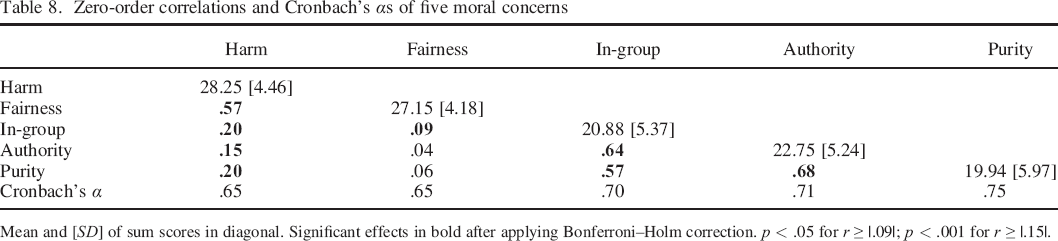
Mean and [SD] of sum scores in diagonal. Significant effects in bold after applying Bonferroni–Holm correction. p < .05 for r ≥ |.09|; p < .001 for r ≥ |.15|.
Relationship of Dom (inance), Pre (stige), and Lead (ership) motives with moral concerns as zero–order correlations and in multiple regressions including all DoPL motives in the same model
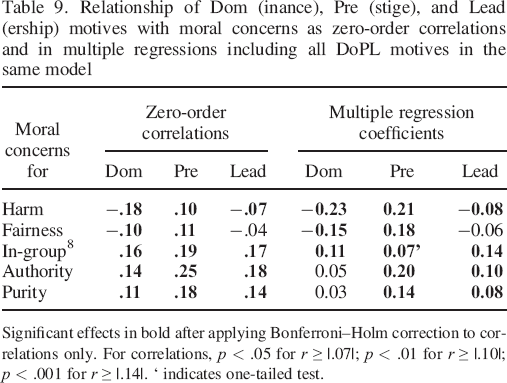
Significant effects in bold after applying Bonferroni–Holm correction to correlations only. For correlations, p < .05 for r ≥ |.07|; p < .01 for r ≥ |.10|; p < .001 for r ≥ |.14|. ‘ indicates one–tailed test.
To account for the shared general hope to gain power among the DoPL motives (see study 1), we conducted multiple regression models (model 0s) on each moral concern including all three DoPL motives simultaneously as predictors. Moreover, to account for idiosyncrasies of individual samples, we compared each of these models with a model (model 1s) which additionally included 2 sum–contrast factors that encoded the three sample (to assess whether there were mean differences of moral concerns across samples) and a model (model 2s) which additionally included the sample contrast as well as interactions between sample contrasts and each DoPL motive (to assess whether the relationship between each DoPL motive and moral concerns differed across sample). With the exception of moral concerns for in–group Χ2 model comparisons indicated that there were no mean differences in moral concerns and no differences between the relationships of DoPL motives and moral concerns across all three samples, ps > .085. For simplicity, here, we will only report DoPL coefficients of the besting fitting models (model 0s regarding moral concerns for harm, fairness, authority, and purity; model 2 for in–group). 8 The DoPL motives’ residualised effects largely mirrored correlational findings. As before and as predicted, residualised P related positively with small to moderate effect sizes to all moral concerns, 0.07 < βs < 0.21, ps < .047 (Table 9). Residualised D still related negatively and small to moderately to concerns for harm, β = −0.23, p < .001, and fairness, β = −0.15, p < .001 as well as small and positively to in–group concerns, β = 0.11, p = .012. However, diverting from the correlational findings, residualised D did not relate to concerns for authority and purity, βs < 0.05, ps > .169. Similar to correlational findings, residualised L related negatively and with small effect sizes to concerns for harm, β = −0.08, p = .016, and positively to concerns for in–group, β = 0.14, p = .005, authority, β = 0.10, p = .003, and purity, β = 0.08, p = .012, as well as non–significantly to concerns for fairness, β = −0.06, p = .083 (Table 9).
Discussion
Based on the assumption that having, or claiming to have, high moral standards would gain admiration and voluntary deference of others (i.e. prestige; Bai, 2017; Cheng & Tracy, 2014), we predicted highly prestige–motivated individuals to indicate having higher moral concerns across all moral domains (cf. Graham et al., 2011). This hypothesis was confirmed for all five moral concerns for both zero–order and residualised P effects. Arguably, the most important moral domain is being concerned about (not) harming others, as about half of moral incidents in our daily lives are concerned with this aspect (Hofmann, Wisneski, Brandt, & Skitka, 2014). This moral concern showed the most striking differences among the DoPL motives as both zero–order and residualised effects of P related positively to it whereas both zero–order and residualised effects of D and L related negatively to it. This indicates the important and unique role of prestige among the DoPL motives when predicting the intersection of morality and power–relevant outcomes.
We had not made any hypotheses for D and L. Interestingly, their pattern of being negatively related to concerns for harm and fairness as well as being positively related to concerns for in–group, authority, and purity mirrored the distinction between superordinate moral factors of individualising and binding (Graham et al., 2011). Whereas the individualising factor (harm and fairness) relates to a liberal, the binding factor (in–group, authority, and purity) relates to a conservative political ideology (Graham, Haidt, & Nosek, 2009). Nonetheless, given that not all relationships with the relevant moral concerns were statistically significant for both zero–order and residualised effects, as well as these findings being exploratory, future research must address whether there is a systematic pattern behind D, L, and the moral underpinnings of political ideology.
Study 5: Dominance, Prestige, and Leadership Motives and Dictator Game Behaviour
To demonstrate the DoPL scales’ predictive validity beyond mere self–report measures, we conducted three studies (studies 5 to 7) focussing on more objective power correlates. In the present preregistered study (https://osf.io/cmw75), we examined the DoPL scales’ relation to agonistic and retaliatory behaviour in a dictator game (DG). The DG is an economic decision problem in which one person, a dictator, is endowed with a certain amount of money (e.g. three GBP), which they need to split with another person, the receiver, who has no other choice than accepting this split (Kahneman, Knetsch, & Thaler, 1986). Proportions given in DGs have been found to relate negatively to dictators’ general power motives (Baumert, Schlösser, & Schmitt, 2014; Schönbrodt & Gerstenberg, 2012). This might be because of dominance desires within the power motive, as by withholding money one exerts the kind of agonistic influence (i.e. forcing one's will upon others) desired by dominance–motivated people (cf. Cheng & Tracy, 2014; Henrich & Gil–White, 2001). Additionally, if money was withheld from dominance–motivated receivers, they should retain even more money in a consecutive DG playing as dictator. Such retaliatory behaviour (even when not directed at the original perpetrator; Sjöström & Gollwitzer, 2015) should serve to reinstate dictators’ feelings of dominance (see motivational arousal; Heckhausen & Heckhausen, 2008) and relate to dominance proxies such as SDO (Gerber & Jackson, 2013) and anger (Gollwitzer, Meder, & Schmitt, 2011). Hence, we predicted a negative relationship between D and proportions given in a DG (neutral condition); this effect should be augmented if dictators had not received any money in previous DGs (arousal condition).
Given results of a pilot study (SOM for Study 5) and the theoretically strongest relationship, we believed D to best predict DG behaviour. However, we also made predictions for weaker P and L effects. Based on the assumption that male leadership tends to be more self–centred and assertive as compared with female leadership (Eagly & Johnson, 1990; Moskowitz, Suh, & Desaulniers, 1994) and in the absence of potential prosocial influences of responsibility taking in anonymous 1:1 interactions, we predicted a negative relationship between L and proportions given in the DG in men but not in women. Regarding P, we hypothesised a positive relationship with proportions given in the DG as this kind of altruistic behaviour might still signal a higher level of morality even in an anonymous DG context (e.g. Cheng & Tracy, 2014 and see study 4).
Method
Participants
Participants for this study came from sample #2 (Table 1). The sample size (n = 250) was determined by the smallest effect size for any DoPL motive in a pilot study (SOM for Study 5) of the DGs neutral condition.
Material and procedure
This study was conducted online. After participants filled in the DoPL scales intermingled with UMS power, affiliation, achievement, intimacy (Schönbrodt & Gerstenberg, 2012), PRF dominance, and social recognition (Jackson, 1984; see study 2), they were introduced to the DG. Participants were shown 10 examples of possible splits to make sure they understood the rules of the game. Participants were told that they would play four rounds of the DG with a 3 GBP stake: two rounds as receiver (the money would, ostensibly, come from the two persons that have filled in the survey just before them) and two rounds as dictator (the money would, ostensibly, go to the two people who would fill in the survey immediately after the participant). Note that we labelled the DG as an ‘economic exchange game’ and dictators as ‘proposers’ to avoid demand characteristics of highly dominant individuals. Participants were told that they would get paid all rewards as receiver and one randomly selected reward in the role of dictator. In reality, they were paid a base rate of 1 GBP as well as the amount of money won in the first DG played as dictator. The order of playing dictator and receiver roles was ostensibly randomised; however, the order was fixed as dictator, receiver, receiver, dictator. When participants played as receiver, they always received 0 GBP in order to create two conditions: a neutral condition when playing as dictator for the first time and an arousal condition when playing as dictator for the second time. After this, participants were fully debriefed. All measures were standardised for analysis.
Results
While the DoPL scales correlated moderately with each other, .37 < rs < .40, ps < .001, the proportion given in the neutral condition correlated strongly with the proportion given in the arousal condition, r = .55, p < .001. The only significant correlation among the DoPL motives and proportions given was a small and predicted negative relationship between D and the proportion given in the arousal condition, r = −.17, p = .041. This means, following two DGs in which they received nothing, being more dominance motivated predicted giving less money to the receiver (Table 10). DoPL scales’ correlations with DVs did not differ significantly across gender (Table S8).
Zero–order correlations between DoPL motives and proportion (in pennies) out of 3 GBP given to the receiver in a dictator game in neutral (NC) and arousal condition (AC; i.e. after having received nothing twice in previous dictator games)
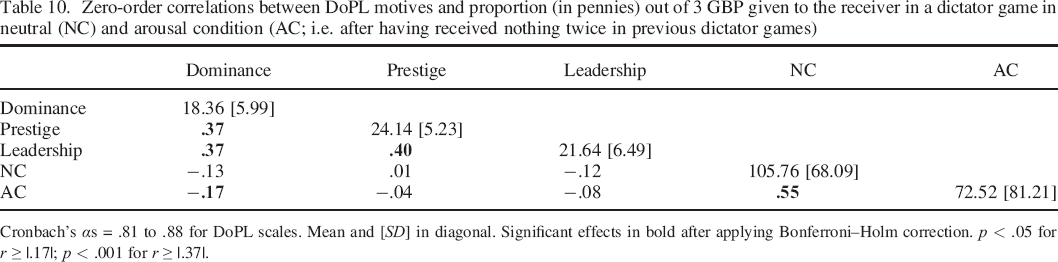
Cronbach's αs = .81 to .88 for DoPL scales. Mean and [SD] in diagonal. Significant effects in bold after applying Bonferroni–Holm correction. p < .05 for r ≥ |.17|; p < .001 for r ≥ |.37|.
Preregistered analysis
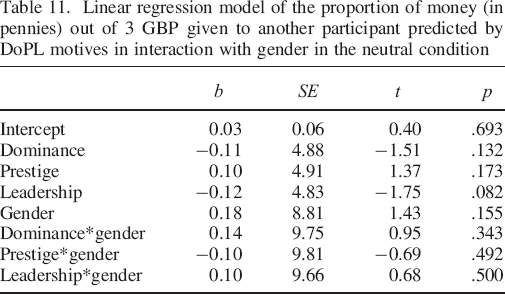
To investigate our predicted baseline and gender effects of the DoPL motives while simultaneously accounting for shared variance among them, we conducted a preregistered regression model with proportions given in the neutral condition as DV, DoPL motives, gender (effect coded: men = −0.5), and the two–way interactions between gender and the DoPL motives as IVs. Although all hypothesised residualised effects pointed in the predicted direction (D: β = −0.11; P: β = 0.10; L*gender: β = 0.10), none were significant (all ps > .132; Table 11). Extending this model to include condition as a within–subject factor (effect coded: neutral = −0.5; arousal condition = 0.5), all two–way interactions between condition and the DoPL motives, and the interaction between condition and gender, we conducted a multilevel model with by–participant random intercepts and by–participant random slopes for condition (Table 12). 9 Residualised D showed the predicted negative and small relationship to proportions given averaged across both conditions, β = −0.14, p = .026. However, it did not differ, as we had hypothesised, between conditions, β = −0.08, p = .226. Besides a large effect of condition, β = −0.44, p < .001, showing participants gave far less money when aroused, no other effects reached significance, ps > .226.
Linear regression model of the proportion of money (in pennies) out of 3 GBP given to another participant predicted by DoPL motives in interaction with gender in the neutral condition
Multilevel regression model of the proportion of money (in pennies) out of 3 GBP given to another participant predicted by DoPL motives, condition (neutral and arousal condition), gender, and all two–way interactions with these variables with by–participant random intercepts and by–participant random slopes for condition
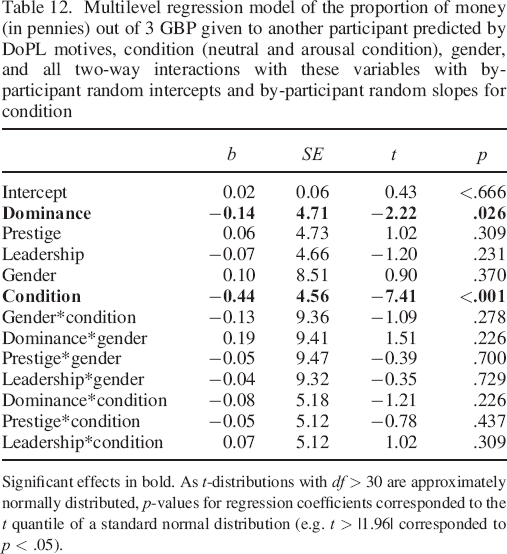
Significant effects in bold. As t–distributions with df > 30 are approximately normally distributed, p–values for regression coefficients corresponded to the t quantile of a standard normal distribution (e.g. t > |1.96| corresponded to p < .05).
Discussion
To further demonstrate the DoPL scales’ predictive and discriminant validity, we could show that only D predicted the proportion of money given in a DG. We proposed this effect of more dominance–motivated dictators giving less to receivers to be because of the former behaving generally agonistically, and specifically vengefully after having been dominated (i.e. been withheld money; e.g. Gerber & Jackson, 2013; Heckhausen & Heckhausen, 2008; Henrich & Gil–White, 2001). Despite our hypothesis, neither individuals’ D nor residualised D (i.e. after controlling for shared DoPL influences) significantly predicted their proportion given in the neutral condition but did after money had been withheld from them (i.e. in the arousal condition). However, as these dominance effects did not differ significantly between conditions, we believe D and residualised D predicting the proportion given in the arousal condition to be best explained by a combination of agonistic and retaliatory effects. Effects for P and L followed the predicted directions descriptively but were too small to be detected given our sample size (see Limitations in General Discussion section). This was unsurprising as we believed the positive prestige effect, based on seeking admiration through prosocial behaviour (e.g. Bai, 2017), to be attenuated in the DG's anonymous 1:1 setting and the negative male leadership effect, based on male leadership being more self–centred (e.g. Moskowitz et al., 1994), to be somewhat spurious. In sum, this study adds to the DoPL scales’ predictive validity by demonstrating the unique predictive validity of D in relation to agonistic and vengeful behaviour in the DG.
Study 6: Dominance, Prestige, and Leadership Motives and Charitable Giving
Here, we investigated the DoPL scales’ relationship with charitable donation behaviour. As we previously argued, prosocial behaviour such as donating money to charities should serve as a way to signal higher morality, which in turn should lead to individuals obtaining more admiration (Bai, 2017; Cheng & Tracy, 2014). As the latter represents a prestige incentive, highly prestige–motivated individuals should display more donating behaviour. Congruently, we found that P and residualised P related positively to measured moral concerns (study 4) and P, yet not residualised P, related positively to self–reported helping behaviour (study 3). However, neither P nor residualised P predicted prosocial/generous giving in an anonymous DG (study 5). To account for shortcomings in these previous studies, here, we investigated actual donating behaviour instead of self–reports (i.e. participants could donate part of their monetary reward for this study to a charity), made this behaviour overt as opposed to anonymous (i.e. participants’ names could be displayed on a list of current top 15 donors), and used a flexible Bayesian sampling procedure to be able to detect small but unknown effect sizes (Schönbrodt, Wagenmakers, Zehetleitner, & Perugini, 2017).
Although our main focus in this study was to validate P, we also made hypotheses for D and L. Following previous reasoning, we predicted D to be negatively related to charitable giving as this represents the self–serving, agonistic tendencies in dominance–motivated people (cf. Cheng et al., 2010; Henrich & Gil–White, 2001 and see study 5). Conversely, L should be positively related to donating behaviour as this might represent, other than in anonymous 1:1 DG contexts (see study 5), a kind of responsibility taking appealing to leadership–motivated individuals (cf. Van Vugt, 2006; see also study 3). We preregistered these hypotheses, the confirmatory statistical models to test them, as well as the sample size and rationale (https://osf.io/7c8sn/).
Methods
Participants
Participants for this study came from sample #5 (n = 550; Table 1).
Preregistered study design and sample size rationale
We had preregistered this study to contain two experimental conditions (overt and covert donation condition) and used a sequential Bayes factor (BF; Morey & Rouder, 2015; Schönbrodt et al., 2017) approach to sample as many participants as needed to detect an a priori unknown effect size for residualised P. Throughout, we used standard ‘medium’ wide priors based on a Cauchy distribution with scale parameter r = sqrt(2)/4 (Morey & Rouder, 2015). Using the amount donated by participants as DV, we first sampled within the overt donation condition aiming to reach predetermined thresholds of BF10 > 6 for the model comparisons ‘intercept only’ (H0a) versus ‘intercept + dominance + prestige + leadership’ (H1a) and ‘intercept + dominance + leadership’ (H0b) versus ‘intercept + dominance + prestige + leadership’ (H1b), indicating that data are six times more likely under the H1 models than under the H0 models. As after reaching our maximum sample size of n = 550 (predetermined by our budget), the BFs indicated, if anything, anecdotal evidence for the H0 (BFs10 < 0.30) we stopped sampling (i.e. we did not sample any participants in the covert condition). Hence, we could not conduct all of our preregistered statistical models and therefore conducted a more fine–grained exploratory analysis of the overt condition only. To increase robustness of these findings, we only conducted Bayesian analyses that can be interpreted independent of sampling stops (e.g. Kruschke, 2015); however, as with all exploratory analyses, any findings reported here have to be interpreted cautiously.
Procedure and material
This study was conducted online and was introduced as a survey on personality, employment positions, and opinions regarding charities. After filling in the 6–item DoPL scales (i.e. six items per DoPL motive) intermingled with 6–item versions of the UMS affiliation and intimacy scales (Schönbrodt & Gerstenberg, 2012), items to measure moral concerns (see study 4) and employment ranks (see study 7), participants read a brief description of three real British humanitarian charities (e.g. www.childrenwithcancer.org.uk). We then asked if they were to donate any money to a charity, which one of these charities they would choose. Following this, we asked three decoy questions regarding the chosen charity (e.g. ‘Have you ever donated money to this charity?’). In the overt condition, participants then saw a list of the ostensible current top 15 donors who filled in this survey, with 15 fake names, locations, and the charity these people ostensibly had donated to. People on this list were ranked by the proportions of their earnings without displaying the donated amount, which, together with the list being updated after 4, 15, and 25 seconds, was intended to create the illusion that positions were still contestable. Following this, participants could choose to donate any proportion (in 10% increments) of their 1.20 GBP earnings of this study to their chosen charity and could then provide their name and location to be displayed in the list of top 15 donors. The covert condition would have been identical except without displaying the list and the option to provide one's information. Immediately after this, participants were fully debriefed, informed that because of the deception, no money had gone to their chosen charities and were paid the full 1.20 GBP. Nonetheless, we provided web links to all charities in case participants wanted to donate some money after all. All measures were standardised for analysis.
Results
Dominance, prestige, and leadership motives (Cronbach's αs = .80 to .91) correlated moderately with each other, .33 < rs < .38, ps < .001, but showed no significant zero–order correlations with the amount donated to charities, −.08 < rs < .07, ps > .186 (Table 13). DoPL scales’ correlations with the amount donated did not differ significantly across gender (Table S11).
Zero–order correlations of DoPL motives and amount donated to charities
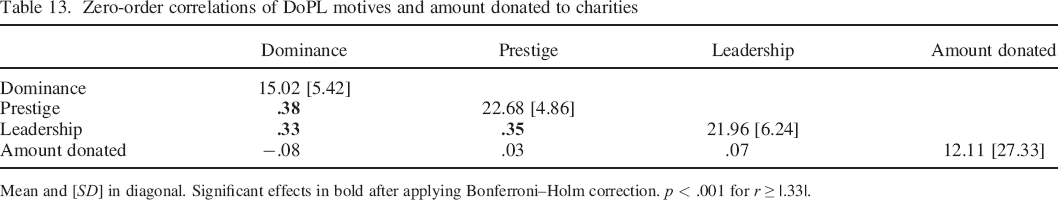
Mean and [SD] in diagonal. Significant effects in bold after applying Bonferroni–Holm correction. p < .001 for r ≥ |.33|.
Preregistered analysis
To compare unique and shared DoPL motive relationships, we conducted one model including all DoPL motives at the same time (to investigate residualised effects free from shared DoPL influences) and three models with each individual DoPL motive as IVs. Whereas the amount donated showed the predicted negative and small relationship with residualised D, M = −0.12, 95% equal tailed interval (ETI) [−0.21, −0.03], 10 it showed the predicted positive and small relationship with residualised L, M = 0.09, 95% ETI [0.00, 0.18]. Residualised P only descriptively showed the predicted positive relationship with the amount donated, M = 0.04, 95% ETI [−0.05, 0.13], (Figure 1). None of the DoPL motives predicted the amount donated as individual IVs (Table S12).
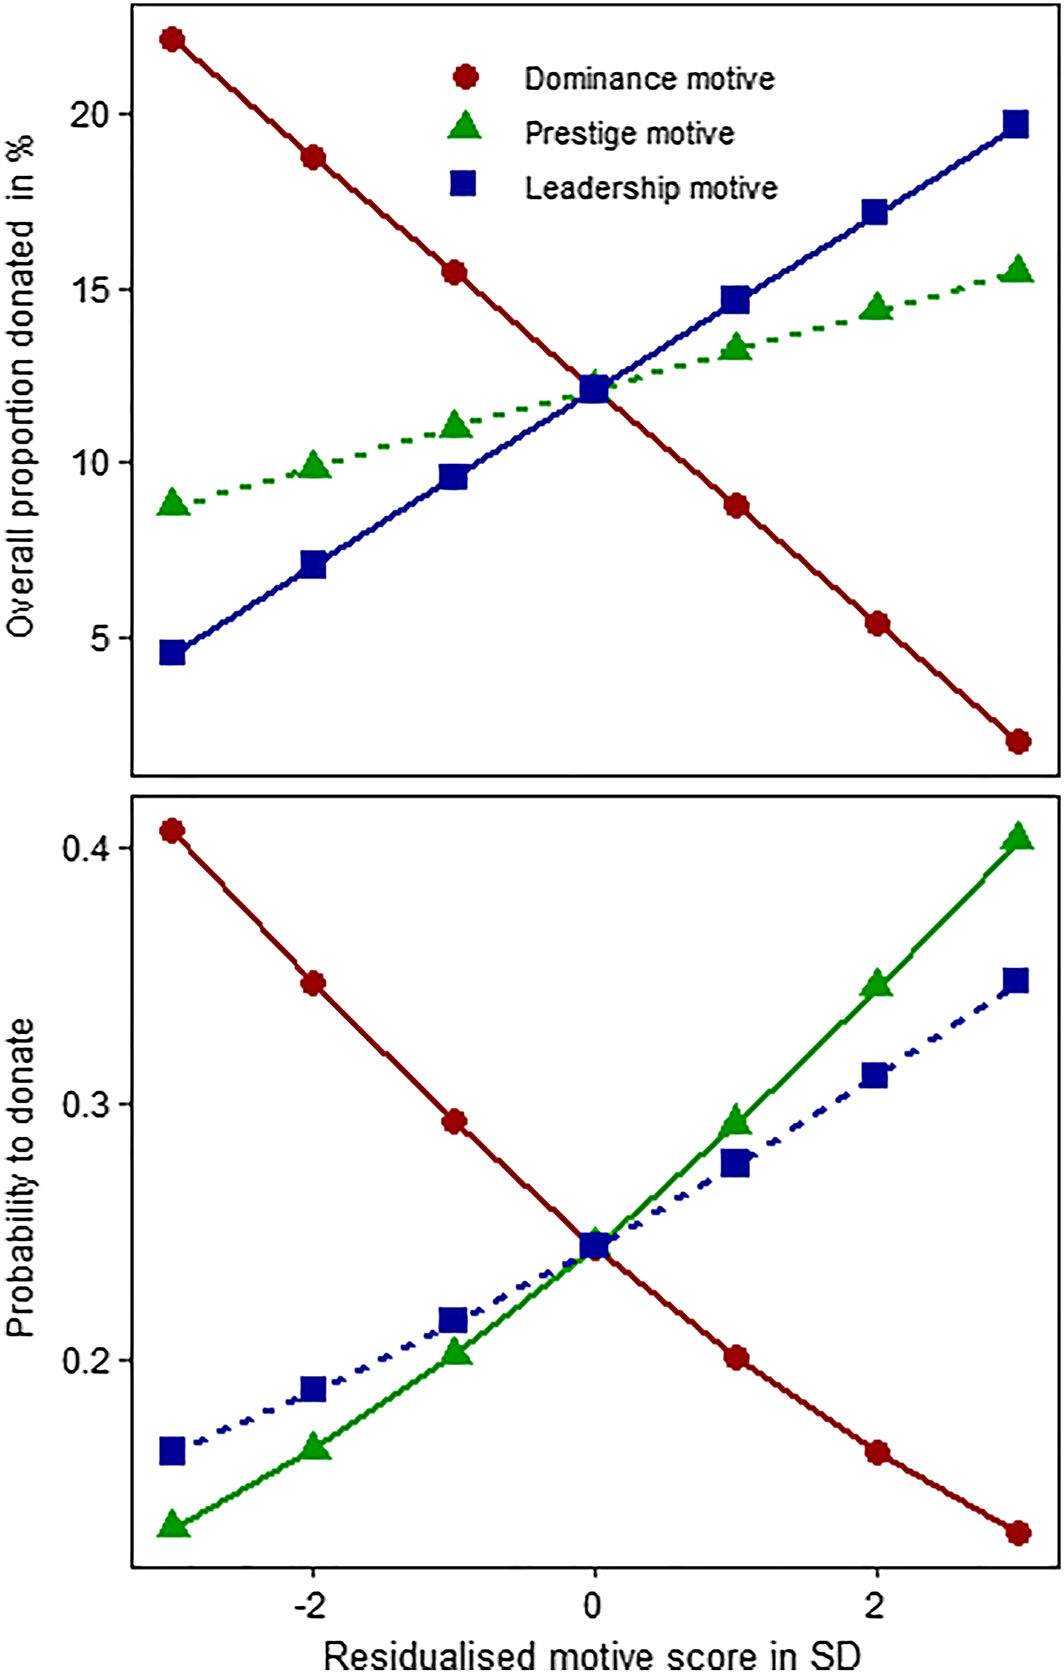
Residualised DoPL motives (i.e. free from shared DoPL influences) predicting overall proportion of money donated to charities (top) and probability to donate anything at all (bottom). Solid lines indicate significant effects. DoPL, dominance, prestige, and leadership. [Colour figure can be viewed at wileyonlinelibrary.com]
Exploratory analysis
For a more fine–grained exploratory analysis, we conducted further Bayesian hurdle models with donating decision (0 = nothing donated, 1 = something donated) and, in the subsample of donators, amount donated as DVs. Whereas both P, M = 0.21, 95% ETI [0.02, 0.41], and residualised P, M = 0.25, 95% ETI [0.02, 0.47], related positively to the probability of donating, residualised D, M = −0.25, 95% ETI [−0.47, −0.04], but not D as an individual predictor, M = −0.10, 95% ETI [−0.31, 0.09], related negatively to the probability of donating. Both L, M = 0.17, 95% ETI [−0.02, 0.38], and residualised L, M = 0.17, 95% ETI [−0.04, 0.37], were unrelated to the probability of donating (Figure 1 and Table S13). Moreover, neither residualised DoPL motives nor any DoPL motive as individual IV predicted the amount donated in the subsample of donators (Table S14).
Discussion
To further assess the DoPL scales’ predictive validity, we investigated their relationship with ostensibly overt charitable donating behaviour. Contrary to our prediction, higher prestige–motivated individuals did not donate more of their earnings for this study. However, although P did not predict the amount individuals donated, both P and residualised P related positively to donating something versus nothing. This pattern of prestige–motivated individuals showing only small degrees of prosocial behaviour appears across several studies (studies 3, 5, and 6) and seems at odds with claims of having higher moral values (study 4) and our thoughts that such behaviour is way to accrue prestige by signalling morality (e.g. Bai, 2017; Cheng & Tracy, 2014; see General Discussion section for a potential explanation of these findings). Whereas residualised D showed the predicted, self–serving (e.g. Cheng & Tracy, 2014; Henrich & Gil–White, 2001; see study 5), negative relationship with the donated proportion and the probability to donate at all, D as an individual predictor was unrelated to either DVs. Similar to the finding that only after controlling for P and L, D negatively predicted self–reported helping behaviour (see study 3), this might indicate that shared influences of P and L to some extent attenuate the kind of agonistic behaviour specific to D. Regarding L, only residualised L showed the predicted positive relationship with the amount donated, which we argued to represent a kind of responsibility taking for one's larger group: a leadership desire (cf. Van Vugt, 2006). Notably, residualised L did not predict the probability of donating; neither did L as an individual IV predict either of these DVs. This indicates that the prosocial effects of responsibility taking might be specific to leadership (i.e. not shared with D and P) but also somewhat weak, at least in this context. No effects showed when investigating the relationship between the DoPL motives and proportion given in the subsample of donors that might be explained by the generally small effects and the substantially reduced statistical power in this smaller subsample (550 vs. 138 participants). In summary, the DoPL scales showed some of the predicted relationships with charitable donating behaviour (i.e. P and L tending to be positively, D tending to be negatively related to donating); however, not all of our hypotheses could be confirmed. Moreover, given the exploratory nature of our analyses, this study only provides a preliminary validation and further research is needed to confirm these results.
Study 7: Dominance, Prestige, and Leadership Motives and Employment Ranks
To show the DoPL scales’ predictive validity specifically regarding L in this study, we investigated L's relationship with the amount of directive power and responsibilities in companies (i.e. employment ranks) taking into account gender and national differences (i.e. between the US and UK). As strong desires to obtain specific states predict their attainment (Sheldon & Schüler, 2011), and higher employment ranks should satisfy L's desire for directive power and taking responsibility for one's group (cf. Van Vugt, 2006), we hypothesised a strong relationship between L and employment ranks. Given gender discrimination in promotion (e.g. stricter performance standards for women, Lyness & Heilman, 2006; mismatching stereotypes of how women and how leaders ‘ought’ to be, Eagly & Karau, 2002; Heilman & Eagly, 2008), we hypothesised female leaders would need to compensate for this by being more motivated than male counterparts of equal rank; thus, we predicted a stronger relationship between employment ranks and L for women than men. Although L should be the strongest DoPL component, both D and P might also show somewhat weaker relationships with higher employment ranks as they provide a source of coercive power (i.e. a superior can to some degree force an employee to do a task) and admiration (e.g. Cheng et al., 2010).
Method
Participants
Participants were full–time employees of various professions (e.g. sales assistant, manager, lecturer, accountant, and soldier) from the US (sample #4, n = 278) and the UK (sample #5, n = 550; Table 1).
Material and procedure
Employment ranks corresponded to the number of affirmations of 11 yes–or–no questions regarding a person's influence in their company (e.g. ‘Do you have people reporting to you within the organisation?’ or ‘Do those that report to you have people working for them?’, Odey, 2016; Table S15). DoPL motives were measured by the 6–item DoPL scales (i.e. six items per DoPL motive). All scales were embedded in online surveys, and data were collected before any experimental manipulation occurred. Whereas sample #4 was collected to investigate the relationship between DoPL motives and moral disengagement (Odey, 2016), sample #5 was collected to investigate DoPL differences in predicting moral concerns (see study 4) and in charitable giving (see study 7). A full description of all measures and procedures used in both studies can be found here https://osf.io/uxtq2/. DoPL scores were standardised for analysis.
Results
Correlations between DoPL motives were small to moderate in both samples, .17 < rs < .33, ps < .015, with the exception of a zero–correlation between D and L in the US sample, r = .09, p = .131 (Table 14). D and P were small and positively related to employment ranks in the UK sample, .12 < rs < .17, ps < .005, but not in the US, rs = −.05, ps > .373. L was moderately positively related to employment ranks in both samples, rUS/UK = .28/.47, ps < .001 (Table 14). The only significant gender difference across DoPL scales’ correlations with employment ranks was a stronger correlation of L for women than men in the US rdiff = .45, p < .001 (Table S16). The only significant mean motive differences across genders were higher D scores for men in the UK, Mdiff = 1.26, t(526.61) = 2.74, p = .006, d = 0.23, and higher P scores for women in the US sample, Mdiff = 1.41, t(182.54) = 2.48, p = .014, d = 0.31. Notably, mean L scores did not differ across genders in either sample (ps > .119; Table S17).
Zero–order nonparametric Spearman correlations (because of employment rank as count data) of DoPL motives and employment ranks in US sample (subdiagonal) and UK sample (superdiagonal)
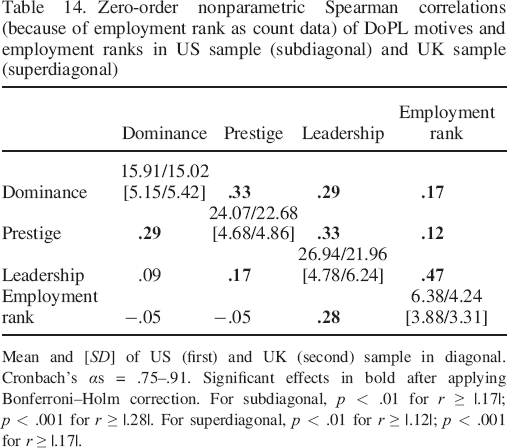
Mean and [SD] of US (first) and UK (second) sample in diagonal. Cronbach's αs = .75–.91. Significant effects in bold after applying Bonferroni–Holm correction. For subdiagonal, p < .01 for r ≥ |.17|; p < .001 for r ≥ |.28|. For superdiagonal, p < .01 for r ≥ |.12|; p < .001 for r ≥ |.17|.
To investigate residualised and gender effects, we conducted quasipoisson regression models (because of employment rank being count data) for each sample with DoPL motives, effect coded gender variables (men = −0.5; women = 0.5), and two–way interactions between each DoPL motive and gender as predictors (Table S18). Across both samples, residualised L showed the hypothesised positive and moderately sized relationship with employment ranks, bUS/UK = 0.30/0.39, ps = <.001, RΔ2 = .12/.19. 11 Moreover, significant small–sized residualised L*gender interactions, bUS/UK = 0.43/0.14, pUS/UK = <.001/.026 (one–tailed), RΔ2 = .05/.003, indicated that, as predicted, this relationship was stronger for women than for men (Figure 2). Note, whereas this interaction held for L as an individual predictor (i.e. not accounting for shared DoPL influences) in the US sample, b = 0.42, p < .001, it did not in the UK sample, b = 0.10, p = .146 (Table S19). In both samples, there were small to moderately sized gender differences in employment ranks with men having higher ranks than women, bUS/UK = −0.45/−0.16, pUS/UK = <.001/.017, RΔ2 = .07/.01. Moreover, opposed to our prediction, across both samples, neither residualised D nor residualised P predicted employment ranks, −0.08 < bs < 0.02, ps > .084 (Table S18).
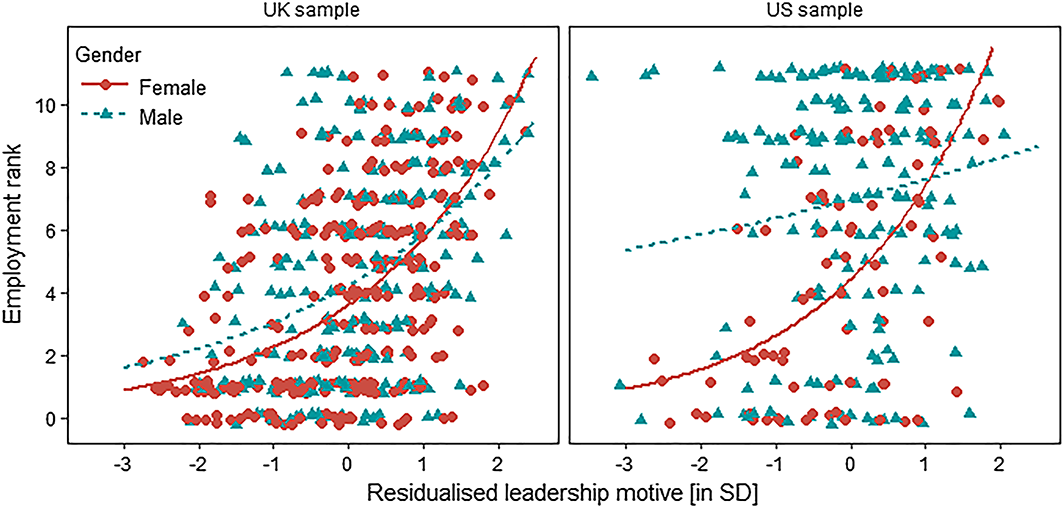
Best fitting lines for residualised leadership motive predicting employment rank in UK and US sample based on quasipoisson distribution. Main effects and interaction significant at p < .05 in both samples. Data jittered for better visualisation. [Colour figure can be viewed at wileyonlinelibrary.com]
Discussion
In two samples (US and UK), full–time employees with higher employment ranks had higher L and residualised L scores, which we proposed to be because of higher employment ranks offering leadership–specific rewards (e.g. Van Vugt, 2006). Moreover, we had predicted and found these relationships to be stronger for women than men, putatively because women had to work harder to overcome gender–specific difficulties as employees (e.g. Lyness & Heilman, 2006). Note though that this gender effect did not reach significance for L as an individual predictor in the UK sample and given bigger gender–specific effect sizes in the US further studies are needed to explore potential national idiosyncrasies. Although higher employment ranks arguably hold dominance and prestige incentives (e.g. Cheng et al., 2010), we only found the predicted small positive relationships between employment ranks and D and P in the UK but not the US sample. Moreover, in both samples, residualised D and residualised P did not predict employment ranks indicating that specific D or P desires are not beneficial to obtaining higher employment ranks. Across both samples, women had lower employment ranks than men, which mirrors contemporary surveys (e.g. World Economic Forum, 2016) and which has been attributed to women generally having lower power desires than men (e.g. Gino, Wilmuth, & Brooks, 2015; Schuh, Hernandez, Frieg, & Van Dick, 2014). Nonetheless, given the DoPL scales’ differentiated approach to analysing power desires, we show that women only deviated in the largely irrelevant D and P components but not L, rendering this explanation unlikely. More to the point, at least in the US sample, women had significantly higher leadership desires than men of equal rank, despite being under–represented at those ranks. In sum, L and residualised L positively related to directive power and responsibility in companies (i.e. employment rank). D and P showed no unique predictive value in this regard.
General Discussion
The power motive is an important determinant of power–relevant behaviour (e.g. Schmalt & Heckhausen, 2008; Schönbrodt & Gerstenberg, 2012; Winter, 1973). However, given its broad definition, different conceptualisations of the same motive have shown diverging associations (e.g. Engeser & Langens, 2010). To provide scholars with a unitary taxonomy of social power motives, we proposed and preliminarily validated an account of DoPL motives based on recent delineations of social hierarchies (e.g. Cheng & Tracy, 2014; Henrich & Gil–White, 2001; Magee & Galinsky, 2008; Van Vugt, 2006). Across multiple studies, we showed the DoPL motives could be measured both reliably and distinctively (study 1) but were also strongly related to a common desire for power (study 2). Assessing the DoPL scales’ nomological networks (studies 3 and 4) demonstrated that the dominance motive (D, i.e. the desire to coerce others into adhering to one's will) related most distinctively to SDO, anger, verbal aggression, antagonism, and porn consumption. The prestige motive (P, i.e. the desire to obtain admiration and respect) related most distinctively to the fear of losing reputation and claiming to have higher moral concerns. The leadership motive (L, i.e. the desire to take responsibility in and for one's group) related most distinctively to extraversion, emotional stability, helping behaviour, and the number of leadership positions held. Furthermore, while D uniquely predicted agonistic/retaliatory behaviour in DGs (study 5), L uniquely predicted the attainment of higher employment ranks in various professions (study 7). Finally, we found that, at least to some degree, P and L related positively, and D negatively to prosocial donating behaviour (study 6). In sum, across multiple studies using both correlational and mixed experimental designs, we found significant support for the DoPL account of social power motives.
One example illustrating the benefits of this differential DoPL motive account is its nuanced predictions and findings regarding prosocial behaviour. Although Bischof (2008) argued that behaving prosocially might be beneficial to increase one's dominance by means of binding another person to oneself, our research suggests that D, especially when freed from shared P and L influences, relates generally negatively to prosocial behaviour (i.e. self–reported helping behaviour, giving behaviour in DGs, and charitable donating; cf. Cheng et al., 2010). The relationship of prosocial behaviour with L might be strongly situationally dependent. Following our theory, situations that represented a responsibility taking for one's group fostered prosocial behaviour (i.e. self–reported helping behaviour and charitable donations); anonymous 1:1 situations did not (i.e. DG behaviour). Regarding P, scholars have argued that displaying higher morals aids gaining other people's admiration (e.g. Bai, 2017; Cheng & Tracy, 2014) and indeed we found P related positively to claiming to have stronger moral concerns across a range of domains. Somewhat contrarily though, prestige–motivated individuals only weakly demonstrated their morality via prosocial behaviour (e.g. P predicted the probability to donate but not the amount). Conscious or unconscious cost/benefit analyses might explain this discrepancy; although prosocial behaviour may yield more admiration (e.g. Hardy & Van Vugt, 2006), such reputational gains may not increase linearly with its costs (e.g. spending money or time). This resembles moral licensing, an effect where establishing moral credentials increases the likelihood of repeated moral transgressions (e.g. Merritt, Effron, & Monin, 2010; Miller & Effron, 2010). In other words, we propose that once prestige–motivated individuals felt they affirmed their own morality, they only very weakly followed through on it.
Differential predictions of prosocial behaviour are just one of the DoPL account's many merits. For example, long linked solely to aggression, researchers recently showed that testosterone predicted both aggressive as well as cooperative behaviour (Dreher et al., 2016; Eisenegger, Naef, Snozzi, Heinrichs, & Fehr, 2010) putatively because testosterone fuelled desires to attain higher ranks in social hierarchies (Eisenegger, Haushofer, & Fehr, 2011). The DoPL theory could provide useful predictions here: Experimentally increasing testosterone should yield behaviour in line with a person's most prominent DoPL desire. Moreover, the DoPL account could be used to extend the influential dominance versus prestige account of social hierarchies (e.g. Cheng & Tracy, 2014; Henrich & Gil–White, 2001). Whereas in this account, leadership is sometimes seen as equivalent to dominance or prestige ranks with leaders only wielding their specific dominance or prestige power (e.g. only punish or reward; Cheng, Tracy, Foulsham, Kingstone, & Henrich, 2013; Maner & Mead, 2010), other times leadership is differentiated from mere high ranks and leaders are proposed to have all kinds of power (e.g. Cheng et al., 2013; Henrich, Chudek, & Boyd, 2015). The DoPL theory could provide clarity here by distinguishing leadership from mere high rankings and offering that leaders hold an additional kind of power (legitimised by the need to attain a common goal) that conceivably allows both punishment and reward of followers.
Limitations
It is important to note that this work only represents a first validation of the newly developed DoPL account. Although we confirmed many of the DoPL motives’ predicted relationships with external variables, not all relationships followed our hypotheses. For example, all DoPL motives showed somewhat stronger–than–expected relationships with narcissism; D and residualised D only related negatively to giving behaviour in a DG after being aroused; P and residualised P related generally more weakly to prosocial behaviour than predicted. Moreover, in studies 5 to 7 (determining the DoPL scales’ predictive validity), we hypothesised one particular DoPL aspect would have the strongest relationship and hypothesised weaker relationships for the other two. Whereas in studies 5 and 7, the focal DoPL motives largely followed our predictions, the respective other two motives only showed descriptive tendencies in the hypothesised directions; indicating small effects that might be covered up by insufficient sample sizes. Moreover, study 6's results can only be regarded as exploratory as we could not completely follow our preregistered study plan and statistical evidence of effects was inconsistent, depending on which proxy of donating behaviour was used (e.g. total amount donated vs. probability to donate) and whether shared DoPL influences were controlled for or not. Finally, although the DoPL scales represent distinct components of the power motive, they all share a common core and thus, in some cases, related to external variables very similarly (vector correlations of all correlations regarding the DoPL scales reported in studies 3 to 7 were moderate to strong: rDP = .47; rDL = .43; rPL = .66; Rauthmann, Horstmann, & Sherman, 2018). Therefore, future studies are needed to further delineate more precise differences in the DoPL scales’ nomological networks and outcomes and determine the moderators and processes underlying these differences.
Additionally, we want to stress that the DoPL account neither provides the only possible taxonomy of power desires nor their highest possible level of differentiation. For example, D combines aspects of autonomy desires (e.g. not wanting to be dominated; cf. Lammers, Stoker, Rink, & Galinsky, 2016) with desires for agonistic influence (e.g. wanting to dominate others). P contains both desires for admiration and respect. Recently, Bai (2017) has argued that although both admiration and respect yield voluntary deference, the former might be obtained by displaying one's morality and the latter by displaying one's valuable skills and knowledge. Whereas in this research, we conceptualised L as a desire to actively claim a leadership position, Chan and Drasgow (2001) showed that in some cases, leadership desires can be more passive (e.g. wanting to lead when being asked) or based on cost/benefit analyses (e.g. only wanting to lead if there are no repercussions). Moreover, exploratory analyses of a much wider range of power–relevant questionnaire items might reveal as yet unknown subcomponents (e.g. Dhami, Hertwig, & Hoffrage, 2004). Ultimately, any taxonomy of power desires represents a trade–off between covering a wide range of such desires and being able to make precise/nuanced and meaningfully different predictions regarding each of them. We believe the DoPL account provides a good balance. More precisely, as the DoPL account explains more than 80% of variance in established power motive scales, it provides sufficient coverage of power desires by still being embedded in a well–founded theoretical framework (cf. Cheng & Tracy, 2014; Henrich & Gil–White, 2001; Magee & Galinsky, 2008; Van Vugt, 2006). Ever more fine–grained differentiations likely yield increasingly similar results; thus, to determine unique differences would require increasingly bigger sample sizes. Moreover, further research would have to show that these differences provide practical value (e.g. does behaviour meaningfully change whether one desires to be admired as opposed to be respected?). Components of the DoPL account predict power–relevant variables in a meaningfully different manner and at the same time only requiring reasonable sample sizes. In sum, although further differentiations of power desires are undoubtedly possible, we believe the DoPL account currently provides the best combination of range of power desires measured and precision of meaningful predictions.
Recommendations for other researchers
As we provide several scales for several motives, scholars might be unsure which one to use in which scenario. All 10–item, 6–item, and 4–item DoPL scales show respectable model fits and high internal consistencies, thus all could be used. Nonetheless, as the 6–item scales (i.e. six items per DoPL motive) show the best model fit, we generally recommend using these. Although all DoPL scales share a common desire for power, we do not recommend computing a single power motive sum score as this might cover up important differences between these motives (cf. Murray et al., 2015). Rather, we recommend to always assess all DoPL motives and report zero–order correlations with the desired DVs as well as regression coefficients controlling for shared DoPL influences (e.g. Vize et al., 2018).
Conclusion
Throughout human history, influential people such as political leaders, scientists, teachers, and managers have impacted our lives. Whereas sometimes this influence has arguably been self–serving or socially regressive, other times it has been prosocial and responsible. In order to predict socially regressive agents’ behaviour as well as promote responsible leadership, it is important to understand the motives underlying such behaviour. The DoPL account of social power motives provides a potent framework towards this goal, and we hope it inspires further investigations in this important field of research.
Supporting info item
Supporting info item, per2184-sup-0001-Suessenbach_et_al_2018_SOM_REVISION_Final - The Dominance, Prestige, and Leadership Account of Social Power Motives
Supporting info item, per2184-sup-0001-Suessenbach_et_al_2018_SOM_REVISION_Final for The Dominance, Prestige, and Leadership Account of Social Power Motives by Suessenbach Felix, Loughnan Steve, Schönbrodt Felix D., Moore Adam B. and Back Mitja in European Journal of Personality
Data S1. Supporting information
Supporting info item
Supporting info item, per2184-sup-0002-Open_Practices_Disclosure_Form - The Dominance, Prestige, and Leadership Account of Social Power Motives
Supporting info item, per2184-sup-0002-Open_Practices_Disclosure_Form for The Dominance, Prestige, and Leadership Account of Social Power Motives by Suessenbach Felix, Loughnan Steve, Schönbrodt Felix D., Moore Adam B. and Back Mitja in European Journal of Personality
Footnotes
Notes
References
Supplementary Material
Please find the following supplemental material available below.
For Open Access articles published under a Creative Commons License, all supplemental material carries the same license as the article it is associated with.
For non-Open Access articles published, all supplemental material carries a non-exclusive license, and permission requests for re-use of supplemental material or any part of supplemental material shall be sent directly to the copyright owner as specified in the copyright notice associated with the article.