
Abstract
Past research using the Electronically Activated Recorder (EAR), an observational ambulatory assessment method for the real–world measurement of daily behaviour, has identified several behavioural manifestations of the Big Five domains in a small college sample (N = 96). With the use of a larger and more diverse sample of pooled data from N = 462 participants from a total of four community samples who wore the EAR from 2 to 6 days, the primary purpose of the present study was to obtain more precise and generalizable effect estimates of the Big Five–behaviour relationships and to re–examine the degree to which these relationships are gender specific. In an extension of the original article, the secondary purpose of the present study was to examine if the Big Five–behaviour relationships differed across two facets of each Big Five domain. Overall, while several of the behavioural manifestations of the Big Five were generally consistent with the trait definitions (replicating some findings from the original article), we found little evidence of gender differences (not replicating a basic finding from the original article). Unique to the present study, the Big Five–behaviour relationships were not always comparable across the two facets of each Big Five domain. © 2020 European Association of Personality Psychology
Keywords
Research in personality psychology has made great strides in understanding the complexity of human nature and the relationships between personality and behaviour. For instance, over the last 50 years, the field has established strong and reproducible relationships between personality and longevity, life satisfaction, job performance, and relationship satisfaction, among others (Ozer & Benet–Martinez, 2006; Soto, 2019). Despite these advancements, the field as a whole has a history of relying extensively on self–report measures of personality (Baumeister, Vohs, & Funder, 2007; Furr & Funder, 2007). The typical personality psychology study is done online, where participants, mostly college students or Mechanical Turk users, report on various aspects of their Big Five personality traits as well as self–perceptions of their behaviour. This approach maximizes efficiency (facilitating adequate sample sizes while protecting scientific resources) but, at the same time, can limit the validity of findings owing to potential measurement artefacts (e.g. memory and recall effects, demand characteristics and socially desirable responding, and shared method variance between predictor and outcome) and non–representativity of the assessment context (Paulhus & Vazire, 2007).
Ecological sampling methods, including classical experience sampling and more recent attempts to sample behaviour directly and objectively in daily life, have created opportunities to complement survey–based personality research with research that studies personality more directly ‘in its natural habitat’ (Mehl & Wrzus, in press), thus providing another important source of information about individuals’ personality. For instance, researchers have used experience sampling to aid in an idiographic approach to studying personality. Here, participants report their perceptions of their own behaviours or personality states throughout the day. Researchers then use these assessments to establish distributions of accumulated behavioural or personality states (Conner, Tennen, Fleeson & Barrett, 2009; Fleeson & Gallagher, 2009).
Building off this and other uses of experience sampling methods, the purpose of the current project is to use a passive ecological sampling method, the Electronically Activated Recorder (EAR; Mehl, Pennebaker, Crow, Dabbs, & Price, 2001; Mehl, 2017), for a large–scale analysis of how the Big Five personality domains are manifested in individuals’ directly observed daily social behaviours, interactions, and language use. Specifically, the project seeks to replicate and extend an initial investigation into this topic by Mehl, Gosling, and Pennebaker (2006).
Studying personality in everyday contexts
Research exploring individuals’ behavioural manifestations serves as a notable exception to the field's reliance on self–report measures of behaviour (Carney, Jost, Gosling, & Potter, 2008; Gosling, Ko, Mannarelli, & Morris, 2002). This line of research has found reliable manifestations of personality in both one's physical environment (e.g. bedroom and workplace; Carney et al., 2008; Gosling et al., 2002), and virtual environment (e.g. Facebook, Twitter, and personal websites; Correa, Hinsley, & de Zuniga, 2010; Gosling, Augustine, Vazire, Holtzman, & Gaddis, 2011; Scott, 2014; Tskhay & Rule, 2014; Vazire & Gosling, 2004).
Recently, research using smart phone–based mobile sensing methodology has extended the assessment of personality and behaviour in everyday contexts by making use of the digitalization of behaviour in both physical and virtual environments (Beierle et al., 2018; Harari, Gosling, Wang, & Campbell, 2015; Miller, 2012; Stachl et al., 2017). This method captures a wide range of behaviours measured throughout one's day, effectively increasing the ecological validity of behavioural assessment. The work has yielded consistent relationships between personality and various smartphone behaviours including app use (Chittaranjan, Blom, & Gatica–Perez, 2013), activity level measured via the smart phone's accelerometer (Harari et al., 2017), and SMS text and call frequency (Montag et al., 2014).
Language use has been another particularly important domain or studying how personality is expressed in virtual environments (Ahmad & Siddique, 2017; Farnadi, Zoghbi, Moens, & De Cock, 2013; Golbeck, Robles, Edmondson, & Turner, 2011; Qiu, Lin, Ramsay, & Yang, 2012; Schwartz et al., 2013). For instance, one study collected the tweets from individuals over a 1–month period and had naïve coders rate them for each of the Big Five personality traits. Researchers in this study extracted linguistic features of participants’ tweets via the Linguistic Inquiry and Word Count (LIWC) programme. Use of words longer that six letters was related to extraversion, use of first–person singular pronouns was related to neuroticism, and use of work–related words was related to conscientiousness (Qiu et al., 2012). This study illuminates the ability to extract meaningful linguistic cues to aid in these judgements.
This body of research has enabled the field to make major advancements in our understanding of the link between personality and observed/objective daily behaviour. However our digital footprints (i.e. our smartphone–mediated, wearable device–mediated, and online social media–mediated interactions) still only capture one, although arguably increasingly important, slice of what we do on a daily basis. In line with Brunswik's call for employing representative designs in psychology, that is, study designs where contexts are considered a random factor and sampled representatively from underlying ecologies, it is important to study how personality manifests in daily behaviour by using ecological methods that can achieve such representative sampling of situations from individuals’ naturally occurring daily lives (Brunswik, 1944, 1955; Mehl & Wrzus, in press). For instance, the domain of in–person, human–to–human interaction, arguably a key domain for psychology and a key domain for personality expression, is still largely ‘left out’ (for a notable exception, see Harari et al., 2019). Indeed, ‘we are incapable of giving a complete popular description of personality without indicating the manner in which the personality in question stimulates or influences other human beings and the manner in which the behavior of other human beings produces adjustments or responses in the personality in question’ (Allport & Allport, 1921, p. 7).
Naturalistic observation of personality in everyday life
While the field of personality psychology has made great strides in identifying important manifestations of personality both online and offline and via behavioural observation and mobile sensing, these investigations are typically limited to one context and thus do not comprehensively capture a representative sample of situations (Brunswik, 1944, 1955). Personality is inherently summative and, by definition, applies to individuals across contexts. In fact, one conclusion drawn from the person–situation debate is decidedly that personality is expected to robustly predict behaviour over time and across contexts (rather than at one time and in one context; Epstein, 1979, 1980). The assessment of daily behaviour via ecological sampling methods that can assess daily life contexts directly, representatively, and observationally effectively complements and extends this research in important ways.
The EAR (Mehl, Pennebaker, Crow, Dabbs, & Price, 2001; Mehl, 2017) is an observational ecological sampling method for the passive (i.e. non–reactive) measurement of participants’ daily social behaviour. It is a wearable audio recorder that intermittently (i.e. a few times per hour) records brief snippets of ambient sounds (e.g. 30 seconds). Participants attach the device to their belt or purse and then go about their day as the EAR samples their moment–to–moment (acoustic) behaviours, concealing exactly when it is on (i.e. recording) or off. The recorded audio segments are then coded for a range of psychologically relevant behaviours, and captured utterances by the participants are transcribed and text–analytically converted into information about participants’ language use in their daily conversations. This method has been successfully used to study a wide range of research questions with a wide range of populations of varying ages and backgrounds, demonstrating that participants, overall, show a high acceptance of the method and adherence to the monitoring protocol (Manson & Robbins, 2017; Mehl, 2017; Mehl & Holleran, 2007).
Research using the EAR has identified several ways in which specific social and language behaviours are related to important aspects of a person's life, including well–being (Mehl, Vazire, Holleran, & Clark, 2010; Milek et al., 2018; Sun, Harris, & Vazire, 2019; Sun, Schwartz, Son, Kern, & Vazire, 2020) 1 and depression (Baddeley, Pennebaker, & Beevers, 2013; Mehl, 2006), life history strategy (Manson, 2017, 2018), personality dysfunction and disorder (Calabrese, 2017; Holtzman, Vazire, & Mehl, 2010; Minor, Davis, Marggraf, Luther, & Robbins, 2018), and coping and adjustment after stressful life events (Alisic, Krishna, Robbins, & Mehl, 2016; Robbins, Mehl, Smith, & Weihs, 2013; Slatcher & Robles, 2012).
See Weidman et al. (2019) for an interesting exception.
Only one study so far, however, has used the EAR to study links between observed daily behaviour and language use and personality as measured by the Big Five (Mehl, Gosling, & Pennebaker, 2006). In this pioneering study, 96 participants first completed a series of personality measures and then wore the EAR for two consecutive days. Participants’ recorded daily life was behaviourally coded for aspects of their daily behaviour, interactions, moods, and locations, and transcribed and text analysed for their daily language use. A number of relationships emerged between the EAR–derived variables (e.g. dyadic conversations, laughing, swear words, and pronoun use) and the Big Five personality domains. For example, the use of swear words was negatively related to agreeableness, and a higher prevalence of conversations in class was related to conscientiousness. Moreover, instances of being alone were negatively related to extraversion, and self–talk and arguing were negatively related to emotional stability. Interesting gender differences were also observed; however, owing to the small sample size, these results should be interpreted with caution.
In its focus on objectively observed daily behaviour, this study contributed in important ways to furthering the scientific understanding of personality, but it was limited in three important ways. First, with 96 participants, the sample size, although large for labour–intensive naturalistic observation research, was modest at best and by current standards too small to yield precise estimates of effects that can be expected to replicate (Fraley & Vazire, 2014; Schönbrodt & Perugini, 2013). A sample that is considerably larger would be needed to provide sufficient statistical power to not only detect small–sized to medium–sized effects of simple behaviour–personality links but also to be able to test the impact that gender has in moderating zero–order trait–behaviour associations. While Mehl et al. (2006) did observe gender differences, the small sample size limits interpretation of these differences. A similar study investigating the relationship between personality and word use in recounting participants’ life narrative observed similar patterns across genders (Fast & Funder, 2008). Where gender differences did occur (i.e. use of negative emotion words, use of articles), it replicated gender differences found in Mehl et al. (2006). Yet another study that analysed language use in 75 000 volunteers’ Facebook messages, comments, and status updates found significant gender differences in the frequency of word usage (Schwartz et al., 2013). These few studies suggest that gender differences in social behaviour and language may be common, but they also underscore the need for more data across a larger set of contexts to more conclusively establish which gender differences are reliable.
Second, because the sample consisted only of college students, the generalizability of the results to other samples is unclear. Population–based differences in daily behaviour and language use could produce differences in the expression of personality. For example, the tendency for conscientiousness to be negatively related to time at work may be reflective of the fact that when college students are spending time at work, they are not spending time studying, and it is time studying, not working at a job, that is indicative of productivity in college student samples. This example illuminates the limiting contextual value of studying college students. Moreover, both personality and language use change over the lifespan (Donnellan, Conger, & Burzette, 2007; Kern, Eichstaedt, Schwartz, Dziurzynski, et al., 2014). It is reasonable to expect, therefore, that the way personality is related to the words people tend to use can also be different in different social groups.
Finally, Mehl et al. (2006) did not examine associations at the facet level. Personality facets capture specific aspects of personality traits, which can provide a more nuanced understanding of the trait, and add psychometric value to personality measurement (Goldberg, 1999). Assessing behaviour–personality links on the facet level would therefore enable us to capture a more fine–grained understanding of how personality is related to social behaviour and speech. For instance, Mehl et al. (2006) found that laughing is unrelated to extraversion. However, this non–relationship may be explained by opposing directionality of relationships within the facet structure of extraversion. For instance, those high in the activity facet of extraversion may be more likely to laugh, while those high in the assertiveness facet of extraversion may be less likely to laugh. Relating laughing to personality on the facet level, therefore, enables us to uncover a relationship that would not be discoverable on the broad trait level.
Current project
The current project is an exploratory, multi–sample study that aimed at stimulating future research on personality and daily behaviour through obtaining state–of–the art, that is maximally precise and generalizable, effect estimates for the relationships between the Big Five personality traits and EAR–derived daily behaviours and language use. Our research seeks to extend the findings obtained by Mehl et al. (2006) by relating directly observed behaviour and personality on the facet level and by utilizing datasets from a diverse set of individuals. Given the large number of daily behaviours and language use variables involved in the current study, we refrained from making strong predictions about how specific variables would relate to the Big Five personality domains; our starting point for interpreting the effects will be the findings obtained in Mehl et al. (2006). We did not deem these original findings robust enough, though (given the limited sample size), to warrant pre–registration here.
Taken together, the current research intends to explore the relationship between everyday speech and personality. Specifically, we have three primary research questions:
How do the Big Five relate to EAR–derived behaviours and language variables? Are there gender differences in a large and diverse sample? Do these relationships vary between facets?
Method
The Institutional Review Board at the University of Arizona declared this study exempt from human subjects review (Protocol Number: 1803376749; Protocol Title: Sounds of Social Life EAR Repository). This study was declared exempt because all analyses were performed on archival, de–identified data.
Samples and procedures
This study included pooled data from N = 462 participants from four diverse community samples (59.3% female, age range 24–94 years, 29.8% non–white or multi–ethnic) who completed a validated measure of the Big Five personality traits (see Measures) and wore the EAR (Mehl, 2017) for up to 2–6 days. The EAR is a digital audio recorder that unobtrusively samples daily behaviour by intermittently recording snippets of ambient sounds while participants go about their daily lives. The EAR in the four samples consisted of a mobile device (either the Apple iPod touch or the HP iPAQ) loaded with an EAR app (either the iEAR app or Windows Mobile software). Participants were financially compensated for their participation except those in Sample 4. Below is a brief description of the participants and EAR procedures used in each of the four samples, with references to publications with more detailed information when necessary (also see Table 1, which summarizes important information about the four samples).
Sample Characteristics
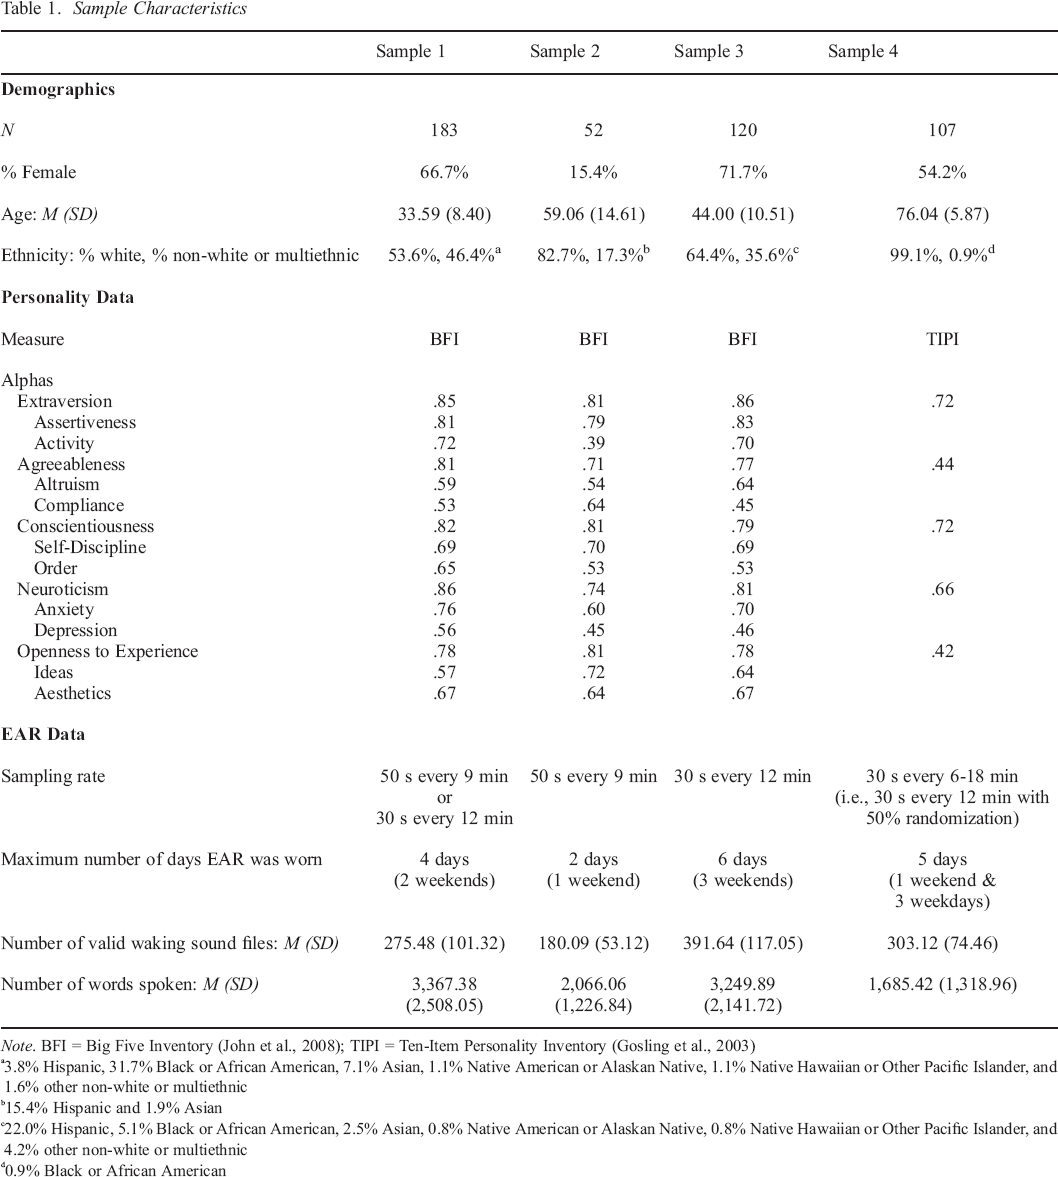
Note. BFI = Big Five Inventory (John et al., 2008); TIPI = Ten–Item Personality Inventory (Gosling et al., 2003)
3.8% Hispanic, 31.7% Black or African American, 7.1% Asian, 1.1% Native American or Alaskan Native, 1.1% Native Hawaiian or Other Pacific Islander, and 1.6% other non–white or multiethnic
15.4% Hispanic and 1.9% Asian
22.0% Hispanic, 5.1% Black or African American, 2.5% Asian, 0.8% Native American or Alaskan Native, 0.8% Native Hawaiian or Other Pacific Islander, and 4.2% other non–white or multiethnic
0.9% Black or African American
Sample 1
As part of a larger study, data from N = 183 adults (66.7% female, Mage = 33.59) from Atlanta, GA, who participated in a randomized controlled trial of a meditation intervention run by the Emory University Center for Health and Well–being were used in the current study. Participants completed a measure of the Big Five personality traits before and after the 8–week meditation intervention 2 and wore the EAR for up to four non–consecutive days (two weekends, separated by the 8–week intervention) with a recording rate of either 50 seconds every 9 minutes or 30 seconds every 12 minutes. For more details on this sample, see Kaplan et al. (2018).
For participants who had Big Five personality data from both measurement occasions (i.e. 82% of participants), we averaged their Big Five personality domain and facet scores. Of the remaining participants who had Big Five personality data from only one measurement occasion, 16.9% had data from the first measurement occasion only and 1.1% had data from the second measurement occasion only. Including Big Five personality data from both measurement occasions if participants had it was consistent with our EAR data inclusion criteria, which was to include EAR data from multiple measurement occasions if participants had it (i.e. participants in Samples 1 and 3).
Sample 2
As part of a larger study about coping with a life–threatening illness, breast cancer patients being treated at the University of Arizona's Cancer Center in Tucson, AZ, and their cohabitating romantic partners completed a measure of the Big Five personality traits and wore the EAR for up to two consecutive days (both weekend days) with a recording rate of 50 seconds every 9 minutes. Owing to the non–independence of the couple data (female patients with mostly male partners), and our need to increase the overall sample size of men for the gender analyses, data from the N = 52 partners (15.4% female, Mage = 59.06) were used in the current study. For more details on this sample, see Robbins, López, Weihs, and Mehl (2014) and Robbins, Karan, López, and Weihs (2018).
Sample 3
As part of a larger study about coping with divorce, data from N = 120 adults (77.7% female, Mage = 44.00) from Tucson, AZ, who recently separated from their marital partners were used in the current study. Participants completed a measure of the Big Five personality traits at the beginning of the longitudinal study and wore the EAR for up to six non–consecutive days (i.e. three weekends, each separated by 2 months) with a recording rate of 30 seconds every 12 minutes. For more details on this sample, see Hasselmo et al. (2018), Bourassa, Tackman, Mehl, and Sbarra (2019), and O'Hara, Grinberg, Tackman, Mehl, and Sbarra (2020).
Sample 4
As part of a larger study about healthy cognitive aging, data from N = 107 older adults (54.2% female, Mage = 76.04) from Tucson, AZ, were used in the current study. Participants completed a measure of the Big Five personality traits and wore the EAR for up to five consecutive days (i.e. three weekdays and two weekend days) with a recording rate of 30 seconds on average every 12 min, with each recording occurring randomly between 6 and 18 minutes after the previous one. For more details on this sample, see Polsinelli (2017) and Moseley (2018).
Measures
Big Five personality domains
The Big Five Inventory (BFI–44; John, Naumann, & Soto, 2008) was administered in Samples 1 to 3, and the Ten–Item Personality Inventory (TIPI; Gosling, Rentfrow, & Swann, 2003) was administered in Sample 4. For both measures, participants rated how well each item described themselves in general on a scale from disagree strongly to agree strongly. Internal consistencies for the BFI scales were good: across the three samples that used the BFI, alphas ranged from .81 to .86 for the eight–item Extraversion scale, .71 to .81 for the nine–item Agreeableness scale, .79 to .82 for the nine–item Conscientiousness scale, .74 to .86 for the eight–item Neuroticism scale, and .78 to .81 for ten–item Openness to Experience scale (see Table 1 for alphas separately for Samples 1 to 3). As expected (and as acknowledged and discussed by the original authors), internal consistencies for the two–item TIPI scales were lower than those for the traditional full–length BFI scales but still demonstrated acceptable internal consistency for all scales: α = .72 for Extraversion, .44 for Agreeableness, .72 for Conscientiousness, .66 for Neuroticism, and .42 for Openness to Experience.
Big Five personality facets
For participants from Samples 1 to 3 who completed the BFI, we scored ten more specific traits, two per Big Five domain (Soto & John, 2009): For Extraversion, Assertiveness (five items: ‘Has an assertive personality’, ‘Is talkative’, etc.) and Activity (two items: ‘Is full of energy’ and ‘Generates a lot of enthusiasm’); for Agreeableness, Altruism (four items: ‘Is helpful and unselfish with others’, ‘Is considerate and kind to almost everyone’, etc.) and Compliance (three items: ‘Has a forgiving nature (r)’, ‘Starts quarrels with others (r)’, etc.); for Conscientiousness, Self–Discipline (five items: ‘Perseveres until the task is finished’, ‘Is a reliable worker’, etc.) and Order (two items: ‘Tends to be disorganized (r)’, ‘Can be somewhat careless’, etc.); for Neuroticism, Anxiety (four items: ‘Worries a lot’, ‘Is relaxed, handles stress well (r)’, etc.) and Depression (two items: ‘Is depressed, blue’ and ‘Can be moody’); and for Openness to Experience, Ideas (five items: ‘Is curious about many different things’, ‘Is ingenious, a deep thinker’, etc.) and Aesthetics (three items: ‘Values artistic, aesthetic experiences’, ‘Is sophisticated in art, music, and literature’, etc.). The ten facet scales for the BFI demonstrate good psychometric properties and correspond well with lower–level traits identified in other hierarchical Big Five questionnaires (Soto & John, 2009). Other personality scales include more underlying facets, but the ten examined here represent all of the trait facets that have been derived and validated from the personality instrument we used in these studies.
Internal consistencies for the facet scales were acceptable: Across the three samples for which the ten facets were scored, alphas ranged from .79 to .83 for the five–item Assertiveness scale, .39 to .72 for the two–item Activity scale, .54 to .64 for the four–item Altruism scale, .45 to .64 for the three–item Compliance scale, .69 to .70 for the five–item Self–Discipline scale, .53 to .65 for the two–item Order scale, .60 to .76 for the four–item Anxiety scale, .45 to .56 for the two–item Depression scale, .57 to .72 for the five–item Ideas scale, and .64 to .67 for the three–item Aesthetics scale.
Behaviourally coded variables
For each day that the participants wore the EAR, they wore it from the time they woke up in the morning until they went to bed at night, unaware of when exactly the device was recording. With 30– or 50–second recordings every 9 or 12 minutes, the EAR captured between 5% and 10% of participants’ waking hours per day. In addition to the varying sampling rate, because the number of days that the participants wore the EAR varied across the four samples (Table 1), the overall mean number of valid recordings (i.e. recordings where the participant was awake and wearing the EAR) was different for the four samples, ranging from approximately 180 to 392 valid sound recordings (Table 1).
Two research assistants in Samples 1–3 and one research assistant in Sample 4 (from a large group of trained research assistants) independently coded each recording for the presence of a variety of behaviours related to the participant's daily (i) interactions (e.g. participant is alone, with others, engaged in small talk, and expressing gratitude), (ii) activities (e.g. participant is on the computer, doing housework, and eating/drinking), (iii) affect expressions and other expressions that signal internal states (e.g. participant is laughing, crying, sighing, and yawning), and (iv) locations (e.g. participant is in a home, in transit, and outdoors). If a behaviour was coded in at least two of the four samples, it was analysed in the current study, resulting in 44 behaviourally coded variables (for definitions and inter–coder reliabilities of all variables, see Tables S1 and S2).
The EAR was perceived as minimally obtrusive to most of the participants and those around them, and compliance rates were generally high (Manson & Robbins, 2017; Mehl & Holleran, 2007). Established privacy protection and data confidentiality guidelines were followed in all samples (Mehl, 2017; Robbins, 2017). Specifically, participants were given the opportunity at the completion of the EAR monitoring period to review all their recordings and delete any that they preferred to remain private.
Text–analytically derived variables
In addition to the behavioural codings, all EAR recordings in which the participant spoke were transcribed verbatim by one research assistant and cleaned by a second research assistant. The entirety of the cleaned transcripts was saved as text documents and then submitted to the LIWC (LIWC2015; Pennebaker, Boyd, Jordan, & Blackburn, 2015), an extensively validated text analysis programme that operates by comparing all words of a given text with an internal dictionary composed of almost 6400 words and word stems. The words in the LIWC2015 default dictionary, which was used in the current study, are arranged into approximately 90 word categories: 21 grammatical (e.g. pronouns, conjunctions, verbs, and interrogatives), 40 psychological (e.g. affect, cognition, social processes, and drives/needs), six personal concern (e.g. work, leisure, and money), six informal (e.g. swear words, nonfluencies, and fillers), 12 punctuation, four summary, and three general descriptor word categories. In addition to the total word count, we analysed all of the above word categories except those that are specific to written language (i.e. the 12 punctuation word categories and one of the general descriptor word categories, words per sentence), resulting in 74 text–analytically derived variables. Note that LIWC has undergone continued development since it was used in the original 2006 publication reporting correlations of the EAR with behaviour, meaning that not all categories are identical when comparing these results.
Combining data and analysis plan
The overall dataset and analysis scripts (which can be used to reproduce all descriptive and inferential statistics reported in this paper) are posted on the Open Science Framework at https://osf.io/w3nt4/. The data were analysed at the level of the participant (rather than at the level of the sample). We computed Spearman correlations on the unstandardized data 3 for all three research questions. Because the BFI (used in Samples 1 to 3) and the TIPI (used in Sample 4) had response scales with different numbers of scale points (i.e. 1 to 5 for the BFI and 1 to 7 for the TIPI), the personality variables were rescaled with a linear transformation to per cent of maximum possible (POMP) scores, giving them a theoretical range of 0 to 100 (P. Cohen, Cohen, Aiken, & West, 1999). Except for LIWC word count, which represents the total number of words spoken, all remaining variables are on a scale from 0% to 100%. 4
Analysing the unstandardized data, as opposed to the within–sample standardized data, preserves differences between samples that may be due to underlying differences in demographic characteristics. For example, the average age across the samples varied widely due to the goals of the specific study (e.g. Sample 4 was collected to study aging populations, so the average age was 76). Personality is known to change across the lifespan (e.g. Klimstra, Bleidorn, Asendorpf, Van Aken, & Denissen, 2013; Robins, Fraley, Roberts, & Trzesniewski, 2001). Standardizing a variable within samples would effectively eliminate theoretically meaningful differences; a score of 4 out of 5 on extraversion might be translated to Z = 0.5 in a younger sample, but Z = 1.5 in an older sample. Within–sample standardization alters the values being analysed so that correlations become specific to that sample; the overall association therefore represents a weighted average of the sample correlations. However, we want to understand the association between extraversion and other variables in general across a broader population of individuals. Analysing the unstandardized data allows us to find relationships that generalize across many contexts.
More specifically, the behaviourally coded variables reflect the percentage of valid waking EAR recordings in which a category applied (e.g. On average, 57.06% of the time the EAR was worn was spent alone). The only exception is for the five conversation type categories, which reflect the percentage of time spent talking that was small talk, substantive talk, practical talk, personal/emotional disclosure, or gossip (e.g. on average, 16.23% of the amount of time spent talking was small talk). The text–analytically derived variables reflect the percentage of total words spoken in which a category applied (e.g. on average, 20.53% of all words spoken were pronouns). The only exception is for word count, which reflects the total number of words spoken (i.e. on average, the total number of words spoken was approximately 2800).
Following recommendations to decrease the reliance on null–hypothesis significance testing for binary decision making (Cumming, 2014), we report two statistics for each analysis: a standardized effect size (r) and a 95% confidence interval (CI) of r. We used Rand Wilcox's WRS package in R to calculate confidence intervals using bootstrapping. To examine if the behavioural manifestations of the Big Five personality traits differed statistically by gender (RQ2), we used Wilcox's function for calculating bootstrap CIs for the difference between two independent correlations. If the 95% CI for this difference excluded 0, we considered this an indication that the difference between the correlations was statistically significant. To examine if the two facets of the Big Five personality traits included different behavioural manifestations (RQ3), we used Wilcox's function for calculating bootstrap CIs for the difference between two dependent correlations. If the 95% CI for this difference excluded 0, we considered this an indication that the facets had statistically different associations with the behaviourally coded or text–analytically derived variable.
Given normal theory estimates, our sample size of 462 participants gave us 80% power to detect effects of r ≥ .13 at p < .05 and r ≥ .17 at p < .005. Our sample of 188 male participants gave us 80% power to detect effects of r ≥ .20 at p < .05 and r ≥ .26 at p < .005. Our sample of 274 female participants gave us 80% power to detect effects of r ≥ .17 at p < .05 and r ≥ .21 at p < .005. These estimates are only provided as approximate estimates, as bootstrapping does not rely on assumptions of normality.
Again, we report two statistics for these analyses: a standardized effect size (i.e. rdifference) and a 95% confidence interval (CI) of rdifference. In line with recent effect size guidelines for researchers studying individual differences (Funder & Ozer, 2019; Gignac & Szodorai, 2016), we consider r = |.10| as small, r = |.20| as moderate or typical, and r = |.30| as large in the current study. To account for multiple testing and determine if the number of computed correlations we obtained was greater than one would expect by chance, we conducted randomization tests as recommended by Sherman and Funder (2009). For each Big Five domain separately and within the combined dataset, this method first randomly assigns the observed trait scores to participants and then correlates these randomized trait scores with our set of behaviourally coded and text–analytically derived variables. This process is then repeated 10 000 times, and the average number of statistically significant correlations across these trials is recorded. The resulting average number of significant correlations represents the number of correlations that one can expect by chance. If the number of actual correlations obtained per trait is greater than the number expected by chance, we conclude that the resulting relationships are, overall, unlikely to be spurious (although this test cannot speak to the robustness of individual obtained effects).
Finally, to further address the limits of our descriptive, exploratory approach to identifying behavioural manifestations of the Big Five, we decided to complement the randomization tests (which evaluate the overall non–randomness of our effects) with the highlighting of individual correlations that meet the recently proposed (and controversial) more stringent statistical significance criterion of p < .005 (Benjamin et al., 2018; Ioannidis, 2018). Our goal with this was not to attach labels of more definitive evidence to these ultimately still clearly exploratory effects; rather, it was to provide readers with the best statistical information to judge for themselves, using the interpretive lens and threshold they deem appropriate. The very large number of tests necessarily renders any single effect statistically uncertain—and subject to the need to replicate in a (pre–registered) confirmatory test. On the other hand, a maximally conservative approach, for example, via systematic Bonferroni correction, would have effectively biased our results towards the conclusion that personality appears hardly reliably related to behaviour (because of the then–insufficient power to detect realistic effect sizes), a conclusion that is both theoretically untenable and statistically inadequate. We therefore adopted a transparent (i.e. the effects for all measured variables were tested and reported), multi–pronged (i.e. robustness is evaluated via randomization tests, confidence intervals, and two thresholds for significance testing), exploratory (i.e. our non–pre–registered, atheoretical, bottom–up approach necessitates that no level of evidence is considered confirmatory) approach to identifying trait–behaviour links that we see as a compromise with respect to balancing statistical replicability concerns (i.e. guarding against Type I errors) with scientific generativity concerns (i.e. guarding against Type II errors).
Results
The means and standard deviations for all measures (i.e. Big Five personality trait domains, Big Five personality trait facets, behaviourally coded variables, and text–analytically derived variables) are provided in Table S3.
Research question 1 (RQ1): How are people's personalities manifested in their daily lives?
The left panel of Figures 1 to 5 shows the behavioural manifestations of the Big Five personality domains for all participants. We included an EAR–derived variable in the figures if its correlation with the Big Five personality domain had a 95% confidence interval that excluded 0 for all participants, female participants, or male participants (numerical results for all EAR–derived variables are provided online: https://osf.io/w3nt4/). From analysing the left panel of Figures 1 to 5, several observations are worth noting. First, neuroticism had the most correlates in the full sample, with 51, suggesting that it is reflected in a wide variety of daily behaviours and linguistic styles. By contrast, extraversion had 36 correlates, conscientiousness had 28, openness had 26, and agreeableness had 22. Second, only one of the effects was large, by Funder and Ozer's (2019) standards. Neuroticism was strongly associated with proportion of time blaming others (r = .31). The mean significant effect for all traits had a magnitude of .11 < |r| < .16. This suggests that personality plays out in small ways across a wide variety of domains, with few distinct, large associations with daily behaviours and linguistic styles. Third, certain traits were manifested more in the text–analytically derived variables, while others were manifested evenly in both the behaviourally coded and text–analytically derived variables. Whereas openness and agreeableness were more strongly manifested in the text–analytically derived variables (88% and 68% of correlates were from LIWC, respectively), neuroticism, conscientiousness, and extraversion were manifested equally in both the behaviourally coded and text–analytically derived variables (56%, 50%, and 50% of correlates from LIWC, respectively). Fourth, the correlations between the Big Five personality domains and the EAR–derived variables were not all intuitive. Some associations that would be expected based on theory were present, but there were also several surprising results. Below, we highlight some of the notable and robust (i.e. p < .005) behavioural manifestations that emerged for each of the Big Five personality domains.
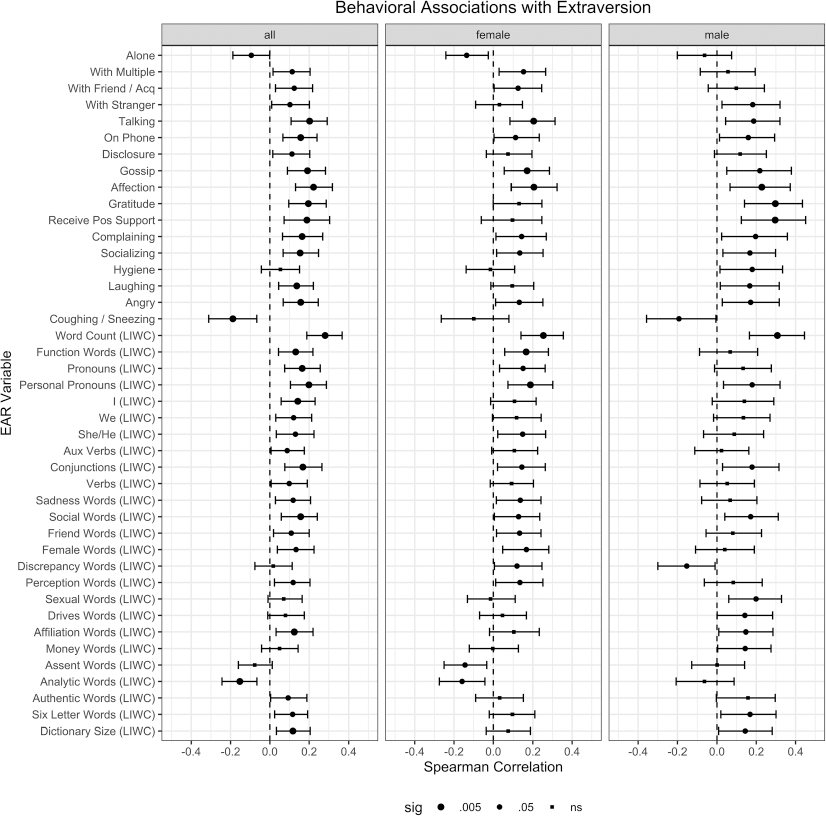
Zero–order correlations for extraversion and EAR–derived variables. The point estimate and the 95% confidence interval of the point estimate for the correlations are plotted. Shapes of the points in the figure indicate the uncorrected significance level of the correlations. Variables derived from LIWC text analysis are presented with the suffix (LIWC). All other variables were derived from content coding of the sound file. EAR, Electronically Activated Recorder; LIWC, Linguistic Inquiry and Word Count.
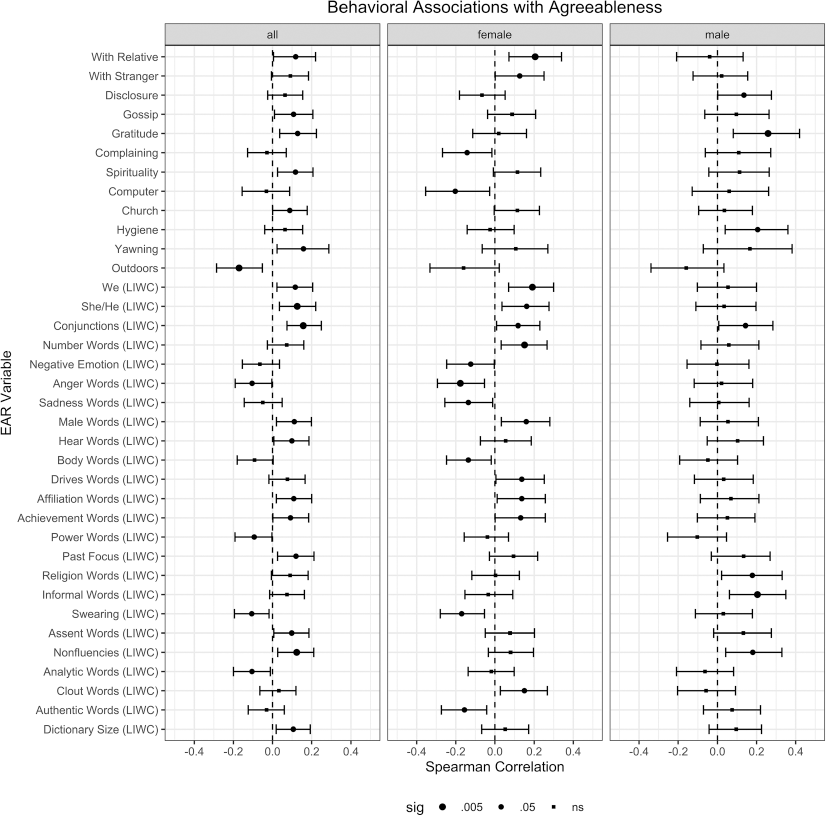
Zero–order correlations for agreeableness and EAR–derived variables. The point estimate and the 95% confidence interval of the point estimate for the correlations are plotted. Shapes of the points in the figure indicate the uncorrected significance level of the correlations. Variables derived from LIWC text analysis are presented with the suffix (LIWC). All other variables were derived from content coding of the sound file. EAR, Electronically Activated Recorder; LIWC, Linguistic Inquiry and Word Count.
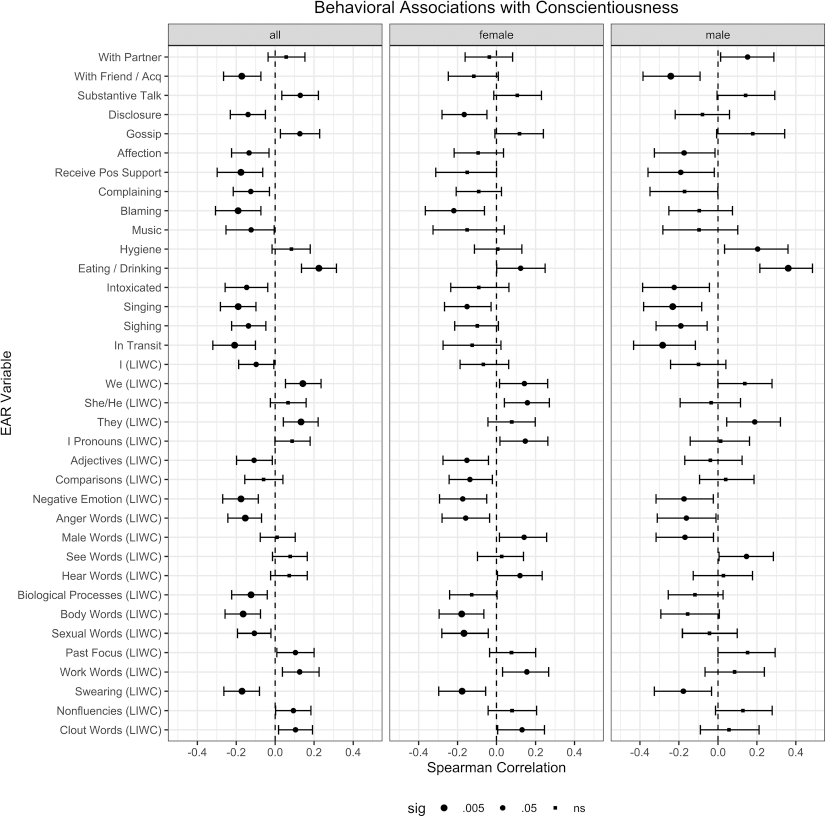
Zero–order correlations for conscientiousness and EAR–derived variables. The point estimate and the 95% confidence interval of the point estimate for the correlations are plotted. Shapes of the points in the figure indicate the uncorrected significance level of the correlations. Variables derived from LIWC text analysis are presented with the suffix (LIWC). All other variables were derived from content coding of the sound file. EAR, Electronically Activated Recorder; LIWC, Linguistic Inquiry and Word Count.
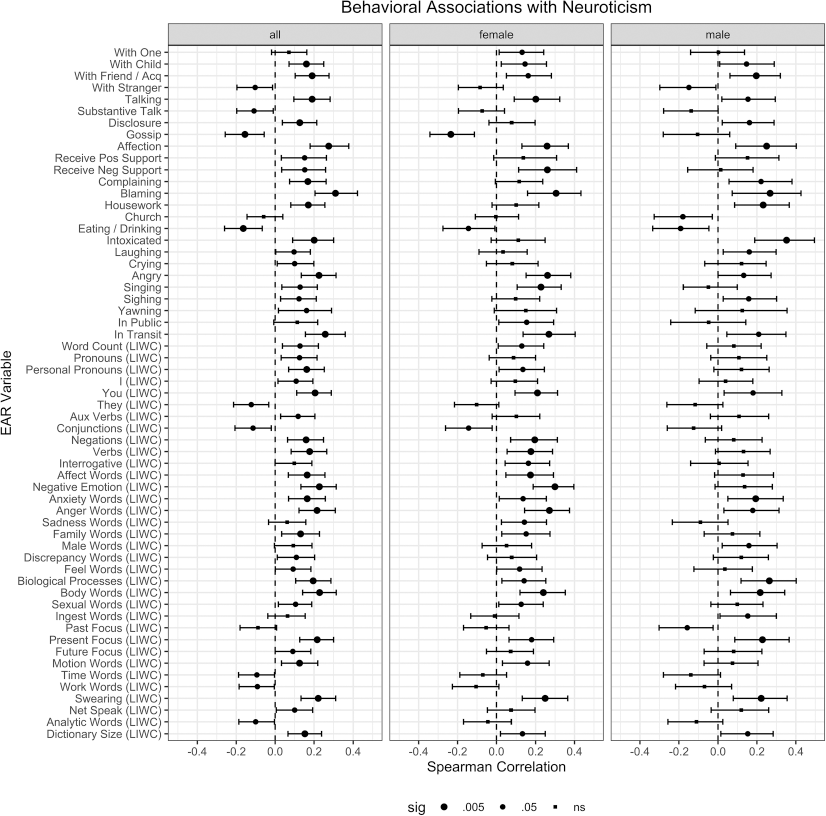
Zero–order correlations for neuroticism and EAR–derived variables. The point estimate and the 95% confidence interval of the point estimate for the correlations are plotted. Shapes of the points in the figure indicate the uncorrected significance level of the correlations. Variables derived from LIWC text analysis are presented with the suffix (LIWC). All other variables were derived from content coding of the sound file. EAR, Electronically Activated Recorder; LIWC, Linguistic Inquiry and Word Count.
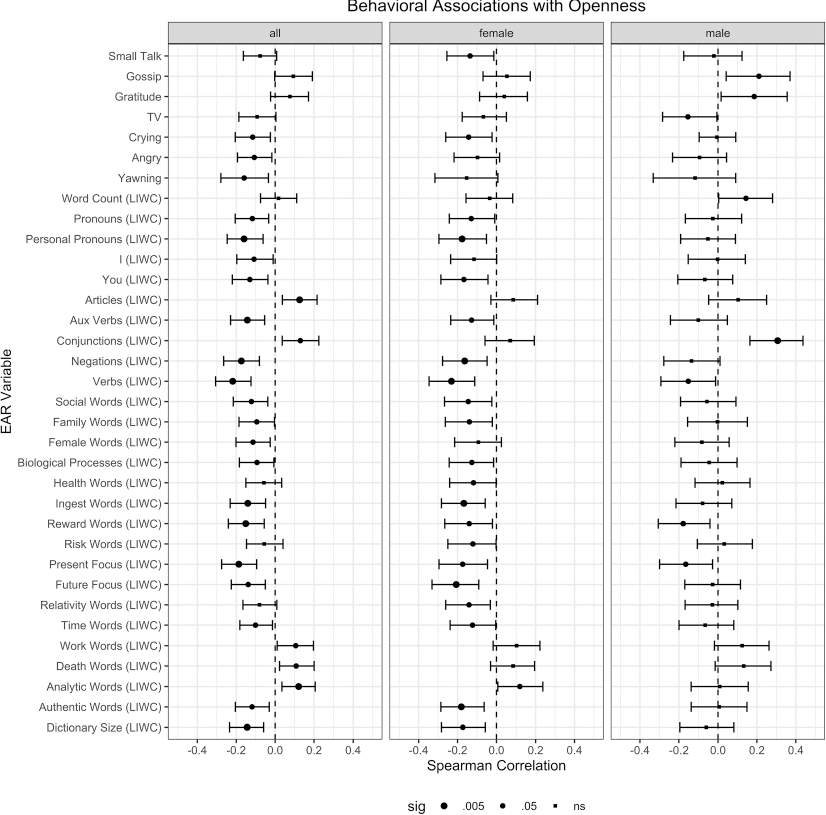
Zero–order correlations for openness and EAR–derived variables. The point estimate and the 95% confidence interval of the point estimate for the correlations are plotted. Shapes of the points in the figure indicate the uncorrected significance level of the correlations. Variables derived from LIWC text analysis are presented with the suffix (LIWC). All other variables were derived from content coding of the sound file. EAR, Electronically Activated Recorder; LIWC, Linguistic Inquiry and Word Count.
Extraversion
Our randomization test for extraversion revealed that 6.10 correlations would be expected by chance with all our behaviourally coded and text–analytically derived variables. We observed a total of 36 statistically significant correlations. Consistent with sociability being a core feature of extraversion, this trait was most strongly expressed in the quantity of social interactions. The EAR–derived variable most strongly associated with extraversion was overall word count, derived from LIWC (r = .28 [.19, .37]), followed by amount of time spent expressing affection towards others (r = .22 [.13, .32]) and amount of time spent talking (r = .20 [.11, .29]). These results are theoretically consistent with the content of extraversion as a trait, as they reflect saying more and spending more time with others. Several other robust associations (defined as p < .005) were theoretically consistent with extraversion: being higher in extraversion was associated with spending more time gossiping (r = .19 [.09, .28]), on the phone (r = .16 [.07, .24]), expressing anger or frustration (r = .16 [.07, .25]), engaging in social activities that are entertaining (r = .15 [.07, .25]), and laughing (r = .14 [.04, .22]), as well as using more social words (r = .16 [.06, .24]), first–person singular pronouns (‘I–talk’; r = .14 [.05, .23]), and affiliation words (r = .12 [.03, .22]). Beyond that, being higher in extraversion was also associated with using less analytic language (r = −.15 [−.24, −.07]).
Agreeableness
For agreeableness, 6.06 correlations would be expected by chance, and we observed 22 statistically significant correlations. Consistent with its trait definition of having a prosocial orientation towards others, agreeableness was associated with expressing more gratitude (r = .13 [.04, .22]), using more first–person plural pronouns (‘we–talk’; r = .12 [.02, .21]), using fewer anger words (r = −.10 [−.19, < −.01]), using more affiliation words (r = .11 [.02, .20]), swearing less (r = −.11 [−.19, −.02]), and using more assent words (r = .10 [.01, .19]). Interestingly, however, the most robust associations with agreeableness were theoretically non–obvious. Being more agreeable was associated with spending less time outdoors (r = −.17 [−.29, −.05]), using more conjunctions in speech (r = .16 [.07, .25]), and using the pronouns ‘she’ and ‘he’ more often (r = .13 [.04, .22]). It is not clear why more agreeable people would spend less time outdoors or use more conjunctions. Also of interest, more agreeable people tended to spend a greater proportion of time in church activities (r = .09 [< .01, .18]) and to discuss spirituality more often (r = .12 [.03, .21]). As mentioned in the Discussion section, this is consistent with prior literature linking agreeableness and religious engagement.
Conscientiousness
For conscientiousness, 6.12 correlations would be expected by chance, and we observed 28 statistically significant correlations. Two of the robust associations with conscientiousness reflect an ability to control impulses: greater conscientiousness was associated with spending less time blaming others (r = −.19 [−.31, −.07]) and swearing less (r = −.17 [−.26, −.08]). Several more theoretical associations emerge at the p < .05 threshold: greater conscientiousness was associated with having more substantive conversations (r = .13 [.03, .22]), spending less time being intoxicated (r = −.15 [−.26, −.04]), and using more words associated with work (r = .13 [.04, .23]). Several associations also suggest that greater conscientiousness is associated with less reliance on others socially: being more conscientious was associated with spending less time with friends and acquaintances (r = −.17 [−.27, −.07]), less time receiving positive support from others (r = −.18 [−.30, −.06]), less personal and emotional disclosure (r = −.14 [−.23, −.05]), and less time complaining (r = −.13 [−.22, −.03]). Several correlations also suggest that conscientious individuals may display more moderated and less expressive emotional behaviour, as greater conscientiousness was associated with using fewer negative emotion words (r = −.18 [−.27, −.09]), fewer anger words (r = −.15 [−.24, −.07]), less singing (r = −.19 [−.28, −.10]), and less sighing (r = −.14 [−.22, −.05]) and expressing affection less (r = −.13 [−.22, −.03]). Some strong robust associations with conscientiousness were surprising, and there is no clear theoretical connection. For example, being more conscientious was associated with spending more time eating and drinking (r = .22 [.14, .32]) and spending less time in transit (r = −.21 [−.32, −.10]).
Neuroticism
Neuroticism had by the far the most behavioural manifestations. Randomization analyses revealed that we would expect 6.09 correlations by chance, and we observed 51 statistically significant correlates. Several of the robust correlates of neuroticism were consistent with its overall negative emotionality. For example, being higher in neuroticism was associated with more time complaining (r = .17 [.07, .26]), more blaming of others (r = .31 [.20, .42]), expressing more anger or frustration (r = .23 [.13, .31]), using more negation words (r = .16, [.06, .25]), more negative emotion words (r = .23 [.13, .31]), more anxiety–related words (r = .16 [.07, .26]), more anger–related words (r = .22 [.13, .30]), and more swearing (r = .22 [.13, .31]). Several correlates also suggested that neuroticism was associated with greater emotional expression overall, consistent with the idea that neuroticism is related to fluctuations in emotions: individuals higher in neuroticism spent more time talking (r = .19 [.10, .28]), expressing affection more (r = .27 [.18, .38]), and using more affect–related words (r = .16 [.07, .25]). Greater neuroticism was also associated with a distinct profile of social partners: spending more time with children (r = .16 [.07, .25]), more time with friends or acquaintances (r = .19 [.10, .28]), and less time with strangers (r = −.10 [−.20, −.01]). Greater neuroticism was also associated with spending more time being intoxicated (r = .20 [.09, .30]). Some of the robust associations with neuroticism would not necessarily be predicted by theory but are of potential interest. For example, being higher in neuroticism was associated with spending more time in transit (r = .26 [.16, .36]), using more words related to the body (r = .20 [.11, .29]), and using more words related to the present (r = .22 [.13, .30]).
Openness to experience
For openness to experience, 6.10 correlations would be expected by chance, and we observed 26 statistically significant correlates. Openness was predominantly manifested in participants’ language use, especially the grammatical components of language. In fact, all of the robust associations (e.g. p < .005) for openness were with the text–analytically derived variables. People high in openness used fewer personal pronouns (r = −.16 [−.25, −.06]), more articles (r = .13 [.04, .22]), fewer auxiliary and common verbs (r = −.14 [−.23, −.05] and r = −.22 [−.31, −.12], respectively), and fewer negations (r = −.17 [−.26, −.08]). They also tended to use fewer words that had time orientations (especially present, r = −.19 [−.27, −.10] and future–focused words, r = −.14 [−.23, −.05]). Consistent with the content of openness as being interested in a wider variety of ideas, greater openness was associated with the use of more analytic words (r = .12 [.03, .21]), and with spending less time yawning (r = −.11 [−.19, −.02]). Some robust associations with openness were surprising: people higher in openness used fewer words related to ingestion (r = −.14 [−.23, −.05]) and fewer words related to rewards (r = −.15 [−.24, −.06]).
Research question 2 (RQ2): Do the behavioural manifestations of the Big Five personality traits differ by gender?
The middle and right panels of Figures 1 to 5 show the behavioural manifestations of the Big Five personality domains for female and male participants. To examine if the correlations for men and women were statistically different, we computed a 95% confidence interval of the difference between the correlations (i.e. rdifference). If the 95% CI of the difference between the correlations excluded 0, we concluded that the correlation of the given EAR–derived variable and Big Five personality trait differed significantly between male and female participants.
We found 31 significant gender differences out of the 620 effects that we tested (or 5%), indicating that personality had similar associations with daily behaviour and linguistic styles in general. We therefore conclude that there was little evidence of gender differences in the behavioural manifestations of the Big Five personality domains, which is inconsistent with the seemingly frequent gender differences documented in Mehl et al. (2006). Except for agreeableness, which had 15 gender differences that were statistically different, the remaining Big Five personality traits had similar numbers of gender differences (extraversion had three, neuroticism and openness had four, and conscientiousness had five).
The largest gender difference for extraversion was for the use of discrepancy words (rdifference = −.27 [−.47, −.09]): whereas the relationship between extraversion and using discrepancy words was negative for men (r = −.15 [−.30, −.01]), it was positive for women (r = .12 [.01, .25]). The two remaining gender differences for extraversion were moderate in magnitude. First, whereas men high in extraversion used more sexual words than men low in extraversion, the relationship between extraversion and the use of sexual words was essentially 0 for women (rmale = .20 [.06, .33], rfemale = −.01 [−.13, .11], and rdifference = .21 [.03, .39]). Second, the relationship between extraversion and the use of informal words tended to be positive for men and negative for women (rmale = .09 [−.04, .24], rfemale = −.10 [−.21, .03], and rdifference = .19 [.003, .37]).
For agreeableness, several patterns of findings emerged. First, the tendency for agreeable people to avoid using inappropriate language that could disrupt social harmony was only apparent among women. Whereas women high in agreeableness used fewer anger words and swear words, and tended to use fewer sexual words, than women low in agreeableness, the relationship between agreeableness and these types of words was not statistically different from 0 for men (for anger words: rmale = .02 [−.12, .18], rfemale = −.18 [−.29, −.05], and rdifference = .20 [.01, .40]; for swear words: rmale = .03 [−.11, .18], rfemale = −.17 [−.28, −.05], and rdifference = .20 [.02, .38]; and for sexual words: rmale = .10 [−.05, .25], rfemale = −.10 [−.22, .02], and rdifference = .20 [.01, .39]). Second, the prosocial behaviour displayed by agreeable people during their conversations with others differed by gender. Among men, expressing gratitude, engaging in personal and/or emotional disclosure, and expressing affection were positive correlates of agreeableness (for expresses gratitude: rmale = .26 [.08, .42], rfemale = .02 [−.11, .16], and rdifference = .24 [.01, .45]; for personal/emotional disclosure: rmale = .14 [.001, .28], rfemale = −.07 [−.18, .05], and rdifference = .20 [.02, .38]; and for expresses affection: rmale = .16 [−.01, .31], rfemale = −.10 [−.23, .02], and rdifference = .26 [.05, .46]). Among women, spending time with relatives was a positive correlate of agreeableness (rmale = −.04 [−.21, .13], rfemale = .20 [.07, .34], and rdifference = −.24 [−.46, −.03]), and complaining was a negative correlate of agreeableness (rmale = .11 [−.06, .27], rfemale = −.14 [−.27, −.02], and rdifference = .25 [.04, .46]). Third, the types of activities associated with agreeableness differed by gender. Whereas the relationship between agreeableness and time spent taking care of one's hygiene was positive for men and essentially 0 for women (rmale = .21 [.04, .36], rfemale = −.02 [−.14, .10], and rdifference = .23 [.02, .42]), the relationship between agreeableness and time spent on the computer was negative for women and not statistically different from 0 for men (rmale = .06 [−.13, .26], rfemale = −.20 [−.35, −.03], and rdifference = .26 [.004, .51]). The remaining gender differences occurred for one behaviourally coded variable (i.e. singing) and four text–analytically derived variables (i.e. feel words, informal words, authentic words, and clout words). Numerical results for these findings are provided online (https://osf.io/w3nt4/).
The largest gender difference for conscientiousness was using male references (rdifference = −.31 [−.50, −.12]): whereas the relationship between conscientiousness and using words like he, men, and father was negative for men (r = −.17 [−.32, −.02]), it was positive for women (r = .14 [.02, .26]). A similar, yet weaker, pattern emerged for third–person singular pronouns (rmale = −.04 [−.19, .12]; rfemale = .16 [.04, .27]; rdifference = −.19 [−.39, −.002]), which may be due to the fact that some of the words making up these two LIWC word categories overlap. The three remaining gender differences were all for behaviourally coded variables. First, while the positive relationship between conscientiousness and time spent eating and/or drinking (non–alcoholic beverages) was apparent for both genders, it was statistically larger for men than women (rmale = .36 [.22, .49]; rfemale = .12 [.001, .25]; rdifference = .24 [.05, .41]). Second, conscientious men spent more time with their significant other than less conscientious men, but the relationship between conscientiousness and spending time with a significant other was close to 0 for women (rmale = .15 [.01, .29], rfemale = −.04 [−.16, .08], and rdifference = .19 [.01, .37]). Finally, the relationship between conscientiousness and time spent engaged in small talk tended to be positive for men and negative for women (rmale = .13 [−.01, .27], rfemale = −.10 [−.21, .02], and rdifference = .23 [.04, .41]).
The previously reported positive relationship between neuroticism and time spent being intoxicated was statistically larger for men than women (rmale = .35 [.19, .50], rfemale = .11 [−.03, .25], rdifference = .24 [.03, .44]). The three remaining gender differences, which were for using sadness–related words (rdifference = −.23 [−.42, −.05]), receiving negative support from others (rdifference = −.25 [−.47, −.02]), and singing (rdifference = −.28 [−.44, −.08]), all showed a similar pattern: Compared with women low in neuroticism, those high in neuroticism used more sadness–related words (r = .14 [.03, .26]) and received more negative support from others (r = .26 [.11, .41]), and perhaps serving an emotion regulation purpose, engaged in more singing (r = .23 [.11, .33]); however, the relationships between these variables and neuroticism were not statistically different from 0 for men (for sadness–related words: r = −.09 [−.23, .05]; for receives negative support: r = .01 [−.16, .18]; and for singing: r = −.05 [−.18, .10]).
The previously reported positive relationship between openness and using conjunctions was statistically larger for men than women (rmale = .31 [.16, .44], rfemale = .07 [−.06, .19], rdifference = .24 [.05, .42]). Next, the relationship between openness and the use of authentic words was negative for women and essentially 0 for men (rmale = .01 [−.14, .15], rfemale = −.18 [−.29, −.06], rdifference = .19 [.001, .36]). Finally, for time spent coughing/sneezing and using words related to differences, the relationships with openness tended to be positive for men and negative for women (for coughing/sneezing: rmale = .17 [−.01, .37], rfemale = −.08 [−.24, .08], and rdifference = .26 [.01, .51]; for differentiation words: rmale = .11 [−.03, .25], rfemale = −.09 [−.20, .03], and rdifference = .20 [.01, .38]).
Research question 3 (RQ3): Do the behavioural manifestations of the Big Five personality traits differ by facet?
Figures 6 to 10 show all instances where the behavioural manifestations of the two facets of each Big Five personality domain differed. We included an EAR–derived variable in the figures if the 95% CI of the difference between its association with the two facets did not include 0. To examine facet differences, we used a permutation test (implemented using the WRS package for R) to test the significance of differences between correlations for the two facets of each trait. Below, we report those differences between correlations of an EAR–derived variable and the two facets if it was significant at the p < .05 level. There were 64 significant differences between the associations of EAR–derived variables and the two facets of a trait, and more than half of these (34) were differences in the associations of the two facets of extraversion. This makes sense, as the facets of extraversion were the lowest in correlation (r = .41) of any trait. There were 11 differences for conscientiousness facets, eight for agreeableness facets, six for openness facets, and five for neuroticism facets. Rather than reporting all differences here, we instead focus on some of the key findings that emerged.
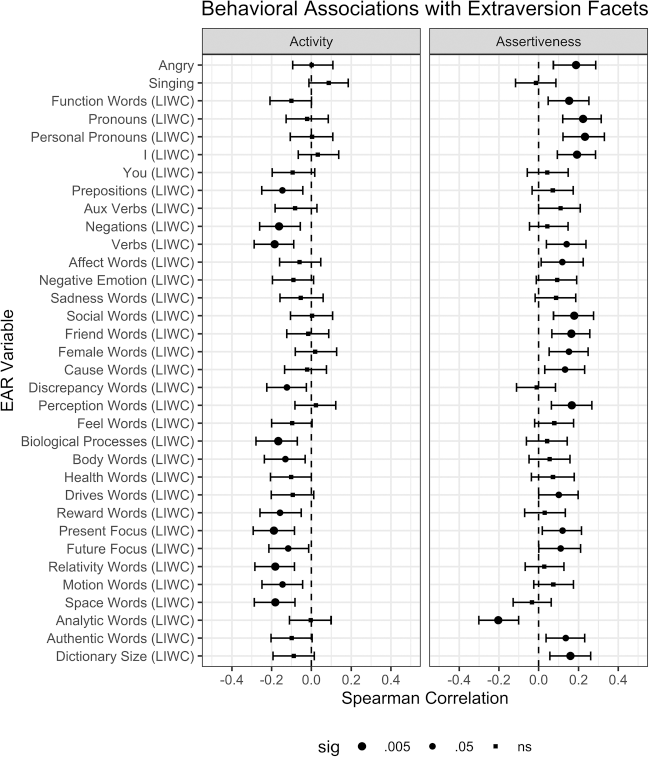
Zero–order correlations for extraversion facets and EAR–derived variables. The only EAR variables plotted were those where the correlation with the two personality facets differed significantly (p < .05). The point estimate and the 95% confidence interval of the point estimate for the correlations are plotted. Shapes of the points in the figure indicate the uncorrected significance level of the correlations. Variables derived from LIWC text analysis are presented with the suffix (LIWC). All other variables were derived from content coding of the sound file. EAR, Electronically Activated Recorder; LIWC, Linguistic Inquiry and Word Count.
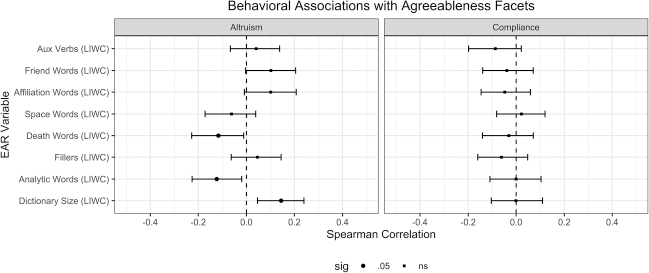
Zero–order correlations for agreeableness facets and EAR–derived variables. The only EAR variables plotted were those where the correlation with the two personality facets differed significantly (p < .05). The point estimate and the 95% confidence interval of the point estimate for the correlations are plotted. Shapes of the points in the figure indicate the uncorrected significance level of the correlations. Variables derived from LIWC text analysis are presented with the suffix (LIWC). All other variables were derived from content coding of the sound file. EAR, Electronically Activated Recorder; LIWC, Linguistic Inquiry and Word Count.
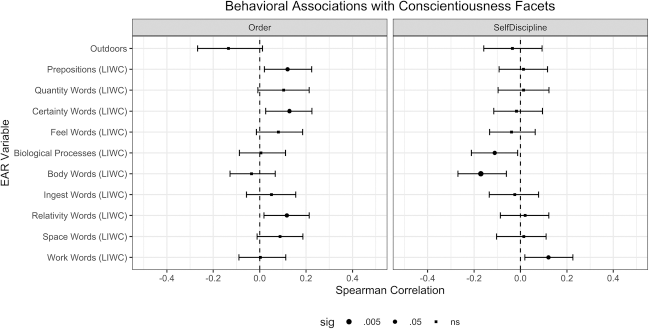
Zero–order correlations for conscientiousness facets and EAR–derived variables. The only EAR variables plotted were those where the correlation with the two personality facets differed significantly (p < .05). The point estimate and the 95% confidence interval of the point estimate for the correlations are plotted. Shapes of the points in the figure indicate the uncorrected significance level of the correlations. Variables derived from LIWC text analysis are presented with the suffix (LIWC). All other variables were derived from content coding of the sound file. EAR, Electronically Activated Recorder; LIWC, Linguistic Inquiry and Word Count.
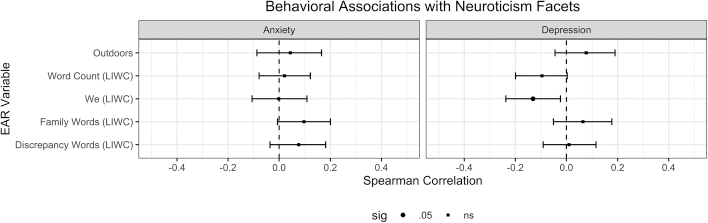
Zero–order correlations for neuroticism facets and EAR–derived variables. The only EAR variables plotted were those where the correlation with the two personality facets differed significantly (p < .05). The point estimate and the 95% confidence interval of the point estimate for the correlations are plotted. Shapes of the points in the figure indicate the uncorrected significance level of the correlations. Variables derived from LIWC text analysis are presented with the suffix (LIWC). All other variables were derived from content coding of the sound file. EAR, Electronically Activated Recorder; LIWC, Linguistic Inquiry and Word Count.
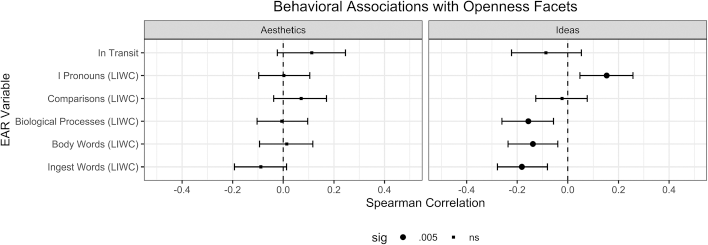
Zero–order correlations for openness facets and EAR–derived variables. The only EAR variables plotted were those where the correlation with the two personality facets differed significantly (p < .05). The point estimate and the 95% confidence interval of the point estimate for the correlations are plotted. Shapes of the points in the figure indicate the uncorrected significance level of the correlations. Variables derived from LIWC text analysis are presented with the suffix (LIWC). All other variables were derived from content coding of the sound file. EAR, Electronically Activated Recorder; LIWC, Linguistic Inquiry and Word Count.
Figure 6 shows all of the significantly different correlations between facets of extraversion and the EAR–derived variables. In general, the EAR–derived variables were more positively related with the assertiveness facet than with the activity facet. Only two of the 34 significant differences were due to the activity facet having a more positive correlation. Additionally, all but two of the significant differences were with the text–analytically derived variables. Assertiveness was more positively associated with several of the grammatical components of language, including using more verbs (rdifference = .29 [.18, .39]), more pronouns (rdifference = .22 [.11, .33], in particular personal pronouns: rdifference = .21 [.09, .33]), more function words (rdifference = .21 [.11, .31]), more prepositions (rdifference = .18 [.09, .28]), and more auxiliary verbs (rdifference = .18 [.08, .28]). Assertiveness was also more positively associated with other aspects of linguistic style, such as using more present–focused words (rdifference = .27 [.16, .38]), more future–focused words (rdifference = .21 [.10, .32]), more unique words (rdifference = .21 [.11, .31]), and more negations (rdifference = .15 [.05, .25]). Activity was more strongly associated with using less analytic language (rdifference = −.17 [−.28, −.07]) and singing less (rdifference = −.15 [−.26, −.05]). In all these cases, this was because assertiveness and activity had associations in opposite directions: for example, people high in assertiveness used more present–focused language, while people high in activity used less present–focused language. Together, these findings suggest that which aspect of extraversion an individual is high in—assertiveness or activity—has a large effect on how they use language. Numerical results for all EAR–derived variables are provided online (https://osf.io/w3nt4/).
Figure 7 shows all of the significantly different associations between EAR variables and the facets of agreeableness. All of the significant differences between the altruism and compliance facets of agreeableness were in linguistic variables. Consistent with the theoretical content of the facets, altruism had a more positive association with using affiliation words (rdifference = .16 [.06, .27]) and using words related to friends (rdifference = .13 [.02, .24]). Compliance had a more positive association with using words related to death (rdifference = −.14 [−.25, −.02]), reflecting the fact that people high in altruism use words associated with death less. This might be considered more affiliative, because talking about death might invoke anxiety in others. Altruism was also more positively associated with using filler words (rdifference = .11 [.01, .21]), using auxiliary verbs (rdifference = .11 [.01, .21]), and using more unique words (rdifference = .08 [.01, .16]). Compliance was more positively associated with using words associated with space (rdifference = −.10 [−.19, > −.01]) and analytic language (rdifference = −.10 [−.19, −.01]). These do not obviously align with theory.
Figure 8 shows all the significantly different correlations between the EAR variables and the facets of conscientiousness. Several differences between the facets align with theory. Order was more positively associated with using words associated with certainty (rdifference = −.16 [−.25, −.07]), words related to space (rdifference = −.12 [−.22, −.02]), words related to quantities (rdifference = −.12 [−.21, −.02]), and words related to space and time more generally (rdifference = −.11 [−.22, −.01]), while self–discipline was more positively associated with words related to work (rdifference = .11 [.02, .21]). These differences suggest that order is associated with using more precise, measurement–based language, while self–discipline is associated with spending more time talking about work. The largest difference between the facets was in time spent outdoors (rdifference = .17 [.06, .28]). This difference reflects the fact that people higher in order spent less time outdoors (r = −.15), while spending time outdoors was not related to self–discipline (r = .02). This would not necessarily be a theoretical prediction but might reflect the idea that time spent outdoors is an open–ended, unstructured environment—an environment low in order.
Figure 9 shows all of the significantly different associations between EAR variables and the facets of neuroticism. Several differences between the facets of neuroticism are in line with theory. There are more positive associations between anxiety and using words related to family (rdifference = .12 [.01, .23]), using ‘we’ language (rdifference = .11 [.01, .21]), using words related to discrepancy (rdifference = .11 [.01, .21]), and the overall number of words spoken (rdifference = .11 [.02, .20]), than between these types of words and depression. Anxiety is positively correlated with talking about family (r = .13) and using discrepancy words (r = .11), while there is effectively no relationship between these variables and depression. This suggests that concerns over family and over differences—potentially among people or groups—are associated with anxiety. On the other hand, greater depression is negatively associated with using ‘we’ language (r = −.15) and the number of words spoken overall (r = −.10). These associations suggest that depression is associated with less connection to groups and less social engagement. There is one other significant difference between the facets: depression is more positively associated with spending time outdoors (rdifference = −.16 [−.28, −.03]); people higher in anxiety spend less time outdoors (r = −.09). This difference is not predicted by theory.
Figure 10 illustrates all EAR variables that correlated significantly differently with the facets of openness. Few of the differences in associations between the facets follow a clear theoretical pattern. Using ‘I’ pronouns was more positively associated with being interested in ideas than in aesthetics (rdifference = .11 [<.01, .22]), suggesting that ‘I’ language is more related to making sense of or discussing ideas than aesthetics. Aesthetics was more positively associated with words related to the body (rdifference = −.14 [−.24, −.05]), biological processes (rdifference = −.14 [−.25, −.03]), and ingestion (rdifference = −.13 [−.25, −.01]), suggesting an interest in human bodies and natural processes. Aesthetics was also more positively associated with using comparison words (rdifference = −.14 [−.25, −.02]), suggesting greater need to make direct comparisons when discussing artistic interests than interests in new ideas. There was also a large, unexpected difference in the relationship of the two facets to the proportion of time spent in transit (rdifference = −.17 [−.31, −.04]). This reflects the fact the people high in aesthetics tend to spend more time in transit (r = .16), while there is little relationship between ideas and time spent in transit (r = −.01).
Discussion
In response to a call for personality psychologists to focus their research more on documenting the relationships between personality and directly observed behaviours in a wide range of situations (e.g. Funder, 2001), Mehl et al. (2006) undertook an examination of how the Big Five personality domains are expressed in what people actually do and say in their day–to–day lives, as naturalistically (acoustically) observed with the EAR method. However, their sample size (N = 96), although sizable for behavioural observation research, was ultimately too small to detect realistic effect sizes with sufficient statistical power while simultaneously putting it at critical risk for false–positive inferences. It was further undesirably homogeneous, consisting of college students at one university.
With the use of a sample that is more than four times larger (N = 462) and considerably more diverse than the original one (participants from two different regions, in different stages of their lives, and with different life experiences), the primary purpose of the current project was to obtain more precise and generalizable effect estimates of naturalistically observed behavioural manifestations of the Big Five personality domains and to re–examine the degree to which these behavioural manifestations reliably differed by gender (because the original study found important gender specificity). Finally, because narrowly defined traits can predict specific behaviours, similar to those extracted from EAR data, with greater accuracy than broader traits (Paunonen & Ashton, 2001), the secondary purpose of the current study was to extend the original paper by examining if the behavioural manifestations differed across two facets of each Big Five domain.
Overall, while several of the identified Big Five–behaviour links were generally consistent with their trait definitions (replicating several findings by Mehl et al., 2006), we found little evidence that Big Five–behaviour links were gender specific (not replicating a basic finding by Mehl et al., 2006). Out of 620 trait–behaviour correlations, only 36 differed by gender. Unique to the current study, we further found that the Big Five–behaviour links were not always comparable across the two facets assessed per Big Five domain, speaking to the need to complement broader trait–behaviour links with more fine–grained levels of the personality hierarchy. Finally, most observed effects were typically small to medium in magnitude (the average absolute value of all statistically significant correlations was .16, range .09–.36), a finding that appears realistic on the basis of what the field has learned about to be expected effect sizes (e.g. Funder & Funder & Ozer, 2019) and considering that, in this study, the personality and the daily behaviour assessments share no method variance.
How are people's personalities manifested in their daily lives?
Contrary to laypersons’ beliefs and research showing that extraversion is the most observable Big Five personality trait (Funder & Dobroth, 1987; John & Robins, 1993; Vazire, 2010), extraversion did not have the most behavioural correlates. Instead, neuroticism was the personality trait with the most behavioural manifestations. However, extraversion still had many behavioural correlates (36), including many consistent with its theoretical definition. For example, we found that the more extraverted an individual was, the more time they spent talking, the more words they spoke, and the more time they spent around multiple other people. Extraverts expressed more affection and gratitude towards others and, perhaps as a consequence, received more positive support from others. They also used more language that involved social processes, including using first–person plural pronouns and affiliation words. Interestingly, not all of the social behaviours associated with extraversion were inherently positive; extraverts spent more time gossiping about others and complaining to others. Although these behaviours might risk negative social repercussions, they can also serve a bonding purpose (Robbins & Karan, 2019). We also found that people who were more extraverted used less analytic language, consistent with the idea that being in a positive mood leads to less careful processing (Forgas, 1995). We also found that extraverts expressed fewer symptoms of poor health or illness, such as coughing, sneezing, and sniffling, a set of behaviours with no direct theoretical link to extraversion (see, however, Cohen, Doyle, Turner, Alper, & Skoner, 2003).
Given the strong empirical link between extraversion and positive emotionality (Lucas, Diener, Grob, Suh, & Shao, 2000), one of the most surprising findings from the original article by Mehl et al. (2006) was that extraversion was not manifested in any verbal or non–verbal expressions of positive emotion. While our study similarly did not find that extraverts used more positive emotion words than their less extraverted peers, we did find that extraverts laughed more, expressed affection more often, and expressed gratitude more often. These are all expressions of positive emotion, suggesting that the previous study may not have considered a broad–enough set of cues or might not have had sufficient statistical power to detect these effects. The LIWC category of positive emotion words is broad, including any word with a positive meaning (e.g. love, nice, sweet, happy, and joy), but may not capture the most common ways positive emotion is communicated socially. For example, Pennebaker, Mehl, and Niederhoffer (2003) suggested that non–verbal expressions of positive emotion (like laughing) are phylogenetically older and more direct. New research by Sun et al. (2020) suggests that positive emotion words captured by LIWC reflect verbalization of positive emotion, which does not necessarily track people's internal experiences of emotion. Extraverts may experience more positive emotions, but they might express this through non–verbal means.
Interestingly and unique to the current study, we also found that extraverts spent more time expressing anger by raising their voices at others, a finding that, while contradictory on the surface, makes sense when examining the facet analyses, which we return to later in the discussion.
Agreeableness was primarily manifested in language that reflected a prosocial and communal orientation towards others, consistent with its overarching trait definition. For example, in addition to replicating the robust negative relationship between agreeableness and swear words observed in the original article and elsewhere (e.g. Park et al., 2015), our study also revealed that agreeable people used more prosocial or affiliation words (e.g. unity, cooperation, and partnership), more assent and agreement words more often, and fewer antagonistic or anger words (e.g. hostile, hate, and kill). Further, whereas the original article found that agreeable people used more first–person singular pronouns (e.g. I, me, and my), we found that they used more first–person plural pronouns (e.g. we, us, and our), which is more consistent with the other–focused nature of agreeableness. Consistent with prior evidence linking agreeableness with behavioural manifestations of religiosity (e.g. Kern, Eichstaedt, Schwartz, Park, et al., 2014), we also found that the more agreeable an individual was, the more time they spent at church–related activities and the more words related to spirituality they used. Some correlates of agreeableness could also be considered negative: more agreeable people used less analytic language (which might reflect a bias towards heuristic thinking due to positive affect; Forgas, 1995) and spent more time gossiping. It should be noted however that the finding that agreeable people gossip more is also consistent with the perspective that gossip can be used in a prosocial way, to protect others from antisocial or exploitative behaviour (Feinberg, Willer, Stellar, & Keltner, 2012). The original study found that listening to music was a negative correlate of agreeableness (which we did not replicate), while the current study found that yawning more often was a positive correlate of agreeableness, two activities with no clear link to agreeableness.
Consistent with industriousness being a core feature of conscientiousness, highly conscientious college students in the original article spent more time in class and highly conscientious adults in the current study used more words related to work. Conscientious individuals also tended to use language that could reflect their desire to follow socially prescribed norms. For example, conscientious people were more likely to use language that could promote social harmony, such as more first–person plural pronouns, and less likely to use words that could disrupt social harmony or be considered socially inappropriate (e.g. less swearing, less use of negative emotion words, less use of anger words, and less use of body words, which includes some sexual words). This preference for social harmony can also be seen in less time spent being intoxicated, less blaming of others, and less time complaining. Besides linguistic styles, conscientious individuals also spent more time preparing or consuming food and (non–alcoholic) beverages. Although this is not a face–valid behavioural marker of conscientiousness, it may refer to conscientious individuals’ interest in dedicating more time to arranged or planned meals as a result of their self–disciplined nature.
Neuroticism has been linked strongly to negative affect in the past (Watson & Clark, 1984), and this association was reflected in several behaviour correlations in this study: people who were more neurotic tended to use more negative emotion words, particularly words related to anger and anxiety, to swear more often, to express anger or frustration more often (as captured through behavioural coding), to cry more often, to complain more often, and to blame others more often. The original study did not find an association between negative emotion words and neuroticism, but results of this study suggest that this association is present when a larger, more diverse sample is used. This study replicates the findings from the original study that also found neuroticism was associated with expressing anger and crying more frequently.
Our results also indicated that people who were more neurotic tended to connect with others socially more frequently, expressing affection more often; spending more time with family, friends, and acquaintances; talking more frequently; receiving both positive and negative social support; disclosing personal and emotional matters to others; and laughing more often. This suggests that people higher in neuroticism may rely more heavily on others for emotional support. Supporting this account, neuroticism was associated with less time spent in substantive conversation, less time spent gossiping, and less time with strangers. Also surprising was that a negative relationship between words spoken and neuroticism observed in the original study reversed in this larger and more diverse sample; we found here that people who were more neurotic said more words and talked more frequently overall.
The known positive association between neuroticism and first–person singular pronoun was replicated in this study (Tackman et al., 2019). Together, these findings fit into a larger narrative, suggesting that neurotic people tend to be anxious and self–aware, express negative emotions more, and, likely as a consequence, seek and receive social support more often.
Out of all the Big Five personality traits, openness to experience was most manifested in participants’ grammatical language use. For example, open individuals used fewer first–person singular pronouns, fewer auxiliary and common verbs, fewer negations, more articles, and more conjunctions. In terms of content words, open individuals used more analytic words and more words that referred to death, which is not inconsistent with past research (e.g. Kern, Eichstaedt, Schwartz, Park, et al., 2014), and may refer to open individuals’ intellectual curiosity with philosophical or existential matters. Although not expected, open individuals also yawned less, which, although not a face–valid behavioural marker of openness to experience, could reflect open individuals’ tendency to be engaged in rather than bored with their daily activities and pursuits.
To facilitate a juxtaposition of the original and the replication study, we created a direct comparison of the significant effects in Mehl et al. (2006) with the effects obtained in this updated sample, presented in Table 2. There was not always a perfectly analogous variable from the 2006 study, but we identified a close relationship where possible. We found that eight of 20 effects with comparable variables replicated. Three of four of the original effects associated with extraversion replicated, while only one of six effects associated with agreeableness did. Overall, these results suggest that while the original sample was able to pick up on some robust, general associations between personality traits and behaviour, many of the originally reported effects were not consistent. Indeed, even in cases where the effect replicated, the magnitude of the effect size was smaller (except in the case when the arguing–neuroticism link was compared with the angry–neuroticism link). The new associations illustrate how different results can be when a larger, non–student sample is used in research.
Replication of earlier associations
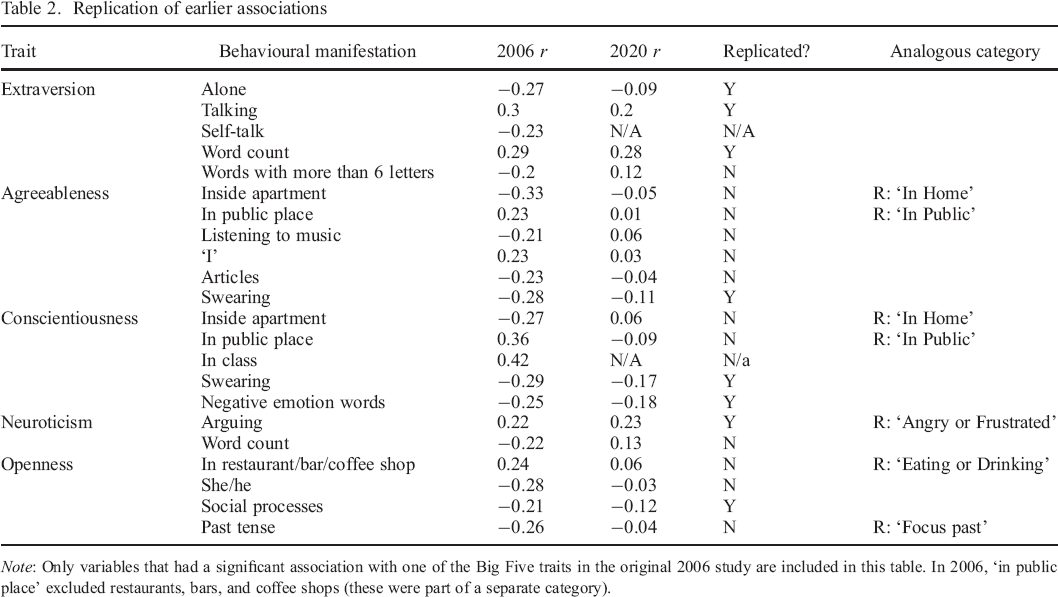
Note: Only variables that had a significant association with one of the Big Five traits in the original 2006 study are included in this table. In 2006, ‘in public place’ excluded restaurants, bars, and coffee shops (these were part of a separate category).
To what extent are the behavioural manifestations of the Big Five gender specific?
In contrast to the seemingly frequent gender differences documented in Mehl et al. (2006), we did not find much evidence for gender differences. Out of the 620 gender differences that we tested for across the Big Five personality domains, only 31 differences (or 5%) were statistically meaningful. None of the gender differences documented in Mehl et al. (2006) that we examined in the current study replicated. Although potentially surprisingly considering our larger sample size, N = 96 in Mehl et al. (2006) versus N = 462 in the current study, other research using an even larger sample size found similarly few gender differences when examining the relationships between the Big Five personality domains and LIWC word categories (Kern, Eichstaedt, Schwartz, Park, et al., 2014). Additionally given the sample size, we would only expect to be able to statistically detect moderately sized differential associations. Some smaller gender differences might be statistically detected using a larger sample.
Several statistically detectable gender differences in our sample followed interesting patterns associated with expected gender roles, but others did not have a clear connection to theory. For example, one of the gender differences for extraversion was for using discrepancy words. Men who used fewer discrepancy words were more extraverted. This does not clearly fit theory.
Gender differences in correlates with agreeableness suggest important differences between the way men and women are socialized to behave. Using sexual language and swearing are typically considered ‘inappropriate’ behaviours, which indicate less concern for social hierarchy. However, these using sexual language and swearing was only a sign of disagreeableness for women (who tend to be subject to stronger gender norms about ‘behaving appropriately’), and not for men (for whom defying social norms tends to be less reputationally damaging if not even reputationally enhancing). Talking about sex and swearing had a positive association with agreeableness among men.
Spending time with relatives indicates agreeableness in women, but not in men. This, too, might be explainable with reference to traditional gender role expectations. Maintaining strong relationships with others, especially family, has traditionally been the role of women. Women who are more agreeable might be spending more time with relatives in an attempt to better meet the expectations of this role. Without this role expectation, the association between time with relatives and agreeableness is close to zero for men.
Some of the gender differences in correlates with conscientiousness suggest differences in social expectations between men and women. Making small talk is an indicator that a man is more conscientious, but that a woman is less conscientious. This might be due to women being socialized to attend more to relationships, so that spending more time on small talk is an indicator that she is being less conscientious about delving into more substantive conversation topics. By contrast, men who spend more time in small talk may be acting more conscientious about maintaining their relationships by checking in with others more than would be expected.
Spending more time with a romantic partner emerged as an indicator of conscientiousness among men but has little relationship to women's conscientiousness. This suggests that for men, who are expected to spend less time considering relationships, spending more time on those relationships might indicate more attention to the details of making relationships work. Alternately, it could be that conscientiousness men are more likely to be in a relationship, and the association is just due to low conscientiousness men not being in relationships.
Several other gender differences in the correlates of conscientiousness do not have a clear theoretical explanation. For example, the more conscientious a woman, the more she uses male references and third–person singular pronouns. Conscientious men use male references less but do not particularly change their use of third–person singular pronouns. Similarly, spending more time eating or drinking non–alcoholic beverages is more strongly associated conscientiousness among men than women, a finding that does not fit neatly into any particular theoretical narrative.
Several of the gender differences among the correlates with neuroticism can be explained by traditional gender role expectations. For example, spending more time being intoxicated signals greater neuroticism in men while spending more time talking about sadness indicates greater neuroticism in women. Taken together, the emerging evidence appears to suggest that gender differences (in both personality and behaviour) may ultimately play a relatively modest role in how personality plays out in daily life. Where they do exist, it is likely that differences are shaped by gender role expectations.
Do the behavioural manifestations of the Big Five personality traits differ by facet?
A strength of our study was the assessment of behavioural manifestations of personality at the facet level. Results suggest that not all facets of a Big Five personality domain showed comparable correlates of daily behaviour. Out of the 620 facet differences that we tested across the Big Five personality domains, 64 differences (or ∼10%) were statistically significant. The majority of these differences (34) occurred when comparing the two facets of extraversion, assertiveness and activity. This suggests that extraversion may be more complex in its behavioural implications, as compared with other personality traits, and future research should pay closer attention to facets. For example, assertiveness had an above–average correlation with expressing anger or frustration (r = .18), while activity had effectively no relationship with expressing anger or frustration (r = .01). It is also worth noting that most of the differences across facets were in linguistic style (59 of 64). This suggests that facet differences may be expressed subtly, in the way people talk or what they talk about, as opposed to more broadly in what people do. For example, people high in aesthetics—a facet of openness—tend to use more words associated with the body, biological process, and ingestion. This suggests that people higher in this aspect of openness may be more interested in talking about natural processes.
Limitations and future directions
While the current study effectively explores the behavioural manifestations of personality, it is limited in several ways. First, while our facet–level analyses highlight the importance of examining the behavioural manifestations of personality at a higher level of measurement fidelity, these analyses were limited in one critical way and therefore should be interpreted with some caution. Because the Big Five Inventory was designed to measure domains only (John et al., 2008), the two facets of each domain that were extracted from this measure after its development have an unequal number of items (Soto & John, 2009). The difference in the number of items between the two facets of a domain ranges from one to three items, with an average difference of approximately two items. As a result, the facet that has greater item overlap with its domain has a more similar pattern of behavioural manifestations as its domain compared with the facet that shares fewer items in common with its domain. For example, the self–discipline facet of conscientiousness (five items) has twice as many behavioural manifestations in common with its domain than the order facet of conscientiousness (two items) does. While we believe that our facet–level analyses are a good starting point for understanding how the behavioural manifestations of the Big Five domains differ by facet, future research that seeks to expand the knowledge base of facet–level differences should use a Big Five personality trait questionnaire that was specifically designed to measure both domains and facets, such as the NEO Personality Inventory–3 (NEO–PI–3; Costa & McCrae, 1992), the Big Five Aspect Scales (BFAS; DeYoung, Quilty, & Peterson, 2007), or the Big Five Inventory–2 (BFI–2; Soto & John, 2017).
Second, the current project was limited by its reliance on self–report measures. This self–report assessment of personality may underestimate the relationship between personality and behaviour. As done in a minority of other studies investigating the behavioural manifestations of personality (e.g. Fast & Funder, 2008), we recommend that researchers who want to replicate and build on the current study's findings should use informant reports from people who know the self well in combination with traditional self–reports of personality. Ideally, future work will use informant reports psychometrically to complement self–reports of behavioural manifestations of personality (Vazire & Mehl, 2008).
Next, our assessment of behaviour is limited to what can be (i) assessed from sampling ambient sounds (i.e. lack of visual information from photo or video Sherman, Rauthmann, Brown, Serfass, & Jones, 2015) and (ii) extracted via coding and text analysis from the raw ambient sounds (Kaplan et al., 2018). Future research should build on our analyses, which used LIWC to get at linguistic markers of the Big Five by employing more computationally advanced, bottom–up text analysis methods (n–grams and topic models) that can reveal subtle language patterns that escape dictionary–based approaches (Iliev, Dehghani, & Sagi, 2015; Schwartz et al., 2015).
Also, while the current project included participants from diverse samples, our sampling of daily behaviour was still constrained in three important ways. First, three out of the four samples we analysed monitored behaviour on the weekend only (constrained due to feasibility). Weekdays and weekends may differentially afford the expression of behaviour. On weekends, individuals tend to have more control over their daily schedules, which, theoretically, is conducive to identifying maximally strong personality–behaviour links (Beaty, Cleveland, & Murphy, 2001). However, contexts differentially afford the expression of personality, and weekdays and weekends differ systematically in this regard (e.g. work contexts may maximally afford the expression of conscientiousness). Future research should, ideally, sample for longer periods of time and balance weekday and weekend sampling.
Finally, we only assessed in–person social behaviour, interactions, and language use, and much of people's social life by now happens online. Future research should (continue) to study behavioural manifestations of such online behaviour, interactions, and language use, but, ideally, do so jointly with in–person behaviour. Studying both online and offline behaviour together is important for identifying processes underlying personality expression and the degree to which the online and offline world function psychologically in similar or different ways. Such work (i.e. monitoring individuals for longer periods of time and studying both online and offline behaviour together) will be facilitated by progress in the automatic assessment of (digital) social behaviour via mobile sensing methods (Harari et al., 2019; Stachl et al., 2017).
Conclusion
The late ecological personality psychologist, Kenneth Craik, insightfully wrote ‘lives are lived day by day, one day at a time, from day to day, day after day, day in day out … lives as we experience and observe them are inherently quotidian.’ (Craik, 2000, p. 234). This project adopted a quotidian perspective to investigate how personality looks (or, sounds) in its natural habitat. The project was unique in its scope, analysing a large archival database of real–world behavioural observation data, consisting together of tens of thousands of ambient sound clips from four independent studies collected over a dozen years, and their relation to Big Five personality traits. It (i) provides strong further evidence for some previously established (and now replicated) trait markers, (ii) casts empirical doubt on several trait markers that had emerged in the initial investigation (Mehl et al., 2006), and (iii) identifies a number of theoretically interesting new trait–behaviour links that warrant a closer look in future research.
Ultimately, perhaps the biggest value that this project brings to the scientific table is that it is situated critically at a methodological transition point in the study of personality in daily life. The project is a rich culminating product of the traditional smaller–scale, handmade personality studies of the early 2000s. At the same time, it can stand in comparison with the modern, technology–enhanced, big(ger)–data, mobile sensing personality studies and highlights their value and unique potentials (Harari et al., 2019; Montag & Elhai, 2019; Stachl et al., 2020). And, last but not least, as the need for replication is becoming clear and consensually accepted in the field (Zwaan, Etz, Lucas, & Donnellan, 2018), the project can also serve as a reminder to try to replicate not only easily reproduced research but also the more resource–intensive and challenging–to–conduct studies (Sassenberg & Ditrich, 2019), so that psychology will over time accrue a solid knowledge base of replicated facts of the broadest possible range of its science.
Supporting Information
Supporting Information, per2283-sup-0001 - ‘Personality in Its Natural Habitat’ Revisited: A Pooled, Multi–sample Examination of the Relationships Between the Big Five Personality Traits and Daily Behaviour and Language Use
Data S1
Supporting Information, per2283-sup-0001 for ‘Personality in Its Natural Habitat’ Revisited: A Pooled, Multi–sample Examination of the Relationships Between the Big Five Personality Traits and Daily Behaviour and Language Use by ALLISON M. TACKMAN, ERICA N. BARANSKI, ALEXANDER F. DANVERS, DAVID A. SBARRA, CHARLES L. RAISON, SUZANNE A. MOSELEY, ANGELINA J. POLSINELLI and MATTHIAS R. MEHL, in European Journal of Personality
Data S1
Supporting Information
Supporting Information, per2283-sup-0002 - ‘Personality in Its Natural Habitat’ Revisited: A Pooled, Multi–sample Examination of the Relationships Between the Big Five Personality Traits and Daily Behaviour and Language Use
Open Practices Disclosure Form
Supporting Information, per2283-sup-0002 for ‘Personality in Its Natural Habitat’ Revisited: A Pooled, Multi–sample Examination of the Relationships Between the Big Five Personality Traits and Daily Behaviour and Language Use by ALLISON M. TACKMAN, ERICA N. BARANSKI, ALEXANDER F. DANVERS, DAVID A. SBARRA, CHARLES L. RAISON, SUZANNE A. MOSELEY, ANGELINA J. POLSINELLI and MATTHIAS R. MEHL, in European Journal of Personality
Open Practices Disclosure Form
Footnotes
Supporting Information
Additional supporting information may be found online in the Supporting Information section at the end of the article.