
Abstract
This study examined sojourners’ long–term personality trait changes over five years, extending previous research on immediate sojourn effects. A sample of German students (N = 1095) was surveyed thrice (T1–T3) over the course of an academic year. Sojourners (n = 498) lived abroad shortly after T1 for one or two semesters; stayers (n = 597) remained in their home country. Five years after T1, we surveyed the same participants (n = 441, 40.3%) again (T4). Beyond substantial selection effects, latent neighbour–change models revealed that small differences between sojourners’ and stayers’ openness, agreeableness, and neuroticism changes occurred early after sojourn–induced contextual change. Model estimates suggested sustained sojourn effects on openness and neuroticism changes thereafter and a reversed effect on agreeableness change after return. Because of reduced power and low accuracy at T4, these estimates were not statistically significant. Based on model comparison analyses, however, we could rule out reversed effects for openness and accentuated effects for agreeableness and neuroticism as least likely. Moreover, separating short–term and long–term sojourners revealed no substantial differences, but recurring sojourn experiences tended to play a role in sustaining differences. We discuss implications for future studies on patterns of sojourn effects on personality trait changes. © 2020 The Authors. European Journal of Personality published by John Wiley & Sons Ltd on behalf of European Association of Personality Psychology
Keywords
Introduction
Student sojourns are one of the most frequent forms of international mobility within Europe (King & Ruiz–Gelices, 2003; Rivza & Teichler, 2007; Rodríguez González, Bustillo Mesanza, & Mariel, 2011). Recent research has revealed some small, but significant and consistent short–term and medium–term effects of sojourns on changes in students’ Big Five personality traits (Greischel, Noack, & Neyer, 2016; Niehoff, Petersdotter, & Freund, 2017; Zimmermann & Neyer, 2013). It is, however, an open question whether and to what extent such changes are long lasting. The present study attempts to provide answers, following students’ personality development for more than four years after an international sojourn.
Although personality traits are defined as relatively stable individual patterns of thinking, feeling, striving, and acting across time, situations, and contexts (Kandler, Zimmermann, & McAdams, 2014), they are susceptible to change (Bleidorn et al., 2020). Trait changes are expected to occur through enduring changes in affective, cognitive, and behavioural patterns (Roberts, Hill, & Davis, 2017; Wrzus & Roberts, 2017). Systematic normative personality maturation has consistently been found in terms of average increases in conscientiousness, agreeableness, and emotional stability in young and middle adulthood (e.g. Bleidorn, Kandler, Riemann, Spinath, & Angleitner, 2009; Roberts, Walton, & Viechtbauer, 2006). This pattern can partly be explained by biological maturation as (the) one normative driving force in young adults’ personality development (McCrae et al., 1999, 2000; Mõttus, 2017). Moreover, there is evidence that life events can shape individual differences in personality trait changes (Neyer & Lehnart, 2007; Neyer, Mund, Zimmermann, & Wrzus, 2014), although effects are often small and inconsistent across both traits and studies (Bleidorn, Hopwood, & Lucas, 2018; Specht, Egloff, & Schmukle, 2011). To date, research has not yet provided conclusive answers regarding the robustness and long–term sustainability of trait changes in response to life events (Bleidorn et al., 2020), and, in particular, student sojourns. It is thus an open question how sojourners’ personality traits develop in comparison with non–sojourners’ traits several years after their participation in international student mobility.
Long–term patterns of personality trait changes, and their underlying mechanisms can only be observed when people are surveyed repeatedly using multiple assessment points over several years (Luhmann, Orth, Specht, Kandler, & Lucas, 2014). Using data from the longitudinal study ‘PEDES—Personality Development of Sojourners’ (Zimmermann & Neyer, 2013), we assessed sojourners’ Big Five personality traits at four measurement occasions over five years, beginning before the start of their sojourn, and collected from 2009 to 2015.
Student sojourns and personality trait changes in young adulthood
In the present research, we focused on temporary international mobility experiences of students who were enrolled at German higher education institutions and moved abroad for a limited period of time, for example to complete some of their degree courses at a foreign university. Although this kind of international mobility has become generally important in the lives of students in industrialized societies (King & Ruiz–Gelices, 2003; Krings, Bangerter, Gomez, & Grob, 2008; Rivza & Teichler, 2007), individuals differ in terms of their international mobility engagement (e.g. Salisbury, Umbach, Paulsen, & Pascarella, 2009). The active seeking of individual environments according to one's individual characteristics—as it is the case with student sojourns—is a well–known phenomenon, mostly referred to as selection (e.g. Denissen, Ulferts, Lüdtke, Muck, & Gerstorf, 2014; George, Helson, & John, 2011; Lüdtke, Roberts, Trautwein, & Nagy, 2011; Specht et al., 2014). Indeed, individual personality characteristics can act to increase the probability of perceiving or experiencing certain kinds of life events (Headey & Wearing, 1989; Kandler, Bleidorn, Riemann, Angleitner, & Spinath, 2012). In addition, these individual characteristics themselves are susceptible to changes in response to life experiences (Denissen et al., 2014; Kandler & Ostendorf, 2016; Lüdtke et al., 2011; Luhmann, Hofmann, Eid, & Lucas, 2012; Neyer & Lehnart, 2007; Specht et al., 2014), even within a short period of time (Roberts et al., 2017). This effect is known as socialization.
Zimmermann and Neyer (2013) were among the first who studied socialization effects of an international sojourn experience on personality trait changes in German university students. They reported effects of student sojourns of at least 20 weeks, as evidenced by differences between sojourners and control students regarding openness, agreeableness, and emotional stability changes. Greischel et al. (2016) found comparable socialization effects of a high–school sojourn in a German sample of adolescents. Besides, Niehoff et al. (2017) reported positive effects of a college sojourn on extraversion, agreeableness, and emotional stability changes. To conclude, the overall pattern of sojourn effects on personality trait changes suggests that international sojourns contain life experiences that promote personality maturation in young adulthood (see also Bleidorn et al., 2013; Roberts, Wood, & Smith, 2005).
Long–term personality trait changes of sojourners
All previous studies reported personality trait changes in the context of sojourns across short or intermediate time intervals (Greischel et al., 2016; Niehoff et al., 2017; Zimmermann & Neyer, 2013). Thus, the question arises as to how sojourners develop in the long run compared with their fellow students. Put differently, we ask whether and to what extent we can observe persistent differences between the trait change trajectories of sojourners and their peers who never went abroad (i.e. stayers). Using a longitudinal (nonrandom) control group design, we investigated three possible patterns, that is reversed, accentuated, or sustained sojourn effects.
According to a dynamic equilibrium (or classic set–point) model, changes in individual characteristics are time limited and reflect fluctuating experiences (Headey & Wearing, 1989; Lykken & Tellegen, 1996). From this perspective, personality trait change differences between sojourners and stayers are expected to reverse after return from the stay abroad in the long run (reversed effect). Let us assume that Tina is a German student that had gone abroad for one semester. During her sojourn, she made multiple new experiences, for example, regarding food choices, habits, and ways of life. Moreover, she engaged with people from several countries with different backgrounds than her own. These daily experiences resulted in changes in Tina's daily behaviour. For example, Tina found herself with a lot of new behaviours and ideas because of activities with friends from other cultural backgrounds. At the same time, her friends from home who did not study abroad did not make such new experiences. Over time, these environmental state differences between Tina and her friends solidified and thus promoted trait change differences in openness between them (see Roberts, 2018; Roberts & Jackson, 2008). After Tina has left her host country and returned to her home context, the experiential differences between Tina and her friends at home diminish. In case that openness normatively decreases (or increases), Tina's openness decreases more steeply (or increases less steeply) than her friends', leading to decreased mean–level differences between them after her return as compared with the previous measurement occasion(s) (see Figure 1). One reason for a reversed effect might be that Tina picks up old habits and behaviours, and adapts again to her home's norms (Denissen, van Aken, Penke, & Wood, 2013). 1
Figure 1 suggests that stayers do not show any trait changes. In fact, this is highly unlikely (Graham et al., 2020). In addition, we want to stress that a reversed effect does not necessarily imply the same mean levels in sojourners at the start and at the end of the study. Rather, it means that developmental trends turn back, leading to decreasing differences between sojourners and stayers after return.
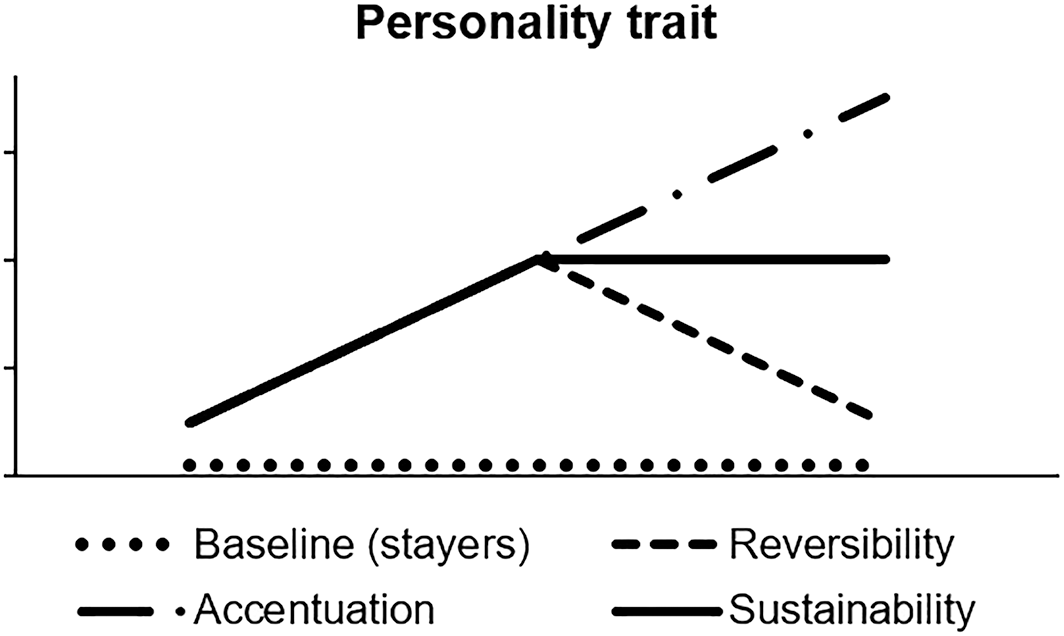
Examples of long–term trait change patterns as a result of sojourn experiences in comparison to stayers’ baseline changes.
In contrast to reversing differences, we could also observe accentuating differences between sojourners and stayers in the long run (see also Jackson, Thoemmes, Jonkmann, Lüdtke, & Trautwein, 2012), possibly because of mutual reinforcement between corresponsive trait levels and life experiences (Jeronimus, Riese, Sanderman, & Ormel, 2014; Le, Donnellan, & Conger, 2014; Roberts, Caspi, & Moffitt, 2003). For example, it has recently been shown that previous sojourns can predict future sojourns (Netz & Jaksztat, 2014; Niehoff et al., 2017). This is an example of cumulative differences in terms of recurring life events that may eventually act to accentuate differences between sojourners and stayers (accentuated effect). Let us imagine that Tina comes back home. Although she had looked forward to meeting all her friends, she also misses the experiences she made in a different country and decides to go abroad again. Meeting new people and making new experiences again reinforce her new habits and behaviours. She feels good this way and decides to go abroad for longer time periods on a regular basis now. While her friends at home decrease in openness slowly but incrementally (see, e.g. McCrae et al., 1999), Tina's openness may not decrease or even increases, leading to accentuated differences between her and her friends’ openness over time (see Figure 1).
From a third perspective, meaningful experiences because of sojourns could result in stable trait differences between sojourners and stayers, being evident across years (sustained effect). One explanation for such a pattern might be that sojourners adopt new reference values during their stay abroad, which they still hold some years later (Denissen et al., 2013). Tina would, for example return home a bit more open to new experiences compared with before with an enhanced difference to her friends at home. After her return, she might show the same developmental trends as her friends (e.g. the magnitude of their openness decreases does not differ), but her openness persists at a comparably higher trait level (compare Figure 1).
The Present Study
With the PEDES study design, we compared sojourners’ trait changes across a period of five years to fellow students of the same cohort who had not lived abroad. We examined three time points around a sojourn: T1 (directly before the start of the sojourn), T2 (approximately six months after sojourn start), and T3 (approximately nine months after sojourn start). Furthermore, unlike other studies, we conducted a follow–up measurement occasion about five years after sojourn start (T4). This fourth measurement occasion extended previous studies of short–term sojourn effects on personality trait changes and enabled us to examine the long–term effects of sojourn experiences.
Change in an individual's social and cultural environment for several months—as during a sojourn—could come along with any of the three plausible scenarios discussed in the preceding section. We are not aware of any study that has examined long–term trait changes of sojourners. Thus, we had no a–priori hypotheses. The study was not preregistered. By analysing the five–year latent trait changes of students with and without sojourn experiences, we explored which of the long–term sojourn effects (reversed, accentuated, or sustained) were and were not supported by the data. Sojourners and stayers of the same sample had already been found to differ in their short–term personality trait changes (Zimmermann & Neyer, 2013). To control for these effects, we included the previous measurement intervals (T1–T3) in our analysis models.
Method
Participants and procedure
Data come from the PEDES longitudinal study (for further details regarding recruitment methods and selection criteria see Zimmermann and Neyer, 2013). Data to this study can be drawn from the open science framework (https://osf.io/pmy57/). 2 The current investigation went beyond the previous study by adding a follow–up measurement occasion (T4) about five years after the first measurement took place. All measurements were carried out using online questionnaires. During the first study period, a sample of N = 1134 German university students were repeatedly tracked over the course of the academic year 2009/2010 (T1, T2, and T3). Data were collected two weeks before (T1), six months after (T2; time range: four to eight months), and nine months after (T3; time range: 6–13 months) sojourners’ individual dates of departure. Control students who did not live abroad during that time completed the same questionnaires at comparable time points during the academic year 2009/2010.
We intend to provide open access to all data of the PEDES project once all planned project publications have been completed.
To compare the long–term personality trait changes of control students (here, stayers) and sojourners, participants were again surveyed about five years after T1. The T4 measurements were taken between December 2014 and March 2015. The primary interest of the present study was to compare participants’ trait changes during the follow–up period of about 4 years (T3–T4). To capture sojourn effects on personality trait changes in the long run under the control of earlier effects, we included initial trait levels at T1 and participants’ trait changes across T1, T2, and T3 in the present analyses.
From the initial sample (N = 1134), we excluded n = 39 participants who had reported their main place of residence at T4 outside of Germany. From the resulting total sample of n = 1095 students, n = 498 were sojourners who went abroad shortly after the start of the study at T1. The vast majority of the sojourners,84.9%, moved to a European country (n = 423), 6.0% (n = 30) to Asia, 5.4% (n = 27) to the USA or to Canada, 0.6% (n = 3) to South America, and 0.2% (n = 1) to Australia. Moreover, 1.4% (n = 7) participants went to Turkey and 0.8% (n = 4) to Russia. Three participants did not provide an answer to this question. We defined sojourners that had spent 20–32 weeks during the academic year 2009/2010 in their host countries as short–term sojourners (n = 218) and those who spent more than 32 weeks as long–term sojourners (n = 280). Stayers were students that did not live abroad before or during the academic year 2009/2010 (n = 597). Mean age at survey start was 22.59 years (SD = 2.60, age range: 18–41 years), and 78.0% of the participants were female (n = 854).
Drop–out
At T3, n = 1059 (96.7%) of our sample agreed to be contacted again in the future for a possible follow–up. At T4, however, only n = 441 participants (40.3% of the original sample) provided information on their Big Five traits. As we had not communicated concrete plans for a follow–up study, we assume that most participants saw their contribution as completed after T3. Moreover, during the four–year time interval between T3 and T4, we did not implement any measures of panel maintenance. Against this background and compared with other panel studies, a retention rate of 40.3% can be seen as acceptable. To test whether drop–out patterns were completely at random across the five–year time span, especially between T3 and T4, and for each variable investigated, we computed Missing–Completely–at–Random test statistics. Little's Missing–Completely–at–Random test indicated no association between sojourn status, age, sex, or trait level at any time point between T1 and T3, and later drop–out, χ2(16) = 9.219, p = .904. Of all participants at T4, n = 372 had graduated in the meantime. N = 33 participants indicated that they were studying in an undergraduate degree programme and n = 67 participants in a postgraduate course. N = 235 participants indicated that they were employed in a regular job (no apprenticeship). Other possible options were, for example, self–employment, teacher training, and parental leave. 3
Please note that multiple references were possible. Here, we do not provide information on the full range of answering options. Please refer to the codebook for further information (https://osf.io/pmy57/).
Measures
Personality trait measures
We applied the German version of the Big Five Inventory (Lang, Lüdtke, & Asendorpf, 2001) at all four measurement occasions. Participants answered the 42 items on a five–point Likert scale ranging from 1 (strongly disagree) to 5 (strongly agree). Internal consistency coefficients of the personality trait measures can be found in Table 1. Moreover, Table 1 contains zero–order correlations of all Big Five personality traits, including rank–order stabilities for the total sample and subsamples. Rank–order stabilities across measurement occasions were high for all traits. Table 2 shows means and standard deviations for each measurement occasion and effect sizes of manifest mean–level differences in repeated measures for both the full sample and subgroups, standardized on the standard deviation of the respective first measurement time point.
Zero–order correlations and internal consistency coefficients of all Big Five trait measures in the Total sample and in the respective groups
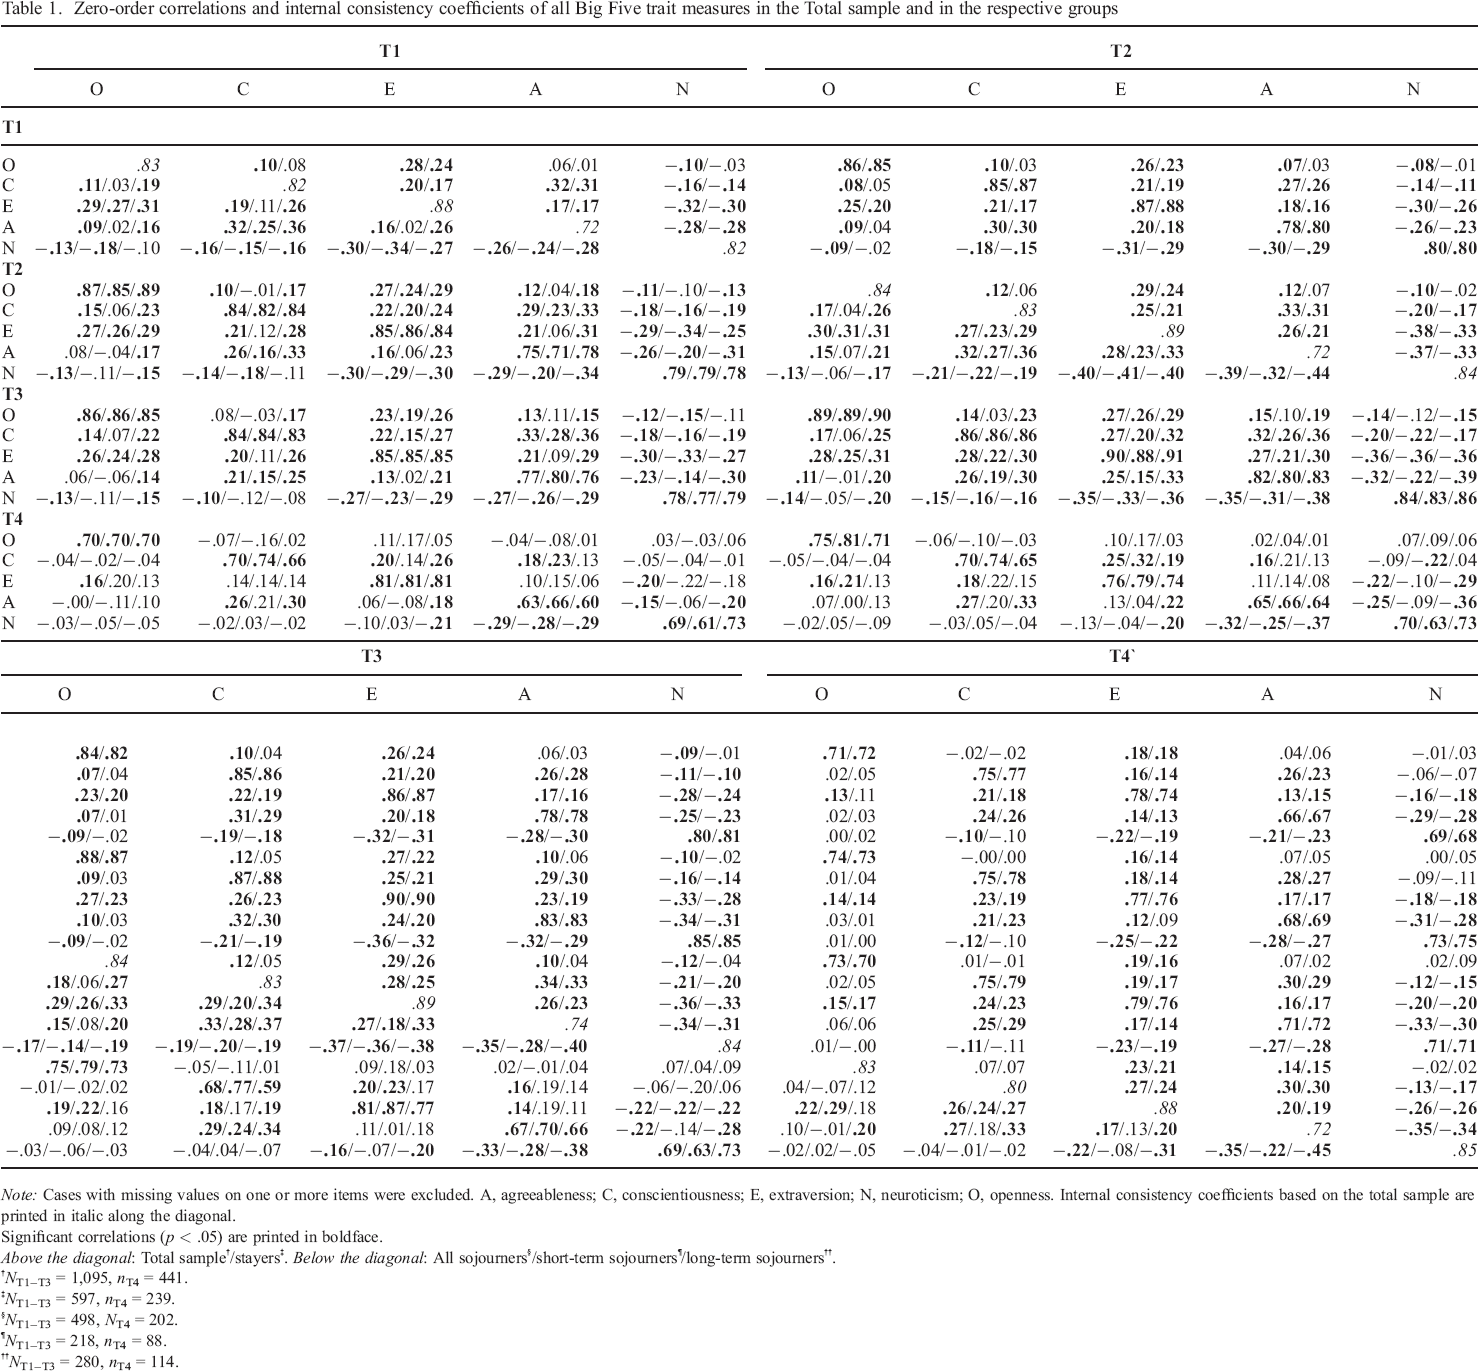
Note: Cases with missing values on one or more items were excluded. A, agreeableness; C, conscientiousness; E, extraversion; N, neuroticism; O, openness. Internal consistency coefficients based on the total sample are printed in italic along the diagonal.
Significant correlations (p < .05) are printed in boldface.
Above the diagonal: Total sample†/stayers‡. Below the diagonal: All sojourners§/short–term sojourners¶/long–term sojourners††.
NT1–T3 = 1,095, nT4 = 441.
NT1–T3 = 597, nT4 = 239.
NT1–T3 = 498, NT4 = 202.
NT1–T3 = 218, nT4 = 88.
NT1–T3 = 280, nT4 = 114.
Group–based descriptive statistics
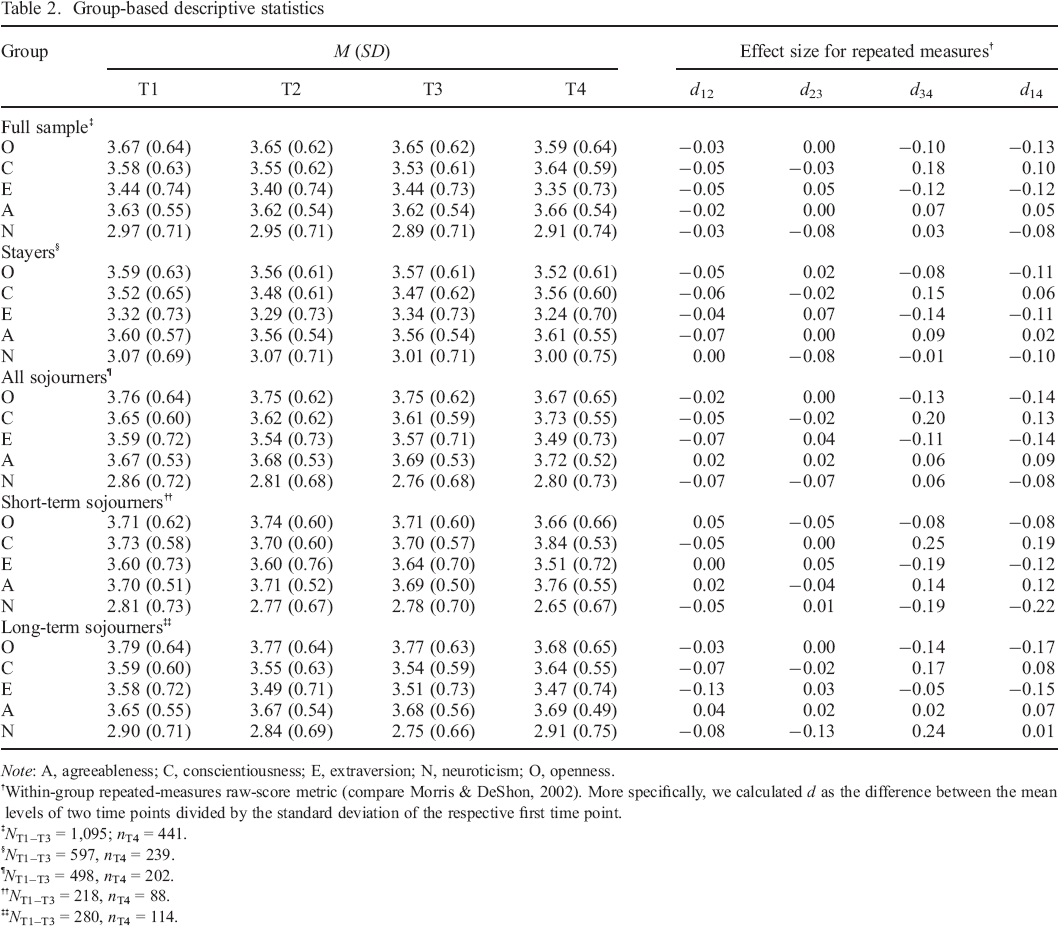
Note: A, agreeableness; C, conscientiousness; E, extraversion; N, neuroticism; O, openness.
Within–group repeated–measures raw–score metric (compare Morris & DeShon, 2002). More specifically, we calculated d as the difference between the mean levels of two time points divided by the standard deviation of the respective first time point.
NT1–T3 = 1,095; nT4 = 441.
NT1–T3 = 597, nT4 = 239.
NT1–T3 = 498, nT4 = 202.
NT1–T3 = 218, nT4 = 88.
NT1–T3 = 280, nT4 = 114.
Sojourn status
For the analyses, two different kinds of status definitions were used. First, in the main (two–group) analyses, we differentiated between participants without any sojourn experiences before or during the academic year 2009/2010 (stayers) and participants with sojourn experiences during the academic year 2009/2010 (sojourners). Based on this information, we constructed the dummy variable sojourn T1, which was coded 0 (no sojourn) and 1 (sojourn). At T2 and T3, sojourners were asked about their current country of residence (in Germany or abroad). This allowed us to additionally explore differences in sojourn effects depending upon sojourn duration. Short–term sojourners (one semester abroad) had already returned to Germany by T3, while long–term sojourners (at least two semesters abroad) still lived in their host country at T3. In the more extensive (three–group) analyses, we thus used two dummy variables to differentiate between these sojourn groups. The first variable, called short–term sojourn, was coded 0 (no short–term sojourn) and 1 (short–term sojourn). It is important to note that coding 0 included all participants that had not done a short–term sojourn, that is stayers and long–term sojourners. The second variable was called long–term sojourn and was coded 0 (no long–term sojourn) and 1 (long–term sojourn). All participants who had not done a long–term sojourn, that is stayers and short–term sojourners, were coded 0 in this variable.
Covariates
To control for possible confounding effects, we included age, sex, and the number of sojourns between T3 and T4 as covariates in the analyses. Sex was coded 0 (male) and 1 (female). To yield information about additional sojourn experiences after the end of the first study period in 2009/2010, we asked participants at T4 how often they had lived abroad for more than two months since T3. Of n = 443 participants who answered this question, n = 101 participants indicated that they had lived abroad at least once, while n = 342 indicated that they have never lived abroad since T3 (M = 0.32, SD = .71, range: 0–6). Only n = 29 of the former stayers went abroad between T3 and T4 (novice sojourners).
Analytical strategy
We examined our research questions using multiple approaches. We will shortly summarize them here, before explaining the methodological features of our main analyses. Preliminary latent trait change analyses only included time points T1 and T4. We then investigated sojourners’ and stayers’ latent trait changes more deeply by also including T2 and T3 in latent neighbour–change models. For both approaches, were carried out univariate as well as multivariate analyses. Although we examined results based on listwise deletion and full information maximum likelihood (FIML) to handle missing data, we will mostly refer to the analyses based on FIML. To compare short–term and long–term sojourns regarding their effects, we additionally run analyses separating sojourners according to the duration of their stay.
In the following sections, we describe the latent neighbour–change modelling approach in more detail. We first reflect on the latent variable and latent change modelling, followed by the characteristics of the multivariate approach. One part of this section is dedicated to describing the estimation of sojourn effects. All input and output files are available via the open science framework (https://osf.io/pmy57/). Both the main and additional analyses were carried out using Mplus version 8 (Muthén & Muthén, 1998–2017).
Latent variable modelling
We modelled individual personality trait levels as latent variables to control for measurement error (Steyer, Mayer, Geiser, & Cole, 2015). To that end, we adopted the same method as Zimmermann and Neyer (2013): Items were assigned to respectively two parcels per personality trait on the basis of the item–to–construct method (Little, Cunningham, Shahar, & Widaman, 2002). The goal of this method is to receive balanced parcels in terms of factor loadings. Internal consistency coefficients of the parcels can be found in Table S1. For the latent analyses, all latent factor indicators (i.e. parcels) were standardized.
Latent change modelling
We captured personality trait changes within a five–year time span using latent change models (McArdle & Hamagami, 2002; Steyer, Eid, & Schwenkmezger, 1997). For a preliminary check of the sustainability of sojourn effects, we analysed personality trait changes across T1–T4 only. Thereafter, we analysed all four time points using latent neighbour–change models to capture (discontinuous) change during each time interval (i.e. from T1 to T2, from T2 to T3, and from T3 to T4; Steyer, Partchev, & Shanahan, 2000). In latent neighbour–change models, latent trait change reflects the difference between latent trait levels at two neighbouring measurement occasions controlling for measurement error (Steyer et al., 1997; Steyer et al., 2000). To interpret latent variable change as trait change, the latent variables must have the same meaning across time points (Muthén & Muthén, 1998–2017). Therefore, we implemented strict measurement invariance across measurement occasions by equating the latent variable structure, parcel loadings, intercepts, and residual variances of the same parcels per trait across time (Marcusson–Clavertz & Kjell, 2018). 4
Residual variances do not need to be equal across time points to interpret the meaning of their underlying latent variables (van de Schoot, Lugtig, & Hox, 2012). Formal model comparisons yielded significantly worse model fits of the more restrictive models with equated residuals in comparison to the less restrictive models in some cases. Still, we decided to equate residual variances across time for all models. We did this as the more restrictive models with strict measurement invariance also revealed good overall model fits that were comparable to those of the less restrictive models with scalar measurement invariance (see supplementary Table S2). Results were robust across both variants of measurement invariance. Input and output files of all analyses can be drawn from https://osf.io/pmy57/.
We established an indicator–specific factor for the second parcel in all models to account for common variance in the manifest variables across time that was not captured by the latent variables (see Geiser & Lockhart, 2012, for a comparison of this approach to other procedures). Loadings of the respective parcels on the indicator–specific factor were modelled to be time invariant. This factor was not allowed to correlate with the latent trait factors of the same construct (Reuter et al., 2010). Latent change variables of the same trait across different time intervals were allowed to correlate with each other as change within one trait across a specific time interval was much likely not independent from changes within the same trait across other time intervals. That is, trait change in openness between T1 and T2 was allowed to correlate with T2–T3 and T3–T4 trait changes in openness, and trait change in openness between T2 and T3 was allowed to correlate with T3–T4 trait change in openness. Figure 2 provides a conceptual overview of how we assessed the effects of a sojourn during the academic year 2009/2010 on trait changes between T1 and T2, T2 and T3, and between T3 and T4.
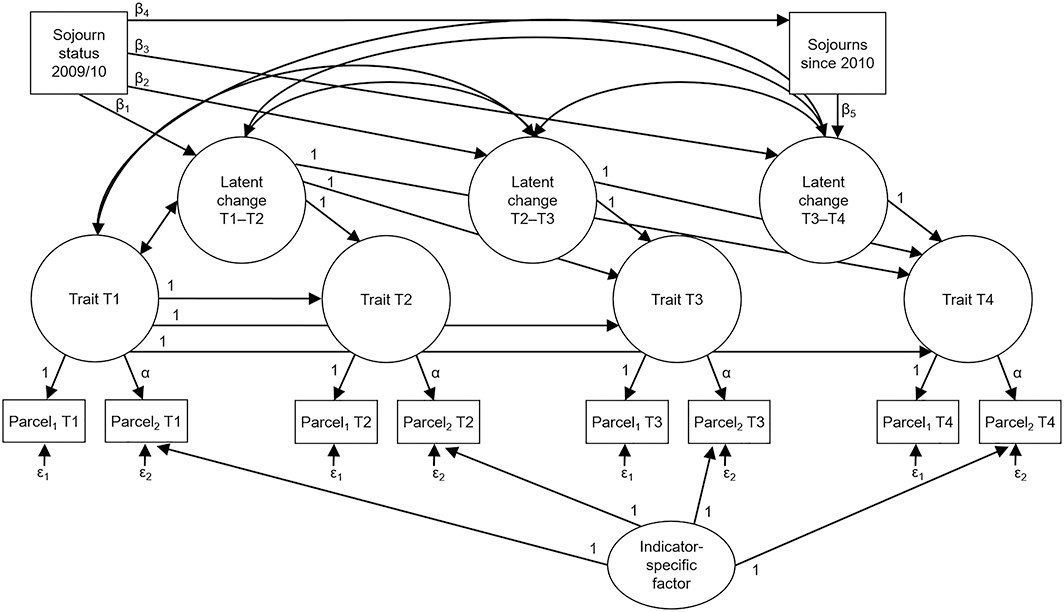
Conceptual model of sojourn effects on trait changes across T1–T2, T2–T3, and T3–T4. For reasons of parsimony, we only printed an exemplary univariate latent neighbour–change model, although we also imputed multivariate latent neighbour–change models. We controlled for age, sex, and sojourns since T3 as possible confounds. A time–invariant indicator–specific method factor was constructed per trait to account for trait–independent variance that was related to the parcels. Residuals were equated across time.
Multivariate trait change modelling
Although Figure 2 provides an exemplary model for only one trait, we also included all Big Five traits in multivariate models to compare univariate and multivariate findings. In line with the analytical strategy used by Zimmermann and Neyer (2013), we allowed correlations between trait levels at T1 across all traits to account for the fact that operationalizations of personality traits are empirically not perfectly independent of each other (e.g. Lang et al., 2001). In addition, all trait levels at T1 were allowed to correlate with T1–T2, T2–T3, and T3–T4 trait change variables. While latent change variables across different traits were also allowed to correlate with each other within the same time interval, we did not allow cross–trait cross–interval correlations for the sake of parsimony. Finally, the residual factors were not allowed to correlate with each other, but we did not constrain their correlations with trait factors of other constructs (Reuter et al., 2010). 5
Allowing the method factors to correlate with each other did not alter the pattern of results.
Sojourn effects modelling
By including sojourn effects on earlier trait changes (within T1–T2 and T2–T3 intervals), the model tested the effects of a sojourn during the academic year 2009/2010 on trait changes between T3 and T4 after controlling for prior effects on T1–T2 and T2–T3 changes (see Figure 2). With this approach, it was also possible to explore the timing of sojourn effects. Specifically, we extended the previous analyses reported by Zimmermann and Neyer (2013) by investigating whether early change (ΔT1–T2 > ΔT2–T3), continuous change (ΔT1–T2 = ΔT2–T3), or late change (ΔT1–T2 < ΔT2–T3) occurred.
Differentiating between sojourn groups
Besides testing the effect of a sojourn in itself in the first set of analyses (two–group analyses), we also compared the effects of short–term and long–term sojourns regarding the magnitude of change and the timing of their effects in additional three–group analyses. For example, it has been shown that adaptation processes during a sojourn are dependent on the time spent abroad (see Ward, Okura, Kennedy, & Kojima, 1998). Moreover, the transition back home might itself have an effect on trait changes (compare Christofi & Thompson, 2007), which can also depend on sojourn duration (Tamura & Furnham, 1993). At T3, short–term sojourners had already returned to their home country, whereas long–term sojourners had not. This resulted in a different meaning of the sojourn status variables on T2–T3 trait changes for short–term and long–term sojourners: the transition back home and prolonged sojourn, respectively. To consider these group differences, we regressed the latent trait change variables on two dummy–coded sojourn variables: short–term sojourn and long–term sojourn. All input and output files of these three–group (stayers, short term sojourners, and long–term sojourners) analyses are available via the open science framework (https://osf.io/pmy57/).
Covariates
As covariates, we included sex, age, and the number of sojourns since T3. We regressed all trait–change variables on age and sex. T3–T4 trait change was also regressed on the number of sojourns between T3 and T4. This analysis tests the effect of the 2009/2010 sojourn on later trait change between T3 and T4 while controlling for the effect of having lived abroad since T3. In addition, we regressed the number of sojourns since T3 on sojourn status at T1 to account for potential associations between previous sojourns during the academic year 2009/2010 on further sojourn experiences during the T3–T4 interval.
Analytical criteria
We evaluated the absolute goodness of model fit using the root mean square error of approximation (RMSEA ), comparative fit index (CFI), and standardized root mean square residual (SRMR). RMSEA portrays the average proportion of misfit per degree of freedom; CFI is an indicator for the relative noncentrality between a hypothesized model and the null model of the modified independency, and SRMR refers to the squared root of the average squared residuals. While for CFI, a higher value indicates a better fit; the contrary is true for RMSEA and SRMR. Hu and Bentler (1999) have described the criteria for a good model fit with RMSEA ≤ .06, CFI ≥ .95, and SRMR ≤ .08.
Parameter estimations were based on a maximum likelihood procedure with robust estimation of standard errors. The latent change models were fitted using the FIML method, which is a model–based approach to handle missing data (Schafer & Graham, 2002). In comparison with other missing data handling procedures, it allows for more precise parameter estimation and retains statistical power because no observations are deleted (Enders, 2011). To scrutinize the robustness of our findings from the latent trait–change models, we also analysed descriptive mean–level trends and carried out model comparisons based on Bayesian information criteria.
Results
Manifest mean–level trends
Figure 3 illustrates descriptive mean–level trends and standard errors per measurement occasion based on the raw means of personality trait variables for stayers and sojourners (i.e. the unweighted sample of short–term and long–term sojourners; see also Table 2). The figure indicated initial selection effects for all traits. Compared with stayers, sojourners tended to show higher levels in openness, conscientiousness, extraversion, agreeableness, and emotional stability (vs. neuroticism). Moreover, these differences tended to be constant across all four measurement occasions. See also Figure S1, which contains raw means and standard errors of stayers, short–term sojourners, and long–term sojourners per measurement occasion separately.
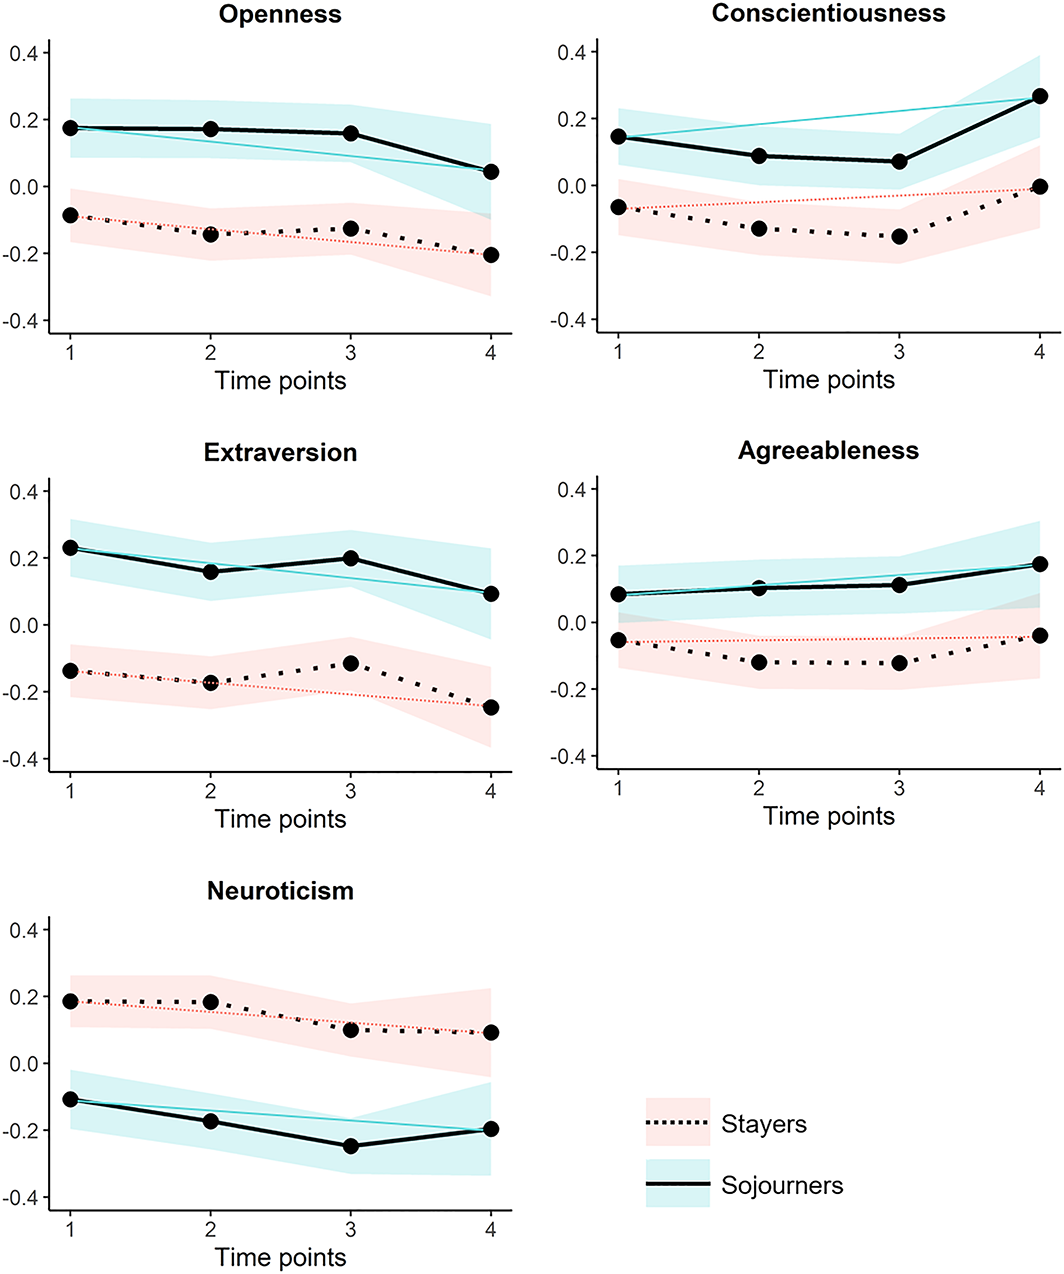
Descriptive mean–level differences of stayers and sojourners based on raw means of manifest personality trait scores. We plotted the raw means standardized around the grand mean of each trait to make the figures more comparable. Estimates include group–based 95% confidence intervals to illustrate measurement inaccuracy. We included a linear trend line between T1 and T4 in each groups’ respective colour theme to make general linear change trends for the whole study period more easily comparable across groups. Please note that trends appear much steeper for the T3–T4 interval than they were based on the data. This is because of the fact that all time spans are printed as equally broad, although the last time span comprised several years, being much broader than the other time intervals spanning less than half a year. [Colour figure can be viewed at wileyonlinelibrary.com]
Figures 3 and S1 also show that if there were significant sojourn effects with increased differences between sojourners and stayers during a sojourn (T1–T2 for short–term sojourners and T1–T3 for long–term sojourners), these effects must have been very small and mostly diminished until T4 as indicated by rather parallel linear trends. However, manifest personality trait score trajectories were confounded with measurement error and potentially biased because of unconsidered intertrait correlations and covariates (age, sex, and repeated sojourns). This could lead to reduced accuracy of measurements and obscure or bias sojourn effects. Therefore, we ran univariate and multivariate latent neighbour–change models controlling for potential biases. Please refer to Figure S2 for time–specific boxplots of the three groups based on listwise deletion.
Latent trait–change analyses
Throughout the next sections, we will present findings based on different analysis approaches. More specifically, we decided to provide preliminary analyses for the T1–T4 interval, followed by more detailed analyses across all measurement occasions. For all analyses, we present both univariate and multivariate results. Within the manuscript, we mostly refer to results based on FIML to handle missing data. Results based on listwise deletion are presented in the Supporting information at the open science framework ( https://osf.io/pmy57/). Please note that all reported coefficients represent probabilistic point estimates and can thus slightly vary across approaches.
Analyses across T1–T4
For preliminarily testing possible long–term sojourn effects, we ran univariate and multivariate latent trait–change model analyses across T1 and T4 only. Both the univariate latent model and the multivariate latent model showed good fits to the data (see Table S2). While the univariate analyses yielded no meaningful sojourn effect across these two time points, the multivariate analysis suggested a long–term effect on openness change (see Table 3). This divergence is much likely attributable to low accuracy of the parameter estimates as indicated by broad 95% confidence intervals (CIs; Kelley & Rausch, 2006). Although 95% CIs were largely overlapping, only the one based on the multivariate analysis did not include zero: bunivariate = .11 (95% CI [−.02, .25]), p = .103, vs. bmultivariate = .15 (95% CI [.01, .29]), p = .031. Running the analyses with listwise deletion yielded the same pattern of results (see Table S3).
Sojourn effects on trait changes as derived from the latent–change analyses across T1–T4 only
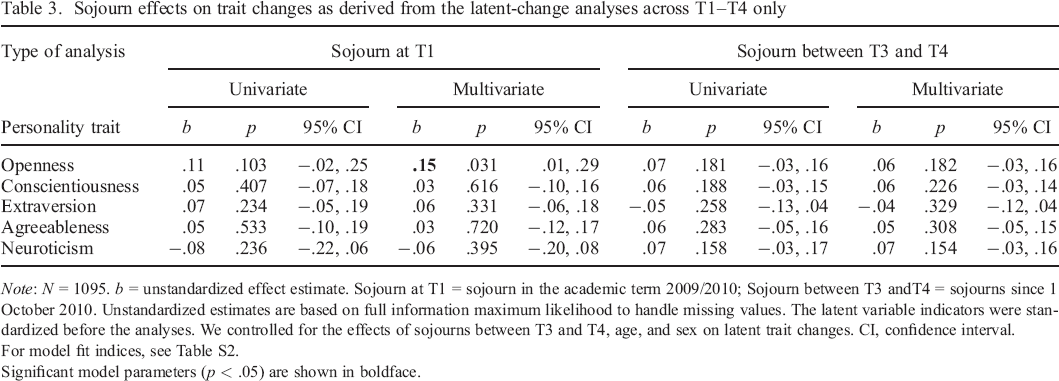
Note: N = 1095. b = unstandardized effect estimate. Sojourn at T1 = sojourn in the academic term 2009/2010; Sojourn between T3 andT4 = sojourns since 1 October 2010. Unstandardized estimates are based on full information maximum likelihood to handle missing values. The latent variable indicators were standardized before the analyses. We controlled for the effects of sojourns between T3 and T4, age, and sex on latent trait changes. CI, confidence interval.
For model fit indices, see Table S2.
Significant model parameters (p < .05) are shown in boldface.
These initial analyses gave rise to the conclusion that there were no meaningful (lasting) sojourn effects on most if not all traits, except a small signal for openness. While these preliminary analyses provided a first overall impression on potentially missing or, if at all, marginal long–term effects of sojourns, it is also clear that only multiple time points with closer time intervals allow to disentangle the timing, magnitude, and trajectories at different stages during and after a sojourn in comparison with no sojourn (compare arguments by Luhmann et al., 2014, on the need of multiple time points when studying personality changes).
Analyses across T1–T2–T3–T4
All latent neighbour–change models across four time points fit well to the data (see Table S2). First, we report results on sojourn effects during and directly after a sojourn (i.e. T1–T2 and T2–T3). We then focus on effects between T3 and T4. Further sections are specifically dedicated to the role of age and sex differences as well as additional sojourns between T3 and T4.
Sojourn effects between T1 and T2
Zimmermann and Neyer (2013) have previously reported overall effects of sojourning, with different trends in openness, agreeableness, and neuroticism among sojourners compared with stayers. The present analyses based on FIML largely corroborated this pattern. More specifically, in the univariate and multivariate analyses, we found small positive sojourn effects on openness and agreeableness changes, and a negative sojourn effect on neuroticism change (see Table 4 for unstandardized sojourn effects). When running the same analyses with listwise deletion, four of the six small effects disappeared. That is, only the sojourn effect on openness change in the multivariate approach, and the effect on neuroticism change in the univariate approach still reached statistical significance (see Table S4). As point estimates were quite comparable across FIML and listwise deletion, this divergence in statistical significance was most likely because of the lower statistical power of the smaller listwise–deletion sample. Accordingly, the CIs revealed higher accuracy in the FIML–based analyses.
Sojourn effects on trait changes as derived from the latent–change analyses across four time points
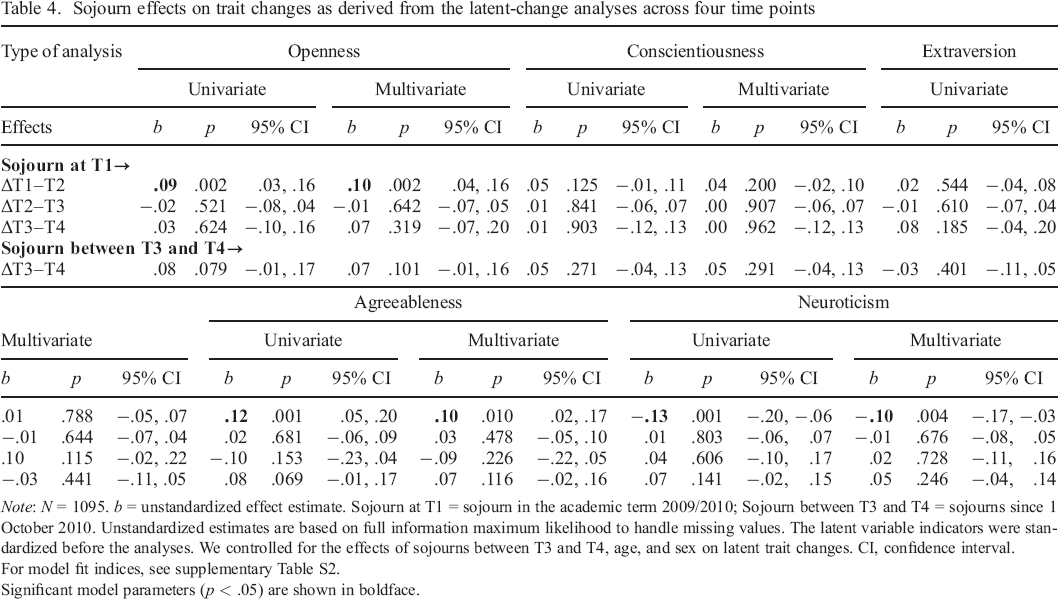
Note: N = 1095. b = unstandardized effect estimate. Sojourn at T1 = sojourn in the academic term 2009/2010; Sojourn between T3 and T4 = sojourns since 1 October 2010. Unstandardized estimates are based on full information maximum likelihood to handle missing values. The latent variable indicators were standardized before the analyses. We controlled for the effects of sojourns between T3 and T4, age, and sex on latent trait changes. CI, confidence interval.
For model fit indices, see supplementary Table S2.
Significant model parameters (p < .05) are shown in boldface.
Figure 4 is based on the latent modelling results of the univariate and multivariate analyses. It suggests an increase in sojourners’ and a decrease or no change in stayers’ openness as well as an increase in sojourners’ and a decrease in stayers’ agreeableness across T1–T2. Like Figure 3, it shows that accelerated neuroticism decrease in sojourners, with no substantial change in stayers. Please note that Figures 3 and 4 are not directly comparable. While Figure 3 pictures the standardized mean levels based on the raw data, the trends in Figure 4 are based on the latent variable estimates controlled for measurement error and multiple covariates. In other words, Figure 4 shows hypothetical trends for an average sojourner and stayer.
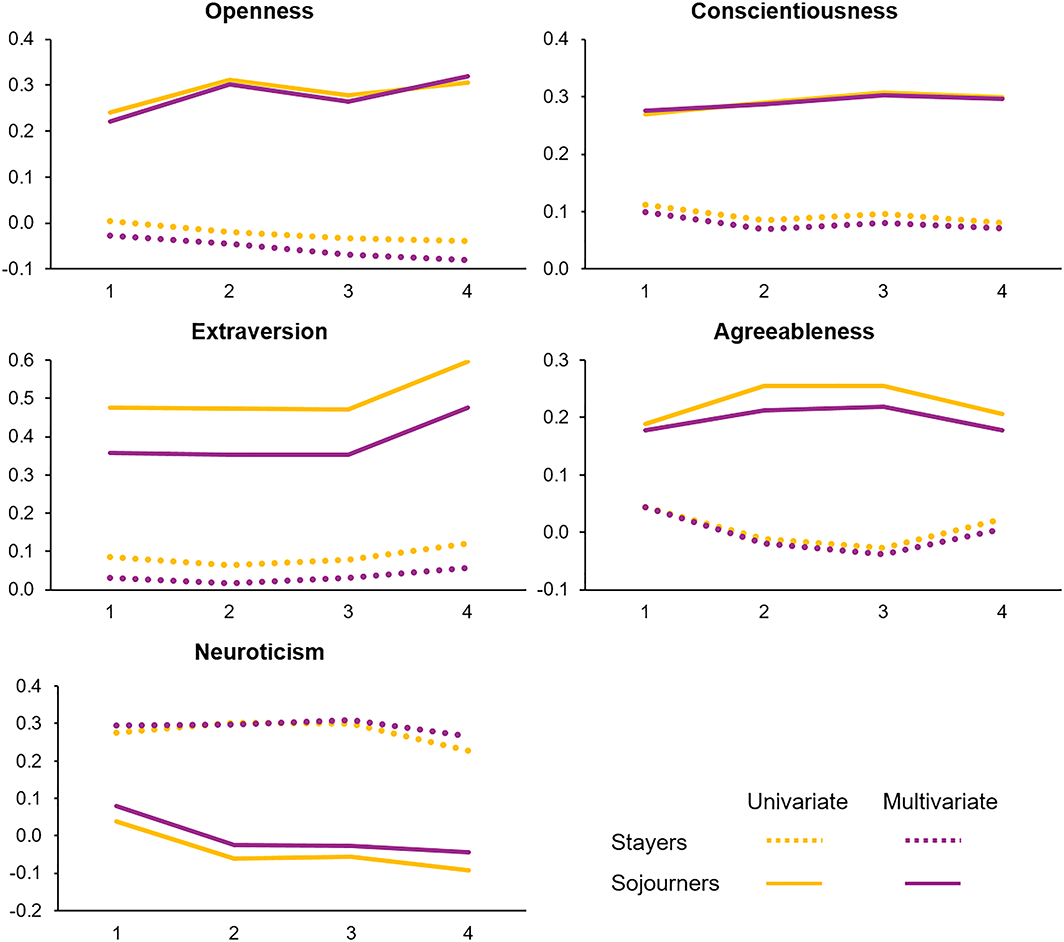
Big Five latent change trends of stayers and sojourners. We printed the respective estimates derived from the univariate and multivariate latent neighbour–change models after standardizing the latent factor indicators, centred on age and sex. T1 values are the unweighted means of the estimates that derived from additional regressions of the Big Five traits on sojourn status in our models, also centred on age and sex. This way, the line of stayers for example represents an imaginary person of age 22.59 years at study begin that did not live abroad. The x–axis denotes time points. Please note that all time spans are printed as equally broad, although the last time span comprised several years, being much broader than the other time spans. [Colour figure can be viewed at wileyonlinelibrary.com]
To compare short–term and long–term sojourners, we also tested for differences in their T1–T2 trait changes (three–group analyses). While most results did not indicate differences between the sojourn groups, the univariate analysis revealed a small positive sojourn effect with regard to short–term sojourners’ extraversion change, with no respective effect for long–term sojourners (see Table S5 and Figure S3). However, this effect was not found in the multivariate approach.
Sojourn effects between T2 and T3
One important extension to the modelling approach used by Zimmermann and Neyer (2013) was the inclusion of an additional change variable that captured change between T2 and T3 in all participant groups. When only comparing sojourners and stayers, we did not find any effects of a sojourn on trait changes during this time span (see Table 4). To investigate the timing and trajectories of sojourners’ trait changes more deeply, we also tested for differences between sojourn groups for the T2–T3 interval. The reason was twofold: first, during this period of time, a reversed effect of a short–term sojourn (one semester) on personality trait changes could indicate effects of the transition back home on trait changes for short–term sojourners. Second, the assessment of effects of a long–term sojourn on personality trait changes between T2 and T3 allowed us to investigate the timing or discontinuity of trait changes during a stay abroad. While the univariate model estimates revealed a relative increase in short–term sojourners’ neuroticism after their return back home compared with the other groups (see Table S5 and Figure S3), the multivariate approach did not.
In sum, the analyses indicated that sojourn effects on changes primarily took place between T1 and T2—that is, within the first five months of a sojourn—independently of the intended sojourn duration (short–term or long–term sojourn). For most traits, spending additional months abroad or returning home did not add to or reverse the observed sojourn effects, indicating neither accentuation nor reversibility of effects (beyond a weak signal for returnees’ neuroticism that relatively increased directly after their transition back home compared to the other groups’ neuroticism).
Sojourn effects until T4
Significance levels of effects on trait changes T3–T4 in Table 4 suggested no differences in trait change trajectories between sojourners’ and stayers’ openness, conscientiousness, and neuroticism. This was also true for the analyses based on listwise deletion (Table S4). Although the point estimates for a sojourn effect on openness change between T1 and T2 (bunivariate = .09, p = .002; bmultivariate = .10, p = .002) shared a comparable magnitude with the effects on agreeableness change between T3 and T4 (bunivariate = −.10, p = .153; bmultivariate = −.09, p = .226), only the former effects statistically differed from zero (see Table 4). A similar picture emerged for the three–group analyses. Estimates of the sojourn effect on neuroticism change T3–T4 suggested a negative trend in short–term sojourners (bunivariate = −.11, p = .233; bmultivariate = −.10, p = .244) and a positive trend in long–term sojourners (bunivariate = .14, p = .078; bmultivariate = .12, p = .138; see Table S5 ), suggesting more decrease in short–term sojourners’ neuroticism, and a reversed effect for long–term sojourners after their return. However, none of the trends reached statistical significance, indicating that the T3–T4 effects might have failed to detect small effects because of power limitations.
We were not aware of any procedure to reliably estimate the power of our latent model. As an approximation, we applied a power analysis using
Model–comparison analyses
In face of the aforementioned accuracy and power reasons, we pursued an alternative strategy to directly test for reversed, accentuated, and sustained effects using model comparison criteria. To that end, we ran formal model comparison analyses with and without constraining sojourn effects on trait change in the T3–T4 interval. Please note that we used the exact point estimates as they had been estimated previously by the univariate and multivariate approaches. Thus, point estimates could slightly differ between model comparisons in the two approaches.
We started by investigating whether effects on changes between T1 and T2 later reversed (reversed effects). For example, we tested whether equating the sojourn effect on openness change between T3 and T4 to its receptive reverse value of the T1–T2 interval (i.e. bunivariate = −.09 and bmultivariate = −.10; see Table 4) led to a significant decrease in model fit. Second, we tested whether effects on T1–T2 changes might have occurred again between T3 and T4 with the same size (accentuated effects). 6 For example, we tested whether equating the sojourn effect on openness change T3–T4 to the effect on openness change T1–T2 (i.e. bunivariate = .09 and bmultivariate = .10) led to a significant decrease in model fit. Third, we tested whether we could fix sojourn effects on changes between T3 and T4 to zero (sustained effects). As we had not identified significant effects on changes between T2 and T3, 7 we equated all effects across T2–T3 to zero for these additional analyses (the same strategy was applied for the three–group models).
We are aware that the assumption of same–size effects for the substantially longer time interval between T3 and T4 is somewhat arbitrary as little is known about the exact shape and timing of change in the different traits over the course of young adulthood. However, previous findings supported the assumption of unidirectional change in all traits between age 20 and 30 (Specht et al., 2011). Hence, assuming the same amount of change for the six–months interval from T1 to T2 and the four years between T3 and T4 was deemed the most conservative prognosis.
Although there was a positive effect on neuroticism change in returned short–term sojourners in the univariate model, there were no sojourn effects for the whole group of sojourners during this time span.
Reversed effects under investigation
Using five separate Wald tests of parameter constraints for both the univariate and the multivariate analyses, we tested whether effects of a sojourn on trait changes later reversed. For openness, we found a significant decrease in model fit in the multivariate analysis when constraining the data to the reversed effect, indicating that a reversed sojourn effect was unlikely (see Table 5). Although the same trend of model fit decline could be observed for the univariate model analysis, the decrease in model fit was not statistically significant. There were no further hints on model deteriorations regarding reversed effects in the other traits. Summed up, reversed sojourn effects tended to be unlikely for openness, but not for the other traits.
Results of investigating long–term sojourn effects more deeply
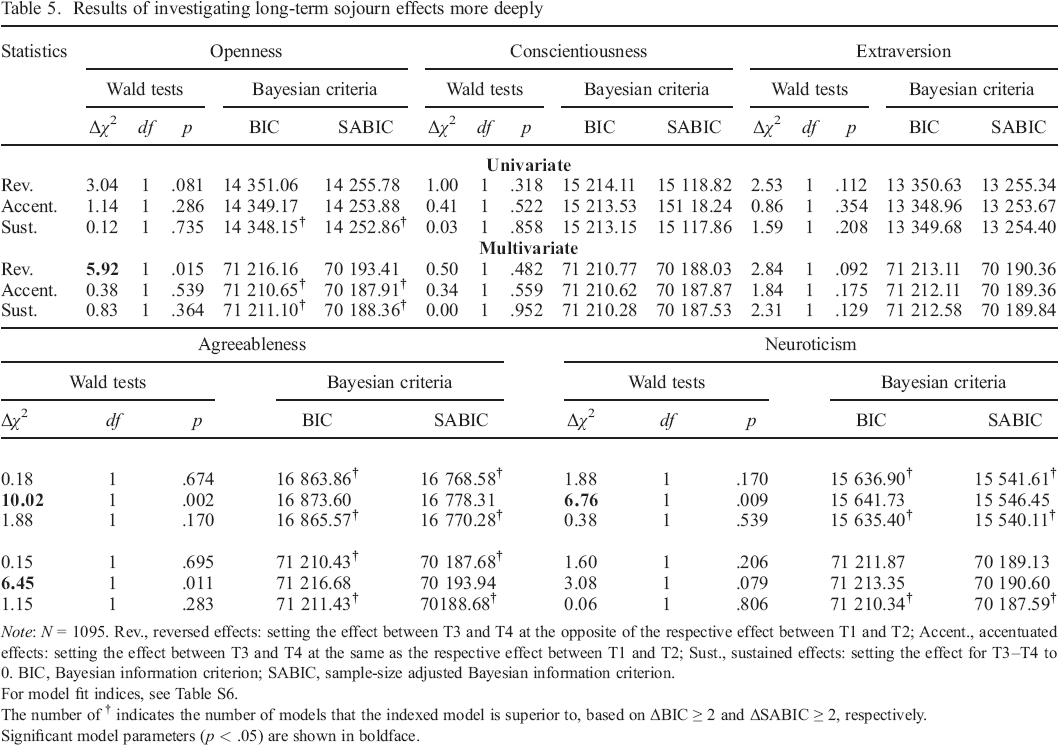
Note: N = 1095. Rev., reversed effects: setting the effect between T3 and T4 at the opposite of the respective effect between T1 and T2; Accent., accentuated effects: setting the effect between T3 and T4 at the same as the respective effect between T1 and T2; Sust., sustained effects: setting the effect for T3–T4 to 0. BIC, Bayesian information criterion; SABIC, sample–size adjusted Bayesian information criterion.
For model fit indices, see Table S6.
The number of † indicates the number of models that the indexed model is superior to, based on ΔBIC ≥ 2 and ΔSABIC ≥ 2, respectively.
Significant model parameters (p < .05) are shown in boldface.
Accentuated effects under investigation
Wald tests of parameter constraints were significant for agreeableness in both the univariate and multivariate model analysis approaches, indicating that an accentuated–effects model did not fit this trait's pattern well. In other words, an accentuated sojourn effect on agreeableness change between T3 and T4 was statistically not likely. Moreover, the Wald test was significant for neuroticism in the univariate analysis, but not in the multivariate analysis. To sum up, model–comparison analyses indicated that an accentuated sojourn effect on agreeableness was unlikely, while it only tended to be unlikely for neuroticism.
Sustained effects under investigation
We repeated the model tests for sustained effects, but did not find any evidence for a substantial decrease in model fit (see Table 5). Thus, we cannot rule out sustained effects for any trait. Comparing each trait regarding the three effect patterns (when freeing effects for the other traits in the multivariate model) might yield a more differentiated picture.
Comparing reversed, accentuated, and sustained effects
The Bayesian information criterion (BIC) and the sample–size adjusted BIC (SABIC) were used to compare two independent (i.e. not nested) models with the same set of dependent variables. Although there is no cutoff criterion for either of them, a smaller BIC or SABIC value indicates a comparably better model fit (Kelloway, 2015). For the BIC, Lubke et al. (2017) have proposed |ΔBIC| ≥ 2.00 between two models as a rule of thumb to assume evidence against the model with the higher value (based on prior work by Kass & Raftery, 1995). Although we are not aware of any rule of thumb regarding the SABIC, this criterion penalizes sample size less (Kelloway, 2015), but is comparable with the BIC apart from that. For the present study, we therefore applied the rule of thumb for both the BIC and the SABIC. As both criteria led to the same results (with only slight differences in decimal places), we will only report the results based on ΔBIC here (see Table 5). Please note that the BIC tends to prefer models with less parameters, especially in small samples, and that fit indices are probabilistic, and not absolute, criteria (Lubke et al., 2017).
For openness, an accentuated long–term effect fit comparably better than a reversed effect in the multivariate (ΔBICreversed–accentuated, multivariate = 5.51), but not in the univariate model (ΔBICreversed–accentuated, univariate = 1.89). Comparing the sustained–effect model to the accentuated–effect model yielded no substantial difference between these models for openness (ΔBICaccentuated–sustained, univariate/multivariate = 1.02/−0.45), while comparing it to the reversed–effect model indicated a better fit for the sustained–effect model (ΔBICreversed–sustained, univariate/multivariate = 2.91/5.06). Hence, the model comparisons corroborate a sustained or accentuated pattern, while we can most likely rule out a reversed sojourn effect on openness change.
For conscientiousness, there were no substantial differences between the fit of the reversed–effect or accentuated–effect model (ΔBICreversed–accentuated, univariate/multivariate = 0.58/0.15) and the sustained–effect model (ΔBICreversed–sustained, univariate/multivariate = 0.96/0.49, and ΔBICaccentuated–sustained, univariate/multivariate = 0.38/0.34). For extraversion (ΔBICreversed–accentuated, univariate/multivariate = 1.67/1.00, ΔBICreversed–sustained, univariate/multivariate = 0.95/0.53, and ΔBICaccentuated–sustained, univariate/multivariate = −0.72/−0.47), the sustained model did not differ markedly from the other models, either. This indicated no substantial differences between all three patterns for conscientiousness and extraversion.
For agreeableness, a reversed–effect model (ΔBICreversed–accentuated, univariate/multivariate = −9.74/−6.25) and a sustained–effect model (ΔBICaccentuated–sustained, univariate/multivariate = 8.03/5.25) both fit better than an accentuated–effect model. There was no substantial difference between the reversed–effect and the sustained–effect model (ΔBICreversed–sustained, univariate/multivariate = −1.71/−1.00). For neuroticism, the sustained–effect model (ΔBICaccentuated–sustained, univariate/multivariate = 6.33/3.01) fit better than the accentuated–effect model. While the results were indifferent for comparing the reversed–effect and the accentuated–effect model (ΔBICreversed–accentuated, univariate/multivariate = −4.83/−1.48), reversed–effect and sustained–effect models did not differ markedly (ΔBICreversed–sustained, univariate/multivariate = 1.50/1.53). That is, reversed or sustained patterns seem most adequate, while we can most likely rule out accentuated effects on agreeableness and neuroticism changes.
To conclude, these Bayesian model fit comparisons yielded evidence against reversed sojourn effects on openness change, as well as against accentuated effects on agreeableness and neuroticism changes. Findings for conscientiousness and extraversion were inconclusive. Yet, in the absence of initial sojourn effects for these traits, comparisons were somewhat arbitrary.
Summary of sojourn effects
After small initial sojourn effects on openness, agreeableness, and neuroticism changes between T1 and T2, there were no significant effects on further trait changes across T2–T3 or T3–T4 in any of the traits investigated (Table 4). Figure 4 shows the trait change patterns of stayers and sojourners based on the latent neighbour–change model analyses. For openness, the latent change models revealed substantial positive sojourn effects, with slightly differing estimates for T3–T4 across the univariate (b = .03) and the multivariate (b = .07) analyses. Wald tests as well as Bayesian model comparisons suggested that a reversed effect was unlikely, while an accentuated or sustained pattern were better suited to describe the data for openness. For neuroticism, the (insignificant) coefficients for T3–T4 pointed in the opposite direction (bunivariate = .04, bmultivariate = .02) than for T1–T2 (bunivariate = −.13, bmultivariate = −.10). Yet, these coefficients were substantially smaller than the T1–T2 effects and might thus be negligible. Wald tests along with Bayesian model comparisons suggested that an accentuated effect was less likely than a sustained or reversed pattern.
In contrast to stayers, sojourners revealed an increase in agreeableness between T1 and T2 (bunivariate = .12, bmultivariate = .10). The opposite trend (bunivariate = −.10, bmultivariate = −.09) appeared after T3 (although coefficients did not statistically differ from zero): Stayers, but not sojourners, showed a slight increase in agreeableness (see Figure 4). The CIs in Table 4 (95% CIunivariate [−.23, .04], 95% CImultivariate [−.22, .05]), accompanied by significant Wald tests of parameter constraints and Bayesian model comparisons indicated that an accentuated effect on agreeableness change was unlikely, but a sustained or reversed pattern better fit the data.
For conscientiousness and extraversion, all effects from the univariate and the multivariate models were close to zero. Accordingly, the model comparisons did not favour any of the three potential patterns for these traits. Hence, conscientiousness and extraversion changes seem to be unaffected by sojourn experiences in the long run.
The role of sojourns between T3 and T4
Besides the aforementioned effects, a previous sojourn during the academic term 2009/2010 had a positive effect on the number of future stays abroad between T3 and T4 [b = .36, p < .001]. Although the 95% CIs slightly differed, this effect was independent of the analysis strategy. Further, point estimates suggested that sojourns between T3 and T4 tended to be associated with small differences in changes in openness, agreeableness, and neuroticism (see Table 4). Although differences between those who moved abroad between T3 and T4 and those who did not were not significant, 95% CIs suggested that these effects might be in a positive range for openness (bunivariate = .08 [−.01, .17], bmultivariate = .07 [−.01, .16]), agreeableness (bunivariate = .08 [−.01, .17], bmultivariate = .07 [−.02, .16]), and neuroticism (bunivariate = .07 [−.02, .15], bmultivariate = .05 [−.04, .14]). This implies a tendency for accentuated or at least sustained differences in openness and agreeableness, but reversed effects for neuroticism in association with further sojourns.
Age and sex differences
In our analyses, we allowed for age and sex effects on all latent Big Five trait change variables. Tables 6 and 7 contain the latent regression effects of these covariates on trait changes for both the univariate and multivariate analyses across T1–T4 and T1–T2–T3–T4, respectively.
Age and sex effects on trait changes as derived from the latent–change analyses across T1–T4 only
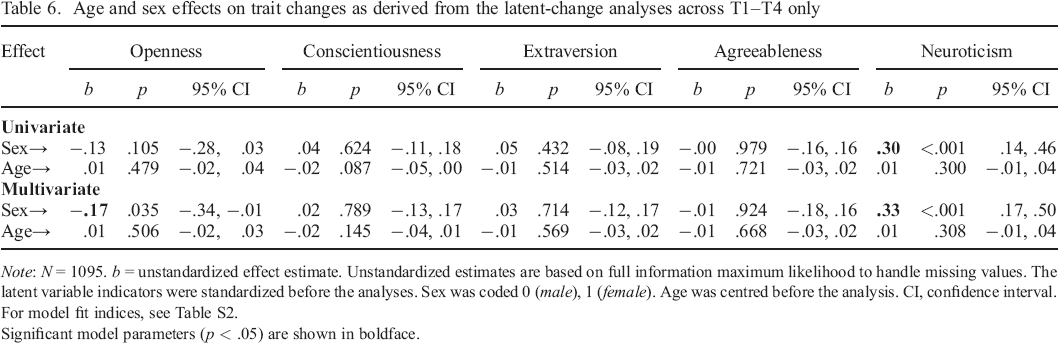
Note: N = 1095. b = unstandardized effect estimate. Unstandardized estimates are based on full information maximum likelihood to handle missing values. The latent variable indicators were standardized before the analyses. Sex was coded 0 (male), 1 (female). Age was centred before the analysis. CI, confidence interval.
For model fit indices, see Table S2.
Significant model parameters (p < .05) are shown in boldface.
Age and sex effects on trait changes as derived from the latent–change analyses across four time points
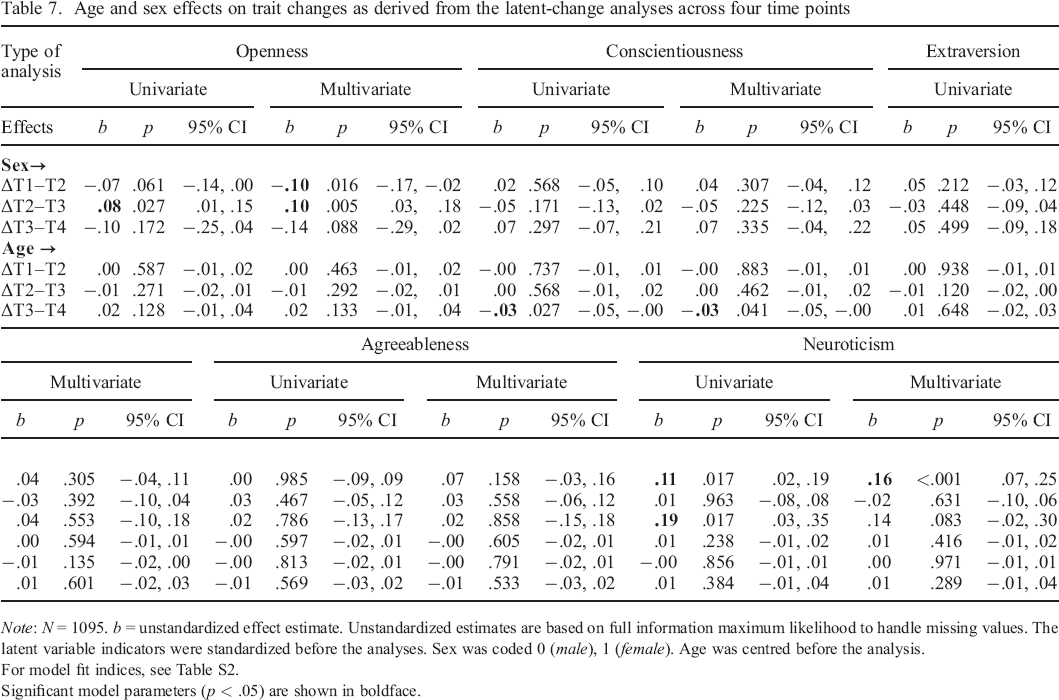
Note: N = 1095. b = unstandardized effect estimate. Unstandardized estimates are based on full information maximum likelihood to handle missing values. The latent variable indicators were standardized before the analyses. Sex was coded 0 (male), 1 (female). Age was centred before the analysis.
For model fit indices, see Table S2.
Significant model parameters (p < .05) are shown in boldface.
Sex differences
Sex differences were found for openness and neuroticism. In the T1–T4 approach, the multivariate analysis revealed that female participants tended to decrease more strongly or increased less strongly in openness than male participants, while the effect was not significant in the univariate analysis (see Table 6). In the T1–T2–T3–T4 approach, women's openness was found to decrease less or increased more than men's openness across T2–T3 in both the univariate and multivariate analyses (see Table 7). The multivariate analysis additionally suggested that female paticipants’ openness decreased more or increased less than male participants’ openness during T1–T2.
Across the T1–T4 interval, the sex effect on neuroticism change was the most pronounced effect (see Table 6), indicating that women decreased less steeply or increased more steeply in this trait than men. The pattern that female participants’ neuroticism decreased less or increased more than that of their male counterparts was corroborated by positive sex effects for T1–T2 in the T1–T2–T3–T4 approach (see Table 7). We also found a positive sex effect for T3–T4 in the univariate analysis with a similar trend in the multivariate analysis (see Table 7), indicating less decrease or more increase in women's neuroticism.
Age differences
Age was not found to predict any trait changes across T1–T4. The T1–T2–T3–T4 analyses revealed a small negative age effect on conscientiousness change during T3–T4. Compared with a slight increase for the average person (see Table 2), this indicated that being older was associated with less increase in conscientiousness, possibly even indicating a decrease for older people.
Discussion
Do sojourn effects on personality trait changes last? The aim of our study was to examine long–term trait changes of sojourners in comparison with their fellow students who did not live abroad. Our results indicated that studying abroad might promote differences in openness, agreeableness, as well as neuroticism changes during the first few months of a sojourn. Differences between the sojourn groups in their T1–T2 extraversion change and their T2–T3 neuroticism change only occurred in the univariate models. After that, there were no substantial group differences in trait changes across five years. However, our study had to deal with lower power and accuracy to detect effects across the follow–up time span between T3 and T4. At the descriptive level, point estimates of sojourn effects derived from the latent change analyses suggested a sustained or accentuated pattern for openness, a sustained effect on neuroticism change, and a reversed effect on agreeableness change. In addition, the 95% CIs and Bayesian model comparisons suggested that a reversed effect was unlikely for openness, and accentuated sojourn effects were unlikely for agreeableness and neuroticism. In the following, we will discuss our findings in more detail.
Sojourn effects between T1 and T2
We showed that sojourn effects on openness, agreeableness, and neuroticism changes occurred early within the first five months of sojourn–related context changes and experiences, independent of the intended sojourn duration (one or two semesters abroad). However, the effects were small. The fact that small sojourn effects were observed during the first five months indicated that trait changes can occur relatively quickly, in contrast to what personality psychologists have previously proposed for the effects of life experiences (see also Roberts, Luo, et al., 2017). Ward et al. (1998) reported highest adaptation difficulties in the beginning of a sojourn with steep decreases thereafter. Although adaptation difficulties are not exactly translatable to personality traits, this might be a hint on early adaptation processes that have led to personality trait changes between T1 and T2 (compare Roberts & Jackson, 2008; Roberts, 2018).
It is important to stress that this study was not able to fully capture the dynamics of student sojourns on trait changes with regard to potential anticipation effects. For example, it is possible that sojourners experienced more anxiety prior to departure than they usually did (see Suanet & van de Vijver, 2009, on the adaptation to a new social context). If that was the case, sojourn effects during the first five months abroad would rather reflect returns to the baseline instead of maturation patterns. However, there are several arguments that challenge these speculations: First, while it may seem plausible to assume increased levels of anxiety (and thus respective state changes in neuroticism) prior to departure, the patterns for other traits are less clear. For example, it is less evident why levels of openness and agreeableness should decrease in advance of a stay abroad.
Furthermore, some authors have argued that mood disturbances might last for four to six months during an adaptation to a new environment abroad (see Ward et al., 1998). If changes in neuroticism merely reflected state changes in negative mood, it would be more plausible to expect a positive effect of sojourning on neuroticism change (i.e. an increase). To more thoroughly investigate these issues, longitudinal studies that cover the time before the departure (e.g. by implementing a waiting–group design) are needed.
Effects of the transition back home?
We did not find any support for sojourn effects between T2 and T3 for long–term sojourners. However, the analyses revealed some hints but an inconsistent signal for a positive sojourn effect on short–term sojourners’ neuroticism change T2
Long–term personality trait changes of sojourners and stayers
The main focus of the present study was to investigate whether sojourn effects on personality trait changes might last. This is interesting from both a theoretical and an empirical perspective. For employers in the German economy, for example, it is of as much (or even more) interest how sojourners develop in the long run (DAAD, 2015). Likewise, previous studies identified a lack of research concerning the long–term effects of life experiences in the scientific literature (Bleidorn et al., 2018, 2020). We tried to fill this gap with respect to sojourn experiences. However, we cannot fully disentangle the three potential patterns of reversed, accentuated, and sustained sojourn effects based on the current follow–up sample at hand. Nevertheless, we believe that we can discuss more or less likely patterns based on point estimates derived from the multivariate latent change model, their 95% CIs and additional (Bayesian) model comparisons.
Regarding openness, we interpret our findings as most probably reflecting no reversed differences across the groups. This finding provides some support for sustained or accentuated sojourn effects on openness, above and beyond possible effects of additional sojourns. It is consistent with effects of clinical interventions on personality trait changes that were shown to mainly occur within the first weeks and to persist later on (Roberts, Luo, et al., 2017). However, the obtained results do not allow for conclusive answers as regards the interpretation of the effect as a sustained or accentuating pattern.
The visualized pattern suggested a reversed sojourn effect on agreeableness change that was attributable to a possible slight increase in stayers across T3 and T4, with no change or a slight decrease in sojourners across this period (compare Figure 4). This pattern was corroborated by inspection of CIs and model comparisons that indicated no accentuated effect on agreeableness change. However, we cannot fully rule out sustained differences between sojourners and stayers regarding their agreeableness changes.
We found no effect on neuroticism change between T3 and T4. Although manifest mean–level trends suggested a tendency towards a reversed sojourn effect, the point estimate based on the latent neighbour–change models did not clearly support this suggestion as the coefficient was close to zero (see Table 4, and compare Figures 3 and 4). Please note that we cannot rule out a reversed effect especially for the long–term sojourners, but we can most likely rule out an accentuated long–term effect on neuroticism change. This pattern might be interpreted as an accelerated maturation between T1 and T2 towards more emotional stability among sojourners compared with stayers, with short–term neuroticism increases for returnees, and stayers—if at all—slowly and incrementally catching up since T3, but still not having reached sojourners’ mean level by the end of the study.
The advantage of latent modelling
Against the backdrop of the manifest mean–level trends, we acknowledge the possibility that openness, agreeableness, and neuroticism all showed reversed sojourn effects. However, based on the latent variable analyses, which provided more precise estimates controlled for error of measurement, several covariates, and intertrait correlations, we can most probably rule out a reversed effect of sojourning on openness (and accentuated effects of sojourning on agreeableness and neuroticism changes) over a time span of five years. In sum, traits seem to follow different change patterns. This trait dependence of life–event effects has repeatedly been reported (Bleidorn et al., 2018; Specht et al., 2011). However, we still need to stress that our findings can only be seen as trends with limited statistical back–up and that they need to be replicated by future research.
The role of recurring sojourns
The present study allowed us to replicate former studies regarding the finding that earlier sojourns are predictors of future sojourns (Netz & Jaksztat, 2014; Niehoff et al., 2017). Point estimates (see Table 4) also revealed that sojourns between T3 and T4 might have positive effects on trait changes between T3 and T4 in openness, agreeableness, and neuroticism after the control of trait levels at T3. For openness and agreeableness, these effects were comparable in size with the significant effects found for the T1–T2 interval, but were not statistically significant because of reduced power and accuracy. Moreover, the findings are limited by the fact that we did not know much about the exact timing and circumstances of those stays abroad. The developmental interplay of repeated mobility experiences during different phases of the educational career and across the lifespan remains an interesting objective to be more thoroughly explored by future studies. For example, previous research showed that first–time sojourners benefit more from participation in international student mobility than experienced sojourners (Zimmermann, Greischel, & Jonkmann, 2020). Hence, it might be valuable to more elaborately examine if a similar pattern occurred with regard to development in the Big Five traits, thereby comparing individual patterns of sojourn effects on trait changes with regard to the timing of a (first) sojourn.
Limitations and implications for future directions
Although our longitudinal design and analytical approach have several strengths, some limitations need to be addressed. First, a major restriction was the lower power and accuracy to detect effects for the T1–T4 and the T3–T4 intervals because of the reduced T4 sample size. We tried to accommodate this limitation with extensive additional analyses and model comparisons and aspired to interpret our findings in a balanced and cautious way. Nevertheless, future studies should try to replicate our findings based on larger samples with more data points.
Second, one important limitation is our nonexperimental design (see also Zimmermann & Neyer, 2013), whereby participants selected themselves into the groups of stayers and sojourners according to their personal characteristics. Although we included initial trait levels in our analysis, we cannot rule out that the observed effects resulted from influences that were connected to those trait levels, but that were not assessed in the current study design. Moreover, we do not exactly know if the observed effects are necessarily because of socialization effects. That is, it might be the case that differences between stayers and sojourners that had led to the observed trends were independent of the sojourn itself or had already led to the decision for a sojourn. However, both the distinctive pattern of socialization beyond initial trait levels and the accumulating amount of studies that corroborated the importance of sojourn experiences with regard to personality or identity development (Greischel et al., 2016; Greischel, Noack, & Neyer, 2018; Niehoff et al., 2017) support an interpretation of our results in terms of sojourn effects. In this regard, studies with waiting–group designs would be helpful as comparing trajectories of present and future sojourners (that are likely to be very similar with regard to all characteristics but the exact timing of their sojourn) may help to more thoroughly investigate the interplay of selection and socialization effects. Other further alternatives in this regard are large representative panel studies, in which more adequate control groups of sojourners can be identified with the use of propensity score matching. However, to our knowledge, such panel data are currently not available.
Third, our design did not allow us to gather information on the mechanisms that account for the observed pattern of socialization effects. Our findings suggested reduced openness and agreeableness decreases and accentuated decrease in neuroticism directly after sojourn–induced contextual changes. As a consequence, investigating sojourners’ psychological and sociocultural adaptation (as an indicator of their successful mastery of the sojourn demands) might provide insights into the mediators of personality development. Studies on identity development in the context of high school students’ sojourn experiences corroborated the importance of these mechanisms (Greischel et al., 2018; Greischel, Noack, & Neyer, 2019).
Moreover, from a micro–analytical perspective, the high–frequency examination of concrete behaviour (changes) (e.g. with ambulatory assessment methods) might be a promising way to assess and integrate the short–term and long–term processes of personality trait change (see Geukes, van Zalk, & Back, 2018; Wrzus & Roberts, 2017). With regard to the microprocesses that occur in the context of (dyadic) interactions, the PERSOC model (Back et al., 2011) provides an encompassing description of the social interaction units that relate to (changes in) self and relationship dispositions, and thus account for personality changes.
In addition, female participants comprised almost 80% of the participants, heavily skewing the sample composition. To address this, we controlled for sex effects (as well as for age effects) in our analysis. As we found sex to be associated with changes in openness and neuroticism, we recommend exploring these differences in future research. In addition, the sample was limited to German students that mostly went to European countries for one or two semesters (see also Zimmermann & Neyer, 2013). We therefore cannot generalize our findings to students from other countries or students who stayed in other host countries. Further research has already shown that these variables are of high importance: for example, the cultural distance between one's home and host country seems to play a major role in the adjustment processes of sojourners (e.g. Suanet & van de Vijver, 2009). In Denissen et al.'s (2013) self–regulation theory, cultural values are an important predictor of personality changes. An examination of the difference between home and host cultural values could be a promising way to better understand the process of value acceptance in the new environment as a source of adaptation and trait changes.
From the self–regulation perspective, one might also argue that sojourners have experienced a shift in their reference values, that is by engaging in new behaviours and ideas, exploring (cultural) diversity, and handling the (social) challenges of living abroad (Denissen et al., 2013). In turn, discrepancies between these values and their observed behaviour might have led sojourners to change their habits and daily behaviours throughout their sojourn. Now, several years later, some of these shifted values might still be in place and regulate their day–to–day behaviour, while others do not. An investigation of (changes in) reference values and their contingency upon sojourners’ goals that motivated their stay abroad (Zimmermann, Schubert, Bruder, & Hagemeyer, 2017) would help to clarify these processes.
Further, psychological measures that rely on self–ratings are often flawed, for example, by a social desirability bias. Recent research suggests that the use of both self–ratings and informant ratings produces a more valid measure of personality traits and better detects different perspectives on personality changes (Luan, Hutteman, Denissen, Asendorpf, & van Aken, 2017). As the present study only used self–report data on personality traits, the possibility of bias effects has to be taken into account when interpreting the findings.
Finally, there is evidence that differences within a sample could have an impact on trait changes as well. Denissen, Luhmann, Chung, and Bleidorn (2019) have recently reported significant variation in individuals’ reactions to life events with regard to personality trait changes. In fact, Niehoff et al. (2017) have reported similar results on sojourn effects. Besides slight differences in the traits that were associated with selection and socialization effects, the authors found that the 25% of sojourners with the highest conscientiousness and agreeableness levels before their sojourn changed in these traits in the direction of more average trait levels. This illustrates that sojourn benefits in terms of personality maturation might depend upon predeparture personality constellations. Our focus in the present research was on the exploration of developmental differences between sojourners and stayers. However, future research may follow up on these findings and more thoroughly explore conditions of differential development within the group of sojourners.
Conclusions
International mobility is a prevalent life event among university students in industrialized societies. Our study suggested that personality trait changes in association with student sojourns occur early and are small. With regard to the question if sojourn effects on personality change last, we could most likely rule out a reversed sojourn effect on openness, but considered the possibility of sustained or accentuated long–term differences. Likewise, we could most likely rule out accentuated differences between sojourners’ and stayers’ agreeableness changes over the course of five years. By contrast, a reversed pattern seemed most likely to describe the data. Although we could also most likely rule out an accentuated effect on differences between sojourners’ and stayers’ neuroticism changes, reversed and sustained differences appeared to be equally likely for the group of sojourners as a whole.
Separating short–term from long–term sojourners revealed possible effects of the type of sojourn. More specifically, while short–term sojourners’ extraversion increased relatively to the other groups across T1–T2, returning home tended to inhibit neuroticism decrease for short–term sojourners. These findings were only found in the univariate analysis, but might be interesting starting points for future investigations. In addition, we found some hints that multiple sojourns might have additional effects on trait change over the course of five years, that is they might sustain or accentuate in openness and agreeableness change.
Our results can only be seen as first hints on long–term sojourn effects on personality trait changes and may help future studies to generate hypotheses on the magnitude, stability, and directions of differences between sojourners and stayers (Kenny & Judd, 2019). Future studies should replicate the trends found in this study and test our assumptions with more robust designs (e.g. waiting–group designs) and larger samples. An important objective for future investigations might also be a narrower examination of personality–environment transactions by taking further individual variables (e.g. identity or acculturation motivation) and environmental aspects (e.g. cultural differences between host countries and social background) into account (Wagner, Orth, Bleidorn, Hopwood, & Kandler, 2020). This seems promising in achieving a deeper understanding of the underlying adaptation processes that drive personality trait changes during and after sojourn experiences and, maybe, life experiences in general.
The present research partly used data from the longitudinal study ‘PEDES—Personality Development of Sojourners’, which has been described by Zimmermann and Neyer (2013) and Zimmermann & Neyer et al. (2014). The current study differs from the previous publications in the following aspects. First, it focuses on another research question (i.e. the sustainability of sojourn effects on personality traits across five years). Second, it incorporates data from a new measurement occasion (i.e. a follow–up measurement that was taken five years after the end of the previous study period). Hence, there is no substantial overlap with previous publications based on the PEDES data.
Acknowledgements
This research was supported by two grants from the German Academic Exchange Service (DAAD) to Julia Zimmermann. During the time of writing this paper, Julia Richter's research position was partly supported by a grant given to Christian Kandler KA 4088/2–1. Open access funding enabled and organized by Projekt DEAL.
Supporting Information
Supporting Information, per2291-sup-0001 - Do Sojourn Effects on Personality Trait Changes Last? A Five–Year Longitudinal Study
Table S1. Parcel-Based Reliability Coefficients of Personality Traits
Table S2. Comparing Strong to Strict Measurement Invariance
Table S3. Sojourn Effects on Trait Changes as Derived from the Latent-Change Analyses Across T1-T4 Only Based on Listwise Deletion
Table S4. Sojourn Effects on Trait Changes as Derived from the Latent-Change Analyses Across Four Time Points Based on Listwise Deletion
Table S5. Short and Long-term Sojourn Effects on Trait Changes as Derived from the Latent-Change Analyses Across Four Time Points.
Table S6. Model Fit Indices After Constraining Long-Term Sojourn Effects
Figure S1. Descriptive mean-level differences of stayers, short-term sojourners, and long-term sojourners based on raw means of manifest personality trait scores. We plotted the raw means standardized around the grand mean of each trait to make the figures more comparable. Estimates include group-based standard errors to illustrate measurement inaccuracy. We included a linear trend line between T1 and T4 in each groups’ respective color theme to make change trends for the whole study period more easily comparable across groups. Please note that trends appear much steeper for the T3-T4 interval than they were based on the data. This is due to the fact that all time spans are printed as equally broad, although the last time span comprised several years, being much broader than the other time intervals spanning less than half a year
Figure S2. Box plots of raw means arranged by group and time point. We calculated the estimates based on listwise deletion of cases across all time points. This led to results diverging from Figures 3 and S1.
Figure S3. Latent extraversion and neuroticism change trends of stayers, short-term sojourners, and long-term sojourners. We printed the respective estimates derived from the univariate and multivariate latent neighbor-change models after standardizing the latent factor indicators, centered on age and sex. T1 values are the unweighted means of the estimates that derived from additional regressions of the Big Five traits on sojourn status in our models, also centred on age and sex. This way, the line of stayers for example represents an imaginary person of age 22.59 years at study begin that did not live abroad. The x axis denotes time points. Please note that all time spans are printed as equally broad, although the last time span comprised several years, being much broader than the other time spans.
Supporting Information, per2291-sup-0001 for Do Sojourn Effects on Personality Trait Changes Last? A Five–Year Longitudinal Study by JULIA RICHTER, JULIA ZIMMERMANN, FRANZ J. NEYER and CHRISTIAN KANDLER, in European Journal of Personality
Table S1. Parcel-Based Reliability Coefficients of Personality Traits
Table S2. Comparing Strong to Strict Measurement Invariance
Table S3. Sojourn Effects on Trait Changes as Derived from the Latent-Change Analyses Across T1-T4 Only Based on Listwise Deletion
Table S4. Sojourn Effects on Trait Changes as Derived from the Latent-Change Analyses Across Four Time Points Based on Listwise Deletion
Table S5. Short and Long-term Sojourn Effects on Trait Changes as Derived from the Latent-Change Analyses Across Four Time Points.
Table S6. Model Fit Indices After Constraining Long-Term Sojourn Effects
Figure S1. Descriptive mean-level differences of stayers, short-term sojourners, and long-term sojourners based on raw means of manifest personality trait scores. We plotted the raw means standardized around the grand mean of each trait to make the figures more comparable. Estimates include group-based standard errors to illustrate measurement inaccuracy. We included a linear trend line between T1 and T4 in each groups’ respective color theme to make change trends for the whole study period more easily comparable across groups. Please note that trends appear much steeper for the T3-T4 interval than they were based on the data. This is due to the fact that all time spans are printed as equally broad, although the last time span comprised several years, being much broader than the other time intervals spanning less than half a year
Figure S2. Box plots of raw means arranged by group and time point. We calculated the estimates based on listwise deletion of cases across all time points. This led to results diverging from Figures 3 and S1.
Figure S3. Latent extraversion and neuroticism change trends of stayers, short-term sojourners, and long-term sojourners. We printed the respective estimates derived from the univariate and multivariate latent neighbor-change models after standardizing the latent factor indicators, centered on age and sex. T1 values are the unweighted means of the estimates that derived from additional regressions of the Big Five traits on sojourn status in our models, also centred on age and sex. This way, the line of stayers for example represents an imaginary person of age 22.59 years at study begin that did not live abroad. The x axis denotes time points. Please note that all time spans are printed as equally broad, although the last time span comprised several years, being much broader than the other time spans.
Supporting Information
Supporting Information, per2291-sup-0002 - Do Sojourn Effects on Personality Trait Changes Last? A Five–Year Longitudinal Study
Supporting Information, per2291-sup-0002 for Do Sojourn Effects on Personality Trait Changes Last? A Five–Year Longitudinal Study by JULIA RICHTER, JULIA ZIMMERMANN, FRANZ J. NEYER and CHRISTIAN KANDLER, in European Journal of Personality
Footnotes
Supporting Information
Additional supporting information may be found online in the Supporting Information section at the end of the article.