
Abstract
Individuals like their name letters more than non–name letters. This effect has been termed the Name Letter Effect (NLE) and is widely exploited to measure implicit (i.e. automatic, unconscious) self–esteem, predominantly by means of the Initial Preference Task (IPT). Methodological research on how to best administer the IPT is, however, scarce. In order to bridge this gap, the present paper assessed the advantages and disadvantages of different types of IPT administrations with two meta–analyses (k = 49; N = 11,514) and a follow–up experiment (N = 449). As a result, a new type of administration is recommended which (1) treats the effects of the first and the last name initials separately, (2) uses a duplicate administration for reliability reasons, (3) uses the likability as well as the attractiveness item wording and (4) exploits not only letters but also numbers (i.e. birthday number effect) to measure implicit self–esteem. Copyright © 2011 John Wiley & Sons, Ltd.
Keywords
Introduction
In the last decade, research on personal names as an extension and compensatory enhancement of the self has attracted the widespread concern of many researchers. However, this field of research is certainly not new—it has already begun more than a century ago with Hall (1898) noting the importance of our names to our sense of self as early as 1891. Syz (1926) found that the own name can evoke a vivid ‘psycho galvanic skin response’ that is independent of verbally reported emotions. The origin of this attachment of self to one's own name is probably grounded in childhood (Guardo & Bohan, 1971) and keeps on through our whole lives (Stieger & LeBel, in press).
Research on the self–attachment of names became more focused with the publication of Nuttin's seminal study in 1985 in which he discovered that people prefer their name letters over letters not in their name (Nuttin, 1985). He called this phenomenon the Name Letter Effect (NLE). Later it turned out that this effect is stronger on the initial letters and less pronounced for the remaining letters of the first and last name (Dijksterhuis, 2004; Kitayama & Karasawa, 1997). Research on the NLE received a boost due to the work of Greenwald and Banaji (1995). They suggested that the NLE might reflect a positive attitude to the self and could serve as a measure of implicit (i.e. unconscious, automatic) self–esteem because the effect could be obtained without the conscious knowledge of the purpose of evaluating letters. Another cornerstone in the development of the NLE to a popular measure of implicit self–esteem was the introduction of a simpler administration by Kitayama and Karasawa (1997) that used rating scales to assess the likability of all letters. Throughout the present paper, this new task shall be called Initial Preference Task (IPT). 1 Meanwhile, research has established that the NLE exists in at least 14 different countries and is stable across different alphabets (Hoorens, Nuttin, Erdélyi–Herman, & Pavakanun, 1990; Nuttin, 1987).
Jones, Pelham, Mirenberg, and Hetts (2002) described the basis of the NLE as implicit egotism: ‘Implicit egotism refers to the general idea that people's positive associations about themselves spill over into their evaluations of objects associated with the self’ (p. 666). Support for this has been found for interpersonal attraction (i.e. people marry partners whose first and last name resemble their own) and general preferences (experiment number resembles birthday number, surname letters resemble own surname letters, numbers on football shirts resemble own name; Jones, Pelham, Carvallo, & Mirenberg, 2004). Moreover, if people's positive self is threatened, their name letter preference increases (Jones et al., 2002).
The IPT as a Measure of Implicit Self–Esteem
The IPT is meanwhile commonly used as a measure of implicit self–esteem just as the Implicit Association Test (IAT; Greenwald, McGhee, & Schwartz, 1998). Procedures measuring implicit aspects of self–esteem have one feature in common—they attempt to tap automatic, nonconscious evaluations of the self that become apparent in spontaneous reactions to self–relevant stimuli (Greenwald & Banaji, 1995; Greenwald, Banaji, Rudman, Farnham, Nosek, & Mellott, 2002; Pelham & Hetts, 1999; for a review about the implicitness of to–be measured attributes, see De Houwer, Teige–Mocigemba, Spruyt, & Moors, 2009). In other words, implicit self–esteem reflects the part of our self–evaluations that are introspectively inaccessible (Greenwald & Banaji, 1995; Koole & DeHart, 2007; Pelham & Hetts, 1999; for a discussion, see Dijksterhuis, 2004, p. 353). According to standard dual process models (e.g. Strack & Deutsch, 2004), explicit self–views are reflected by deliberate and conscious processes whereas implicit self–views are reflected by automatic and spontaneous processes. This rationale is underlined by a rather weak correlation between explicit and implicit self–esteem measures (r = .12; see meta–analysis by Krizan & Suls, 2008).
Regarding the origins of these self–views, it has been argued that implicit associations with the self are more basic and develop earlier than do explicit self–views (Epstein & Morling, 1995; Koole, Djiksterhuis, & van Knippenberg, 2001). Confirming this view, college students from divorced families show weaker preferences for their initials (DeHart, Pelham, & Tennen, 2006). In addition, the mothers’ parenting style is associated with children's initial preferences. Mothers with high nurturance and low over–protectiveness had children with higher initial preferences (i.e. higher implicit self–esteem). Implicit self–esteem therefore seems to develop early in life (but see Castelli, Carraro, Gawronski, & Gava, 2010) and is influenced through life events (e.g. parents divorce) and parenting style.
Also, the interaction of implicit and explicit self–esteem has revealed interesting results. People with high implicit self–esteem behave differently depending on their level of explicit self–esteem (Jordan, Spencer, Zanna, Hoshino–Browne, & Coreel, 2003). People with defensive self–esteem (i.e. low implicit but high explicit self–esteem), for example, favour their in–group members more, have higher levels of narcissism (Jordan, Spencer, & Zanna, 2003), and promote more defensive reactions to adverse feedback (e.g. Bosson, Brown, Zeigler–Hill, & Swann, 2003; Kernis, 2003) than people with secure high self–esteem (i.e. high implicit and high explicit self–esteem). Participants with damaged self–esteem (i.e. high implicit and low explicit self–esteem), however, show more anger suppression, more nervousness, more days of impaired health as well as more defensive reactions to social feedback (Schröder–Abé, Rudolph, & Schütz, 2007; Schröder–Abé, Rudolph, Wiesner, & Schütz, 2007). This supports the notion that both kinds of discrepancies between implicit and explicit self–esteem (i.e. defensive and damaged self–esteem) are maladaptive, because they seem to indicate a lack of integration in self–presentation (for a discussion see Gregg & Sedikides, 2010).
Methodological Issues of the Ipt
Compared with other implicit measures, the IPT has good reliability (Bosson, Swann, & Pennebaker, 2000; LeBel & Gawronski, 2009; Rudolph, Schröder–Abé, Schütz, Gregg, & Sedikides, 2008) although it is based on just two items (i.e. initial letters of first and last name; remaining letters are the baseline). Usually the ratings of the two initials are averaged, assuming that both initials measure the same NLE and therefore also the same aspect of implicit self–esteem. This rationale has never been empirically tested for its appropriateness, although it has been questioned several times (e.g. DeHart et al., 2006; LeBel & Gawronski, 2009). Furthermore, research in general has revealed differences between first and last name initials as proxies of individuals’ personal and social identities (Hetts & Pelham, 2009; Kitayama & Karasawa, 1997; Nuttin, 1985, 1987).
Whereas individuals’ first names are more closely linked to personal self–esteem, their last names are more closely linked to collective self–esteem (Hetts, Sakuma, & Pelham, 1999), independent of their sex. College students from divorced families have weaker preferences for their last name initials and their father's first name initials than those from intact families. This negativity bias is not apparent for their own first name initial (DeHart, 2002). Moreover, first names appear to have more psychological significance among friends (DeHart, Pelham, & Murray, 2004). Members of stigmatized ethnic groups dislike their last name initial (marker of social identity), but not their first name initial (a marker of personal identity: Hetts & Pelham, 2009; Pelham & Hetts, 1999). Internet addiction scores correlate positively with implicit self–esteem (and negatively with explicit self–esteem constituting damaged self–esteem; for a recent discussion on implicit and explicit self–esteem interactions, see Gregg & Sedikides, 2010) but only when implicit self–esteem is measured with the first name initial (Stieger & Burger, 2010. All these results suggest that first and last names might tap into different aspects of personal and social identities and perhaps even into different aspects of implicit self–esteem. Whether first and last name initials are valid distinctive measures of implicit self–esteem still needs to be shown.
Judging the validity of implicit measures is generally difficult, because they usually do not only show weak or no correlations with explicit measures but they also have weak or no correlations with other implicit measures (Bosson et al., 2000; Rudolph et al., 2008). Therefore, validity has mainly been assessed by predicting behaviour or by correlations with criterion variables such as the rate of habitual (i.e. automatic, highly frequent, difficult to control) negative self–related thoughts in everyday life which Verplanken, Friborg, Wang, Trafimow, and Woolf (2007) found to be associated with low implicit self–esteem. More generally, research has also analysed whether the IPT really measures implicit aspects. In the study by Koole et al. (2001), participants were asked to rate letters by ‘giving their first intuitive impression’ or to ‘analyze carefully which features of the letters they like or do not like’. The first instruction raised the name–letter effect, whereas the latter one caused the effect to disappear (Koole et al., 2001). These findings suggest that implicit self–esteem effects measured with the IPT can be described as automatic evaluations which, however, can be overruled by (conscious) analytic thoughts (Wilson, Lindsey, & Schooler, 2000). Thus, the instruction seems to play a crucial role in ensuring that subjects make their decision intuitively and without thinking too much when measuring implicit self–esteem (Koole et al., 2001).
Some further moderator variables have an impact on the effect size of and correlations with the NLE: The order of presentation of implicit and explicit measures can have an influence on their correlation (Krizan & Suls, 2008). Bosson et al. (2000) found that if explicit measures precede implicit measures, correlations between implicit and explicit self–esteem and criterion variables tended to be stronger. The same effect has been found for the IPT in a meta–analysis (Krizan & Suls, 2008).
Research has also used different instructions for the IPT by asking participants to rate letters either according to their likability or their attractiveness. Sakellaropoulo and Baldwin (2007) argued that these different instructions might tap into different aspects of implicit self–esteem and found support for their hypothesis in two experiments. These results suggest that implicit self–esteem might indeed be multi–faceted and can be split in at least two dimensions: Self–liking and self–attractiveness.
Present Study
Although the IPT has been frequently used in research, methodology papers are still scarce (for exceptions, see Albers, Dijksterhuis, & Rotteveel, 2009; LeBel & Gawronski, 2009). Hence, it is not surprising that the IPT's administration does vary a lot across studies. The item wording (likability of letters vs. attractiveness), the order of presentation of letters (random vs. alphabetical), the order of presentation of implicit and explicit measures, and the type of rating scales (5–point to 9–point) are used inconsistently. Also, it is still common to build the mean of the NLE on the first name initial (NLE–first) and the last name initial (NLE–last), assuming that both initials measure the same dimension of implicit self–esteem. To identify possible influences of different types of administration on the effect size and correlation of NLE–first and NLE–last, we conducted two meta–analyses. In a follow–up experiment, the impact of several moderators on effect size and correlations with other implicit measures of self–esteem as well as correlations with an external criterion have been analysed extensively in order to give a recommendation about a more standardized administration of the NLE.
Study 1: META–ANALYSES
The first meta–analysis investigated influences of different administration types on the effect size of the NLE. The second meta–analysis focused on moderator effects on the correlation between the NLE on the first and last name initials.
Method
Literature search
A literature search was performed in the following databases: Web of Science, Scopus, Medline, Current Contents, ERIC, UMI Dissertations and CSA Conference Paper Index. Google was searched for unpublished material (research reports, conference papers) and published articles not indexed in databases (e.g. Gailliot & Schmeichel, 2006). In addition, we performed cited reference searches for the key publications (Kitayama & Karasawa, 1997; Nuttin, 1985, 1987). Including data from our own research lab, we found 84 research articles (published or in press), 8 book chapters, 5 dissertations, 2 master theses and 7 unpublished reports or manuscripts.
Study inclusion criteria
Following the validity approach by Campbell and Stanley (1966) for assessing research quality, we first judged each study for relevance and acceptability. Although cross–cultural concepts such as individualism—collectivism may influence the NLE, to date there is no clear empirical evidence for such an effect (Kobayashi & Greenwald, 2003). Furthermore, some published studies rest upon very heterogeneous samples regarding ethnicity, without using ethnicity–specific analyses. For example, LeBel and Gawronski (2009) stated a mean rate of 18.5% Asians in their 18 different American samples. Thus, differentiating between Western and Asian cultures is difficult and possible cultural effects might be confounded with the NLE. Moreover, we excluded non–empirical studies as well as studies in which the impact of initials on life decisions was explored (e.g. Pelham, Mirenberg, & Jones, 2002). We only included studies in which the NLE was of interest for measuring implicit self–esteem.
Although meanwhile a more elaborated algorithm is recommended for the calculation of the NLE (I–algorithm; see LeBel & Gawronski, 2009), we included only studies using the older algorithm originally introduced by Kitayama and Karasawa (1997; between–subject correction algorithm (B–algorithm); for a detailed description of all available algorithms, see Analysis section of Study 2) because it was almost exclusively used in past research. Moreover, we excluded samples in which the NLE has been modified by building the mean with other implicit measures (e.g. Implicit Association Test, birthday number effect (BNE): For a description, see Kitayama & Karasawa, 1997), by building the mean over two time points (e.g. Bosson et al., 2000), and in the presence of pre–manipulations preceding the assessment of the NLE (e.g. LeBel & Gawronski, Studies 1, 2, 16, 17). Altogether, these in–/exclusion criteria yielded a final sample of 35 publications comprising 63 individual studies.
Data extraction
Some studies stated Cohen's d as the measure of effect size without mean and standard deviation which made it impossible to control whether the presented Cohen's d is based on the one–sample case (Cohen called it
Summary of name letter effect studies included in the meta–analysis of Study 1
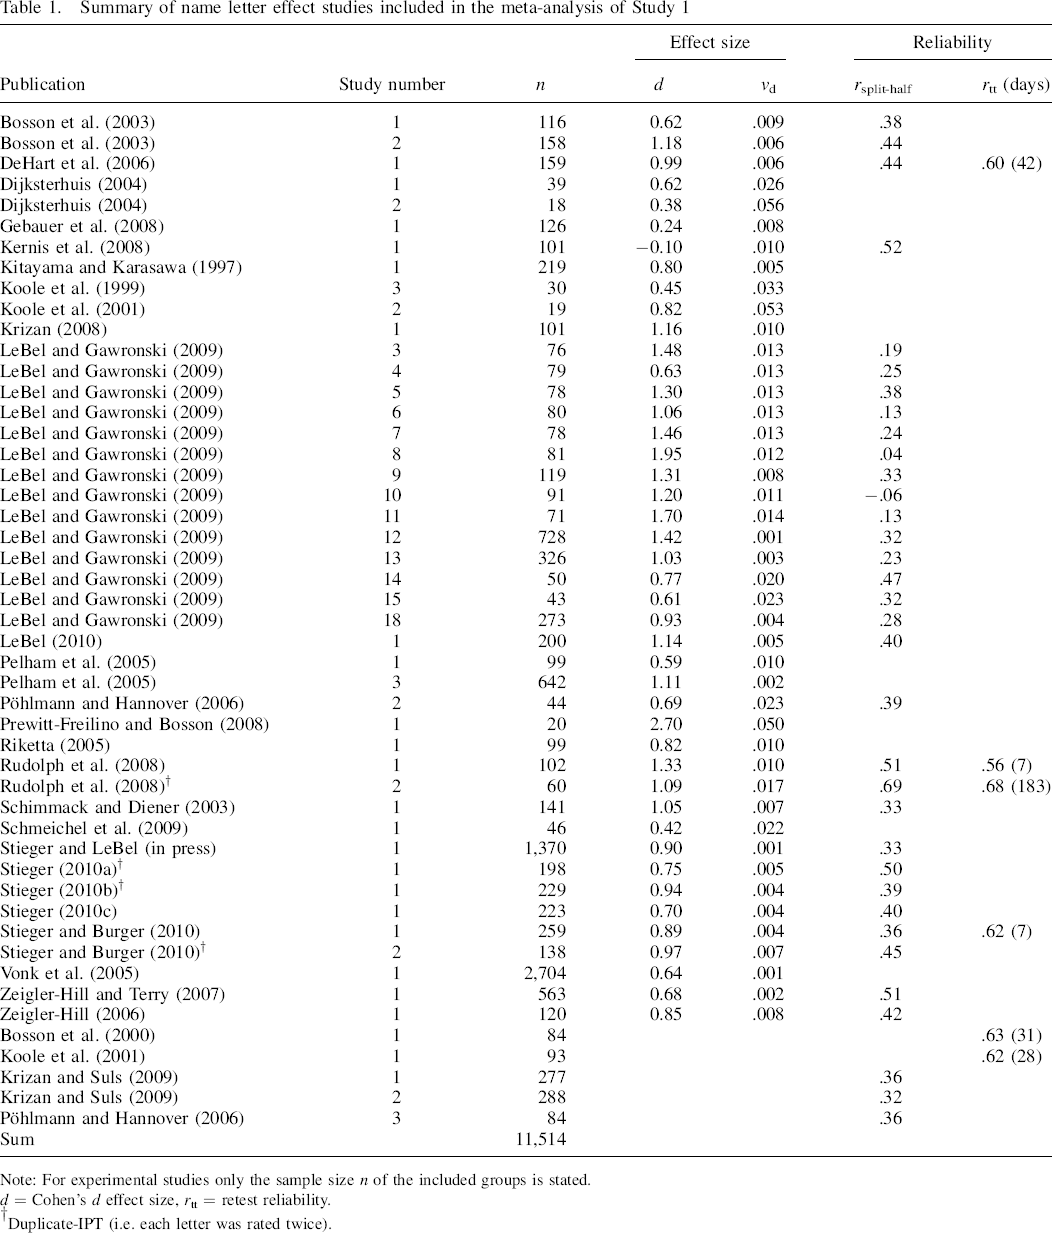
Note: For experimental studies only the sample size n of the included groups is stated.
d = Cohen's d effect size, rtt = retest reliability.
Duplicate–IPT (i.e. each letter was rated twice).
Data synthesis
A meta–regression (simultaneous inclusion of all independent variables) was conducted using the R package metafor (Viechtbauer, 2010). We also used the software package Comprehensive MetaAnalysis (CMA; Borenstein, Hedges, Higgins, & Rothstein, 2009).
Results: Effect size of the NLE
Retest reliability
Six studies stated retest reliabilities with a mean rtt = .62 (see Table 1) which was independent of the test–retest interval (r = .57, p = .23). Retest reliabilities were rather high compared with other implicit measures, such as the Implicit Association Test (rtt,mean = .51; Hofmann, Gawronski, Gschwendner, Le, & Schmitt, 2005) or the Single–Category Implicit Association Test (rtt = .21 to .46; Bluemke & Friese, 2008).
Fixed–effect meta–analysis
Effect sizes were positive, ranging from d = 0.24 to 2.70 (except Kernis, Lakey, & Heppner, 2008 with a d of −0.14). A fixed–effect model of meta–analysis led to a significant result (z = 88.09, p < .001) with an overall effect of d = 0.95 (95% CI: 0.93 to 0.98). A test for effect heterogeneity across studies yielded a significant result (Q(43) = 944.72, p < .001, I2 = 95%) suggesting that there were further sources influencing the NLE effect beyond sampling variability. Therefore, we also computed a random–effects model followed by a moderator analysis, that is, a meta–regression based on a random–effects model.
Random–effects meta–analysis
The random–effects model (with the DerSimonian–Laird estimator) of meta–analysis was statistically significant (z = 18.04, p < .001), and the overall effect was d = 0.99 (95% CI: 0.87 to 1.10; see Figure 1). Heterogeneity across samples was τ2 = 0.11.
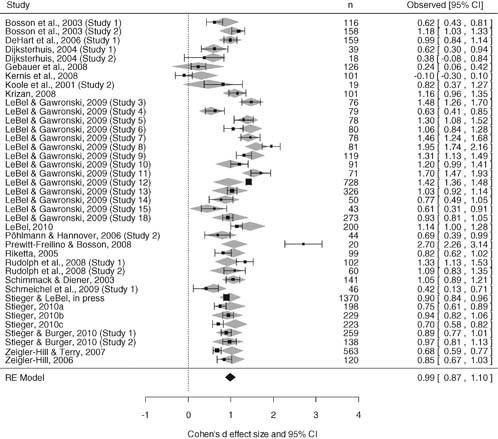
Forest plot of the effect size of the name letter effect of Study 1. Note: Grey shaded diamonds represent predicted effect sizes (including a 95% confidence interval = width of the diamond) taking potential moderators into account. RE, random–effects.
Meta–regression: Moderators on the NLE effect
In a meta–regression, the effect size of the NLE was regressed onto several moderator variables. Potential moderators were not available for all studies. Hence, we had to exclude five studies (final sample n = 39). The following moderators were included: (1) Ratings of letters in terms of likability (like vs. not like) or attractiveness (beautiful vs. not beautiful), (2) answering format of the rating scale (5–point, 6–point, 7–point, 9–point; dummy coded), (3) order of presentation of implicit and explicit measures (explicit before implicit, implicit before explicit, counterbalanced; dummy coded), (4) mode of data collection (online vs. offline), (5) sex ratio in the sample, (6) effect size computed by the authors (with M, SD and n) or directly taken from the publication (when only d was presented without M and SD) and (7) whether the newly introduced duplicate administration (D–IPT; Rudolph et al., 2008) was used or not. The regression model was significant (QM(10) = 42.59, p < .001) suggesting that at least one moderator had significant influence on the effect size (see Table 2). Interestingly, more answer options in rating scales lead to weaker effect size (mixed–effects model: 5–point answering format: d = 1.35; 6–point: d = 0.98; 7–point: d = 0.82; 9–point: d = 0.90; 7– and 9–point were significantly different from the 5–point). Item wording (likability vs. attractiveness) also had an impact on the effect size. Asking about the likability produced a significantly stronger effect size than asking about attractiveness (mixed–effects model: d = 1.11 vs. 0.53). A test for residual heterogeneity revealed a significant result, suggesting that there might be further significant moderators (QE(28) = 344.74, p < .001).
Meta–regression with the effect size and correlation between first and last name initials as dependent variables of Study 1

Note: * p < .05, ** p < .01, *** p < .001 (two–tailed). β, standardized regression coefficient. D–IPT, duplicate administration of the IPT.
Reference category was a 5–point rating scale.
Reference category was the implicit—explicit order of presentation.
Sensitivity analysis
Sensitivity analysis found that none of the studies had an undue influence on the overall effect when removing one study at a time from the model.
Cumulative meta–analysis
A cumulative meta–analysis, with studies arranged chronologically by year of publication, showed that already the first study had a significant result (z = 11.84, p < .001). The z values ranged from 3.92 to 19.60 when further studies were added one by one and all z values were significant (all ps < .001).
Tests for publication bias
The distribution of effect sizes was not asymmetrical based on visual inspection of the funnel plot. Rosenthal's Fail–safe N suggests that more than 10,000 further studies would be necessary to bring the p value of the overall random–effect to insignificance (p > .05). A recently introduced parametric procedure (Formann, 2008) for estimating publication bias found no publication bias (unweighted nmissing = 1; weighted nmissing = 0). Other tests (e.g. Orwin's Fail–safe N) also found no signs of publication bias (results omitted). In conclusion, all tests supported the conclusion that publication bias did not influence the overall result of the meta–analysis.
Results: Correlation NLE–first and NLE–last
Fixed–effect meta–analysis
All correlations between NLE–first and NLE–last were positive, ranging from r = .04 to .69, with one exception (LeBel & Gawronski, 2009: Study 10, r = −.06), and the fixed–effect model was statistically significant (z = 36.92, p < .001), with an overall effect of r = .37 (95% CI: .35 to .39). Effect sizes across studies were heterogeneous (Q(35) = 121.87, p < .001, I2 = 71%), suggesting that there were further sources influencing the correlation between NLE–first and NLE–last. Therefore, a random–effects model followed by a moderator analysis (i.e. meta–regression assuming a random–effects model) was indicated.
Random–effects meta–analysis
The random–effects model was statistically significant (z = 17.39, p < .001) and the overall effect was r = .36 (95% CI: .32 to .40). Heterogeneity across samples was τ2 = 0.01.
Meta–regression: Moderators of the correlation of NLE–first and NLE–last
The following potential moderators were included: (1) Ratings of letters in terms of likability (like vs. not like) or attractiveness (beautiful vs. not beautiful), (2) answering format of the rating scale (5–point, 6–point, 7–point, 9–point; dummy coded), (3) order of presentation of implicit and explicit measures (explicit before implicit, implicit before explicit, counterbalanced; dummy coded) and (4) whether the duplicate administration was used (D–IPT) or not. The remaining moderators initially used in the meta–regression of the NLE effect size (see above) had either no heterogeneity (e.g. all were offline studies) or were not relevant (e.g. how effect sizes were computed). Potential moderators were not available with all studies; hence, we had to exclude two studies (final sample k = 34).
The regression model was significant (QM(7) = 27.1, p < .001), and the β values (see Table 2) showed that the 7–point answering format had the strongest impact on the correlation, followed by the 5–point answering format (β = .18) and the 9–point answering format (β = .17). The more answer options the rating scales had, the stronger was the correlation (mixed–effects model: 5–point answering format: r = .22; 6–point: r = .26; 7–point: r = .40; 9–point: r = .43). Using the D–IPT instead of the usual single administration of the IPT increased the correlation between NLE–first and NLE–last (mixed–effects model: .34 vs. .49). All other potential moderators had no impact on the correlation. A test for residual heterogeneity also found a significant result, indicating that there might be further important moderators (QE(26) = 61.5, p < .001).
Sensitivity analysis
None of the studies had an unduly influence on the overall effect.
Cumulative meta–analysis
Already the first study was significant (z = 4.25, p < .001). The z values ranged from 7.23 to 31.45, depending on the number of studies included (all ps < .001).
Tests for publication bias
According to the funnel plot, the distribution of correlations was symmetrical. Rosenthal's Fail–safe N suggested that 7,364 further studies would be necessary to bring the p value to insignificance (p > .05). Again, further tests revealed no signs of publication bias (results omitted).
Discussion
According to the random–effects model, the IPT produced a large effect size (d = 0.99). This was independent of the order of presentation of implicit and explicit measures (in contrast to the correlation between the two measures; see Krizan & Suls, 2008), the data collection method (online vs. offline), the sex ratio in the sample, and the number of administrations (one vs. two). Asking for the likability of letters produced a larger effect size than asking for the attractiveness of letters, replicating the results of Sakellaropoulo and Baldwin (2007). Interestingly, stronger effect sizes were found for 5–point rating scales compared to 7–point and 9–point rating scales.
A second meta–analysis on the correlation between NLE–first and NLE–last found a mean correlation of r = .36. This was influenced by the rating scale format and administration (i.e. single vs. duplicate) of the IPT. Rating scales with more answer options led to stronger correlations. Duplicate administration (i.e. administering the IPT twice) increased the correlation, probably by reducing measurement error.
The inconsistent finding of larger effect sizes but lower correlations between NLE–first and NLE–last for 5– and 6–point ratings scales warrants closer inspection. It turned out that nine of ten studies using the 5–point rating scale and all studies using the 6–point rating scale were from LeBel and Gawronski (2009) who used college and Internet samples that were highly heterogeneous regarding ethnicity. Moreover, in all the studies of LeBel and Gawronski (2009) except those using Internet samples, participants were instructed to rate letters intuitively. Thus, differences in effect sizes and correlations might be based on cultural factors or differences in instructions but not on the amount of answer options with rating scales.
Study 2: FOLLOW–UP EXPERIMENT
As has been shown by the two meta–analyses, there are still some issues which have to be settled in order to be able to make firm conclusions about the best form of administrating an IPT. Therefore, we designed an experiment to address the following issues.
The number of answer options of the rating scales might have an influence on effect sizes and correlations between NLE–first and NLE–last. If fewer options really reveal stronger effect sizes but weaken the correlations between NLE–first and NLE–last, the effect size should be strongest and correlations weakest with only two answer options (forced–choice item format). Hence, we used three different answering formats in our experiment: Forced–choice (i.e. 2–point), 5–point rating scales and 9–point rating scales in a between–subject design.
In almost all studies the effect on the first and last name initials has been treated as one single implicit measure by averaging both measures. This has mainly been done for reliability reasons without having been empirically tested for its appropriateness (e.g. DeHart et al., 2006; LeBel & Gawronski, 2009). DeHart et al. (2006) assessed the IPT multiple times (every Tuesday and Thursday for 3 weeks) and found that correlations between time points were stronger (∼.60) than correlations between first and last name initials within one time point (∼.36; see above meta–analysis). This further supports the hypothesis that the NLE–first and NLE–last might tap into different parts of implicit self–esteem. Therefore in the present experiment, the calculation of the NLE effect was separated for the initials. To avoid possible reliability issues we used the duplicate administration (Rudolph et al., 2008).
Another measure of implicit self–esteem is the birthday number effect (BNE; Kitayama & Karasawa, 1997; measured with the Number Preference Task: NPT). Similarly to letters, people rate the numbers of their birthday (i.e. day, month) more favourable than other numbers. This BNE has shown stable correlations with the NLE. Based on the same premises, namely that ‘objects’ belonging to or associated with oneself are rated better, the BNE was used seldom, and when it was used, it was often merged with the NLE into one compound measure of implicit self–esteem (e.g. Pelham, Koole, Hardin, Hetts, Seah, & DeHart, 2005). In order to analyse the BNE's qualities as another measure of implicit self–esteem in more detail, participants had also to rate numbers in the present experiment.
To analyse the impact of experimental variations on the IPT and NPT, we also administered further measures to study changes in correlations of IPT and NPT with other implicit (General Name Liking: Gebauer, Riketta, Broemer, & Maio, 2008) and explicit measures of self–esteem (Rosenberg Self–Esteem Scale: Rosenberg, 1965) as well as with an external criterion (Habit Index of Negative Thinking: Verplanken et al., 2007). We used a retest design to analyse the stability of ratings depending on the experimental variations. To rule out any possible influences from culture (see Discussion of Study 1), we aimed for a homogeneous sample (participants from Western culture only).
Employing the D–IPT makes it difficult to experimentally vary the order of presentation of implicit and explicit measures because the first and second administration of the D–IPT should be as far apart as possible in order to avoid memory effects. Although order effects have been found previously (see meta–analysis of Krizan & Suls, 2008), we did not vary the order of presentation.
In a first step, we tried to replicate the findings of our meta–analyses: Do the number of answer options in the rating scales and item wording have an impact on the NLE's effect size and the correlation of NLE–first with NLE–last? For comparative reasons we only analysed the first administration of the D–IPT and used the B–algorithm (Kitayama & Karasawa, 1997).
In a second step, we studied the data in more detail by focusing on the impact of the experimental variations on effect sizes, correlations, and retest reliabilities separately for the BNE, NLE–first, and NLE–last by using the D–IPT and the recommended I–algorithm (Baccus, Baldwin, & Packer, 2004).
Method
Participants
The participants of this study were German–speaking volunteers from the general population (N = 449; 260 women, 189 men) with various occupational and living backgrounds. Participants were on average M = 30.9 years old (SD = 13.7; range: 10 to 82 years).
Materials
Initial preference task (IPT)
The IPT (Kitayama & Karasawa, 1997) was used to assess the NLE. Participants rated the letters A to Z on rating scales. The number of answer options of the ratings scales as well as item wording were experimentally varied (see Design section below). In order to avoid order effects within the IPT, three randomized lists of letters were used.
Number preference task (NPT)
The NPT (Kitayama & Karasawa, 1997) was used as another potential measure of implicit self–esteem which is based on the BNE. As in past research, number ratings were made from 1 to 35 (and not 31) in order to conceal the true purpose of the study (Kitayama & Karasawa, 1997). The number of answer options of the rating scales as well as item wording were experimentally varied as with the IPT. In order to avoid order effects within the NPT, three randomized lists of numbers were used. Because prior research showed that the BNE is only of substantial effect size for the day of birth, we did not calculate the effect for the month of birth (see Kitayama & Karasawa, 1997).
General name liking (GNL)
The GNL (Gebauer et al., 2008) is a single–item measure of global implicit self–esteem showing good validity and retest reliability. Participants were asked ‘How much do you like your name, in total?’ (9–point rating scale; 1: not at all, 9: very much).
Rosenberg self–esteem scale (RSES)
The RSES (Rosenberg, 1965; German translation by von Collani & Herzberg, 2003) is a 10–item self–report scale asking for feelings of self–worth and self–acceptance and thus measuring explicit self–esteem (4–point rating scales; 0: totally disagree, 3: totally agree). Higher values reflect higher explicit self–esteem (α = .85; retest α = .87; retest reliability r = .87).
Habit index of negative thinking (HINT)
The HINT (Verplanken et al., 2007) is a 12–item self–report scale measuring the strength of negative self–thinking (6–point rating scales; 1: totally disagree, 6: totally agree). Higher values indicate more negative thinking (α = .89; retest α = .92; retest reliability r = .85).
Design
A two (item wording: ‘How do you like the following letters/numbers’ vs. ‘How attractive do you find the following letters/numbers’) by three (2–point, 5–point, 9–point rating scale) between–subject design was used. In the literature, the scale endpoints for the attractiveness judgment have been termed differently. Unipolar (beautiful vs. not beautiful) as well as bipolar (beautiful vs. ugly) formats have been used. In order to make the endpoints of the attractiveness judgments more comparable with the unipolar format of the likability wording, we also used the unipolar format for the attractiveness ratings. The scale endpoints were either ‘I dislike it’ vs. ‘I like it’ for the likability of letters/numbers and ‘Not beautiful’ vs. ‘Beautiful’ for the attractiveness ratings of letters/numbers.
Procedure
First, participants were randomly assigned to one of the six experimental conditions. Because the reliability of the IPT can be raised through duplicate administration, the IPT as well as the NPT were administered twice (Rudolph et al., 2008). All materials had to be answered in fixed order. The second administration of the IPT and NPT used a randomized list different from that of the first administration. The experimentally varied item wording was the same for the IPT and NPT within participants. A retest took place one week (±1 day) after the initial test and participants were assigned to the same experimental condition as in the initial test. The retest was complemented by demographic questions including the GNL and initials of the first and last names as well as day of birth.
Analysis
For computing the IPT score, several algorithms exist. The between–subject correction algorithm (B–algorithm: Kitayama & Karasawa, 1997) centres first and last name initial letter ratings around their respective baseline, that is, this algorithm only corrects for the general normative letter liking (i.e. some letters are always better rated than others). The self–corrected algorithm (S–algorithm: Schröder–Abé, Rudolph, Wiesner, & Schütz, 2007) controls for individual response tendencies (i.e. individuals like all letters more or less) by contrasting the ratings on the first and last name initials to the individual mean rating of all non–initial letters, but does not control for general normative letter ratings. The double–correction algorithm (D–algorithm: Gawronski, Bodenhausen, & Becker, 2007) is based on the B–algorithm, but additionally divides the score by the individual mean rating of all letters. However, this algorithm has been found to have poor psychometric properties (i.e. outliers, low internal consistency, skewed distribution of scores; LeBel & Gawronski, 2009). The z–transformed double–correction algorithm (Z–algorithm: De Raedt, Schacht, Franck, & De Houwer, 2006) also intends to control for both the individual response tendencies and the general normative letter liking by using z–transformations, but has neither been found ideal (see LeBel & Gawronski, 2009). The I–algorithm (ipsatized double–correction algorithm; Baccus et al., 2004) also controls for the individual response tendencies and the general normative letter liking of particular letters but ipsatizes letter ratings. This algorithm exhibits the strongest psychometric properties and is therefore recommended (for a systematical validation of all algorithms, see LeBel & Gawronski, 2009). Meanwhile another algorithm, based on a regression approach, has been proposed (R–algorithm: Albers et al., 2009). This algorithm uses the regression weights to estimate the influence of individual response tendencies and general letter liking on initial letter ratings. Unfortunately, the resulting score cannot be interpreted relative to zero (i.e. has no absolute zero point) which makes it impossible to determine whether an overall name letter effect was found. Hence, we decided to use the I–algorithm. 2
Only initial letters were used to compute preference scores, as is now standard practice. The current experiment offered the opportunity to look at the NLE separately for the first and last name initials by averaging the first and second administration. As expected, the correlation between first and second administration was by far stronger (rmean = .77) than the correlation between NLE–first and NLE–last (rmean = .28). A factor analysis (varimax rotation) of the ratings on the first and last name initials and the ratings of the day of birth from all time points (initial and retest) and administrations (first and second administration within each time point) found a three–factor solution. Ratings of the first name initial loaded on the first factor, ratings of the last name initial loaded on the second factor and ratings of the day of birth on the third factor (results omitted). Retest reliability within initial test and retest were all satisfactory (initial test: rtt,NLE–first = .88, rtt,NLE–last = .82, rtt,BNE = .82; retest: rtt,NLE–first = .93, rtt,NLE–last = .86, rtt,BNE = .88). The three–factor solution was stable among different rating scales (2–point, 5–point, or 9–point). This finding further supports the claim that first and last name initials and birthday numbers might reflect different parts of the NLE and BNE and possibly also reflect different aspects of implicit self–esteem.
Data synthesis
For analysing the impact of the experimental variations on effect sizes and correlations, a meta–analytical approach was used (CMA; Borenstein et al., 2009; metafor: Viechtbauer, 2010) by considering each experimental group as a single study in the meta–analysis. 3 Means were transformed into Cohen's d. Correlations were transformed into Fisher's z for analysis and were back–transformed after the analysis (Borenstein et al., 2009). A z test was used for evaluating whether effects differed from zero. In order to judge whether experimental groups differed from each other, the standard statistical test of effect homogeneity across studies (Q test) was used.
Results
First step: Replication of Study 1
The influence of item wording on the effect size was replicated (see Table 3). The results of Study 1 that lower numbers of answer options in rating scales exert stronger effect sizes but weaker correlations between NLE–first and NLE–last were not confirmed. In this follow–up experiment, findings were directionally opposite. The more answer options a rating scale had (5–point, 9–point), the stronger was the effect size (compared with the 2–point rating scale). The correlation between NLE–first and NLE–last was not affected by the number of answer options.
Replication of the meta–analysis (Study 1) using the B–algorithm and single administration in Study 2
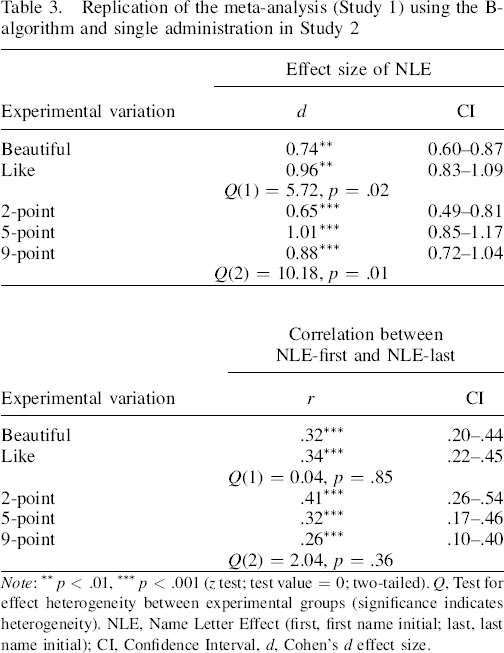
Note: ** p < .01, *** p < .001 (z test; test value = 0; two–tailed). Q, Test for effect heterogeneity between experimental groups (significance indicates heterogeneity). NLE, Name Letter Effect (first, first name initial; last, last name initial); CI, Confidence Interval, d, Cohen's d effect size.
Second step: In search for a more standardized administration of IPT and NPT
Effect size of the NLE and BNE
All effect sizes were significantly different from zero (see Table 4). Experimental variations had only an effect on the NLE–first (all Qs significant). Asking about the likability as well as using more answer options led to significantly stronger effect sizes. Similar results were found for the retest data.
Effect size, retest reliability, and correlations (explicit self–esteem, implicit self–esteem, and external criterion) of the study variables separated for the experimental variations of Study 2
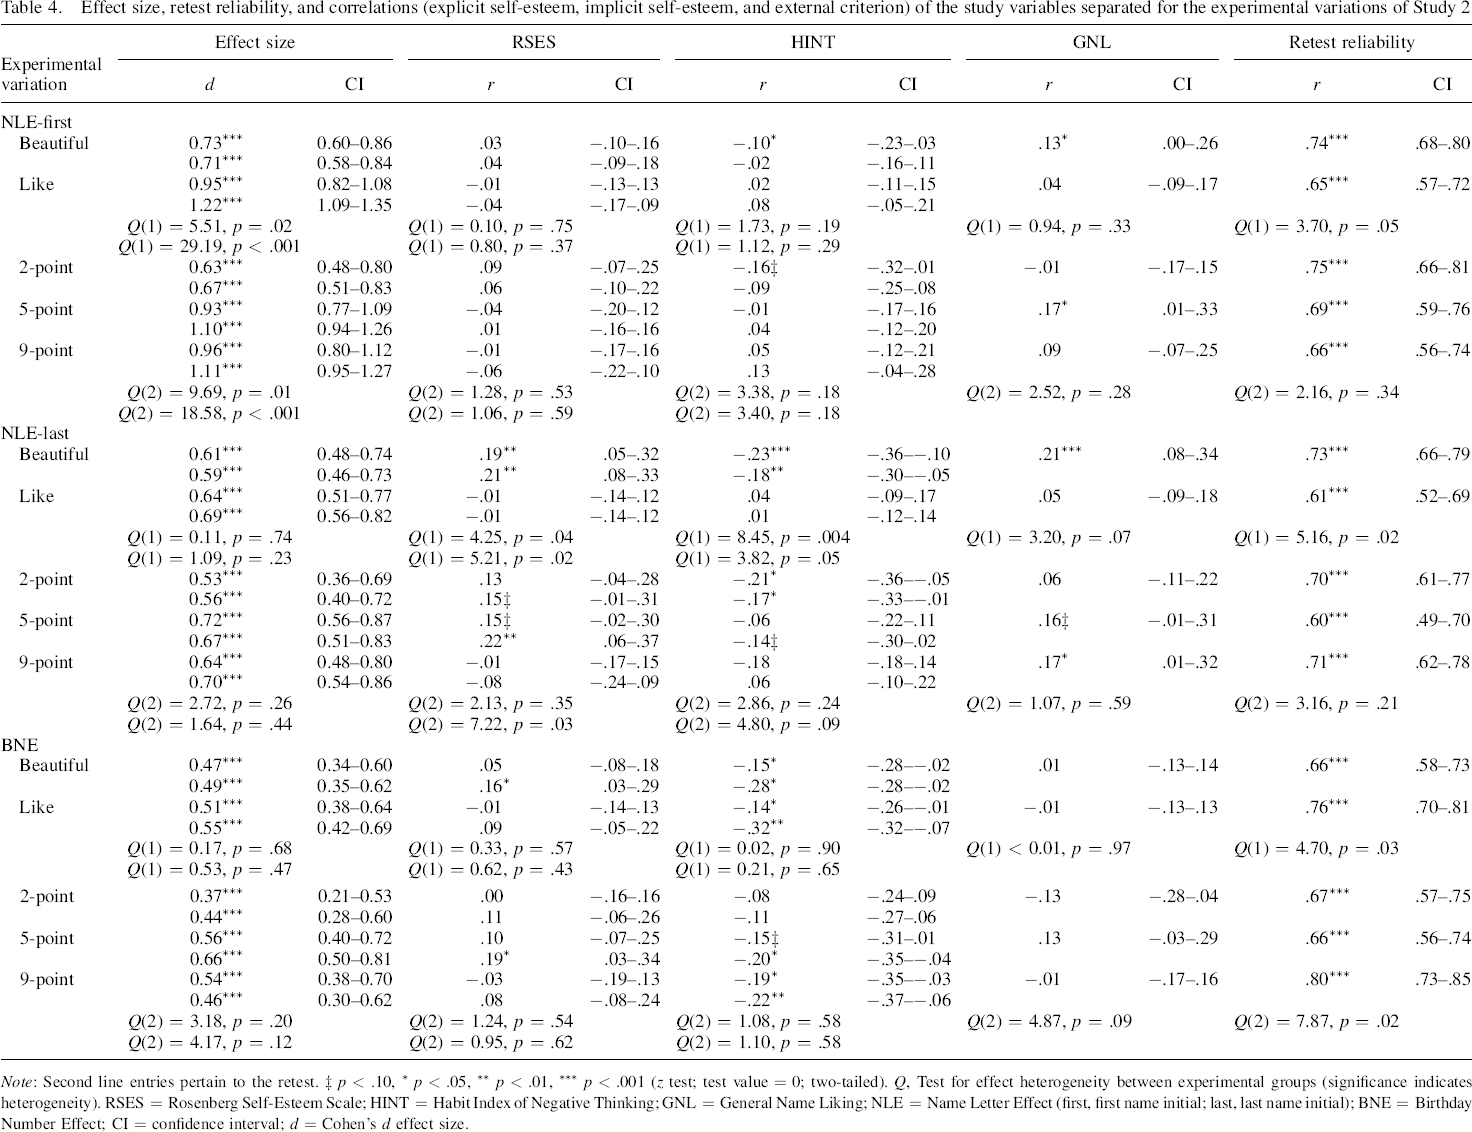
Note: Second line entries pertain to the retest. ‡ p < .10, * p < .05, ** p < .01, *** p < .001 (z test; test value = 0; two–tailed). Q, Test for effect heterogeneity between experimental groups (significance indicates heterogeneity). RSES = Rosenberg Self–Esteem Scale; HINT = Habit Index of Negative Thinking; GNL = General Name Liking; NLE = Name Letter Effect (first, first name initial; last, last name initial); BNE = Birthday Number Effect; CI = confidence interval; d = Cohen's d effect size.
Correlation with the RSES
An impact of the experimental variation could only be found for the NLE–last regarding item wording (both time points) and the number of answer options (retest only).
Correlation with criterion measure HINT
As expected, all significant correlations were negative. Significant correlations were only found for the attractiveness item wording except for the BNE where both item wordings revealed significant correlations. In general, the only experimental variation which showed some influence on the correlation was the item wording on the NLE–last (both time points).
Correlation with GNL
Significant correlations with the NLE were only found for the attractiveness judgment and the 5–point (NLE–first and NLE–last) and 9–point rating scale (only NLE–last). The experimental variations yielded only marginally significant results (item wording on NLE–last and scale type on the BNE).
Retest reliability
All retest reliabilities were moderate to large (range: .60 to .80). Attractiveness item wording led to significantly higher retest reliabilities for the NLE, but lower retest reliability for the BNE. Retest reliability was influenced by scale–type for the BNE (i.e. the 9–point rating scale yielded the highest retest reliability), but not for the NLE. The duplicate administration increased the retest reliability (rfirst = .73; rlast = .72; rday of birth = .76) compared with the single administration (rfirst = .66; rlast = .56; rday of birth = .69) and with Study 1 (based on the B–algorithm: r = .62).
Correlation NLE with BNE
Correlations were significant or marginally significant in the expected direction, except for the attractiveness item wording of the NLE–first (both time points; see Table 5) where no significant correlation was found. Here, the experimental variation of item wording led to a significant difference between attractiveness and likability item wordings on the correlation of NLE–first and BNE. All other experimental variations did not yield significant results.
Correlations of NLE and BNE separated for the experimental variations of Study 2
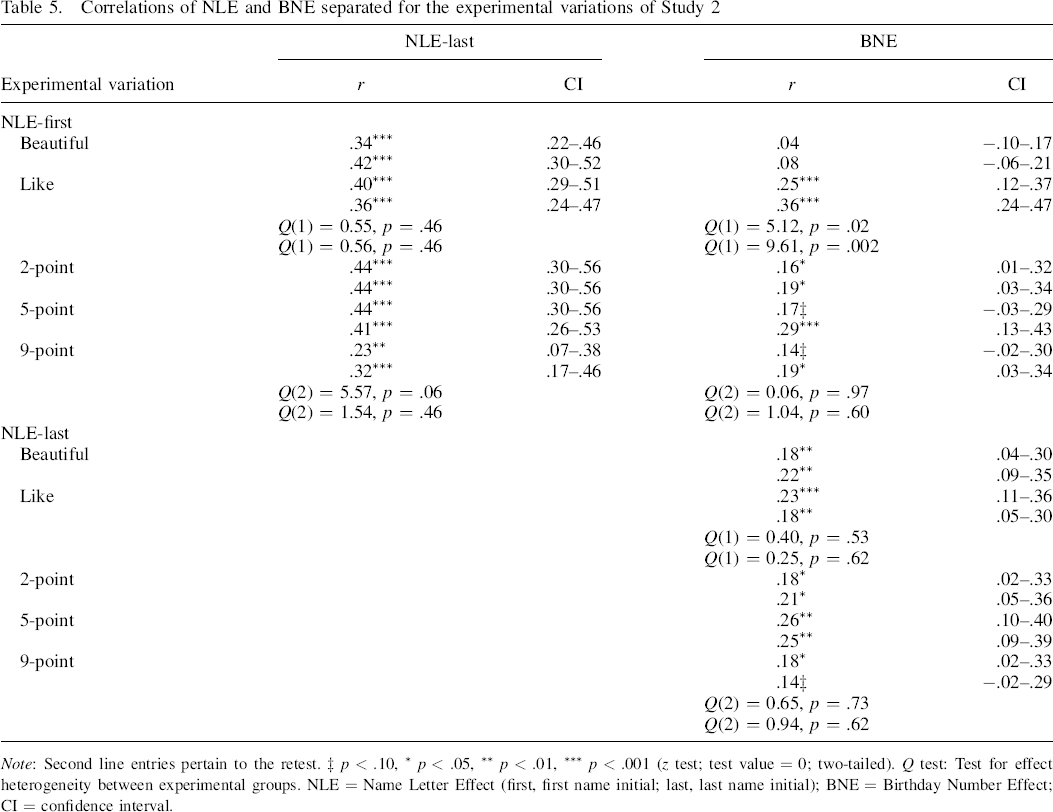
Note: Second line entries pertain to the retest. ‡ p < .10, * p < .05, ** p < .01, *** p < .001 (z test; test value = 0; two–tailed). Q test: Test for effect heterogeneity between experimental groups. NLE = Name Letter Effect (first, first name initial; last, last name initial); BNE = Birthday Number Effect; CI = confidence interval.
Discussion
The findings from Study 1 were only replicated for item wording. Rating letters regarding likability produces a stronger effect size than regarding attractiveness. However, the effect of the number of answer options of the rating scale was not. Although the number of rating scale options did influence the effect size of the NLE, there was no clear direction of the effect. The 2–point rating scale revealed the lowest effect size whereas the 5–point and 9–point rating scales found similarly strong effect sizes (d = 1.01, 0.88, respectively) which were also similarly to the overall effect found in the meta–analysis (d = 0.99). It seems as if 2–point rating scales are special because they might rather tap into qualitative aspects than quantitative ones, have reduced variance because of the reduced amount of answer options, and cause the feeling of forcing the participant to choose between just two options. If these aspects are really in charge for the lower effect size of the 2–point rating scale, it can be said that the amount of answer options generally had no effect on the effect size of the NLE and BNE.
Furthermore correlations between NLE–first and NLE–last were unaffected by the rating scale type which is inconsistent with the finding of the meta–analysis on the correlation between NLE–first and NLE–last where the 5–point and 6–point rating scale exhibited significantly lower correlations compared to the 7– and 9–point rating scale. In the meta–analysis, 5–point and 6–point rating scales were exclusively used by one group of researchers who predominantly recruited mixed–cultural samples. This invites the interpretation that the effect of stronger effect sizes and lower correlations between NLE–first and NLE–last with rating scales of less answer options is rather due to other potential moderators which could not be accounted for in the meta–analyses (e.g. cultural influences). Such a finding would be especially interesting because if cultural influences are indeed responsible for the found effect this would mean that the NLE (and maybe also implicit self–esteem) is sensitive to culture.
Study 2 yielded a lot of further findings: Using a duplicate administration (i.e. D–IPT; Rudolph et al., 2008) maintained good reliability, hence, the NLE was calculated separately for the first and last name initials (NLE–first, NLE–last). 4 The NLE was stronger on the first name initial than on the last name initial (see also DeHart et al., 2006) and the BNE revealed the weakest effects (see Kitayama & Karasawa, 1997), which is in line with past research. Correlations of NLE and BNE with explicit self–esteem were predominantly non–significant, which is also in line with past research (e.g. Krizan & Suls, 2008), but were significant for the NLE on the last name initial when using the attractiveness item wording. This might indicate that using the NLE on the last name initial and using an attractiveness item wording is a measure of personal implicit self–esteem but this needs further validation.
Furthermore, results replicated and extended already known effects. The HINT as an external criterion measure has been found to correlate negatively with implicit self–esteem (Verplanken et al., 2007: In Study 6 the correlation was r = −.17 using an attractiveness item wording and using the mean between IPT and NPT). We could replicate this finding and extend it: The correlation was only found for the attractiveness but not for the likability item wording; with the exception of the BNE, where the correlation was apparent for both item wordings. The GNL has been found to correlate with the NLE (Gebauer et al., 2008; attractiveness item wording: r = .30). Again, this finding refers only to the attractiveness item wording of the NLE–first and NLE–last, but not to the BNE.
In general, effects of item wording were more pronounced than effects of different rating scales. An issue which might have influenced correlations could be the ‘structural fit’ between the measures: As test formats become more similar in structure, correlations between implicit and explicit measures tend to increase (Payne, Burkley, & Stokes, 2008). In the current study, the correlation between RSES (4–point rating scale) was only significant for the 5–point rating scale (retest of NLE–last and retest of BNE), but not for the 9–point rating scale. The same effect emerged for the correlation between implicit measures. The GNL uses a 9–point rating scale and correlations were either found for the 5–point or 9–point rating scales, but not for the 2–point rating scale. The IPT and NPT used the same scale type within each participant; as can be seen from Table 5, all scale types yielded significant correlations between IPT and NPT. Only with the HINT we found mixed results, that is, no effect of ‘structural fit’ was observable.
Limitations
In the present study, only differences in effect sizes and correlations of NLE and BNE were analysed. Although some effects might be due to Type I error because of the amount of statistical tests, we think the overall picture of meaningful differences between name initials and birthday numbers remains. However, further research needs to examine whether these differences also reflect differences in implicit self–esteem because variations in measurement outcome can also be due to changes in error variance (see Mierke & Klauer, 2003). Hence, an increased effect size on the NLE might be caused by reduced error variance and not because of tapping into a different aspect of implicit self–esteem (for a discussion, see De Houwer et al., 2009; Gawronski, LeBel, Peters, & Banse, 2009).
As has been already stated above, we did not control whether there were differences between experimental groups in the degree of awareness of the studies purpose or not. However, we do not think that this has affected the results because all instructions were the same except likability/attractiveness item wording variation. It could be that attractiveness judgments are less self–focused than likability judgments (I like letter ‘A’ vs. letter ‘A’ is beautiful). If this is really the case, attractiveness judgments possibly better conceal the real purpose of the task. Future research needs to address this in more detail.
General Discussion
The IPT is one of the most frequently used measures of implicit self–esteem. Thus it is surprising that only a few studies have investigated the IPT from a test–theoretical point of view (Albers et al., 2009; LeBel & Gawronski, 2009; Sakellaropoulo & Baldwin, 2007). From the present meta–analytic and experimental evidence, the following can be recommended: (1) Separating the NLE into the effect on the first and last name initial and additionally including the NPT (for measuring the birthday effect) might be promising avenues for future studies. (2) To guarantee satisfying reliability, a duplicate administration should be used. (3) Asking for the likability or attractiveness of letters or numbers might also reflect different facets of implicit self–esteem.
If individual differences are the focus of research, it might make sense not to go for a composite score of measures of implicit self–esteem (i.e. mean between NLE–first and NLE–last or even BNE) as has been predominantly applied in past research but to differentiate between different facets of implicit self–esteem to provide a more nuanced picture of implicit self–esteem. This is in line with the findings of past research that at least two different aspects of implicit self–esteem exist. Sakellaropoulo and Baldwin (2007) found some support that implicit self–esteem might be separated in at least two dimensions: Self–liking and self–attractiveness. Whereas the liking of letters may reflect the degree to which individuals accept themselves, the attractiveness of letters might mirror the degree individuals admire themselves. Bosson et al. (2000) already found that different implicit measures of self–esteem where hardly correlated, suggesting that these implicit measures might tap into different aspects of implicit self–esteem.
The current study adds to the growing understanding of implicit self–esteem as a probably multi–faceted construct by revealing different explicit and implicit correlations (Back, Krause, Hirschmüller, Stopfer, Egloff, & Schmukle, 2009). Some support for the recommendation using the NLE separately for the first and last name initial has been already found when analysing interactions of explicit and implicit self–esteem. In line with past research, participants under psychological distress show self–esteem discrepancies (i.e. high explicit and low implicit (fragile self–esteem) or low explicit and high implicit self–esteem (damaged self–esteem); e.g. Jordan, Spencer, & Zanna, 2003). Damaged self–esteem has been, for example, found for participants with high scores on Internet Addiction but only when using the NLE on the first name initial (and not the last name initial) as a measure of implicit self–esteem (Stieger & Burger, 2010). Furthermore, participants using a self–defeating humor style not only exhibit low explicit self–esteem but also high implicit self–esteem (constituting damaged self–esteem) but again only when using the NLE on the first name initial (Stieger, Formann, & Burger, 2011). This supports the assumption that the found differences in effect sizes and correlations in Study 2 are not only due to differences in method–specific variance, but also because of differences in implicit self–esteem. Using the recommended new administration might therefore be advantageous for future studies on implicit self–esteem.
Further methodological aspects
From a methodological point of view it is important to mention that the outcomes of the IPT and NPT depend on the sample (i.e. size, degree of heterogeneity). When calculating the effect with the I–algorithm, a baseline is used which is calculated from the ratings of all the other participants in the sample. This baseline reflects the overall likability of letters or numbers (e.g. the letter ‘Z’ is always less liked than the letter ‘A’). The larger the sample, the more stable the baseline will be. The more demographically heterogeneous the sample is, the more likely it is that the found baseline will reflect the ‘real’ baseline. This procedure itself produces some error variance which cannot be addressed by using superior algorithms. For that reason, researchers should aim for appropriate sample sizes.
Furthermore, it has become common practice in all the algorithms proposed for analysing the NLE to focus on the initial letters but not to use the remaining name letters which also show an (although attenuated) NLE. Recently, Gregg and Sedikides (2010) found that including all name letters might indeed make a difference. They found an expected correlation with narcissism only when including all name letters—this correlation disappeared when using only the initial letters. Future research might reevaluate this aspect by using all name letters for measuring implicit self–esteem.
A further still underinvestigated methodological aspect is how to conceal the real purpose of the IPT and NPT. Krizan (2008) showed that some participants became aware of the task's underlying purpose revealing a higher NLE compared to unaware participants. Thus, future research might develop more elaborated instructions or including task irrelevant judgments (e.g. ASCII symbols, see Gregg & Sedikides, 2010).
Conclusion
To sum up, there is evidence that the degree to which people like their first and last name initials is related to different psychological aspects and might therefore also affect the measurement of implicit self–esteem through the NLE. We think that following the more elaborated administration described above (duplicate administration; separated effects for first and last name initials and of day of birth; different item wordings) opens new possibilities for assessing implicit self–esteem in a more differentiated manner.
Footnotes
Acknowledgements
Authors thank Michael Borenstein, Kristin Mitte and Christoph Burger for their helpful comments and Wolfgang Viechtbauer for providing the R–package metafor.
1
Sometimes the term ‘Name Letter Test’ is used instead of IPT. However, because the procedure is described more adequately as a task than as a test and because it predominantly uses only the initial letters, and not all the name letters we think the term Initial Preference Task reflects the measurement procedure more accurately.
2
For comparative reasons, analyses were also performed with the D–, S– and Z–algorithm without finding any substantial differences in correlations.
3
Because we were interested in differences in effect sizes (d, r), analyses are based on a meta–analytic approach rather than a standard approach (e.g. ANOVA).
4
It should be noted, that a separation of the NLE for first and last name initials only makes sense for individuals with different first and last name initials.