
Abstract
We linked seven–year–old children's personality (n = 406), as rated by both teachers and parents, to a wide array of cognitive ability measures. Besides (i) providing descriptive data on the associations between childhood personality and cognitive ability, we (ii) investigated the benefits of having multiple informants provide personality ratings and (iii) examined the recent proposition that the general factor of intelligence be partialled out of associations between personality and narrower domains of intelligence. In a regression model, the shared variance of teacher and parent ratings of personality explained 14% of the variance of cognitive ability. Both teacher and parent ratings of Openness to Experience (O) were positively associated with cognitive ability, and both explained unique variance in cognitive ability. Moreover, the associations were stronger the stronger the inter–rater agreement on O. When the unique variances of each perspective and the moderating effect of inter–rater agreement were added to the aforementioned regression model, personality explained 18% of the variance of cognitive ability. Controlling for the general factor of intelligence caused the correlations between personality and performance on the specific cognitive ability measures to diminish to near zero. Copyright © 2011 John Wiley & Sons, Ltd.
Introduction
Despite the recent increased interest in childhood personality, there is still very little research on how early childhood personality is linked to other important individual differences. The present study begins to fill this gap in our knowledge by linking seven–year–old children's personality to various measures of cognitive ability. Besides (i) providing descriptive data on the associations between childhood personality and cognitive ability, the present research (ii) sought to investigate how data from multiple informants (in this case, parents and teachers) could be optimally utilized, in addition to (iii) contributing to the recent debate (Reeve, Meyer & Bonaccio, 2006; von Stumm, Chamorro–Premuzic, Quiroga & Colom, 2009) on whether the general factor of intelligence should be controlled for when investigating the associations between personality and narrower domains of intelligence.
Personality and cognitive ability in adulthood
The present research is conducted within the Big Five framework of personality structure. Because of a lack of previous literature on early childhood Big Five factors and cognitive ability, we first review some of the result obtained with adult samples. Although the essential connectedness of cognitive ability with individual differences in temperament and character traits was taken for granted by many of the most eminent psychologists of the previous century (e.g. Cattell, 1957; Thorndike et al., 1921; Wechsler, 1943)—with some even raising the question of whether the external correlates of personality tests result from their common associations with cognitive abilities (Mischel, 1968)—reviews of the empirical evidence have suggested only weak relations between personality and cognitive ability (Ackerman & Heggestad, 1997; Eysenck, 1994). In terms of the Big Five personality factors, Openness to Experience (O) has revealed the most consistent positive relations with cognitive ability (e.g. McCrae & Costa, 1997; Moutafi, Furnham & Crump, 2003; Zeidner & Matthews, 2000), but even these associations have at best been modest in size.
Regarding personality factors other than O, the findings have been more inconclusive and inconsistent. Although a meta–analysis by Ackerman and Heggestad (1997) indicated that Conscientiousness (C) was not related to intelligence, a number of more recently conducted studies have suggested a negative correlation between C and cognitive abilities (e.g. Allik & Realo, 1997; Moutafi, Furnham & Paltiel, 2005; Moutafi et al., 2003). High C has been suggested to develop in an academically competitive environment to compensate for disadvantages in cognitive ability (Moutafi, Furnham & Patiel, 2004).
Perhaps most discordant are the results for Extraversion (E): whereas some studies have reported E to be positively associated with cognitive ability (for a review, see Ackerman & Heggestad, 1997), others have reported the opposite pattern (e.g. Moutafi et al., 2003; Moutafi et al., 2005). Extraverts have been suggested to do better on short and speeded tests and introverts to do better on low–arousal tasks (Bates & Rock, 2004), but the evidence is still inconclusive (Moutafi et al., 2005). A recent meta–analysis suggested that one of the reasons for the inconsistent results could be that the relations between E and cognitive ability may change when employing different measures of E (Wolf & Ackerman, 2005). However, it seems clear that adulthood E is at best only weakly related to cognitive ability.
Neuroticism (N), although most likely not related to cognitive ability per se, may be related to performance on measures of cognitive ability: Moutafi, Furnham, and Tsaousis (2006) showed that N may lead to heightened anxiety in the test–taking situation, and this may impair performance. Agreeableness (A) appears also to be unrelated to cognitive abilities (e.g. Ackerman & Heggestad, 1997; Eysenck, 1994; Moutafi et al., 2005; cf. Allik & Realo, 1997). In sum, the aforementioned literature suggests that O is modestly related to adulthood cognitive ability, with other personality traits showing weak and inconsistent relations.
Personality and cognitive ability in younger age groups
Early childhood personality has recently started to attract more research attention. There is now growing evidence that early childhood individual differences share many of the defining characteristics of adult personality, such as temporal stability (Measelle, John, Ablow, Cowan and Cowan, 2005), cross–observer consensus (Lönnqvist, Verkasalo, & Vainikainen, 2011) and Big Five factor structure (Barbaranelli, Caprara, Rabasca, & Pastorelli, 2003; Mervielde, Buyst, & De Fruyt, 1995).
Although it now seems clear that childhood individual differences can be meaningfully described in terms of personality traits, there is very little research that would link childhood personality traits to other individual differences, such as cognitive ability. One complication in deriving hypotheses regarding such links is that the few results that do exist for younger age groups are not consistent with those found in adult samples. Although O is clearly the most important trait regarding the associations between adult personality and cognitive ability, the same may not be true in a sample of seven–year–olds. Allik, Laidra, Realo, and Pullmann (2004) reported on correlations between personality and cognitive ability in samples of 12–, 14–, 16– and 18–year–olds. In the youngest age group, cognitive ability was correlated, in order of magnitude, with high C (r = .20), O, A, E and low N (r = −.12). However, the correlations decreased rather uniformly with age; until in the oldest age group, only O was associated with cognitive ability. Extrapolating this trend into early childhood would suggest that not only O but also other Big Five traits may be associated with the performance of seven–year–olds. Furthermore, opposite to what has been found in adult samples, high C may in childhood be related to higher levels of performance on measures of cognitive ability.
Not only may other traits be as relevant as O regarding the associations between seven–year–old children's personality and cognitive ability, but some results suggest that O may not even be related to cognitive ability in this age group. A study by Markey, Markey, and Tinsley (2004) on 10–year–old children suggests that O may not be a very meaningful construct in samples of pre–adolescents. They videotaped a child–parent interaction and correlated observer ratings of the child's behaviours with mother ratings of personality. O was the only trait not related to children's behavioural manifestations, and the researchers concluded that O ‘is not relevant for understanding children's personalities’ (Markey et al., 2004, p. 430). Furthermore, several behaviours that could be judged to reflect cognitive ability, such as ‘shows a wide range of interests’, ‘shows an interest in intellectual or cognitive matters’ and ‘exhibits a high degree of intelligence’, were negatively correlated with mother ratings of O (r's ranging from −.15 to −.22). One reason for the discrepant findings between the studies by Allik et al. (2004) and Markey et al. could be that although both assessed personality with the NEO Five–Factor Inventory (Costa & McCrae, 1992), Allik et al. used Raven's Standard Progressive Matrices (Raven, Raven, & Court, 2000) as their measure of cognitive ability, whereas Markey et al. correlated the personality scores with observer ratings of an interaction sequence between mother and child.
In sum, previous research on children's personality and cognitive ability suggests that other personality factors may be as relevant as O and even hint at the possibility that O, perhaps the only personality traits consistently associated with adult cognitive ability, may not be associated with cognitive ability in early childhood.
Shared and unique variances in ratings of personality
The exact age at which children can respond to self–report questionnaires is unclear. Some studies have suggested late childhood (Barbaranelli et al., 2003), whereas others have suggested that the abilities required to respond to self–report personality questionnaires are not fully developed before mid–adolescence (e.g. Allik et al., 2004). In any case, it is clear that for personality ratings of young children, researchers must employ sources other than self–ratings. This may not constitute a problem, as other–ratings have, even in adult samples, been argued to be preferable to self–ratings for many purposes (e.g. Hofstee, 1994; Vazire, 2010). However, as different sources may have different response biases (parents could, for instance, idealize their child; Murray, Holmes, & Griffin, 1996) and will observe the child in different contexts (e.g. home, school), thus having access to different information on which to base their judgments, they may have differential validity regarding their ratings’ associations with cognitive ability (e.g. Kraemer et al., 2003; Mount, Barrick, & Strauss, 1994).
The most typical way of treating personality ratings from multiple informants may be to combine the information across informants. For instance, Kraemer et al. (2003) have suggested first collecting data from various contexts and perspectives, and then, to obtain a valid and reliable measure, extracting from such data the variance common to all informants. Another approach to data from multiple informants is to focus on the unique perspectives provided by each informant. For instance, when assessing work performance, the perspectives of superiors, peers and subordinates are generally not aggregated, as each perspective is thought to contribute specific information not available when viewing the person from the other perspectives (see, e.g. Conway & Huffcutt, 1997; Lönnqvist, Paunonen, Nissinen, Ortju, & Verkasalo, 2011).
Related to the issue of multiple informants is the question of whether agreement between raters could be utilized to indicate the usefulness of the ratings. Agreement between two raters is a necessary (although insufficient) precondition of the correctness or accuracy of their ratings—two raters cannot disagree and both be accurate (although they could agree and both be wrong). Therefore, strong agreement between raters could sometimes indicate more useful ratings. According to Funder's (1995) Realistic Accuracy Model, designed to explain how the attributes of others can be evaluated accurately, there are at least four possible moderators of accurate judgement: properties of the judge, target, trait and information. The last two are less relevant in the present context: we do not intend to compare absolute levels of accuracy or agreement between traits (for such comparisons, see Lönnqvist et al., 2011), and the quantity and quality of information that teachers and parents have at their disposal is likely to be quite similar across children. This leaves the judge and the target as possible moderators. Some parents could, because of their personal characteristics, rate their child more consistently with how the child's teacher rates the child. Such heightened agreement, caused by characteristics of the judge, would not be expected to indicate more useful ratings. By contrast, heightened agreement caused by the characteristics of the target could be a sign of more useful ratings. If the target emits more relevant behaviours (e.g. whether the child does or does not get involved in make–believe games, or does or not discuss intellectual ideas, could be observable cues utilized to rate O) across school and home contexts, then teachers and parents are more likely to agree on the attributes of the child. It seems straightforward to assume that the behaviour of those children who are more consistent in their expressions of trait–relevant behaviours across home and school contexts should be easier to predict also in other trait–relevant contexts. For some traits, the cognitive ability test may be such a trait–relevant context. We therefore expected the agreement between raters to moderate the strength of the association between personality traits and cognitive ability. Such a result would indicate that it is indeed the characteristics of the target that moderate the agreement between teacher and parent ratings, and not, for instance, the characteristics of the judge.
General and narrow variances of cognitive ability
One of the reasons that prior research on the relations between personality and cognitive ability has provided somewhat mixed results could be that such relations have been distorted by failure to separate general and narrow variances of intelligence (Reeve et al., 2006). More specifically, Reeve et al. (2006) argued that some specific associations between personality and narrow domains of intelligence will be overestimated and others underestimated because of the confounding effects of general intelligence. This claim has been backed by the comparison of distinctive (general intelligence controlled for) and traditional (general intelligence not controlled for) correlations between personality and narrow domains of intelligence. However, as noted by von Stumm et al. (2009), the distinctive correlations that Reeve et al. reported on were computed using structural equation modelling and thus disattenuated for measurement error, whereas the traditional correlations were not. In an attempt to replicate the study by Reeve et al., (2006) but computing the distinctive and traditional correlations in a way that enabled fairer comparison, von Stumm et al. (2009) mostly failed to find similar patterns of underestimation and overestimation of the associations between personality and intelligence as those reported on by Reeve et al. (2006)
The relations between personality and distinctive aspects of cognitive ability have not been investigated with children. Furthermore, as prior results on this topic are inconsistent and as our measures of cognitive ability have not been properly related to the intelligence taxonomies used by either Reeve et al. (2006) or von Stumm et al. (2009), we refrained from postulating any hypotheses regarding distinctive and traditional correlations between personality and cognitive ability.
Present research
Although adulthood personality has been consistently related to high O (e.g. McCrae & Costa, 1997), results obtained with adolescents suggest that not only high O but also high C, E, A and low N may be associated with younger age groups’ performance on cognitive ability measures (Allik et al., 2004). Furthermore, O may not even be associated with childhood behaviours (Markey et al., 2004). Because of such discrepancies in previous research, we were hesitant to make any very specific predictions about the exact relations between personality and cognitive ability in the present sample of seven–year–olds.
Regarding the different perspectives offered by parents and teachers, we were interested in examining to what extent the shared and unique variances of teacher and parent ratings could contribute to explaining the personality–related variance of cognitive ability measures. Related to this, we expected the agreement between raters to moderate the strength of the associations between trait ratings and cognitive ability, with stronger associations for those children on whose personality raters agreed.
Considering the mixed results reviewed previously, we had no expectations regarding the differences between the traditional versus distinctive correlations between personality and cognitive ability.
Method
Participants and procedure
Schools
The study, in which a total of 744 students from 40 classes in 16 schools took part, was conducted in cooperation with the Education Department of Helsinki (for more details, see Lönnqvist et al., 2011). The children completed a battery of cognitive tests, whereas their parents and teachers completed a battery of questionnaires. To avoid fatigue, the children completed only one cognitive test per day, and the tests were always administered at the beginning of class, after which regular school work continued. Most tests took around 15 minutes, with the exception of the analogy task (see succeeding discussion) that took around 30 minutes. Cognitive ability measures were available for 735 to 744 children, depending on the measure.
Teachers
The teachers could use class time to complete the personality questionnaires (a substitute was provided for the time it took to complete the ratings). The Education Department arranged this opportunity to motivate teachers and to compensate for the work load involved in rating all of one's pupils. In all, teacher ratings of 594 children by 31 teachers were obtained (for details, see Lönnqvist et al., 2011). As the teacher ratings were not independent (each teacher that returned ratings had rated an average of 19 children), we eliminated differences in response biases by centring, within teachers, scores on each of the personality factors, before conducting any analyses (this procedure assumes that the children did not, in fact, differ on average personality traits across the 31 classes, an assumption backed by the parent ratings: six one–way ANOVAs, one for each personality trait, were run to examine whether the parent ratings of personality differed across classes, all F < 1.3, non–significant).
Parents
Parents were primarily administered the questionnaire by their child's teacher at a regular parents’ night. For those who did not attend, the questionnaires were sent home. The questionnaires were then returned to the teachers. Personality ratings were obtained for 622 children out of the 744 possible (for details, see Lönnqvist et al., 2011). We had a total of 458 children from 31 classes for whom both teacher and parent ratings were available, but we further restricted our analyses to those children who reported Finnish as their first language (the cognitive ability tests were always administered in Finnish), giving us a final sample size of 406 children [216 girls, 190 boys; mean age = 6.9 years (SD = 0.37)].
Personality measure
Both teachers and parents rated the child on 27 personality descriptive items (see Table 1 in Lönnqvist et al., 2011, Table 1) by using a scale from 1 (not at all true) to 7 (completely true). For the present analyses, we used previously obtained factor scores of Neuroticism, Extraversion, Openness to Experience, Pro–sociality, Antagonism and Conscientiousness (for more details, see Lönnqvist et al., 2011). Note that Big Five Agreeableness splits into two separate factors: Pro–sociality and Antagonism. The two highest loading items on each factor were as follows: Neuroticism: ‘She remains calm even in stressful situations’ (reverse scored) and ‘She easily becomes nervous’; Extraversion: ‘She is good at asserting herself’ and ‘She states her opinions even when others disagree’; Openness to Experience: ‘She is curious and eager to find out about things’ and ‘She is inventive, and has a lot of good thoughts’; Pro–sociality: ‘She often helps others’ and ‘She is helpful and considerate’; Antagonism: ‘She is stubborn and is easily drawn into arguments’ and ‘She quarrels and fights’; and Conscientiousness: ‘She is careless’ and ‘She gets her work done effectively’. In both teacher and parent ratings, all internal consistency reliabilities were between .76 and .80, except the teacher rating of Neuroticism, which showed poor internal consistency (.52). The cross–observer consensus correlations were, in the present sample of 406 children, .15, .42, .22, .19, .44 and .43, for ratings of N, E, O, Pro–sociality, Antagonism and C, respectively (see Table S1 in the supporting information for all inter–correlations between teacher and parent ratings; for more information and comparison of teacher with parent ratings, see Lönnqvist et al., 2011).
Descriptive statistics and inter–correlations for the cognitive ability measures (n = 406)
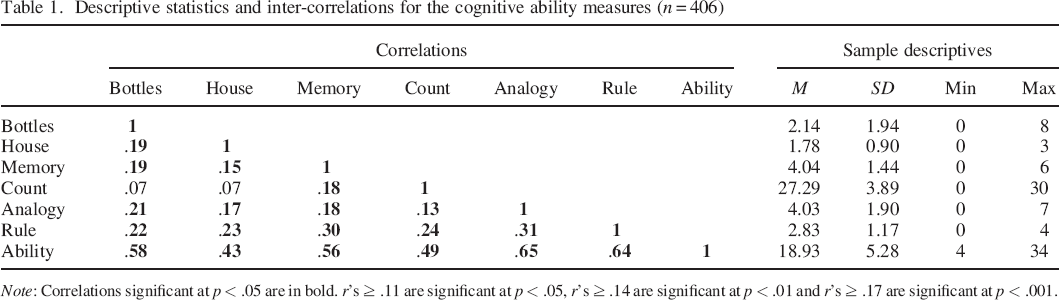
Note: Correlations significant at p < .05 are in bold. r's ≥ .11 are significant at p < .05, r's ≥ .14 are significant at p < .01 and r's ≥ .17 are significant at p < .001.
Cognitive ability measures
Spatial reasoning
The Bottles and Draw a House tasks were modification of the classical Piagetian tasks for spatial reasoning (Hautamäki, 1984; Piaget & Inhelder, 1956). In the Bottles task, a page with pictures of eight empty bottles was presented to participants. One of the bottles was standing, and the rest of them were inclined 45°, 90°, 135°, 320°, 270°, 225° and 180° from the horizontal, respectively. Participants were instructed to draw the line indicating the water level when the bottle is half full, as well as fill out the area where the water is. The eight bottles were scored on a pass–fail basis (0 or 1 point). All measures were scored by trained experts from the Education Department. A rather similar version of this task was used in a study conducted by Demetriou and Kazi (2006).
In the House task, participants were instructed to draw a house and several trees on a fixed curved line depicting a hill. The drawings were coded on a scale from 0 to 3 for development of the horizontal–vertical scheme. The drawing was coded 0 if some of the objects were not drawn on the hill, 1 if all the objects were placed on the hill but in a 90° angle from the curved line, 2 if some of the objects were drawn correctly and some in a 90° angle and 3 if all of the objects were drawn vertically correct.
The spatial reasoning tasks were the only tasks for which normative data were available; all other tasks have been slightly modified since the publication of the normative results in 2001, and new norms are not yet available. In the report based on the normative data set (n = 1983; Hautamäki et al., 2001), scores on the Bottles and House tasks were summed to create an index of spatial reasoning (individual scores for these two tasks are not presented), and the sum score was 3.9 (SD = 1.4). This is the same sum score that we obtained when summing the two tasks, suggesting that our sample was quite representative of the population in general. This is at least true regarding visuospatial aspects of cognitive ability, and there is no reason to suppose that other aspects of cognitive ability would differ in this regard.
Working memory
Working memory is perhaps most typically understood as comprising two domain–specific slave systems, the visuospatial sketchpad and the phonological loop, as well as a central executive that regulates the functioning of these systems (Baddeley & Hitch, 1974). The capacity of the visuospatial sketchpad was assessed by the Memory task. The Memory task was originally developed by Wilson, Scott, and Power (1987) and modified by Logie and Pearson (1997). In this task, participants were presented with six grids of different sizes. In each grid, some of the squares were painted black. After being shown a grid for three seconds, participants were asked to reproduce the figure they just saw (colour the correct squares) in a beforehand given empty grid of the same size. The grids were scored on a pass–fail basis (0 or 1).
The Count task measured participants’ short–term auditory memory. The teacher tapped on the desk with a pencil, knuckle or palm, and the subjects had to write down how many knocks they just heard. Participants were presented with 30 series of 1–5 taps in total. Each series was coded on a pass–fail basis (0 or 1). As both the Memory and Count tasks could be considered measures of rather elementary cognitive tasks, without much involvement of the central executive, both tasks could also be interpreted as measures of short–term memory.
Analogical reasoning
In the Analogy task, analogical reasoning skills were assessed by a task adapted from a geometric analogies test (Hosenfeld, van den Boom, & Resing, 1997). Participants were first presented with two geometric figures. One of the figures was a transformation of the other. The possible transformations were adding an element, changing size and position, and halving and doubling the number of elements. The maximum number of transformations was three. Whilst constantly being allowed to look at the original pair of figures, the participants’ task was to pick a pair for a third geometrical figure. This pair was to be picked from five different options, applying those same transformations to the third figure that were required to change one of the figures in the original pair into the other. For instance, for the first task, participants were presented with one large and one small square (original pair) and, as a third figure, a small circle. Their task was then to pick a large circle out of the five presented options. There were seven such tasks, each graded on a pass–fail basis (0 or 1).
Following instructions and understanding the rule
In the Rule task, participants were to draw a path on an empty 12 × 5 grid according to the teacher's instructions. The path they were to draw was dictated one step at a time [e.g. first take two steps forwards… then two steps towards the sun (the sun was pictured on the right side of the grid)]. Halfway through the grid, the teacher stopped giving instructions, and the participants were to continue drawing the path according to the regular pattern that the teacher's instructions had established. There were four grids, each scored on a pass–fail basis (0 or 1).
Summary index
To summarize the results of the cognitive ability measures, we used the official summary index developed by the Education Development Centre. The Ability index was computed as the sum score of all six cognitive ability measures, with scores on the Count task, originally ranging from 0 to 30, being rescaled to range from 0 to 6. This index was correlated r = .94 with the first factor extracted in principal axis factoring of the sum scores on the six measures of cognitive ability [this factor accounted for 33.4% of the variance of the ability tests; for comparison purposes, in the Italian, Spanish and American standardization samples of the Wechsler Intelligence Scale for Children—Revised (perhaps the most popular and widely researched test of children's intelligence; Wechsler, 1974)], the first factor accounted for .28, .28 and .40 of the variance, respectively (Juan–Espinosa, Garcia, Colom, & Abad, 2000). All results were virtually identical regardless of whether the analyses were run using the Ability index or the first extracted factor.
Results
The means, standard deviations and inter–correlations of the cognitive ability measures are shown in Table 1. The means do not indicate the presence of ceiling or floor effects, and the standard deviations also look reasonable. All of the correlations shown in Table 1 are positive, and almost all of them are statistically significant. However, they are quite modest in size, with r = .31 (between Bottles and Analogy tasks) being the strongest correlation between the two individual measures.
Table 2 shows the traditional correlations between the cognitive ability measures and the teacher and parent ratings of personality, as well as a compound personality measure derived from these two sets of ratings. Following Kraemer et al. (2003), this compound measure was constituted by the first component extracted in a principal component analysis into which both teacher and parent ratings were entered (the first component explained 57.3%, 70.8%, 61.2%, 59.5%, 72.2% and 71.3% of the total explained variance of the ratings of N, E, O, Pro–sociality, Antagonism and C, respectively).
Traditional correlations between personality traits and cognitive ability measures (n = 406)
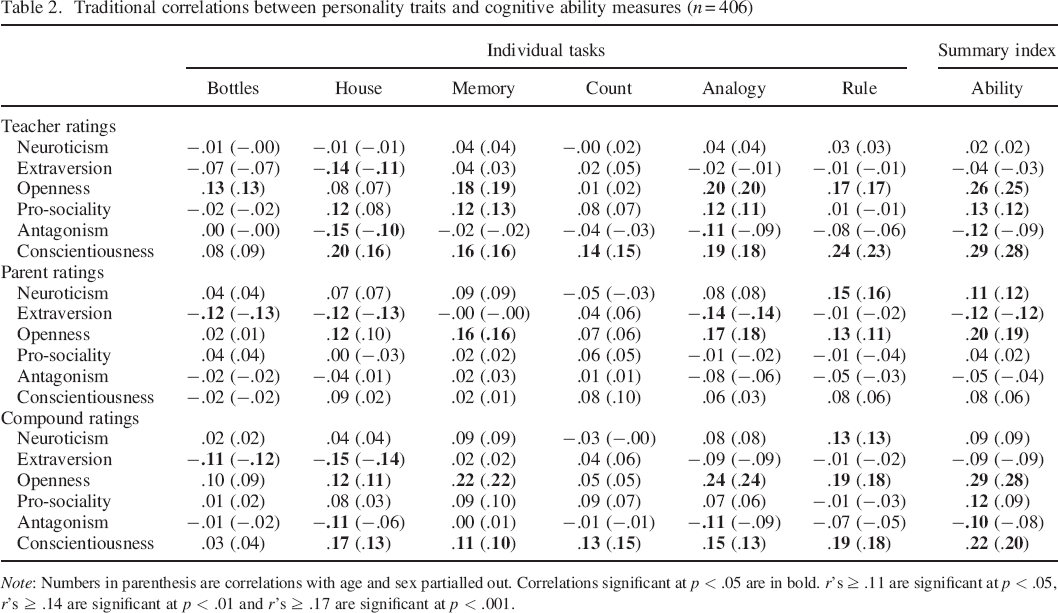
Note: Numbers in parenthesis are correlations with age and sex partialled out. Correlations significant at p < .05 are in bold. r's ≥ .11 are significant at p < .05, r's ≥ .14 are significant at p < .01 and r's ≥ .17 are significant at p < .001.
Regarding associations between teacher ratings and cognitive ability, high O and C were associated with better performance on almost all measures. This was true both in the bivariate correlation and in the partial correlation (the latter controlling for age and sex). Regarding parent ratings of personality, O was most consistently associated with performance across individual measures of cognitive ability. However, results for the more reliable Ability index suggested that parent ratings of high N and low E were also associated with higher cognitive ability. The compound ratings showed that the shared variance of teacher and parent ratings of O was rather solidly associated with higher cognitive ability, with the shared variance of ratings of C also showing a reasonable correlation with cognitive ability. A weak negative link between E and the Bottles and House tasks, as well as a positive link between A (evident in the correlation for both the Pro–sociality and Antagonism poles) and the Ability index, was also indicated.
Following von Stumm et al. (2009), we next examined the relations between specific aspects of cognitive ability and personality by partialling out, from the previously presented traditional correlations, the first factor obtained in the principal axis factoring of the cognitive ability measures. In essence, scores on all measures of cognitive ability were regressed on the first factor obtained in the principal axis factoring, and the residuals were saved as new indicators of scores on the cognitive ability measures. These residuals were then correlated with personality to obtain distinctive correlations. Such correlations were generally very weak: the strongest correlation was between teacher ratings of E and the House task (r = −.14, p < .05; all correlations are shown in Table S2 of the supporting information). Concentrating on the most reliable measure of personality, the compound measure, we found that the traditional correlations, as compared with the distinctive correlations, were stronger when relating cognitive ability to either O (for House, Analogy and Rule, the differences in correlations were statistically significant at p < .05) or C (for all measures except Bottles, the differences in correlations were statistically significant at p < .05).
Next, to examine the extent to which the unique perspectives offered by parents and teachers could contribute to explaining variance in cognitive ability, we conducted a series of stepwise regression analysis in which we predicted the various measures of cognitive ability with age and sex (Step 1), the compound measure of personality (Step 2) and the unique perspective of parents (Step 3). Regarding the last step, it is important to note that the results were, of course, identical regardless of whether it was parent or teacher ratings that were entered at Step 3, as all of their unique variances would either way be represented at that step. Although unique variance did not statistically significantly contribute to the prediction of performance on any of the specific tasks, it did explain an additional 2% of the adjusted variance of the Ability index (Table 3), raising the predictive power of personality on cognitive ability from 14% to 16%. In some additional stepwise regression analyses (Table S3), we confirmed that both teacher and parent ratings had unique predictive power when one was entered after the other.
Change in explained variance (R2) in the prediction of cognitive ability measures (n = 406)
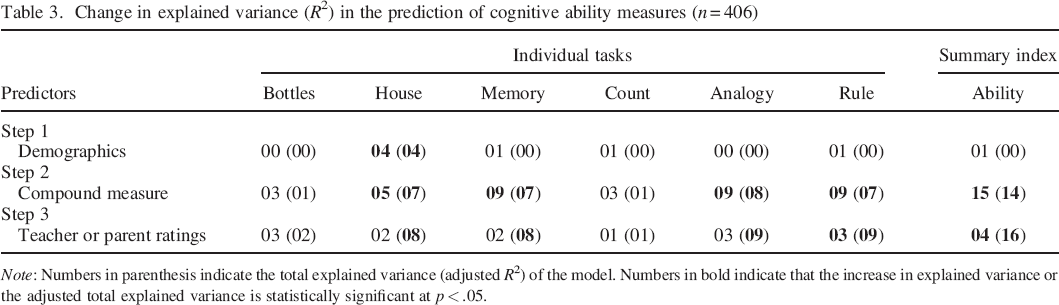
Note: Numbers in parenthesis indicate the total explained variance (adjusted R2) of the model. Numbers in bold indicate that the increase in explained variance or the adjusted total explained variance is statistically significant at p < .05.
Also, related to the issue of multiple informants, we investigated whether the agreement on the child's personality could predict the extent to which the personality ratings were associated with cognitive ability. For this purpose, we first decomposed the parent–teacher correlation on each trait into each individual pair's contributions to this correlation. This was carried out using the formula rA = 1 − (zT − zP)2 / 2, where zT and zP are z–scores for the teacher and parent ratings standardized across the sample (Asendorpf, 1992). For each child and each trait, we thus obtained an Agreement index reflecting the extent to which parents and teachers agreed in their ratings of the child. We then ran six separate stepwise regression analyses, one for each trait as a predictor variable (all predictors were centred), in which we predicted the summary index Ability with demographics (Step 1), the main effects of the compound personality score for a specific trait and the Agreement index for that trait (Step 2), as well as their interaction (Step 3). The Agreement index was not statistically significant in any of the six regressions (all p's > .05). However, in the regression model in which O was entered as a predictor variable, the compound measure of O (β = .30 p < .001; all Betas are from the last step of the regression analysis), the Agreement index for O (β = .13, p = .06) and their interaction (β = .20, p < .01) were all positive predictors of cognitive ability. This pattern reveals a cumulative positive interaction, which means that the compound O score was a better predictor of cognitive ability the stronger the agreement between teacher and parent ratings was. Adding the main effects of agreement on O and the corresponding interaction term to the regression model that predicted the Ability index (Table 3) added a further 2% to the adjusted explained variance of the model, making it 18%.
Discussion
We set out to investigate the relations between personality and cognitive ability in seven–year–old children. The results were in many ways comparable with those obtained with older age groups, with O being the personality trait most strongly associated with cognitive ability. The shared variance of teacher and parent ratings of personality explained a considerable 14% of the variance of cognitive ability, with the unique variances of the personality ratings able to explain only 2% more. However, considering the agreement between raters as a moderator variable—the association between O and cognitive ability was stronger the stronger the inter–rater agreement on O—added a further 2%, making the contribution of the unique perspectives substantially more important.
Regarding the use of traditional versus distinctive correlations, our results strongly suggest that the computation of distinctive correlations will, at least in samples of children, eliminate that part of the variance of cognitive ability scores that is related to personality.
Personality and cognitive ability
The associations between personality and cognitive ability varied greatly depending on whether investigating traditional or distinctive correlations. The latter correlations, in which general cognitive ability was controlled for, revealed virtually no associations between cognitive ability and personality. Our results are consistent with some prior work in organizational psychology that has investigated the predictive validity of cognitive ability. Ree, Earles, and Teachout (1994) reported that in the prediction of job performance, scores on narrower measures of specific abilities could add only trivial amounts (average increase in explained variance = .004) to the predictive validity of general cognitive ability. These results, together with the results of the present research, suggest that controlling for general cognitive ability may leave more specific task scores devoid of variance associated with broad constructs outside of the domain of cognitive ability. We therefore focus our discussion on the effects that we found for traditional scores.
Similar to results found in older samples of children (e.g. Allik et al., 2004) and adults (e.g. McCrae & Costa, 1997), high O was consistently associated with better performance on measures of cognitive ability. This was true both for teacher and parent ratings of O. The present results thus differ from those reported on by Markey et al. (2004), who found that O in 10–year–old children was not correlated with any observer rated behaviours, including behaviours thought to indicate intelligence. Although such observer ratings tend to be quite accurate estimates of intelligence in adult samples (e.g. Borkenau et al., 2004), they may perhaps be less accurate in samples of children and may generally tap more intro constructs such as ‘need for cognition’ (Cacioppo & Petty, 1982) than psychometrically assessed cognitive abilities.
Regarding C, the results were consistent with those reported on by Allik et al. (2004) for a sample of 12–year–old children: teacher ratings of high C were positively associated with performance across various measures of cognitive ability. That only teacher, but not parent, ratings of C were related to cognitive ability implies that these ratings derived their associations with cognitive ability from being based on behaviours that indicate C in a classroom setting. Such behaviours could involve a general inclination or motivation to put effort into doing what the teacher asks. This interpretation would be consistent with the occasional positive relations between teacher ratings of high A (referring to both high Pro–sociality and low Antagonism) and various measures of ability.
With respect to the model suggested by Moutafi et al. (2004), according to which, high C develops to compensate for low intelligence, the present results suggest that such compensatory force is not evident in seven–year–old children. An important question for future research will be to longitudinally investigate how the relations between C and performance on cognitive ability measures develop over time. One possibility is that such relations will only become negative in samples of participants who continue to higher education, and not in more representative samples, such as the present one.
Although the association between C and cognitive ability was only apparent in teacher ratings, it was only the parent ratings of N and E that were correlated with cognitive ability. Parent ratings of high N were associated with better performance. As this result is contrary to those obtained in research on adults and older children, which have shown that high N is related to worse performance on cognitive ability tests (e.g. Allik et al., 2004; Moutafi et al., 2006), it warrants some further discussion. First, it is important to note that the influence of N on cognitive ability tests has been shown to be mediated by state anxiety (Moutafi et al., 2006). In a similar vein, state anxiety has also been shown to diminish performance on academic tests (Hembree, 1988). However, research on such test anxiety has shown that in the early grades, children experience little test anxiety and that its prevalence rises sharply only in later childhood (Grades 3–5; Hembree, 1988). Drawing on the literature on state anxiety and academic performance, one could thus suggest that seven–year–old children are not very anxious when completing cognitive ability measures, or at least not anxious to a degree that would detract from their performance. On the contrary, children rated by parents as high on N could have been appropriately agitated to perform well on the cognitive ability measures. Such an interpretation of our results supports previously reported findings that mild anxiety may in fact enhance spatial working memory (Gray, 2001; see also Cassady & Johnson, 2002).
Parent ratings of high E were associated with somewhat poorer cognitive performance. Introverts have been suggested to do better on low–arousal tasks (Bates & Rock, 2004), and it seems possible that the administered measures were generally not very arousing and that highly extraverted children may have become bored and stopped attending to the tasks. In sum, although the results pertaining to the parent ratings of N and E could be considered somewhat unexpected, they can be meaningfully interpreted and may not merely be spurious chance findings.
Shared versus unique variance in personality ratings
At the outset, we were interested in comparing the criterion validities of the unique perspectives offered by teacher and parent ratings with that of a compound measure that represented only variance shared by these two sets of ratings. After controlling for shared variance, the unique variances of parent or teacher ratings contributed very little to the explanation of the variance of the specific measures but did explain an additional 2% of the variance of the Ability index. Including the agreement between raters as a moderator variable (see succeeding discussion) could contribute another 2% to the explanatory power of personality, suggesting that ratings from different perspectives should not generally be averaged before their possible unique contributions and interaction effects have been investigated (cf. Kraemer et al., 2003).
More generally, in the regression models predicting performance on the cognitive ability measures with personality, the percentage of explained variance varied between the specific measures. However, the explanatory power of personality appeared somewhat more substantial than in studies conducted with older samples. In adult samples, the Big Five have been reported to explain, for instance, 2% to 5% (Moutafi et al., 2003), 13% (Moutafi et al., 2005), 5% (Chamorro–Premuzic, Moutafi & Furnham, 2005) and 2% to 7% (Moutafi et al., 2004) of the variances of various psychometrically assessed indices of cognitive ability. In comparison, the 14% to 18% accounted for in the present study appears considerable, suggesting that personality is more strongly associated with performance on cognitive ability measures in early childhood than in adulthood. This would also be consistent with the results of Allik et al. (2004), who reported that the average absolute correlations between personality traits and performance on Raven's Standard Progressive Matrices (Raven et al., 2000) declined rather linearly from r = .24 at age 6 to r = .12 at age 12. Nevertheless, the associations between personality and cognitive ability, even in early childhood, should not be overstated. The two appear to measure quite distinct constructs and are, also in children, likely to have more or less independent associations with other variables, such as academic achievement.
Agreement between raters
One of the most novel findings of the present research was the positive cumulative interaction between scores on O and the extent to which parents and teachers agreed in their ratings of O. As expected, the stronger the agreement between raters, the more strongly ratings of O were associated with cognitive ability. As argued in the Introduction section, this means that good targets—that is, targets who emit more behavioural cues regarding their level of O across school and home contexts—are more likely to emit such cues also when completing the cognitive ability test battery. Being consistent across two contexts thus appears to generalize to a third context. An alternative explanation of agreement, on the basis of the properties of the judge (some parents could, because of their personal characteristics, rate their child more or less consistently with how the teacher rates the child), would be hard pressed to explain why inter–rater agreement would increase the associations between O and cognitive ability. The present results suggest that some children may behave more consistently across different trait–relevant situations than others, thus allowing for more accurate perception of their personalities. This result adds to the results of some studies that have suggested that there are individual differences in how well traits can be expected to predict behaviour across situations (e.g. Bem and Allen, 1974; Sherman, Nave, & Funder, 2010). However, as other studies have arrived at the opposite conclusion (e.g. Chaplin, 1991; Chaplin & Goldberg 1984), the topic warrants more research.
Regardless of the exact mechanisms at work, the result that agreement between raters enhances predictive validity obviously has applied implications—when different raters coming from different contexts agree in their ratings of a particular trait, then those ratings are more likely to predict future behaviours in other contexts. Although this may seem self–evident, there is very little prior research to substantiate such claims. Researchers dealing with large enough samples (n > 400; Chaplin, 1991) that include multiple personality rating of the same targets might want to routinely investigate whether the agreement between raters moderates the associations of personality with external variables, as this may substantially add to the strength of such associations, as was the case in the present study.
Limitations and conclusions
Perhaps the most important limitation of the present study relates to the measures used. A more standard measure of the Big Five factor space would for some purposes have been preferable, especially with regard to comparability with other research. However, measures developed for adult samples typically include items not applicable to seven–year–old children. As the present measurement was the starting point of a longitudinal project, it would have made little sense to begin the project with a measure specifically designed for small children, as that would at a later stage have forced a methodologically difficult change of measurement instrument. The core items of the questionnaire that we used should be applicable throughout the participants’ school career. Furthermore, the present results by themselves support the validity of our measure of personality.
Regarding comparability with other research, another limitation is that the cognitive ability measures, although diverse and tapping many aspects of cognitive ability, have been primarily developed and modified within the Education Department of Helsinki and have not been explicitly linked to specific types of intelligence (e.g. fluid or crystallized). Another limitation is that we did not have access to the item–level results of the cognitive ability measures and could thus not estimate the internal consistencies of the measures. However, in the normative data set from 2001, in which almost identical measures were administered, the alpha internal consistencies were estimated for the Memory, Count, Analogy and Rule tasks, and these were .67, .72, .68 and .55, respectively (Hautamäki et al., 2001). These estimates do not appear unusually low.
We finally wish to emphasize that the type of cross–sectional data we report on cannot provide causal inferences. Although the language of the present paper could at places be interpreted as implying causality from personality to cognitive ability (personality predicting cognitive ability in the regression models), this merely refers to one set of scores predicting another set of scores, not to causality from one construct to another. In fact, it would be quite surprising if the actual causal relations between personality and cognitive ability were not reciprocal.
In sum, the present results allow the following conclusions. The relations between seven–year–old children's personality and cognitive ability may be somewhat stronger than the corresponding relations found in samples of older participants. Both teacher and parent ratings of O were positively associated with cognitive ability, both perspectives could explain unique variance in the associations between personality and cognitive ability, and such associations were stronger the stronger the inter–rater agreement. For applied purposes, the results suggest that when making far–reaching educational or clinical decisions about the child, it would be imperative to consult both parents and teachers as sources of knowledge, especially as the agreement between the two sources appears to be indicative of the usefulness of the ratings.
SUPPORTING INFORMATION
SUPPORTING INFORMATION, per_849_sm_tables - Teacher and Parent Ratings of Seven–Year–Old Children'S Personality and Psychometrically Assessed Cognitive Ability
SUPPORTING INFORMATION, per_849_sm_tables for Teacher and Parent Ratings of Seven–Year–Old Children'S Personality and Psychometrically Assessed Cognitive Ability by Lönnqvist Jan–Erik, Vainikainen Mari–Pauliina and Verkasalo Markku in European Journal of Personality
Footnotes
Supporting Information
Supporting information may be found in the online version of this article.
Acknowledgement
This research was supported by the Academy of Finland under Research Grant No. 127641.
References
Supplementary Material
Please find the following supplemental material available below.
For Open Access articles published under a Creative Commons License, all supplemental material carries the same license as the article it is associated with.
For non-Open Access articles published, all supplemental material carries a non-exclusive license, and permission requests for re-use of supplemental material or any part of supplemental material shall be sent directly to the copyright owner as specified in the copyright notice associated with the article.