
Abstract
Health and disease reflect broad social conditions including economic, environmental, and cultural components. The impact of challenging housing conditions experienced by low-income African American households on their mental health is an example of this principle. Do physical housing conditions, the presence of roaches and rodents, plumbing defects, and heating/cooling problems contribute to mental health dysfunction such as being depressed, feeling worried, feeling sad, feeling helpless, and feeling emotionally upset? To address this research question, a sample of 128 households that originally lived in public housing in Washington, D.C. were surveyed. These households had been relocated to other low-income housing during the demolition and reconstruction phase of a HOPE VI project, some to alternative public housing developments and others to private units based on vouchers. The survey included self-reports by heads of household on their housing conditions and mental health status using Likert scales. The survey also asked participants for demographic, socio-economic, and physical health data and for information on neighborhood characteristics. Correlation and regression analyses were used to estimate the impact of building structure, building systems, neighborhood characteristics, physical health, and socio-economic/demographic variables on mental health stresses. Specific housing issues included the number of bedrooms, plumbing, heating, cooling, rodents, roaches, and building security (the independent variables). Mental health stresses (the dependent variables) included feeling depressed, nervous, anxious, sad, helpless, and having trouble concentrating. Several alternative specifications and models were used and estimated. They generally demonstrated strong overall explanatory value. The findings from these models suggested that challenging housing conditions significantly contributed to many mental health disorders. For example, in the 2SLS model of “problem being depressed”, the condition of the apartment (β =0.278, t=2.022) and plumbing (β = 0.182, t=2.145) were significant and the model's explanatory power was reasonable with an adjusted R2=0.221. Many non-housing control variables were also significantly associated with mental health challenges.
Keywords
Introduction: the social determinants of disease and health
Health and disease reflect broad social conditions including economic, environmental, and cultural components. To address these matters, the World Health Organization launched a Commission on Social Determinants of Health in recent years (Marmot 2005; Syme 1987). The specific impact of housing stressors on the mental health of low-income households, while falling within this broad understanding of determinants of health and disease, has been addressed only in a limited way. The relationship between housing stressors and mental health does fall within a broader and more robust area of scholarship, i.e., the direct relationship between socioeconomic status (SES) and health of low-income populations. Studies that focus on housing, especially those related to public housing impacts, form an important component of this work, and efforts to focus on the specific mental health impacts are particularly important to the present study.
The general hypothesis tested in the present study is that self-reported housing condition stressors are directly and causally associated with self-reported mental health stress. Do physical housing conditions, the presence of roaches and rodents, plumbing defects, and heating/cooling problems help cause mental health stresses such as being depressed, feeling worried, feeling helpless, and feeling emotionally upset?
Socio-economic status and health
Socio-economic conditions clearly affect health outcomes. Findings in this field of investigation show that it is not simply those in the lowest socioeconomic group who have worse health than those in higher socioeconomic groups, but also that there exists a hierarchy such that at each level those in the higher socioeconomic strata have better health than those immediately below them (House & Williams 2000). In particular, lower SES individuals have a higher prevalence of almost all major psychosocial risk factors for health (House et al. 1994; Marmot et al. 1987; Lynch et al. 2000). There is no single factor that provides the pathways linking health and SES. House and Williams (2000) note that “what makes socioeconomic position such a powerful determinant of health is that it shapes people's experience of, and exposure to, virtually all psychosocial and environmental risk factors for health– past, present and future–and these in turn operate through a very broad range of physiological mechanisms to influence incidence and course of virtually all major causes of disease and health.”
Those concerned with the social welfare of the poor have often focused on housing quality as a critical component of health. As early as 1845, Friedrich Engels wrote,
The dwellings of the workers are everywhere badly planned, badly built, and kept in the worst condition, badly ventilated, damp, and unwholesome. The inhabitants are confined to the smallest possible space, and at least one family usually sleeps in each room. The interior arrangement of the dwellings is poverty-stricken in various degrees, down to the utter absence of even the most necessary furniture… That the dwellings of the workers in the worst portions of the cities, together with the other conditions of life of this class, engender numerous diseases, is attested on all sides (Engels 1845, Chapter 4, n.p.).
Modern researchers and policy makers have long argued that decent, safe, healthy housing is necessary to well-being and stability (Shaw 2004; Guite et al. 2006; Oreopoulos 2003) and is closely linked to overall socio-economic status (SES). Public health scholars have argued that housing is one of the social determinants of physical and mental health and that poor housing is strongly associated with excessive morbidity, mortality, and mental illness (Shaw 2004). Determining with precision the relationship of housing stressors on a variety of health stresses has proven difficult because of the interconnectedness among housing, wealth, income, employment, neighborhood, security, and health conditions of all kinds (Shaw 2004; Kling et al. 2004; Thomson et al. 2001, 2002). Completely teasing apart the independent role of housing in determining health status may in fact be impossible given the unity of the social fabric. However, several studies have assessed these relationships, usually in relatively narrow populations and limited geographical areas (Thomson et al. 2001; Shaw 2004). Taken together, however, these studies reinforce the supposition that housing conditions greatly influence health outcomes (Shaw 2004).
Among health disorders, mental health conditions loom large, counting for more than 15% of the overall burden of disease from all causes. Low SES households often do not receive appropriate care. David Satcher, then Surgeon General of the U.S., noted that “even more than other areas of health and medicine, the mental health field is plagued by disparities in the availability of and access to its services. … A key disparity often hinges on a person's financial status; formidable financial barriers block off needed mental health care from too many people …” (U.S. DHHS 1999, vi).
Undiagnosed and untreated mental illness remains a major challenge for impoverished members of the community. This challenge, like the myriad of other factors involved in poverty and racism, augments the level of distress already experienced by households. It interacts with problems of low income, un/underemployment, low skill levels, low educational achievement, discrimination, limited accessibility, childcare difficulties, and limited national priorities for the poor. Mental health challenges are both a cause and a result of the many elements of poverty.
By the 1980s the relevance of low socio-economic status had been confirmed by a range of studies, some focused on the urban ecology of mental disorders, others on social class differences in prevalence and incidence rates, course and outcome of illness, and patterns of medical treatment and care. A concentration of cases in low-status occupations was confirmed by area surveys and national statistics. Case rates repeatedly displayed class differentials whether the categories were based solely on occupation or incorporated other criteria such as education and district of residence (Hollingshead & Redlich 1958; Srole et al. 1977; Dohrenwend et al. 1992).
The impact of joblessness and job loss (critical factors affecting the overall SES of a household) on mental health has also been well documented. Murphy and Athanasou (1999) reviewed 16 longitudinal studies of this relationship and concluded that there was a significant and strong relationship between unemployment and depression, especially among workers who lost a job. Strully (2009) similarly found a strong relationship between job loss and participants’ self-assessment of their health based on her analysis of the Panel Study of Income Dynamics, while Bjorklund's 1985 study using the Swedish Level of Living Survey similarly found a significant relationship between unemployment and self-reported mental health distress.
Berube and Katz (2005) demonstrated that concentrated poverty exacts significant human costs and contributes to poor physical and mental health–partly owing to the stress of being poor and marginalized and partly owing to living in an environment with dilapidated housing and high crime. They state that people in areas of extreme poverty experience negative health outcomes at much higher rates than those living elswhere. They found a high degree of association between the incidence of depression and living in these neighborhoods.
Silver et al. (2002) examined the relationship between neighborhood structural characteristics and mental disorder using data from the National Institute of Mental Health's Epidemiological Catchment (ECA) surveys (n= 11,686). After controlling for individual-level characteristics, the study found that neighborhood disadvantage is associated with higher rates of major depression and substance abuse disorder, and also that neighborhood residential mobility and turnover was associated with higher rates of schizophrenia, major depression, and substance abuse disorder.
Xue et al. (2005) examined whether children's mental health is associated with neighborhood structural characteristics (concentrated disadvantage, immigrant concentration, and residential stability) and whether neighborhood social processes (collective efficacy and organizational participation) underlie such effects. The study used data from the Project on Human Development in Chicago Neighborhoods, a multilevel, longitudinal study of a representative sample of children aged 5 to 11 years in the late 1990s recruited from 80 neighborhoods. Additionally, a community survey assessing neighborhood social processes was conducted using an independent sample of adult residents in these 80 neighborhoods and was used in conjunction with U.S. census data to assess neighborhood conditions. A total of 2,805 children (18.1% European American, 33.8% African American, and 48.1% Latino) and their primary caregivers were seen twice. The study found that the percentages of children above the clinical threshold for mental illness were 21.5%, 18.3%, and 11.5% in neighborhoods of low, medium, and high socioeconomic status, respectively. A substantial proportion of variance in children's total internalizing scores (intraclass correlation, 11.1%) was attributable to between-neighborhood differences. Concentrated disadvantage was associated with more mental health problems and a higher number of children in the clinical range after accounting for family demographic characteristics, maternal depression, and earlier child mental health scores. Neighborhood collective efficacy and organizational participation were associated with better mental health after accounting for neighborhood concentrated disadvantage. Collective efficacy mediated the effect of concentrated disadvantage. The study concluded that a large number of children in poor neighborhoods have mental health problems.
Sundquist and Ahlen (2006) showed that the findings of Silver et al. (2002) and Berube & Katz (2005) were also relevant internationally. They followed 4.5 million Swedish women and men through a 2 year period for the purpose of examining the association between neighborhood income (defined as the proportion of individuals with low income) and psychiatric hospital admissions. The study found that individuals living in the poorest neighborhoods exhibited a statistically significantly higher risk of being hospitalized for mental disorder than individuals living in richer neighborhoods after adjusting for individual demographic and socioeconomic characteristics. The authors concluded that both individuals and neighborhoods need to be targeted in order to enhance mental health in low-income neighborhoods.
Hudson (2005) took up the implicit question of endogeneity bias in studies linking poor housing conditions with mental health challenges by asking if poor socioeconomic conditions predispose people to mental disability, or if preexisting, biologically-based mental illnesses result in the drift of individuals into poor socioeconomic circumstances? To answer these questions the study tested the hypothesis that the inverse correlation between socioeconomic status and mental illness is a specific outcome of stressful economic conditions, such as poverty, unemployment, and housing unaffordability. The primary data used in the study consisted of seven annual data sets from for the fiscal years 1994 through 2000, each including approximately 750,000 records of patients discharged from the various acute psychiatric and medical facilities throughout the state of Massachusetts. The findings revealed a moderate to strong inverse or negative correlation between socioeconomic status and mental illness. Further detailed examination in the study of the various correlations between indicators of mental illness and SES, as well as other demographic and environmental conditions, revealed a remarkably consistent relationship. When income, education, or occupational status was considered in relation to overall rates of mental illness (or with schizophrenia or depression in particular), the correlations were moderately to strongly negative, ranging from r=-.25 to r=-.70. Similarly, the more economic hardship communities experienced, the higher were the rates of hospitalization and reported mental illness. These had correlations ranging from r=.12 to r=.69, with the most modest relationships involving housing affordability. Thus, the experience of acute psychiatric hospital patients in Massachusetts during the middle to late 1990s provides strong evidence for the social causation interpretation of the SES-mental illness negative relationship, one that involves the notion that SES impacts the development of mental illness directly as well as indirectly through its association with adverse, economically stressful conditions among lower income groups.
Housing defects, public housing, and mental health impacts
The relationship between housing and health is complex, and the recent revival of interest has resulted in numerous studies by medical practitioners, economists and sociologists alike. Most research in this area focuses either on the impact of housing environments on occupants’ health or on the consequences of health status for housing attainment. One of the earliest studies of the relationship between environment and mental health was that of Faris and Dunham (1939). They found that there was a disproportionately high rate of mental illness (schizophrenia) in the poorest neighborhoods of Chicago which decreased as one moved towards the city's periphery where housing was of higher quality.
In addition to the challenge of living in distressed neighborhoods, Weich et al. (2002) tested the hypothesis that the prevalence of depression is associated with the specific characteristics of the built environment. The study found that, after adjusting for socioeconomic status, statistically significant associations existed between prevalence of depression and living in housing areas characterized by certain features of the built environment including challenging entrances and hallways.
Smith et al. (1993) attempted to assess the impact of ameliorative actions on the impact of housing-based stress on mental health. The study hypothesized that exposure to housing stressors would be significantly related to psychological distress, but that the adverse effects of housing stressors would be moderated by perceptions of social support resources. The results of a study conducted in the two New Zealand cities of Auckland and Christchurch partially confirmed this hypothesis, indicating that social support plays a role in mitigating the adverse effects of housing stressors. However, this relationship depended on the severity of the housing stressors. Among the study's respondents, the presence of social support was indeed associated with reduced symptom levels for those exposed to moderate housing stressors. However, among respondents subjected to high levels of housing stressors, social support was not associated with reduced psychological distress, indicating the need for a more specific policy response to the issue of seriously deficient housing.
Public housing residents are a subset of the population living in substandard housing units. They often live in units, buildings, and developments that are severely challenged structurally and socially. At the same time, public housing residents, and especially residents affected by HOPE VI relocation processes, have reported especially poor health compared to the general population or even to the population of black women in general, a population that itself suffers disparities in health conditions and outcomes compared to the general population. Manjarrez et al. (2007) report that, in the Urban Institute's Panel of HOPE VI participants, 41% reported that their health was either “fair” or “poor”, a level three times that of black women in general for ages 18-44; 29% of all participants respondents reported poor mental health. Howard University Center for Urban Progress 2006 and 2008 reported similar levels of ill health in selected distressed public housing sites undergoing demolition and renovation in the District of Columbia (see Tables 1 and 2).
Selected health problems of “New Hope” households
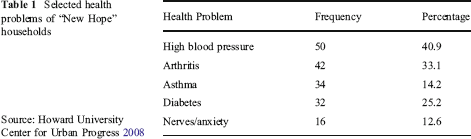
Selected health problems of “New Hope” households
Source: Howard University Center for Urban Progress 2008
Selected health problems of Lincoln Heights public housing development households in the District of Columbia
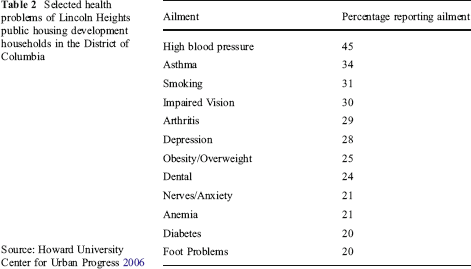
Source: Howard University Center for Urban Progress 2006
People living in public housing also seem to be disproportionately affected by mental illness. Black et al. (1997) used epidemiologic survey data from elderly residents of six public housing developments to determine the prevalence of need and unmet need for mental health care. The study found that 37% of this predominantly African American sample needed mental health services, and 58% of those who needed care had unmet needs. Logistic regression analyses showed that males, older residents, those with no Medicare insurance, and those with more Activities of Daily Living (ADL) impairments are at greater risk of both needing mental health care and receiving no mental health care services. Findings suggested the need for targeted interventions that would increase service utilization and potentially reduce the likelihood of eviction or placement in more restrictive settings.
One of the most rigorous studies of the impact of improved housing conditions on physical and mental health grew out of the analysis of the Moving to Opportunity Program (MTO) (Kling et al. 2004; Abt 2003). The MTO Demonstration was launched by the U.S. Department of Housing and Urban Development (HUD) in 1994 to provide families with children a chance to move out of public housing in high poverty neighborhoods to less poor neighborhoods. Conducted in Baltimore, Boston, Chicago, Los Angeles and New York City, the program had three groups of people: the MTO treatment group, which received vouchers to move to more affluent neighborhoods; the comparison group, which received vouchers for standard HUD housing assistance; and the in-place control group, which did not receive vouchers to move out of poor neighborhoods. Analysts were surprised to learn that the main positive outcome of the MTO Demonstration was better mental health among participants who received vouchers. The researchers speculated that “[m]oving more or less eliminated people's exposure to violence …. It wasn't just a perception …There was a big decline in kids being attacked, robbed or threatened. That is our best theory about the mechanism” (Abt 2003).
These findings are consistent with Newman's (2001) critical review of 32 studies published between 1975 and March 2000 on the relationship between housing attributes and serious mental illness. This review concluded that the evidence showed that access to rental subsidies alone was not significantly associated with clinical outcomes including level of depression and time spent in a mental health setting, but that obtaining independent housing (such as happened with voucher recipients in the MTO) was associated with significantly lower levels of depression and less time spent in mental health setting.
More recently, the federal HOPE VI program, aimed at demolishing severely distressed public housing developments and replacing them with mixed income housing communities, has been assessed for its impact on physical and mental health (Boston 2005). Improvements appeared among those who were relocated to other sites during demolition and construction of mixed income neighborhoods. But these improvements were primarily among those residents who succeeded in using housing vouchers to locate outside of public housing developments; the residents who remained in public housing obtained little improvement. Analysts argued that the neighborhoods to which clients were relocated were lower in crime and thus eased stresses related to mental health (Popkin et al. 2007; Buron et al. 2007). 1 Since only a very small percentage of the original residents actually returned to the original site after the completion of construction, the permanence of the relocation accentuates the importance of this finding.
It may also have been the case that the physical housing unit to which they were relocated was physically better than the severely distressed unit from which they were relocated which could have also reduced stresses. This issue was not directly addressed in the Urban Institute studies.
The question of whether physical defects in the housing units and buildings in which people live is a cause of mental health challenges in households remains incompletely addressed in the literature, and forms the basis for the present study.
The present study
The present study adds to efforts to understand housing impacts on the mental health of public housing residents in several ways. A sample was drawn from the heads of household who had lived in the New Hope 2 public housing development but had relocated to other generally low-income neighborhoods, many with vouchers that allowed them to live outside of public housing developments. These household heads were interviewed face to face using instrumentation that included their self-reported scaled assessments of their mental health and their housing and neighborhood conditions as well as values for many potentially confounding variables such as demographics, income, and employment status. These data allowed the testing of hypotheses about the relational and causative nature of housing stresses on mental health while controlling for confounding factors.
New Hope is an alias for the actual public housing development.
Research question
The set of hypotheses tested in the present study are that self-reported housing condition stressors are directly and causally associated with self-reported mental health stress. Do physical housing conditions, the presence of roaches and rodents, plumbing defects, and heating/cooling problems help cause mental health stresses such as being depressed, feeling worried, feeling helpless, and feeling emotionally upset?
The literature has provided strong support for the linkage between socio-economic status (including unemployment) and mental health challenges, and specific effects of housing conditions on mental health, often clinically defined. The present project examines the impact of a range of specific housing condition challenges (ranging from broad characteristics such as general neighborhood stressors and neighborhood public safety stressors to very specific housing condition problems such as plumbing and roaches) on an array of different mental health stresses as reported by the heads of household.
Data and methodology
The sample
During the spring and summer of 2006, the research team conducted a survey of a convenience sample of 128 heads of New Hope households (out of the total of 197 households in the New Hope HOPE VI database). At the time of the survey, the households, while eligible for return to New Hope upon the completion of the HOPE VI project construction, lived in neighborhoods throughout all four quadrants of the District of Columbia, primarily in the lower-income neighborhoods of Northeast and Southeast. A few lived inside the beltway in adjacent Prince George's County. Many of these households had relocated to other public housing sites; most had relocated via vouchers to individual apartments; and some had left public housing rolls while retaining their eligibility to return to units post-construction of New Hope. The diversity in residential locations of the participants at the time of the survey provided more variability than would be achievable in a typical public housing survey project.
Description of the sample
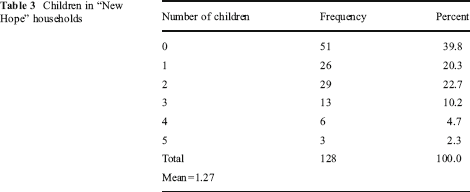
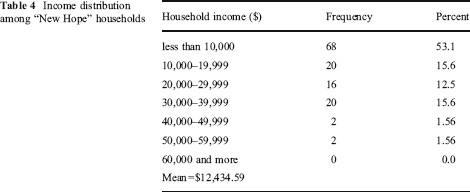
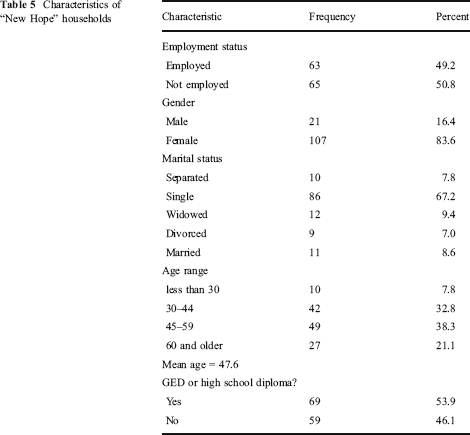
Of the 128 heads of household, 83.6% were female, 100% were African American, 8.6% were married, 53.9% had a high school diploma or a GED, 49.2% were employed, and their average age was 47.6 years. The households included, on average,1.27 children, with 22.7% having 2 children and 39.8% having no children. Average household income was $12,435, with 53.1% receiving less than $10,000 annually (see Tables 3, 4 and 5).
Children in “New Hope” households
Income distribution among “New Hope” households
Characteristics of “New Hope” households
Researchers, procedure, and instrumentation
Interviewers included Howard University graduate students and HOPE VI Community and Supportive Services personnel on staff with Wheeler Creek Community Development Corporation (CDC). The latter personnel were already engaged with the universe of households in this study by having provided case management services associated with the HOPE VI program.
A three-hour training session on the interview schedule instrument was held at Wheeler Creek CDC to insure the technical and cultural competency of the interviewers. The interview schedule was tested for face validity with the interviewers and revisions to the instrument were made. Interviewers were then dispatched to interview heads of households. In all contacts, an interviewer read the informed consent form to the household head and secured his/her signature on the consent form signaling agreement to be interviewed. The interview schedule was then used to interview the head of household. At the completion of the interview, each participant was provided a small financial incentive for cooperating with the project.
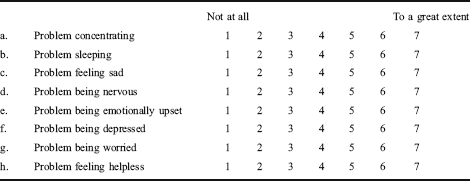
The interview schedule was designed to gather a wide range of data from participants. Each interview lasted approximately 30 minutes and included 65 questions that generated 296 variables. These data included participants’ perception of housing condition stressors and mental health stresses or dysfunctions. Participants were presented with questions 14 and 15:
I am now going to list various problems people may experience at one time or another. For each one that I mention, please indicate the extent to which you have such a problem using numbers from “1” to “7” where the “1” represents “not at all” and the “7” represents to a great extent.
Housing mental health
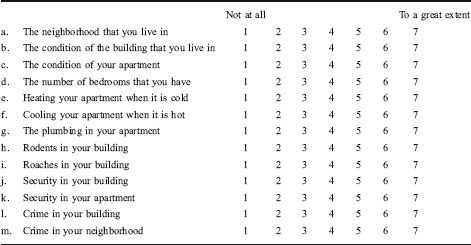
It is not unusual for housing conditions and situations to cause stress. I am now going to list various housing conditions and situations that may cause one to be stressed. For each one that I mention, please indicate the extent to which such a condition or situation has caused you stress using numbers from “1” to “7” where the “1” represents “not at all” and the “7” represents to a great extent.
Only the end-points of the Likert scale were labeled to allow the most unconstrained choice possible for the participant. Additional demographic, income, employment, and physical health variables were also collected in this survey and used as control variables in the modeling experiments.
The procedure for processing and analyzing the data was to enter the data into SPSS 14.0 and then verify and clean the data. The steps in the analysis were:
Conduct a univariate analysis of each relevant variable for frequencies, means, and standard deviations to measure the absolute levels of the reported mental health stresses and the housing condition stressors.
Correlate dependent and independent variables to assess likely associations between mental health stresses and housing condition stressors.
Correlate independent variables with each other to detect multicollinearity among the independent variables and to select the most appropriate variable to represent each conceptual category of stressors.
Specify and estimate a set of regression models of the mental health stresses using as independent variables selected housing condition stressor variables that represent conceptually distinct types of stressors, i.e., physical housing structures, systems in the housing structures, neighborhood effects, and security.
Modify the regression models by adding additional control variables including income, employment, and demographic variables.
Address the challenge of simultaneity bias by further modifying the regression models through a 2SLS procedure.
Findings
In general, housing condition stressors were frequently and significantly associated with self-reported mental health stresses. Poor housing condition stressors proved to be an important, but not exclusive, source of mental health stress.
Univariate analysis
Self-reported mental health stresses
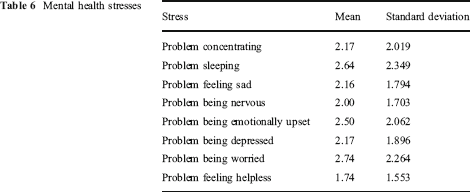
Mental health problems are substantial but not widespread among New Hope participants. The means and standard deviations of the Likert scale values for the eight mental health stresses are reported in Table 6. The average reported severity of the stress is generally between 2 and 3. The highest average score–2.74–was for “problem being worried” while the lowest average score–1.74–was for “problem feeling helpless”.
The relatively large standard deviations suggest that there is considerable diversity in residents’ perceptions of their mental health stresses. The frequency table indicates that a substantial minority of participants experienced each mental health challenge from a moderate to great extent (see Tables 6 and 7). Between half and three-quarters of the participants reported no problem at all for each of the categories, but the rest of the participants did report stress.
Mental health stresses
Self-reported mental health stresses: number and percentage
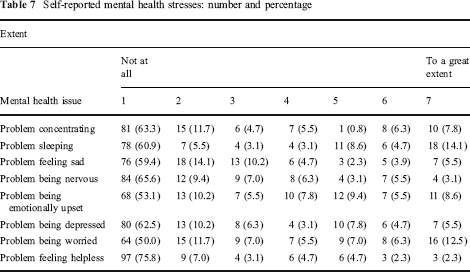
Almost 21% of the participants reported being depressed to a moderate degree (4 on a scale of 7) or worse (up to 7 out of 7), while over 30% described being emotionally upset at that range of severity. A virtually identical percentage reported being worried and/or having trouble sleeping, with 13-14% reporting this challenge “to a great extent” (7 on a scale of 7). Similar percentages of household heads reported problems concentrating and/or sleeping, feeling sad, and being nervous from a moderate level to “a great extent”. A smaller percent reported feeling helpless. When asked for any additional comments on their mental health responses, residents mentioned public safety issues (one reported that one son had been shot dead and the other was in jail) and job-related stress, suggesting a diversity of causes of mental health stress.
Self-reported mental health status is subjective. It is possible that two people with the same objective level of mental health stress measured in a clinical manner by an objective health professional could report quite different stress levels.
Self-reported housing condition stressors
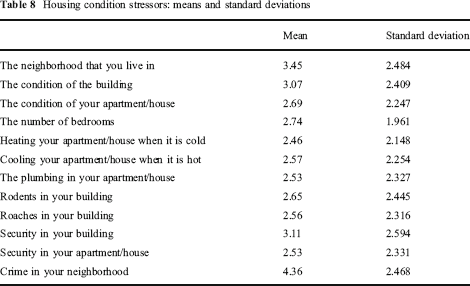
Stressful housing conditions were reported at a higher level of central tendency than mental health stresses (see Table 8). The means and standard deviations for housing condition stressors range from 2.46 (heating your apartment) to 4.36 (crime in your neighborhood). Most of the respondents reported minimal to moderate housing stresses. The large standard deviations indicate substantial variations in residents’ responses. Many participants reported the highest possible level of housing-related stress (see Table 9).
Housing condition stressors: means and standard deviations
Housing condition stressors: distribution and percentages of responses
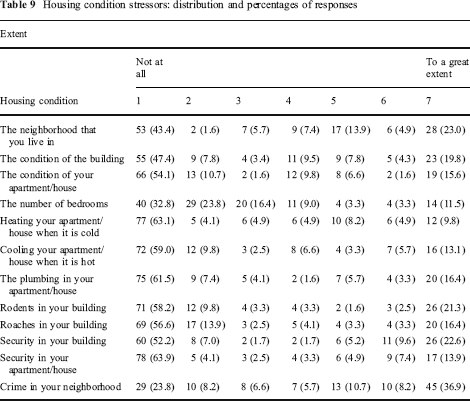
Almost a quarter of the respondents felt that the neighborhood was extremely stressful while over a third felt that crime in the neighborhood caused stress to a great extent. Almost a quarter felt that security in the building in which they lived caused stress to a great extent. Twenty percent felt that the building condition caused stress to a great extent, while an even greater percentage felt the same about the rodent problem. Nevertheless, about half of the participants reported that housing conditions stressors were “not a problem at all”. Only a small percentage of the participants felt stressed by the heating and cooling systems.
Housing condition stressor levels were self-reported by heads of household. There is no independent verification or measurement of an alleged stressor. In fact, surveyors noted that some participants responded fatalistically. Some said that they were not bothered by any of the problems in their housing conditions because they could not do anything about it anyway; they had to live with it, so they did not perceive it as a stressor at all. This understanding can help indicate why there were so many respondents who reported “no problem” with housing conditions or mental health by selecting “1” on the Likert scales when, in fact, there were many challenges readily apparent in their housing conditions.
Correlations of mental health stresses and housing condition stressors
Most of the housing conditions stressors were significantly correlated with most of the mental health stresses based on the Pearson's r statistic. Correlation coefficients generally ranged between 0.20 and 0.35 with a maximum of 0.493. Of the 88 correlations, only 25 failed to pass a test of significance at the 0.01 level (see Table 10). All of the correlations showed positive signs as expected. The highest correlations were between the physical building and apartment conditions and many of the mental health stresses.
Correlations between mental health stresses and housing conditions stressors
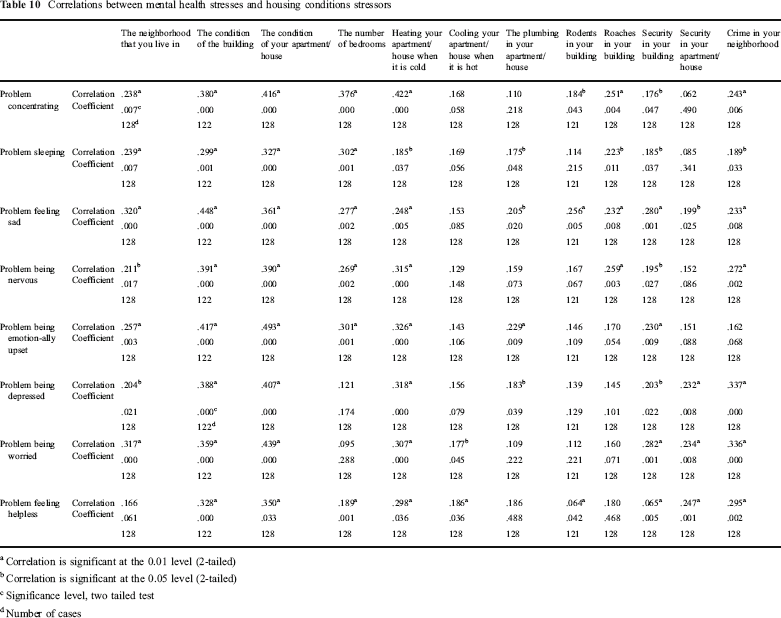
Correlation is significant at the 0.01 level (2-tailed)
Correlation is significant at the 0.05 level (2-tailed)
Significance level, two tailed test
Number of cases
Simple regression analysis
The following general theoretical model with k separate equations is specified, one for each mental health stress:

where the definitions of the modeled concepts and the possible specific variables used to represent these concepts are:
Mental health stress k for individual i, (k=1,8)
Extent of neighborhood stressor (problem with the neighborhood, problem with crime)
Physical building/apartment stressor (problem with the building, problem with the unit, problem with number of bedrooms, problem with plumbing)
Apartment systems stressors (problem with heating, problem with cooling, problem with roaches, problem with rodents).
Safety and security stressors (problem with security in my unit, problem with security in my building)
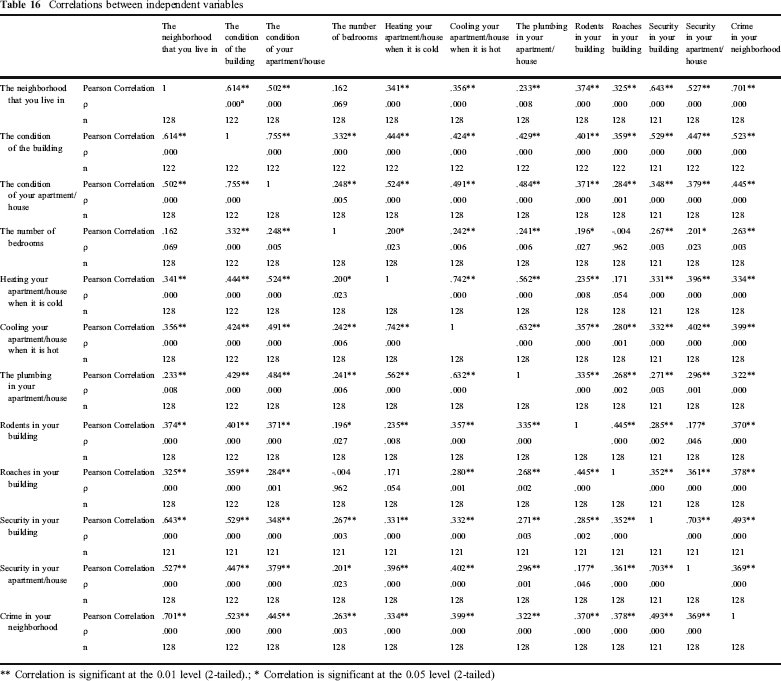
The housing conditions stressor variables were examined for possible multicollinearity by computing Pearson r correlation coefficients for these eleven variables (see Appendix 1). Many significant correlations were found among the independent variables. To minimize multicollinearity, variables selected to represent a theoretical category were generally those that had minimal correlation with other independent variables.
It is expected, a priori, that signs of the regression coefficients of each independent variable with each of the dependent variables would be positive because higher levels of housing condition stressors, whether from the apartment itself, the systems in the apartment, the neighborhood, or security concerns, should logically cause higher levels of mental health stress. Moreover, the correlation coefficients reported in Table 10 were all positive. The results of estimating the models through OLS regressions are presented in Table 11.
Regression results
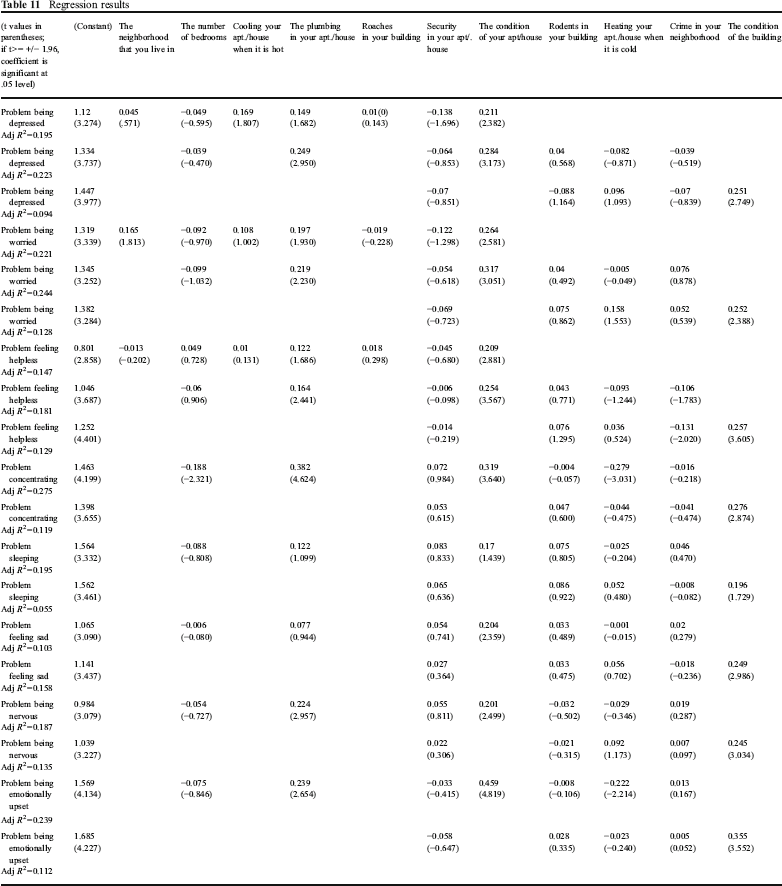
The variables that show significance in these models most frequently are the condition of the building/apartment, the condition of the individual unit, and the plumbing in the unit. High levels of stress from crime in the neighborhood are strongly associated with the mental health stress “problem feeling helpless” but this variable does not rise to significance in models of other mental health stresses. The ability of the housing condition stressor variables to explain the variation in self-reported mental health stresses is reasonable and relatively modest. The adjusted R 2 values range from less than .10 to a high of .275, suggesting that many factors in addition to housing conditions are at work in explaining the variations in the levels of all forms of mental health stress. The housing stressors explain over 20% of the variation in the mental health stresses “problem concentrating”, “problem being depressed”, “problem being worried”, and “problem being emotionally upset”. The housing stressors are less successful in explaining the variation in “problem sleeping”, “problem feeling sad”, “problem feeling nervous”, and “problem feeling helpless”. All of these models demonstrate that housing condition stressors are associated with mental health stresses.
Regression analysis with control variables
To control for possible confounding factors, an economic/demographic vector and a physical health condition vector were added to the regression analysis. The general model is:

where
Mental health stress k for individual i, k=1,8.
Extent of neighborhood stressor (problem with the neighborhood, problem with crime, and an index averaging the values of these two variables)
Physical building/apartment stressor (problem with the building, problem with the unit, problem with number of bedrooms, problem with plumbing, and an index averaging the values of these variables)
Apartment systems effectiveness (where n includes problem with heating, problem with cooling, problem with roaches, problem with rodents, and an index averaging the values of these variables).
Safety and security (where p can include problem with security in my unit, problem with security in my building, and an index combining these two variables)
Demographic/economic factors (where q can include age of head of household, size of household, number of children, income of head of household, employment status of household head, education of head of household)
Physical health factors (where r can include whether head of household reports asthma, high blood pressure, diabetes, overweight, and arthritis as a problem in his/her household).
Expected signs of control variables
It is expected that the signs of the coefficients for physical health problems will all be positive, since any of these ailments is likely to lead to mental health stress as well. The age of the head of household is likely to be negatively associated with self-reported mental health stress because older household heads have fewer young children to worry about and, since they are likely to have been in the public housing system longer than younger cohorts, they may have adapted somewhat more to their situation. Nevertheless, age brings with it many other challenges in terms of physical health, economic resources, and isolation. The impact of these factors may be captured in the other control variables, but there remains some ambiguity in the likely sign for this variable. The signs of the coefficients for the size of household and the number of children are expected to be positive, since larger families usually include younger children who are frequently a cause of mental stress for heads of households in distressed neighborhoods. The coefficient for education is expected to be negative since higher education levels give the household head more flexibility in addressing life's problems and stresses than lower education levels.
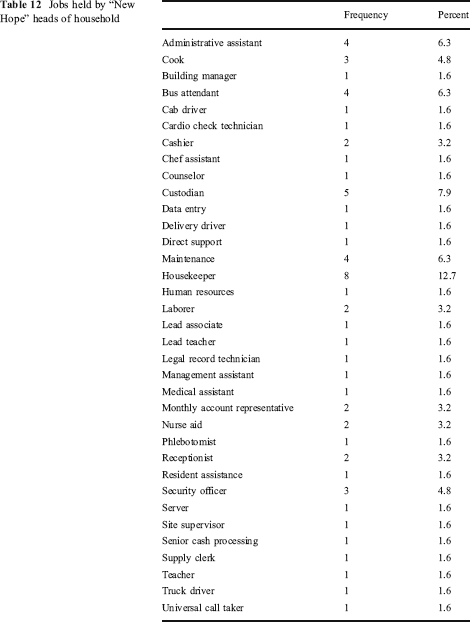
Income, measured in current dollars, is derived from employment plus public and private subsidy programs and is likely to be negatively associated with mental health stress because higher income allows a household to address problems more readily than lower income. The employment variable is also theoretically an important determinant of mental health status as previous literature has noted and is captured in this study as a dummy variable (1 = employed, 0=not employed). It is highly correlated with income (r=.80, p=.02), and is also weakly but significantly correlated with some self-reported housing conditions (e.g., the highest correlation is with the condition of the building, r=.256, p=.004) (see Appendix 2, Table 17). Virtually all members of this sample who are employed hold relatively insecure, low-paid, secondary market jobs that tend to be stressful in their own right (see Table 12). Still, having a stressful job versus no job is likely to be negatively associated with mental health challenges, since joblessness is typically a greater mental stressor than low-skill, secondary market jobs.
Jobs held by “New Hope” heads of household
The explanatory power of the estimated models have adjusted R 2 values ranging from .139 to .372, slightly higher than the range found in the uncontrolled regression models (see Table 10). The “condition of the apartment” is significant in one or more of the models for each mental health stress. Among systems stressors, plumbing continues to be significant in most of the models, although it does not reach significance for “problem feeling sad” “problem feeling emotionally upset”, or for “problem sleeping”. The other systems stressors were not significant, except for the stressor of roaches for the dependent variable, “problem being emotionally upset”. Concerns about the neighborhood were not generally significant, although the index of neighborhood conditions was significant in determining the level of the “problem being worried.” (See Table 13).
OLS regressions with control variables
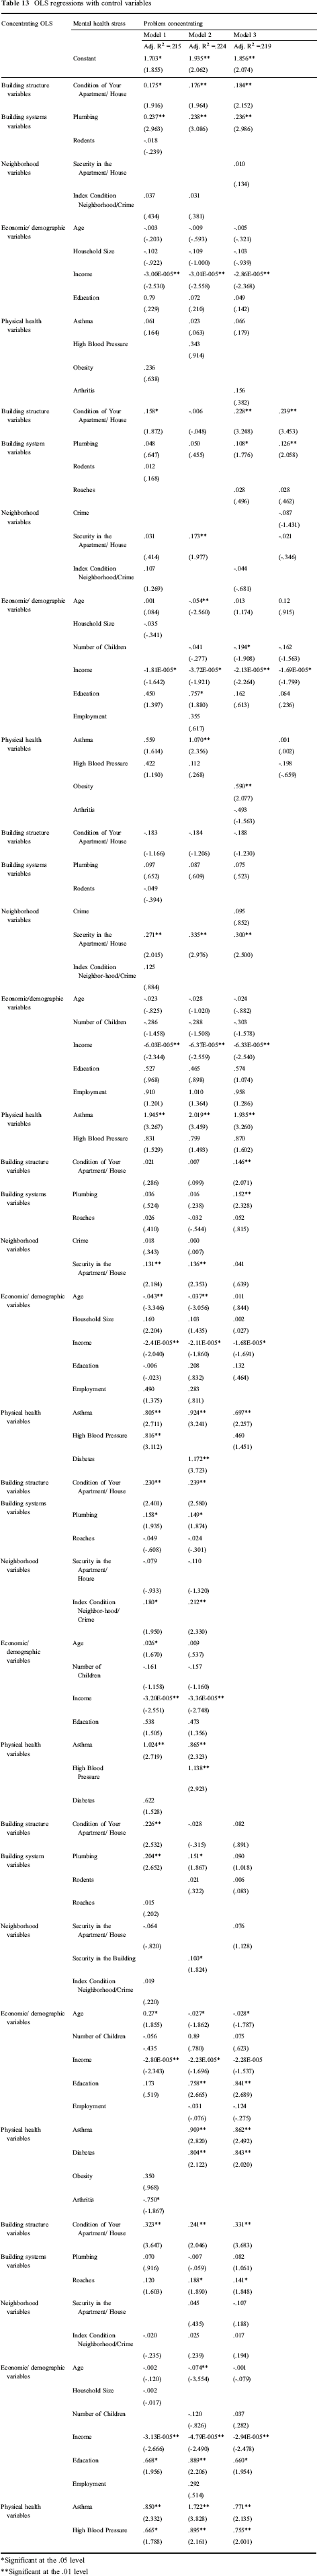
Significant at the .05 level
Significant at the .01 level
The economic/demographic variables used as control variables generally performed as expected. The coefficients of the income variable were significant and negative, as expected, for every model in which they appeared. The employment variable, used in certain models instead of income as the representation of SES, also was frequently but not always significant and negative. Two mental health stresses varied directly with age (specifically, “problem being depressed” and “problem being worried”). The number of children proved to be negative in sign and significant only for “problem feeling helpless”; this sign seems counter-intuitive. The education variable was significant and positive in determining the level of mental health stress for “problem being emotionally upset”. The positive sign, contrary to our expectations, suggests that having a higher education level is associated with higher mental health stress. A plausible explanation for this finding is that a higher level of education encourages higher expectations of success which are not being fulfilled, causing a higher level of frustration and hence greater emotional upset than would be the case for heads of households with lower education levels. This ambiguous finding may be an example of the limitation of self-reporting levels of stress.
The physical health variables frequently played significant roles in determining mental health stresses. Asthma was a significant predictor of the extent of “problem feeling sad”, “problem being emotionally upset”, “problem being depressed”, “problem being worried”, “problem feeling nervous”, and “problem sleeping.” High blood pressure proved significant in determining “problem being emotionally upset”, “problem being worried”, and “problem sleeping”. Obesity was a predictor of “problem feeling helpless”, and arthritis, while a major ailment among the population, never rose to significance in any of the OLS models (see Table 13).
Regression analysis using two-stage least squares
Mental health is complex and interactive with other aspects of life; it can feed back into one's living environment. Such interaction is similar to that encountered with mental health and employment. Those with poor mental health may lose jobs more often and be hired less frequently than those with good mental health, so job loss may not actually be the cause of mental challenges; see, for example, Strully 2009 and Hamilton et al. 1990. Mental dysfunction could lead to deterioration in certain housing condition variables as well as be caused by them. For example, a depressed head of household might neglect home maintenance, leading to an increase in her perception that the general quality of the unit is low and to a greater presence of pests, further demoralizing the household head.
To correct for possible simultaneous equations bias, the variable “condition of your apartment/house” is selected as the endogenous variable, and the variable “condition of the building” is selected to serve as an instrument. This is a reasonable specification since the mental health state of the head of household is not likely to lead to changes in the quality of the building, but it can certainly change the character of the unit (and its associated stress level) in which the person lives. In the instrumental equations, the coefficient of the “condition of the building” variable is consistently significant (ρ=.000), with β ranging from 0.617 to 0.655 depending on the specification consistent with the Pearson correlation of 0.755 between “condition of the apartment” and “condition of the building.”
The range of the adjusted R 2 values (from .112 to .358) remained in the same range as in the OLS studies (see Table 14). Overall, the mental health stress best explained by the model is “problem being worried”, with “problem being emotionally upset”, “problem being nervous” and “problem being depressed” also having a large share of their variation explained by the models. The models were less effective in explaining “problem feeling sad (adj R 2 =.161) and “problem sleeping” (adj R 2 =.119).
2SLS regressions
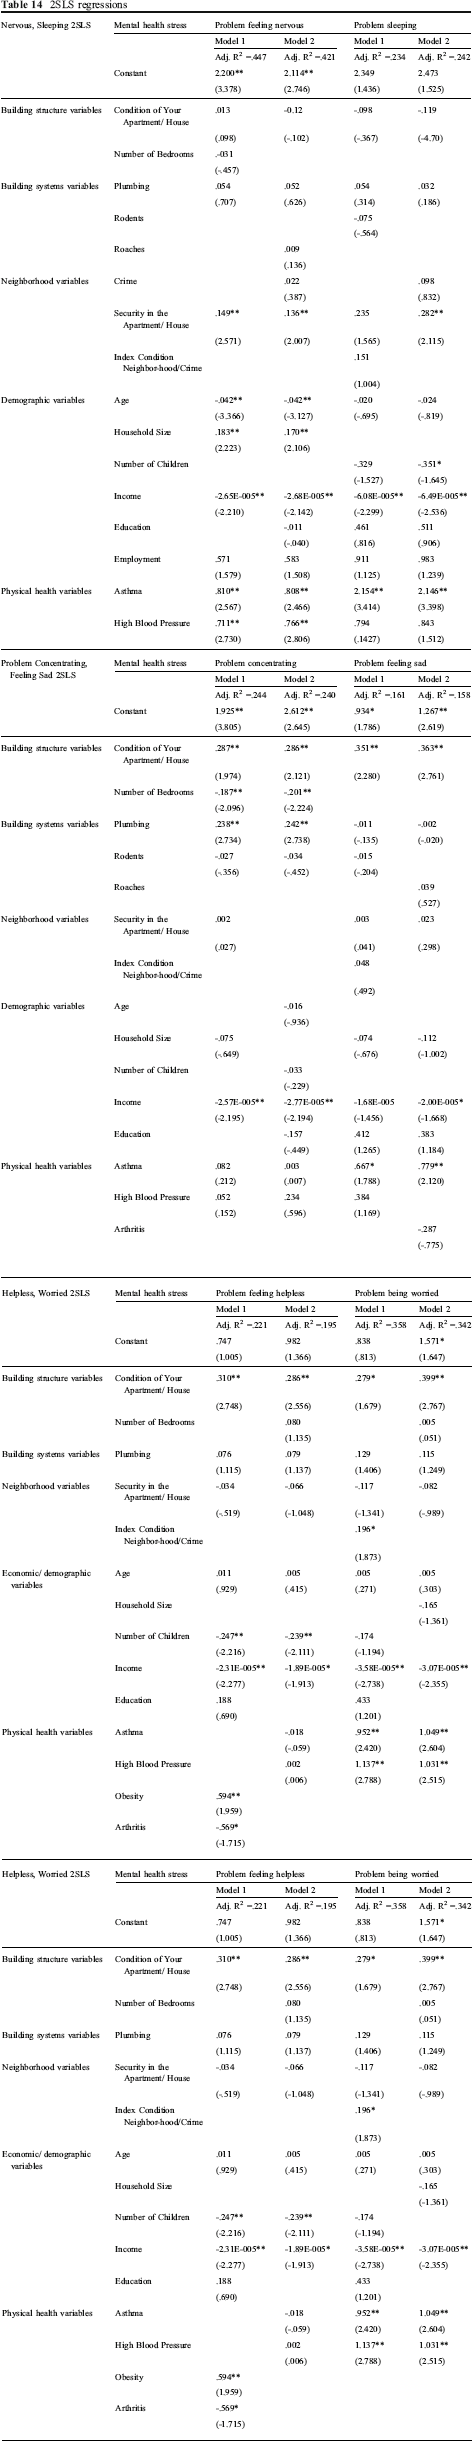
Significant at the .05 level
Significant at the .01 level
The condition of the apartment continued to be a powerful explanatory variable for all of the models. The stressor “number of bedrooms” was negatively and significantly associated with “problem concentrating” in a counter-intuitive sign possibly related to collinearity with condition of the apartment (Pearson r=.248, t=.005). Plumbing also remained a strong explanatory variable in three of the models, i.e., for “problem concentrating”, “problem feeling nervous” and “problem being depressed”. Among the neighborhood variables, the index of neighborhood conditions was significant with regard to “problem concentrating”.
The demographic/economic variables were slightly less impressive in the 2SLS studies. Income once again was a strong inverse predictor of all eight mental health stresses studied here. Employment also was negative and significantly associated with “problem being depressed” and “problem feeling nervous”. Age remained positive and a significant determinant of “problem being depressed” and “problem feeling nervous”. The number of children was negative and significant in predicting “problem feeling helpless” and “problem sleeping” contrary to expectations. Education was positively associated with “problem being emotionally upset” as in the OLS model.
The physical health variables again were important controls for the models. Asthma helped explain “problem feeling sad”, “problem being emotionally upset”, “problem being worried”, problem feeling nervous”, and “problem sleeping”, similar to its role in the OLS studies. High blood pressure proved to be significant for “problem being emotionally upset” and “problem being worried”. Obesity once again was a strong predictor of “problem feeling helpless”. Arthritis was a significant predictor for “problem feeling helpless” and “problem being depressed”.
Discussion of the findings
The estimation of the OLS models with control variables and the 2SLS models correcting for simultaneity provide similar evidence of statistically significant impacts of housing conditions on mental health status. The importance of these significant findings can be examined by computing a responsiveness measure similar to elasticity.
The coefficients of “condition of your apartment” and “plumbing” are multiplied by the inverse ratio of the means of these variables (see Table 15). The resulting measure allows the computation of the percentage change in the mental health variable associated with a given percentage change in the housing condition. For example, for the “problem concentrating” mental health challenge in the OLS with control variables study, suppose there is a 50% improvement in the self-reported “condition of your apartment.” This would mean that there would be a 50% x 0.218, or a 10.9% improvement in the “problem concentrating” variable. In terms of the Likert scale continuum, this could mean a movement from a value of 3 to a value of 2.673. For “problem being emotionally upset” in the 2SLS model, a 50% improvement in “condition of your apartment” would yield a 50% x 0.443 or 22.15% improvement, or moving from 3 to 2.336 along the Likert scale continuum.
Responsiveness of mental health variables to housing variables
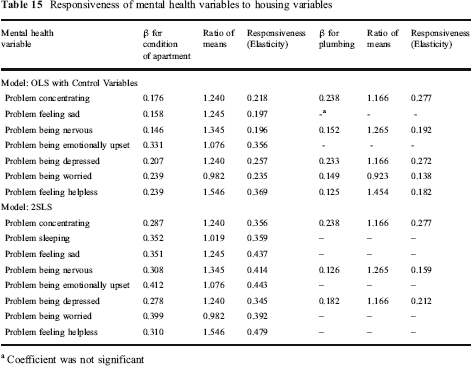
Coefficient was not significant
The responsiveness measures for the OLS with control variables models range from 0.168 to 0.369. These measures tend to be higher in the 2SLS squares, ranging from 0.159 to 0.479. These impacts are therefore relatively inelastic. If improvements occurred both in the overall “condition of your apartment” and in the “plumbing” variable, the impact on mental health conditions could be quite substantial.
Limitations of the findings
The use of self-reported data, while having the advantage of genuinely reflecting the opinion of grassroots participants, remains subject to biases in unknown directions. One example was that some respondents indicated that their housing conditions were not stressors for them because they had reconciled themselves to living in poor conditions, when even a cursory objective appraisal would have noted many housing condition deficits. Self-reported mental health conditions may minimize or exaggerate an actual mental ailment; self reports of housing conditions may similarly be subjective. Persons with non-trivial mental health challenges are less likely to be objective in their self-appraisals than others, either minimizing or exaggerating them. Yet, even given these limitations, one should not be too quick to assume that a clinical appraisal will be more accurate than a self-appraisal, given the professional biases that may skew such data as well.
The problem of simultaneity bias remains an issue, even with the correction in the 2SLS model. Mental health challenges and their personal and environmental settings are multifaceted, interconnected, and mutually causative in many dimensions. Such complex human-environment interactions are difficult to reduce to a modeling system based on classical statistical inference given the inevitable violation of assumptions of independence. Nevertheless, some solace can be derived from the fact that the inferences drawn in the present study are consistent with the general expectations of causality that researchers have found in previous studies.
Conclusion
The modeling studies completed here demonstrate the importance of physical housing conditions (as assessed by residents) in determining the self-reported degree of mental health stress of public housing households. In many cases, mental health conditions of low-income residents could be improved through improved housing quality. The findings also indicate that many other factors are responsible for the variation in mental health stress experienced by these households, including low incomes, joblessness, physical health challenges, neighborhood conditions, and security and crime. The built environment and its upkeep nevertheless are unambiguously important in the mental health of this population.
Within a broader framework, the social determinants of health and disease can be said, with confidence, to include the physical quality and upkeep of housing, but can only be separated from socioeconomic variables such as income, employment, family size and education with difficulty, given the complex weave of the causes of mental health distress. In principle, public housing authorities that undertake HOPE VI projects are seeking to develop new comfortable housing in mixed income neighborhoods that should lead to improvements in mental health outcomes for the participants in the HOPE VI program. Moreover, again in principle, the Community and Supportive Services Programs associated with HOPE VI projects include efforts to address the employment, health, youth development, and public safety needs of public housing residents. In short, the HOPE VI program is a model approach of addressing the social determinants of health and disease through a holistic recipe. Whether this model has actually been implemented with fidelity across the nation remains a continuing matter of inquiry.
Footnotes
Correlations of independent variables
Correlations between independent variables
| The neighborhood that you live in | The condition of the building | The condition of your apartment/house | The number of bedrooms | Heating your apartment/house when it is cold | Cooling your apartment/house when it is hot | The plumbing in your apartment/house | Rodents in your building | Roaches in your building | Security in your building | Security in your apartment/house | Crime in your neighborhood | ||
|---|---|---|---|---|---|---|---|---|---|---|---|---|---|
| The neighborhood that you live in | Pearson Correlation | 1 | .614 ** | .502 ** | .162 | .342 ** | .356 ** | .233 ** | .374 ** | .325 ** | .643 ** | .527 ** | .701 ** |
| ρ | .000a | .000 | .069 | .000 | .000 | .008 | .000 | .000 | .000 | .000 | .000 | ||
| n | 128 | 122 | 128 | 128 | 128 | 128 | 128 | 128 | 128 | 121 | 128 | 128 | |
| The condition of the building | Pearson Correlation | .614 ** | 1 | .755 ** | .332 ** | .444 ** | .424 ** | .429 ** | .401 ** | .359 ** | .529 ** | .447 ** | .523 ** |
| ρ | .000 | .000 | .000 | .000 | .000 | .000 | .000 | .000 | .000 | .000 | .000 | ||
| n | 122 | 122 | 122 | 122 | 122 | 122 | 122 | 122 | 122 | 121 | 122 | 122 | |
| The condition of your apartment/house | Pearson Correlation | .502 ** | .755 ** | 1 | .248 ** | .524 ** | .491 ** | .484 ** | .372 ** | .284 ** | .348 ** | .379 ** | .445 ** |
| ρ | .000 | .000 | .005 | .000 | .000 | .000 | .000 | .001 | .000 | .000 | .000 | ||
| n | 128 | 122 | 128 | 128 | 128 | 128 | 128 | 128 | 128 | 121 | 128 | 128 | |
| The number of bedrooms | Pearson Correlation | .162 | .332 ** | .248 ** | 1 | .200 * | .242 ** | .241 ** | .196 * | -.004 | .267 ** | .201 * | .263 ** |
| ρ | .069 | .000 | .005 | .023 | .006 | .006 | .027 | .962 | .003 | .023 | .003 | ||
| n | 128 | 122 | 128 | 128 | 128 | 128 | 128 | 128 | 128 | 121 | 128 | 128 | |
| Heating your apartment/house when it is cold | Pearson Correlation | .341 ** | .444 ** | .524 ** | .200 * | 1 | .742 ** | .562 ** | .235 ** | .171 | .332 ** | .396 ** | .334 ** |
| ρ | .000 | .000 | .000 | .023 | .000 | .000 | .008 | .054 | .000 | .000 | .000 | ||
| n | 128 | 122 | 128 | 128 | 128 | 128 | 128 | 128 | 128 | 121 | 128 | 128 | |
| Cooling your apartment/house when it is hot | Pearson Correlation | .356 ** | .424 ** | .491 ** | .242 ** | .742 ** | 1 | .632 ** | .357 ** | .280 ** | .332 ** | .402 ** | .399 ** |
| ρ | .000 | .000 | .000 | .006 | .000 | .000 | .000 | .001 | .000 | .000 | .000 | ||
| n | 128 | 122 | 128 | 128 | 128 | 128 | 128 | 128 | 128 | 121 | 128 | 128 | |
| The plumbing in your apartment/house | Pearson Correlation | .233 ** | .429 ** | .484 ** | .241 ** | .562 ** | .632 ** | 1 | .335 ** | .268 ** | .271 ** | .296 ** | .322 ** |
| ρ | .008 | .000 | .000 | .006 | .000 | .000 | .000 | .002 | .003 | .001 | .000 | ||
| n | 128 | 122 | 128 | 128 | 128 | 128 | 128 | 128 | 128 | 121 | 128 | 128 | |
| Rodents in your building | Pearson Correlation | .374 ** | .401 ** | .371 ** | .196 * | .235 ** | .357 ** | .335 ** | 1 | .445 ** | .285 ** | .177 * | .370 ** |
| ρ | .000 | .000 | .000 | .027 | .008 | .000 | .000 | .000 | .002 | .046 | .000 | ||
| n | 128 | 122 | 128 | 128 | 128 | 128 | 128 | 128 | 128 | 121 | 128 | 128 | |
| Roaches in your building | Pearson Correlation | .325 ** | .359 ** | .284 ** | -.004 | .171 | .280 ** | .268 ** | .445 ** | 1 | .352 ** | .361 ** | .378 ** |
| ρ | .000 | .000 | .001 | .962 | .054 | .001 | .002 | .000 | .000 | .000 | .000 | ||
| n | 128 | 122 | 128 | 128 | 128 | 128 | 128 | 128 | 128 | 121 | 128 | 128 | |
| Security in your building | Pearson Correlation | .643 ** | .529 ** | .348 ** | .267 ** | .331 ** | .332 ** | .271 ** | .285 ** | .352 ** | 1 | .703 ** | 493 ** |
| ρ | .000 | .000 | .000 | .003 | .000 | .000 | .003 | .002 | .000 | .000 | .000 | ||
| n | 121 | 121 | 121 | 121 | 121 | 121 | 121 | 121 | 121 | 121 | 121 | 121 | |
| Security in your apartment/house | Pearson Correlation | .527 ** | .447 ** | .379 ** | .201 * | .396 ** | .402 ** | .296 ** | .177 * | .361 ** | .703 ** | 1 | .369 ** |
| ρ | .000 | .000 | .000 | .023 | .000 | .000 | .001 | .046 | .000 | .000 | .000 | ||
| n | 128 | 122 | 128 | 128 | 128 | 128 | 128 | 128 | 128 | 121 | 128 | 128 | |
| Crime in your neighborhood | Pearson Correlation | .701 ** | .523 ** | .445 ** | .263 ** | .334 ** | .399 ** | .322 ** | .370 ** | .378 ** | .493 ** | .369 ** | 1 |
| ρ | .000 | .000 | .000 | .003 | .000 | .000 | .000 | .000 | .000 | .000 | .000 | ||
| n | 128 | 122 | 128 | 128 | 128 | 128 | 128 | 128 | 128 | 121 | 128 | 128 |
Correlation is significant at the 0.01 level (2-tailed).;
Correlation is significant at the 0.05 level (2-tailed)