
Abstract
This paper is one of the few papers to investigate the relationship between poor eyesight and educational outcomes. Using data from rural Ethiopia that collected data on visual acuity, results show that girls with poor eyesight have an increased probability of dropping out of school. Girls that suffer from poor eyesight have an 8 percentage points higher probability of dropping out of school. No such relationship for boys is found. Results also show that, for both boys and girls, learning achievement is negatively related with poor eyesight. The paper sheds light on the potential benefits to educational outcomes of providing eyeglasses to visually impaired children.
Introduction
Poor health is recognized to be a major obstacle to the progress of developing countries (World Bank 1993). Yet, little is known about the mechanisms linking health and development. This paper explores the link between health and development by documenting the relationship between poor eyesight and educational outcomes. Poor eyesight is a considerable burden in developing countries. Bundy et al. (2003) report the prevalence of refractive errors among school age children in developing countries at 10 percent, most of which could be corrected by eyeglasses.
This paper investigates the role of poor vision on educational outcomes using data from high-poverty school catchment areas in rural Ethiopia. The dataset is unique in that it collected data on visual acuity for close to 2000 school-age children. The paper explores the relationship between poor eyesight and school dropout rates, grade repetition, learning achievement and cognitive development. This is one of few studies that have examined the role of vision impairment on educational outcomes in developing countries and the only paper, to our knowledge, using data from Sub-Saharan Africa. Gomes-Neto et al. (1997), using data from rural Brazil, find that poor vision increases dropout, hinders grade promotion and decreases performance in achievement tests. In a randomized controlled trial administered in rural China, Glewwe et al. (2012) investigate the role of providing eyeglasses to visually impaired students and find that for students who accepted eyeglasses, average test scores increased by 0.15 to 0.22 standard deviations, equivalent to 0.33–0.5 years of additional schooling. Drawing on the same data, Hannum and Zhang (2012) find that students who wear glasses perform better on literacy and math tests, and are less likely to fail a class.
Few studies have investigated the relationship between poor eyesight and learning outcomes, although it is believed that children with poor eyesight can lose educational opportunities if in fact eyesight problems lead to low grade attainment and prevent better learning outcomes. Schooling decisions can be viewed as parental decisions that are based on (perceived) net marginal returns to schooling. 1 When a child's school performance is anticipated or revealed to be low, as a consequence of poor vision or other learning hindering factors, perceived net marginal returns may become negative. 2 Low school performance increases the likelihood of non-promotion which in turn increases the likelihood of dropout and repetition. 3
There is growing interest in the relationship between health and educational outcomes. 4 A positive correlation between health and education has been firmly established in the literature. However, the causal relationship between health and education remains uncertain. First, health may causally affect education. Stronger health may result in children obtaining more education (Behrman and Rosenzweig 2004). Second, education may causally affect health, lowering morbidity and mortality in adult life (Lleras-Muney 2005). Third, there may exist a third omitted factor affecting both health and education such as time preferences (Eide and Showalter 2011).
Jensen (2010) finds that education decisions are influenced by perceived net marginal returns to education, based on limited and imperfect information.
Glewwe and Kremer (2006) use a model to show how inputs to schooling, one of these being the child's health, influence educational outcomes. Yamauchi (2008) presents a model in which parents invest in siblings who are relatively well-endowed in terms of health. On the other hand, schooling investments decrease if greater health also raises wages, increasing the opportunity cost of schooling.
Grade repetition may lead to lower dropout in the future if it enhances subsequent learning achievement which in turn increases net marginal returns to education. However, grade repetition may also be a precursor to dropout. Retained students are taken out of their social group which may be detrimental to their motivation; they might be mocked by their old and new peers and struggle harder to be socially accepted because they are older. Thus, whether poor eyesight operating through grade repetition leads to more or less subsequent dropout is not clear from a conceptual point of view.
For a review of the literature linking health to educational and adult outcomes refer to Currie (2009) and Eide and Showalter (2011).
This paper contributes to the literature by investigating the role of poor eyesight across gender in one of the poorest countries in Sub-Saharan Africa. Of the few studies which have investigated the relationship between poor vision and schooling outcomes among children, most have used data from Asia. Whereas other studies have looked at the impact of poor eyesight of children, the gender dimension of poor eyesight on educational outcomes in developing countries has not been explored in the literature. If households view net returns to education to be lower for girls than for boys, then girls will be more at risk of dropping out due to health problems that hinder learning. Psacharopoulos and Patrinos (2004) find that returns to primary education are much lower for girls than for boys. 5 In a study on the impact of increased job opportunities for women, Jensen (2012) finds large positive effects on educational attainment, suggesting that investments in women's education are low because returns are perceived to be low. Broussard (2012), who focuses on nutrition's role for human capital, provides evidence that households allocate more resources to male household members whose market returns are higher. Hence, when, possibly due to poor eyesight, school performance is low, girls’ net returns to continued schooling will be more likely perceived to be negative, resulting in withdrawal from school.
However, at secondary education level this is reversed as girls are reported to have higher returns to education than boys. The focus of the present study is on primary education.
While poor eyesight may indeed negatively impact learning, it may also be the case that poor eyesight is associated with improved learning outcomes if students who study more are more susceptible to vision problems. Angle and Wissmsann (1980) argue that vision can be affected by individuals’ activities, in particular how much time they spent doing ‘near-work’ activities. Near-work activities, such as reading, are likely to be correlated with schooling outcomes potentially making inference on the relationship between eyesight and schooling outcomes spurious. Students’ vision may suffer from reverse causality as children who study more will have their eyesight deteriorate faster. In studies in Asia, the correlation of prevalence of myopia (nearsightedness) and educational attainment has been found to be positive (Tay et al. 1992; Au Eong et al. 1993). 6
Refractive development is a dynamic process. During infancy and early childhood, the variability of refractive error decreases progressively. Before start-of-school age, most children are functionally emmetropic. Thereafter, the distribution of refractive error gradually shifts to more myopia with increasing age, the incidence of myopia reaching its peak at around 9–12 years of age (Wojciechowski 2011). However, it remains uncertain to which extent near-work activities contribute to the shift towards more myopia with increasing age.
Poor eyesight is influenced by both environmental and genetic factors. In urban areas, a higher prevalence of myopia has been documented in a number of studies (He et al. 2004; Lin et al. 2004; Wu et al. 2001). As mentioned above, one possible explanation is that children in urban areas spend more time reading and writing outside the school compared to children in rural areas (Saw et al. 2001). Parents that have myopia tend to have children that have myopia. However, the roles of environmental influences and genetic predisposition to myopia remain uncertain (Mutti et al. 2002). In particular, parents may pass on their inclination to reading to their children rather than myopia itself.
Identifying the effect of poor eyesight on educational outcomes is complicated due to these endogeneity issues. Although there are a number of limitations in identifying the causal impact of poor eyesight on educational outcomes, documenting the relationship between vision problems in school age children and educational outcomes is an important first step in identifying mechanisms that either improve or hinder children's learning outcomes.
The results obtained in this study show that poor vision is positively related to school dropout among girls. Girls that suffer from poor eyesight have an 8 percentage points higher probability of school dropout. The results also show that learning achievement is negatively related with poor eyesight.
The outline of the paper is as follows. Section “Data and Descriptive Analysis” describes the data used in this study. Section “Empirical Specification and Results” presents the empirical specification and the results. Section “Conclusion” concludes.
Data and Descriptive Analysis
The data used in this paper comes from a survey conducted in 2010 by the United Nations World Food Programme (WFP) Country Office Ethiopia and the University of Mannheim involving school catchment areas in food-insecure woredas (districts) in the four major regions of Ethiopia (Amhara Region, Oromia Region, Southern Nations, Nationalities, and Peoples’ Region, and Tigray Region). 7 Employing a two-stage sampling design, the survey sampled 200 school catchment areas in the four regions of the country stratified by highland and pastoral areas (see Table 1). Overall, the survey aimed to achieve the inclusion of one-third feeding schools (program schools), one-third schools that had been phased out from the program and one-third non-program schools. 8 The second-stage sampling entailed sampling of ten children age 7 to 13 years per school catchment area who were either enrolled in school or not at the time of the survey. This design feature of the survey allows for a richer analysis than surveys that are based on the school only. It allows for the investigation of relationships within the school service area, circumventing selection problems associated with children enrolled in school based on unobserved characteristics. Only students enrolled in grades 2 to 4 were included. In sum, the survey was restricted to (i) children aged between 7 and 13 years old and (ii) children enrolled in grades 2–4 if they were students. If a child was not enrolled, then the grade restriction did not apply, only the age restriction would be effective. The survey provides information on health, education, learning, and child and household characteristics for close to 2000 children.
The original purpose of the survey was to study the impact of WFP's school feeding program on enrollment, attendance and learning achievement including attention span and cognitive development. See Haile et al. (2011).
In Southern Nations, Nationalities, and Peoples’ Region (SNNPR) phase-out schools were not included as there were relatively few such schools, resulting in one-half program and one-half non-program sampled school catchment areas in that region.
Distribution of school catchment areas
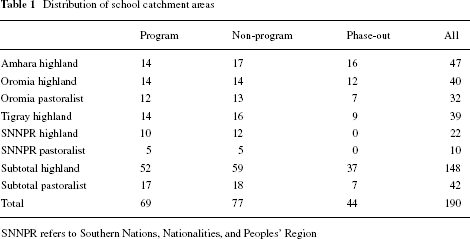
SNNPR refers to Southern Nations, Nationalities, and Peoples’ Region
The analysis is based on the sample originating from the survey as described in the previous paragraph, except that the sample used for analysis is restricted to the Ethiopian highlands. Pastoralists, who are excluded from the analysis, live in the lowland areas, representing a small fraction of the Ethiopian population. Pastoralist school catchment areas generally exhibit lower enrollment rates and higher gender disparity, albeit with some improvement in the recent past (Ministry of Education 2011).
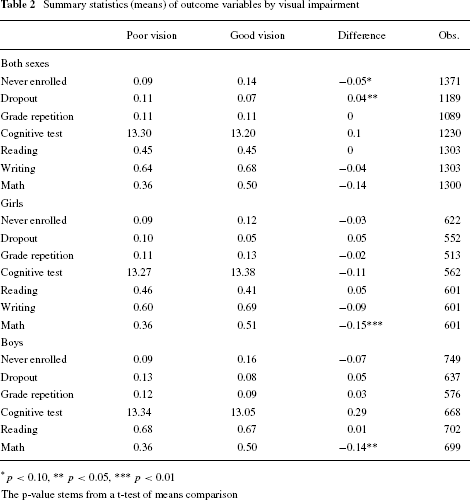
After dropping approximately 100 children due to inconsistencies, 1891 children remain in the sample. Of this, 419 children are excluded because they are part of the pastoralist sample. Of the remaining 1472 children, 1170 children are enrolled in school, while 302 are not enrolled. The analysis of poor eyesight on learning achievement (reading, writing and math skills) and cognitive development as well as on never-enrolled status is based on all 1472 children. However, observations used in the analysis fall short of 1472 children due to missing values (see Table 2). The sample used for the analysis of school dropout is restricted to current and former students, resulting in a sample of 1271 children. The analysis of grade repetition is conditional on being a student, as the data lack the information on grade repetition among former students, restricting the sample to 1170 children. Again, observations used in the analysis fall short of 1271 and 1170 children respectively due to missing values.
Summary statistics (means) of outcome variables by visual impairment
p < 0.10
p < 0.05
p < 0.01
The p-value stems from a t-test of means comparison
The results obtained in this study pertain to children living in high-poverty highland woredas in the four major regions of Ethiopia. Although the geographic coverage is broad, it should be noted that the results cannot be readily extended to less poor or urban areas within Ethiopia.
The key variable of interest for this study is a measure of a child's eyesight. A unique feature of the survey is that the survey administered the Landolt C vision test to every child interviewed in the survey (see Fig. 1 in the Appendix). Landolt C is a symbol that consists of a ring with a gap, thus looking similar to the letter C. The gap could be on the left, right, bottom, or top of the ring. A table with 12 rows of gradually smaller symbols was placed in front of the child. The child was then asked to indicate the position of the gap. The first row corresponds to 10 percent of normal eyesight coded as 0.1, the second row to 20 percent of normal eyesight coded as 0.2 and so on. If the child could read the 10th row, this corresponds to normal eyesight coded as 1.0. If the child could read beyond the 10th row, this corresponds to 150 percent (11th row coded as 1.5) and 200 percent (12th row coded as 2.0) of normal eyesight, respectively. The test was conducted separately for the left and the right eye and, if the child wore glasses, separately with and without glasses.
In the present study, poor eyesight is defined as a visual acuity score below 0.8 in one or both eyes. 9 Due to the relatively high prevalence of poor eyesight in the sample, I focus on more severe eyesight problems. 10 Glewwe et al. (2012) use a visual acuity cutoff point of 0.9, choosing their cutoff point based on acceptance of offered eyeglasses. In their study, acceptance was poor among children with a visual acuity score of 0.9. However, a majority of children with a visual acuity score of less than 0.9 accepted the glasses.
See Colenbrander (2001) for measurement of poor vision and visual acuity.
As a robustness check, I perform the analysis defining poor eyesight as having a visual acuity score below 0.9 in one or both eyes. Results are similar except that they tend to be smaller in terms of magnitude.
In the sample used in this paper, the share of children with poor eyesight, as defined by a visual acuity score below 0.8, is 16 percent. If we define poor eyesight by receiving a visual acuity score below 0.9 in at least one eye, 28 percent of sample children have poor eyesight. Virtually no children wore glasses.
To measure scholastic performance, test scores on children's reading, writing and arithmetic skills are used. 11 Children were tested regardless of whether they were enrolled in school. For reading, children were asked to read pre-prepared letters, words and sentences. In the writing test, children were asked to write down pre-prepared sentences that the interviewer read aloud. Children were also tested on their arithmetic skills using up to three different arithmetic questions. In all three cases, two different versions of the tests were administered depending on the age of the children involved – one set for children between the ages of 7 and 10 years and a more difficult set for children between the ages of 11 and 13 years.
The survey adapted tests on reading, writing and arithmetic skills from the Young Lives project, a longitudinal study conducted in four countries (Peru, Ethiopia, India and Vietnam). http://www.younglives.org.uk.
Performance on the Raven's Standard Progressive Matrices (SPM) test is used to measure a child's cognitive skills. Children were tested individually; there was no time limit. The survey administered the first 25 problems of the Raven's test, including problem sets A and B. Each problem involves a pattern with a bit taken out. The child is asked to select the bit that completes the pattern from a number of options printed beneath. The patterns are simple at the beginning and become increasingly more difficult. The major benefit of this test is that no formal schooling is required to solve the questions. Furthermore, the nonverbal aspect of the test reduces the impact of cultural or language bias. The Raven's test was chosen over other tests such as the Wechsler Intelligence Scale for Children (WISC), a more comprehensive intelligence test, due to its relative straightforward application in the field.
Dropout is a dummy variable that is one if a currently non-enrolled child attended school in the past and zero if the child is currently enrolled. Grade repetition is also a dummy variable indicating whether a student repeated a grade in the past, conditional on being a student. I use this variable to investigate the likelihood of repeating a grade conditional on being enrolled. 12
Unfortunately, I am not able to investigate grade repetition among former students as for the former students I lack the information on whether they repeated a grade. Grade repetition and dropout are likely to be interdependent. If grade repetition eventually leads to dropout, then grade repetition will be systematically underestimated as these children are only recorded as dropouts but not as repeaters.
Table 2 shows that children with poor eyesight experience significant differences in enrollment and dropout, but not grade repetition, compared to children with normal eyesight. However, the significant differences with respect to enrollment and dropout do not hold true in the female and male sub samples. Cognitive skills are measured on a scale between 0 and 25, indicating how many questions were correctly answered. Visually impaired children have a mean score of 13.3. Although the difference is not statistically significant, visually impaired children score higher than children with good vision. As mentioned above, despite having a negative impact on learning achievement, poor eyesight may be associated with improved learning outcomes if students who study more and thus acquire better cognitive skills have their eyesight deteriorate faster. Finally, reading, writing and math are dummy variables indicating whether a child could read a word, write a simple sentence and do basic calculations, respectively. Table 2 shows that visually impaired children perform worse in math compared to children with normal eyesight. This relationship holds for both male and female children.
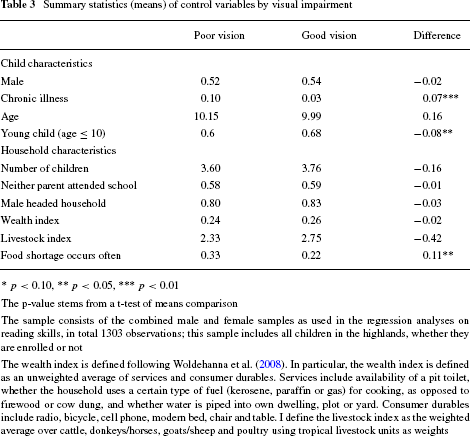
Table 3 presents simple comparisons of means of covariates used in the analysis by visual impairment. Table 3 shows that children with poor eyesight suffer more often from a chronic illness, and live in households that more often report that food shortages occur often, compared to children with normal eyesight.
Summary statistics (means) of control variables by visual impairment
* p < 0.10
p < 0.05
p < 0.01
The p-value stems from a t-test of means comparison
The sample consists of the combined male and female samples as used in the regression analyses on reading skills, in total 1303 observations; this sample includes all children in the highlands, whether they are enrolled or not
The wealth index is defined following Woldehanna et al. (2008). In particular, the wealth index is defined as an unweighted average of services and consumer durables. Services include availability of a pit toilet, whether the household uses a certain type of fuel (kerosene, paraffin or gas) for cooking, as opposed to firewood or cow dung, and whether water is piped into own dwelling, plot or yard. Consumer durables include radio, bicycle, cell phone, modern bed, chair and table. I define the livestock index as the weighted average over cattle, donkeys/horses, goats/sheep and poultry using tropical livestock units as weights
Empirical Specification and Results
Empirical Specification
This paper is interested in identifying the effect of poor vision on schooling outcomes. However, health is correlated with family and individual characteristics many of which are not observed by the econometrician. The reduced form regression to be estimated is:

where yis represents schooling outcome for individual i in school catchment area s and PVis is a dummy variable for if the individual has a visual acuity score below 0.8 in at least one eye.
The analysis controls for household and individual characteristics to account for possible correlation between eyesight and the error term. For example, the survey did not collect data on individual (mal)nutrition – a variable that is likely to be correlated with eyesight. However, the analysis does control for household and individual characteristics that inter alia determine how well an individual is able to cope with shocks to food availability. Furthermore, controlling for wealth is mandated as wealthy households are more likely to invest more in both health and education relative to poor households.
The learning achievement related regressions control for whether a child is aged between 7 and 10 years (a dummy variable) because the survey administered different tests for younger and older children, except for the Raven's test which was administered irrespective of age. In small samples the distribution of younger children might be unequal across visual impairment status. The analysis also controls for chronic diseases that the child might have. This is relevant because chronic conditions might be correlated with poor eyesight. 13
However, this measure might actually include poor vision as households may perceive poor vision as a chronic condition. I therefore re-run all regressions without this control variable. Changes in results are only minor.
The analysis is run separately for boys and girls. In many Sub-Saharan African countries, girls are much less likely to attend school and to complete basic education. The largest female gender gaps tend to occur in countries with low income and small overall participation in education (World Bank 2012). In Ethiopia, there has been considerable improvement in primary education net enrollment rates in the past decade (Broussard et al. 2013). 14 In the academic year 2010/11, boys’ primary education net enrollment rate is reported at 87 percent, the corresponding figure for girls is 83.5 percent (Ministry of Education 2011). According to national education statistics, the gender gap has narrowed considerably. In 2006/07, boys’ net enrollment rate is reported at 82.6 percent, the corresponding figure for girls is 75.5 percent (Ministry of Education 2011). However, dropout rates continue to remain high. In 2009/10, dropout rates are reported to be 20.4 percent for boys and 19.2 percent for girls in grade 1; in grades 2 and 3, dropout rates range between 10 and 11 percent for boys and girls (Ministry of Education 2011). The sample used in the analysis has a slightly lower dropout rate than the national average.
In Ethiopia, primary education lasts 8 years and is split into grades 1–4 (primary first cycle) and grades 5–8 (primary second cycle). Secondary education is also divided into two cycles. Grades 9–10 provide general secondary education and, upon completion, students are streamed either into grades 11–12 as preparation for university, or into technical and vocational education and training (TVET). This paper focuses on the first cycle of primary education.
All regressions include school fixed effects, which allows to focus on the variation in poor eyesight within school catchment areas. The use of school fixed effects is warranted as school catchment areas are generally different in terms of unobserved characteristics such as teaching quality, school equipment etc. The fixed-effects approach focuses on within-group (school catchment area) variation, omitting across-group variation as this variation might reflect omitted variable bias.
Estimations for binary dependent variables are based on the linear probability model. 15 Standard errors are clustered at the school catchment area level.
Despite being computationally tractable and its intuitive interpretation, the linear probability model has the limitations that predicted probabilities can lie outside the unit interval and that the error term will be heteroscedastic. When I re-run the analysis using the logit model, the direction and statistical significance of the coefficients in the linear probability model are confirmed.
While I acknowledge that the non-experimental and cross-sectional nature of the data does not allow me to rule out correlation between visual impairment and the error term, the strength of these data are their broad geographical coverage within Ethiopia, as the data cover rural school catchment areas of the four major regions of the country. Other studies, e.g. Glewwe et al. (2012), attain stronger internal validity but are more local in scale. The results obtained in this study provide some noteworthy correlations that have not been looked at so far and potentially form the basis of future studies.
Results
This subsection first presents the results for educational attainment followed by the results on the effect of poor eyesight on cognitive development and learning achievement.
Educational Attainment
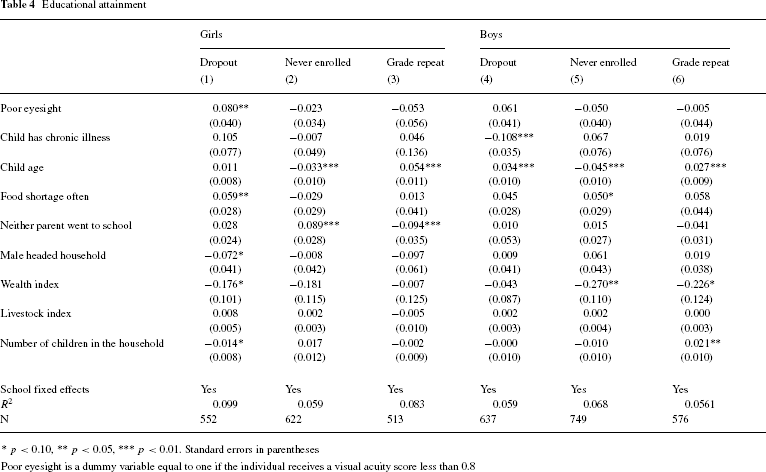
Table 4 present results on the likelihood of dropping out of school, never being enrolled in school, and repeating a grade. Columns 1–3 report the results for girls, while columns 4–6 report the results for boys.
Educational attainment
p < 0.10
p < 0.05
p < 0.01. Standard errors in parentheses
Poor eyesight is a dummy variable equal to one if the individual receives a visual acuity score less than 0.8
For girls, poor eyesight is positively correlated with the likelihood of dropping out of school. Girls with poor eyesight are 8 percentage points more likely to drop out of school. For comparison, Gomes-Neto et al. (1997) report an 8.6 percentage points higher probability of dropout. This result still holds if actual level of visual acuity is used instead of a dummy variable constructed from a cut-off point of 0.8, in which case a 0.1 decline in the visual acuity score is associated with an increase in dropout by 1.6 percent (not shown).
Poor eyesight appears to be negatively correlated with the likelihood of never being enrolled in school. This holds for girls and and boys. This finding, although the results are not significantly different from zero, is in line with the literature that documents a positive correlation between poor eyesight and enrollment. From a conceptual point of view, it is not clear whether parents are more likely to enroll a child that has normal eyesight as opposed to a child with poor eyesight. As argued earlier, parents base their educational decisions on perceived marginal returns to education net of marginal costs. Consequently, parents may perceive a child with poor eyesight to have lower opportunity costs of schooling as she may be considered to be unfit for certain tasks, such a herding. On the other hand, parents may expect a visually impaired child to do less well in school and therefore perceive the marginal benefits to be lower.
Poor vision also appears to have no impact on the likelihood of repeating a grade conditional on being enrolled, i.e. based on a sample of current students. It should be noted that selection bias is expected to play a more important role, changing the pool of students potentially based on unobservables, in a sample that is restricted to current students. As mentioned above, the survey does not contain information on grade repetition among children currently not enrolled. 16
I re-ran the grade repetition regressions using the Heckman two-step estimator. The coefficients on poor vision are similar to the linear probability model and the lambda coefficients are not significantly different from zero, providing no evidence of selection.
The positive coefficient on poor eyesight in the school dropout regression along with the negative coefficient in the grade repetition regression are consistent with parents withdrawing their daughters out of school instead of allowing them to repeat a grade if poor eyesight indeed hinders their ability to learn.
The findings on the other covariates are in line with expectations. Older girls are less likely to have never been enrolled in school and are more likely to have repeated a grade. Girls in households where neither parent went to school are more likely to have never been enrolled in school although they are less likely to repeat a grade. The negative and significant coefficient on parental education in the grade repetition regressions is an interesting observation. The result is consistent with the positive (although not significant) coefficient on parental education in the school dropout regression, where girls are less likely to repeat a grade but instead drop out. Interestingly, girls living with a male household head are less likely to drop out of school.
Columns 4–6 in Table 4 present the results for the male sub-sample. Poor eyesight is positively related with the likelihood of dropping out of school and negatively correlated with never being enrolled in school and the likelihood of repeating a grade. However, these results are not significantly different from zero.
Cognitive Development and Learning Achievement
Results on cognitive development and learning achievement presented in Table 5 are based on regressions using the sample of all children – whether they are enrolled or not. Table 5 presents results on cognitive development (score on the Raven's Test), reading, writing, and math skills. Columns 1–4 report the results for girls, while columns 5–8 report the results for boys.
Cognitive development and learning achievement
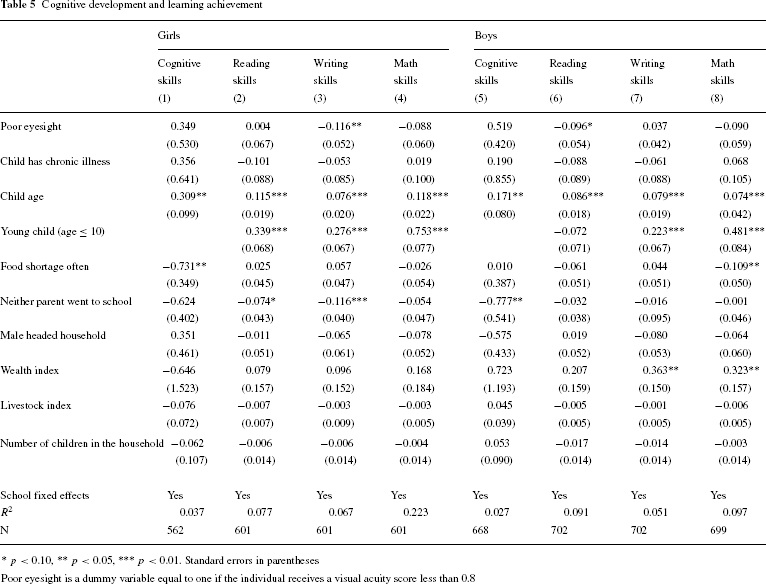
p < 0.10
p < 0.05
p < 0.01. Standard errors in parentheses
Poor eyesight is a dummy variable equal to one if the individual receives a visual acuity score less than 0.8
The coefficient in the cognitive skills regressions is positive for both girls and boys, though it is not significant. As mentioned above, enrollment, through time spent on near-work activities, may contribute to poor eyesight. The resulting bias will be positive, if the correlation between poor eyesight and enrollment 17 is positive and there is a positive correlation between enrollment and cognitive development.
Enrollment can be regarded as a proxy for near-work activities, in particular study time.
For girls, poor eyesight is positively correlated with reading, and negatively correlated with writing and math skills. However, only for writing skills is the result significantly different from zero. For the male sub-sample (columns 5–8) poor eysight is positively correlated with writing and negatively correlated with reading and math. However, only for reading skills is the coefficient significantly different from zero at the 10 % level. These results are consistent with Glewwe et al. (2012) who find that for students who wore eyeglasses for one year test scores (averaged over Chinese, math and science) increased by 0.15 to 0.22 standard deviations.
As a robustness check, I re-run the analysis defining poor eyesight as having a visual acuity score below 0.9 in one or both eyes. Results are similar except that they are smaller in terms of magnitude (not shown).
In sum, the negative correlation between school performance (as measured by reading, writing, and math skills) and poor eyesight, along with the positive correlation between the likelihood of dropping out of school and poor eyesight suggest that poor eyesight negatively affects school performance and increases the likelihood of dropping out. This is consistent with poor eyesight, operating through low learning achievement, increasing the probability of dropout.
Conclusion
Eyesight problems, which are mostly uncorrected, are prevalent among children in developing countries. However, little is known about the impact of poor vision on educational outcomes. Children lose educational opportunities if vision problems result in low grade attainment and poor academic achievement.
This paper explored the role of poor vision on educational outcomes in rural Ethiopia. I found that around 16 percent of children have poor eyesight. Of these children, virtually no child wears eyeglasses. Results showed that poor vision is positively associated with school dropout among girls. This effect is substantial. Girls that suffer from poor eyesight have an 8 percentage points higher probability of school dropout. Results also showed that learning achievement is negatively related with poor eyesight.
This analysis is important for public policy. The evidence presented in this paper lends some support to potentially large benefits if vision were to be corrected through properly fitted eyeglasses, particularly with respect to girls’ educational attainment. Although this study does not arrive at cost estimates, low-cost self-adjustable glasses are available, 18 having the potential of providing vision correction in remote rural areas where there is limited access to the services of eye care professionals.
See Global Vision 2020. http://www.gv2020.org.
Footnotes
Acknowledgments
I thank Nzinga H. Broussard and Björn Vollan for helpful and valuable comments. I also thank participants at the conference Health. Development. Inequality. at TU Darmstadt. Part of this paper was written while the author was affiliated with the University of Mannheim's Center for Doctoral Studies in Economics (CDSE) and Department of Economics. I thank the Ethiopian Development Research Institute (EDRI) for their kind support and encouragement provided during the author's research stay.