
Abstract
Prognosis and management of carcinoma of the pharynx and larynx is now based on the morphologic analysis of the tumor spreading, differentiation grading, and type of microscopic invasion. The DNA ploidy status and the cell proliferation activity analyzed by flow cytometry give us complementary information about the prognosis and the management and support of the patients. We performed a study of 91 cases of carcinoma of the larynx and pharynx by means of flow cytometry. Forty-three patients were treated by surgery alone, and 48 patients also received radiotherapy. Fifty-five were aneuploid (60%); this percentage increased to 74% in the pharynx area and fell to 47% at the larynx level. The aneuploid tumors showed worse behavior in the patients treated by surgery alone compared with those who also received radiotherapy. The S-phase fraction was high in aneuploid tumors, in positive lymph nodes, and in advanced stages. The S-phase fraction was higher in poorly differentiated tumors. In patients treated by surgery alone, we noticed that by combining both cytometric variables two different kinetic profiles could be defined related to the patients' behavior. The diploid tumors with a low S phase had the greatest rates of survival, whereas diploid tumors with a high rate of S phase and aneuploids had a lower rate.
Carcinoma of the pharynx and larynx (PLC) is a disease that has undergone a progressive increase over recent decades, reaching an incidence of 6% of all malignant tumors. 1 Although the prevention of risk factors has reduced its incidence, the gradual aging of the population has limited this decline. 2 Furthermore, therapeutic advances have enabled stabilization and have sometimes reduced the death rate, but because they are not risk free, they have increased patient morbidity. 3
At present, new surgical techniques have been adopted to obtain more functional results, improving the patients' quality of life. 4 However, the high doses of radiotherapy used as adjuvant treatment increased the morbidity. 5 As a result of this, we decided to seek other biologic parameters as markers of tumor behavior, which allow appropriate therapeutic monitoring.
METHODS AND MATERIAL
The prospective study of 91 patients with PLC was carried out in the Head and Neck Surgery Departments of the Hospital Central de Asturias and Hospital Valle del Nalón, between January 1991 and January 1994. The treatment consisted of either surgery alone (group A, 43 cases) or surgery combined with radiotherapy (group B, 48 cases). The minimum follow-up period was 2 years ending in January 1996. Patients who have received other treatments were excluded from the data.
The PLC was diagnosed with the usual procedures: history, physical examination, laryngoscopy, CT, and MRI. All cases were classified following the 1989 UICC rules—according to the tumor's supraglottic, glottic, oropharyngeal and hypopharyngeal localization; its TNM stage; and especially the postsurgery histologic classification (pTNM). In the follow-up, having excluded nonsquamous carcinoma, we assessed the survival time in the months up to the patient's death. The progression of the neoplasia was estimated by the appearance of recurrences and metastases.
Samples of the tumoral parts of nonnecrotic areas were taken from different depths. The samples were then immediately frozen at −70° C and were stored and transported in liquid nitrogen. The cellular disaggregates were suspended in phosphate-buffered saline solution and were filtered through nylon mesh of 100 μm pore. The pellet obtained by centrifugation at 300g and was stained with propidium iodide following the Vindelöv technique. 6 The samples were then analyzed in a Fascan (Becton Dickinson, San Jose, Calif.) by use of the Cellfit program (Becton Dickinson). In the analysis processes the recommendations of the Consensus Conference were taken into account.7
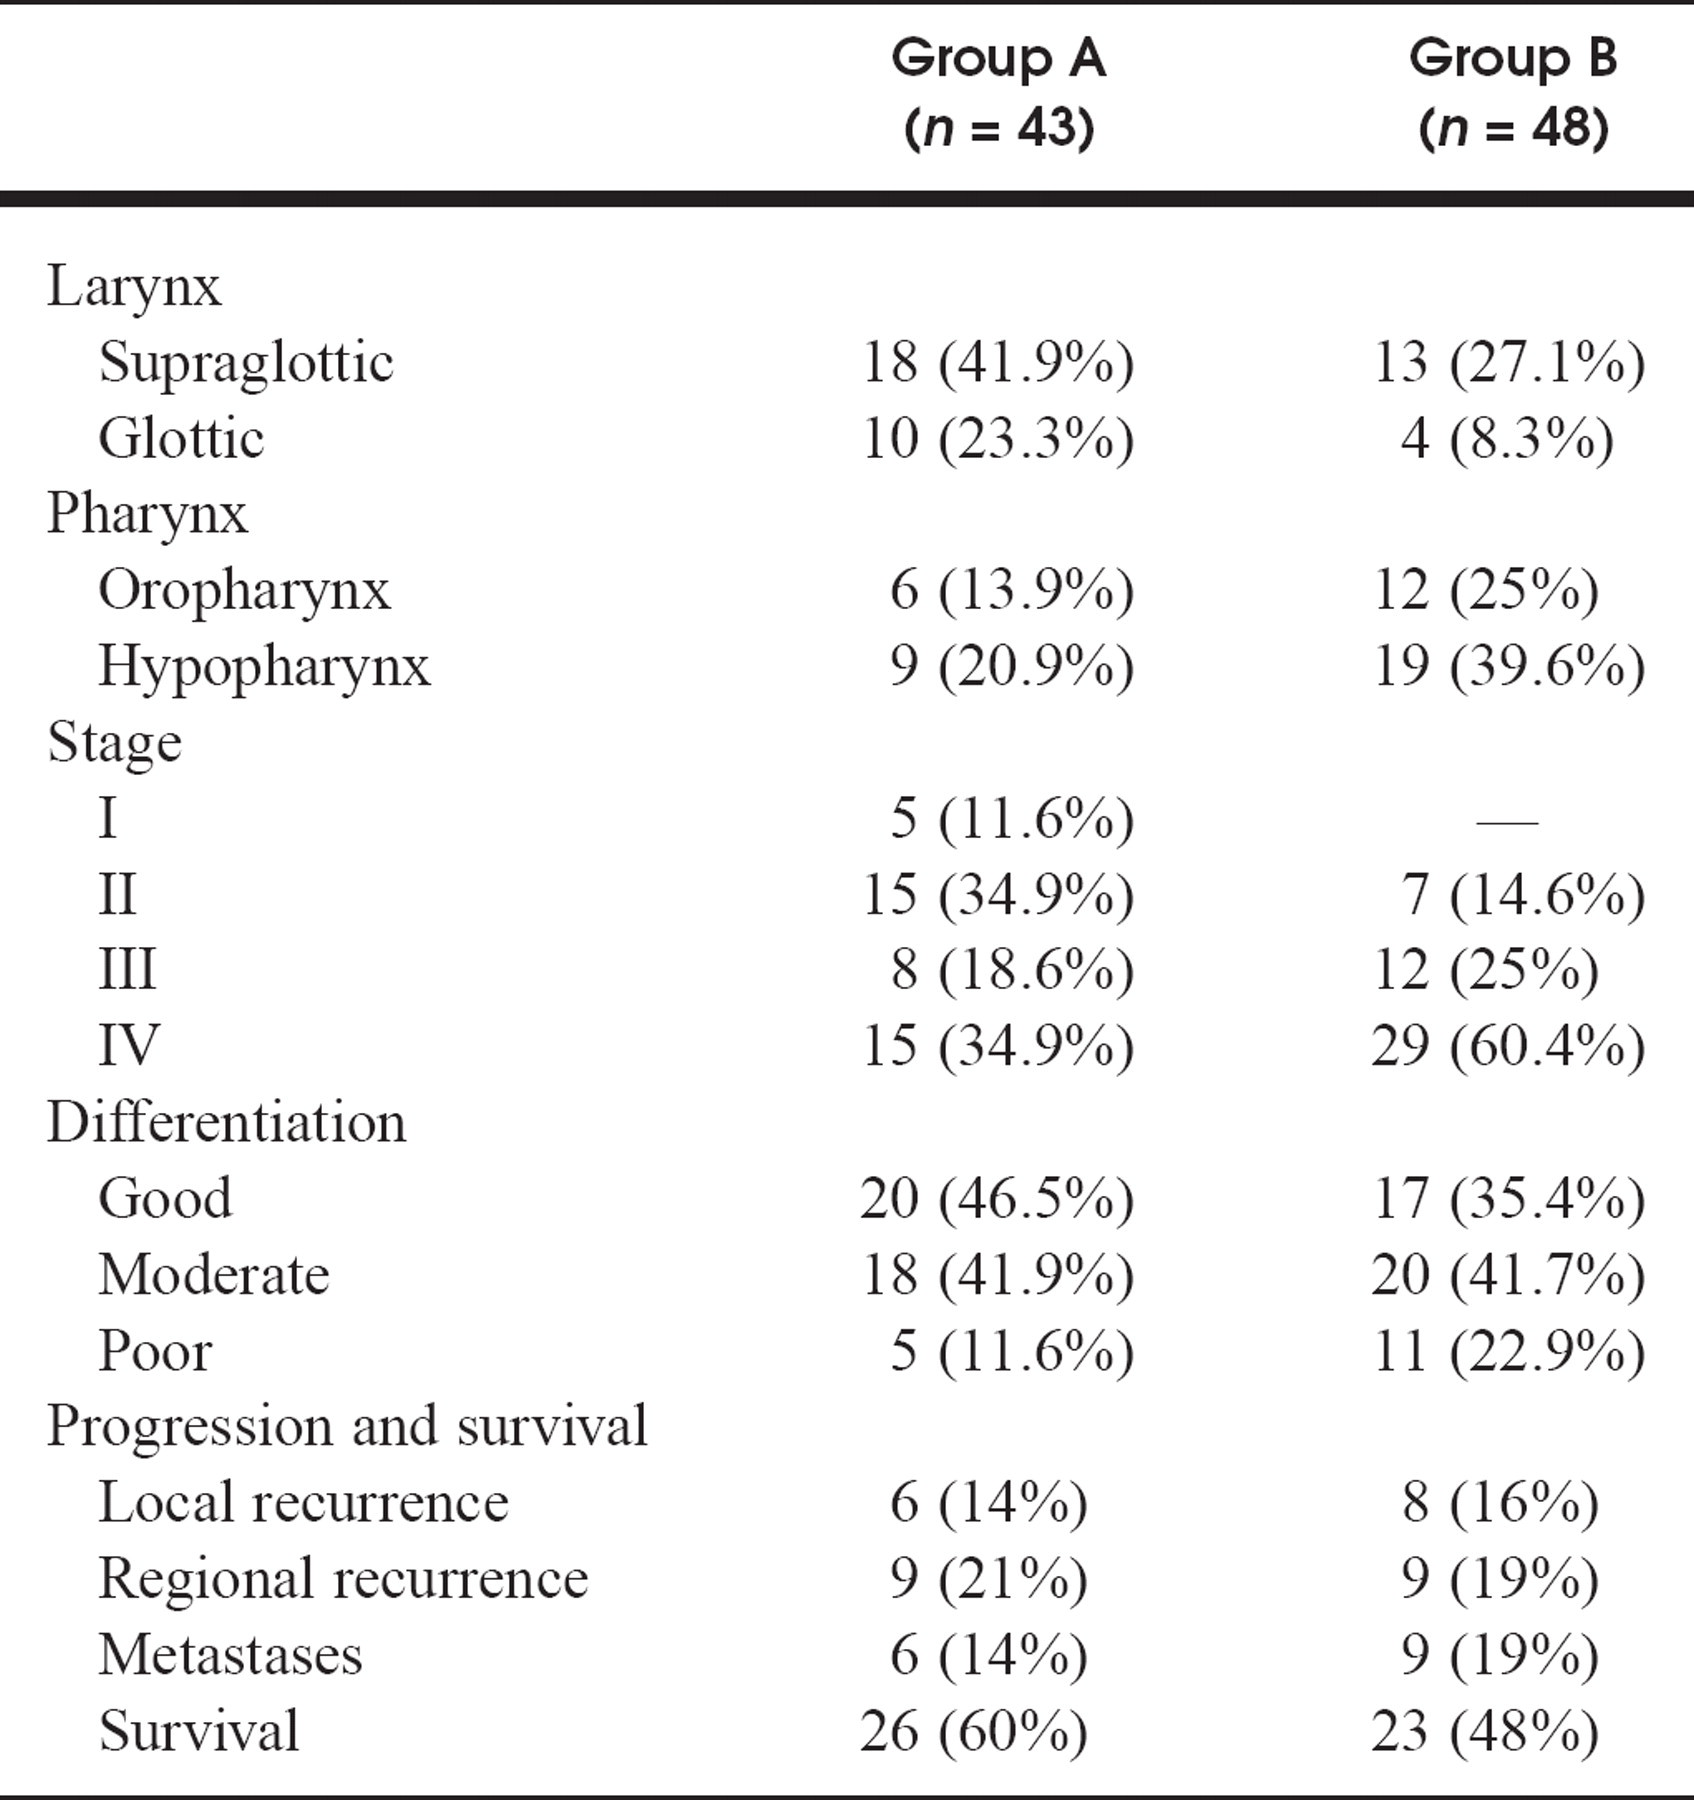
Localization, pTNM stages, differentiation grading, and progression of disease and survival
Ploidy, stages, and localization

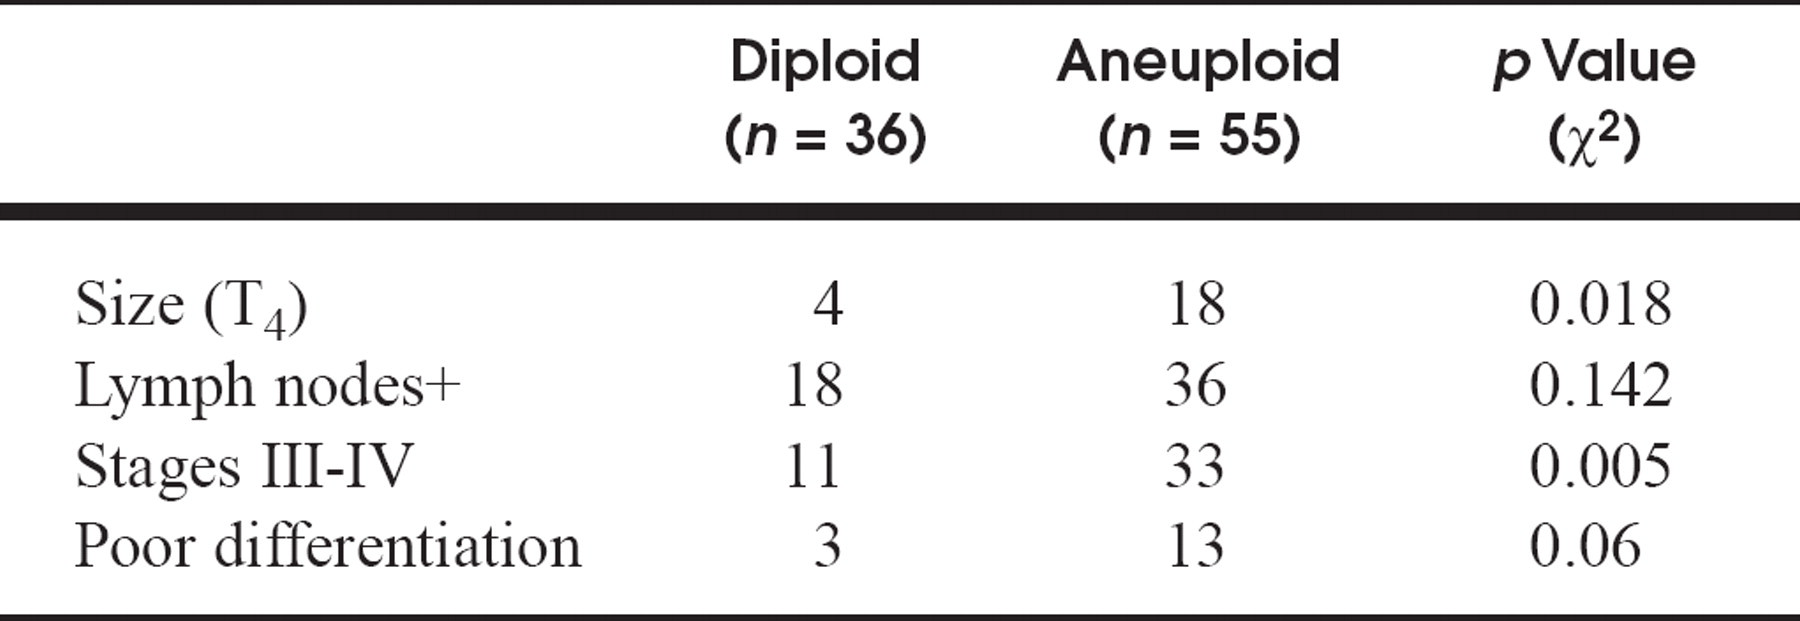
Ploidy in relation to size, lymph node involvement, stage, and differentiation
Recurrences and metastases in relation to ploidy and S phase
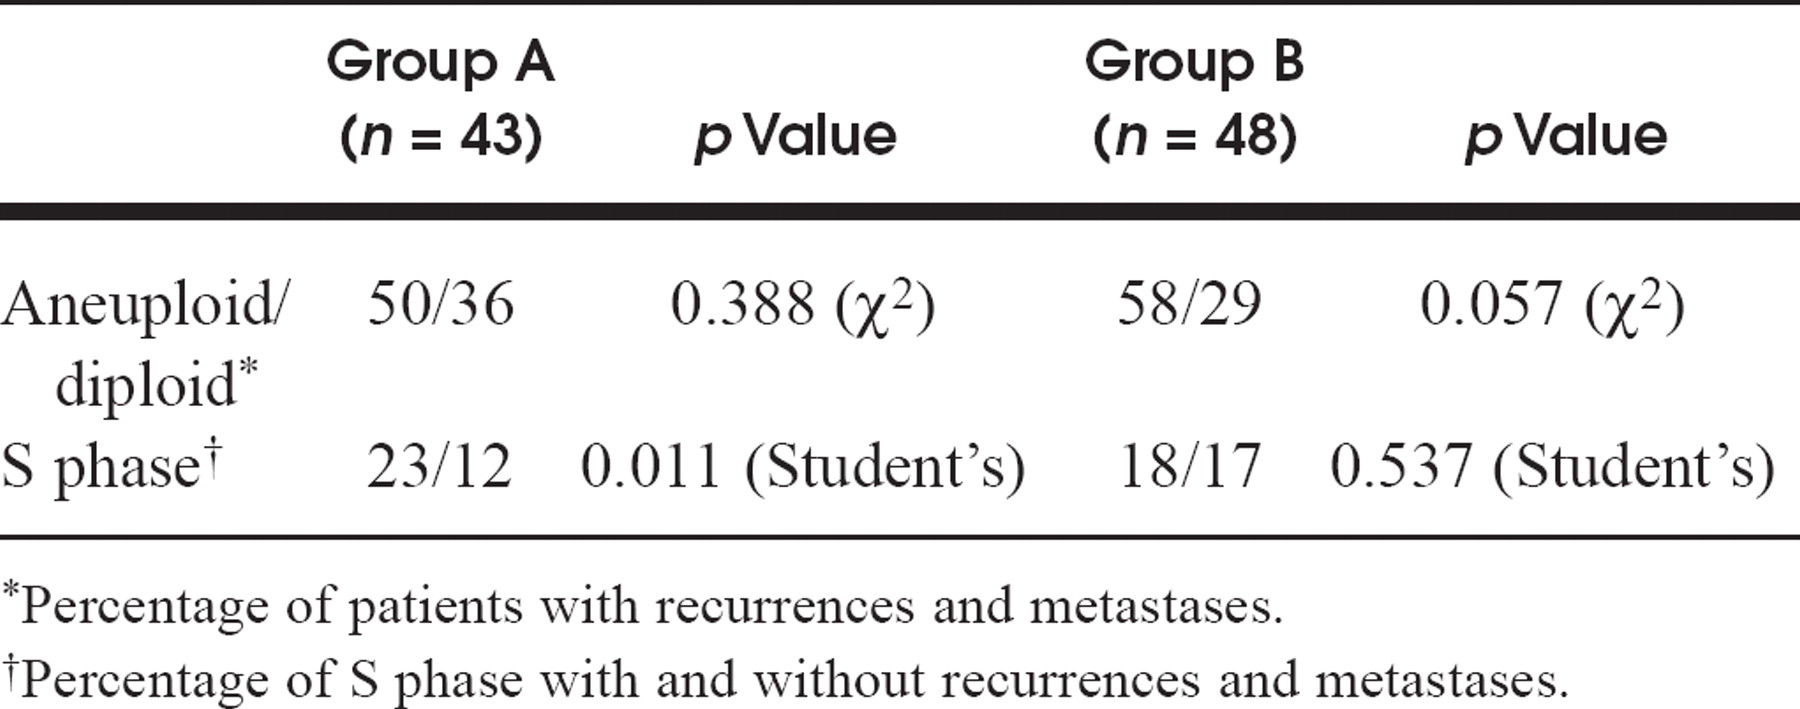
Percentage of patients with recurrences and metastases.
Percentage of S phase with and without recurrences and metastases.
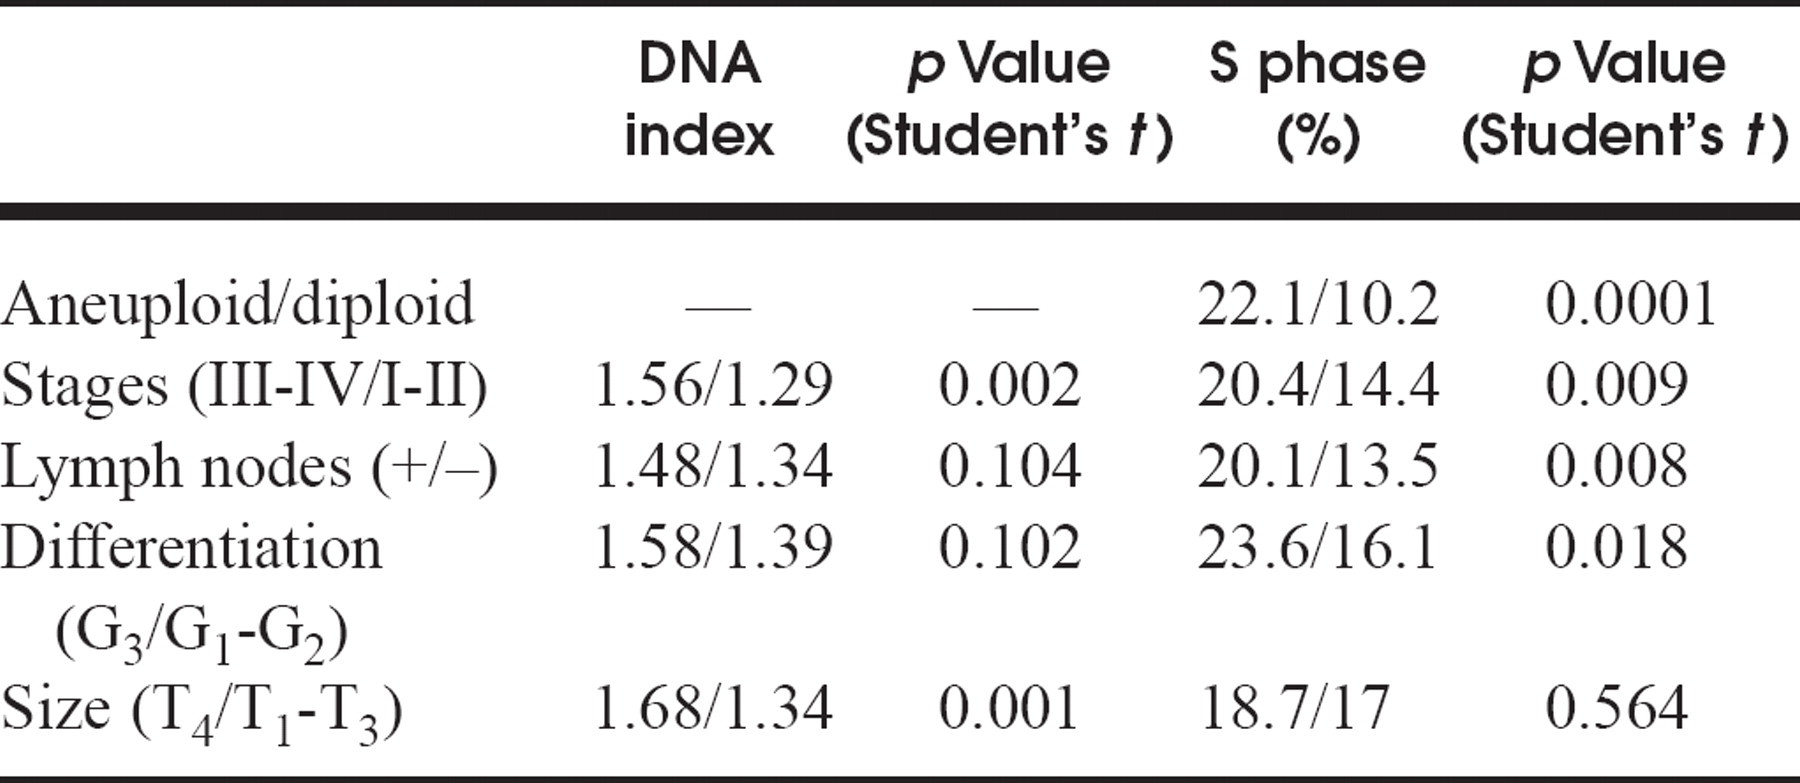
DNA index and S phase in relation to ploidy, size, stage, lymph node involvement, and differentiation
From each sample, 10,000 to 15,000 cells were analyzed, and the coefficient of variation was always less than 6%. The histograms obtained were then interpreted by an analyst with no prior knowledge of the clinical characteristics of the neoplasia. The following were taken as cytometric variables: DNA ploidy, DNA index, and S-phase fraction. The cases with DNA indexes between 0.9 and 1.1 were considered as DNA diploids, those less than 0.9 or greater than 1.10 as DNA aneuploids, and those between 1.9 and 2.1 as DNA tetraploids. We noticed, following the recommendations of the Consensus Conference, the importance of establishing different cutoff points in the study of S-phase fraction for both diploid (10%) and aneuploid tumors (20%).
The qualitative variables—which in our study were localization, stage of pTNM, positive lymph nodes, differentiation grading, recurrences and metastases, survival rate, and ploidy—were shown in the form of absolute and relative frequencies, and their analysis was carried out using the χ2 test.
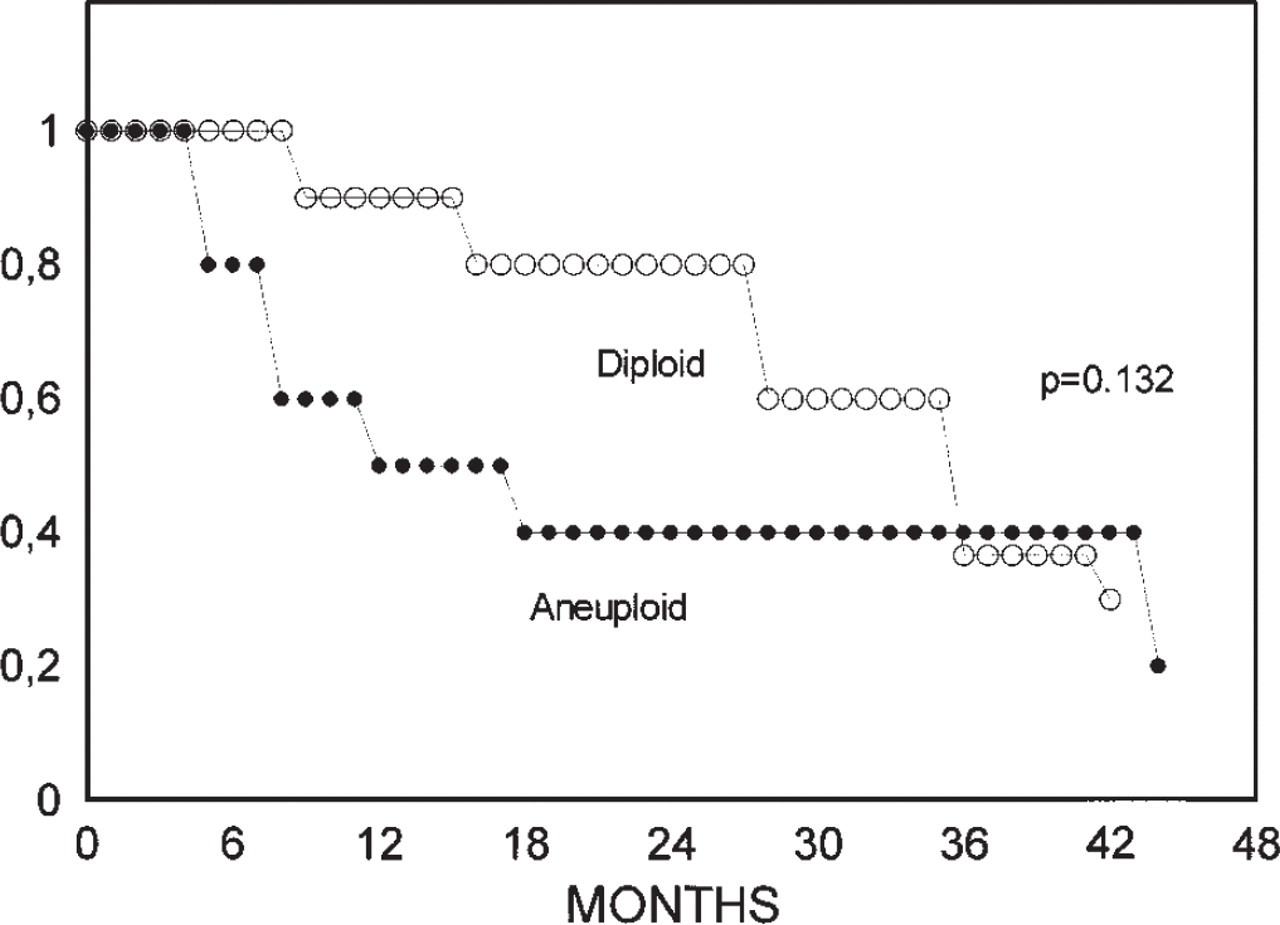
Survival in relation to ploidy. Group A (n = 43).
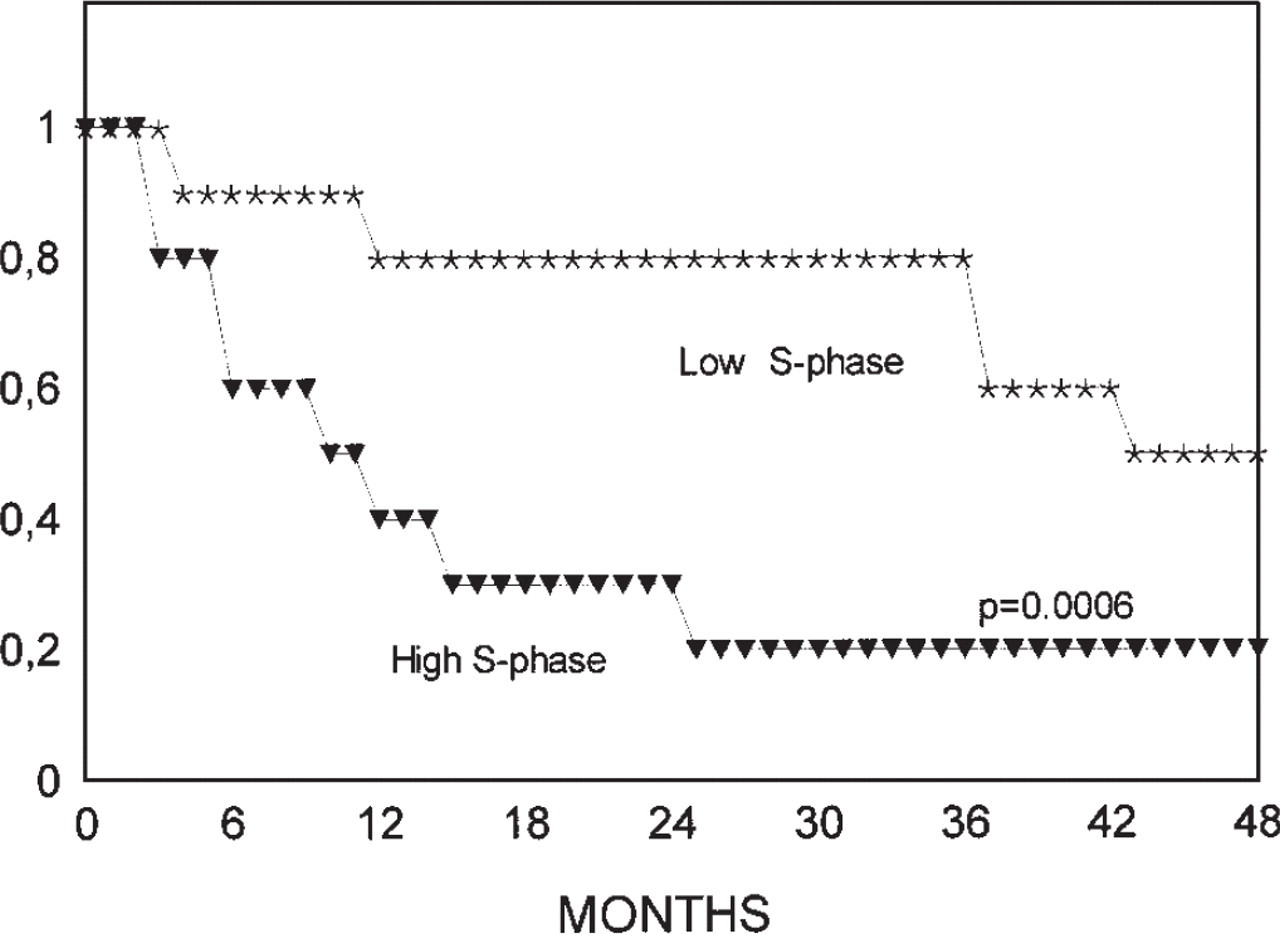
Survival in relation to S-phase fraction adjusted to ploidy. Group A (n = 43).
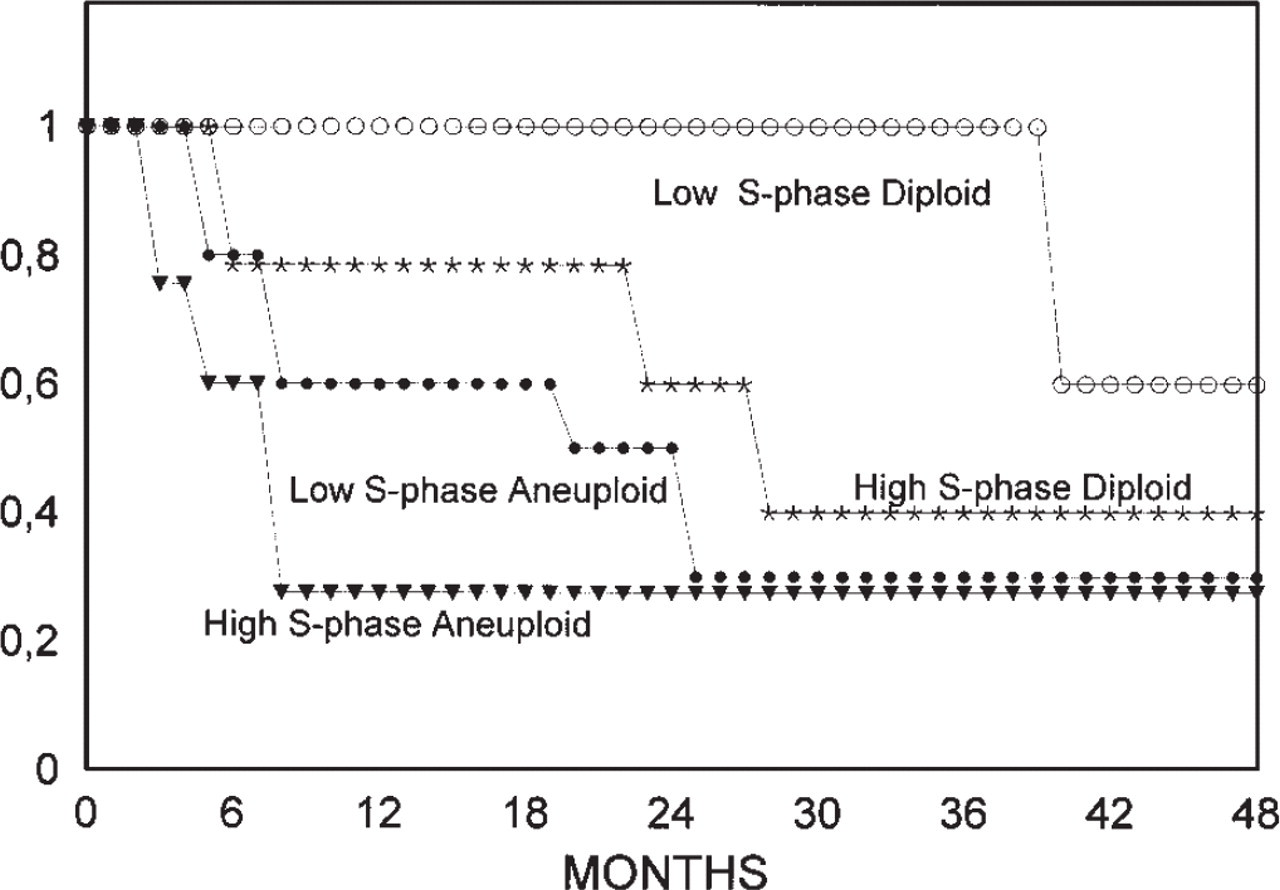
Survival in relation to cell kinetic profiles. Group A (n = 43).
The quantitative variables such as DNA index, were analyzed by means of Student's t test. The description of the survival rate was carried out with the Kaplan-Meier model, comparing the survival curves with the log-rank test. A p value lower than 0.05 was considered statistically significant. The statistical program used, which includes all of these tests, was the SPSS 4.01.
RESULTS
The different localizations, TNM stage, differentiation grading, and progression of the disease, expressed as recurrences and metastases plus survival rate, are shown in table 1. The different frequencies of the ploidy related to localization and stage are shown in table 2. In stages III and IV we can see that the tumors were mainly DNA aneuploids (p = 0.005). Although the aneuploid tumors displayed for positive lymph nodes had a lower differentiation grading, this information was not statistically significant (p = 0.142 and p = 0.06, respectively). What was statistically significant was the size of the primary tumor (T4), which was greater in the aneuploid cases (p = 0.018; table 3).
We observed that in group A aneuploid tumors showed a greater progression (recurrences and metastases) but without significant differences (table 4). In relation to survival, the ploidy showed substantial differences, but these were not significant with the logrank test (Fig. 1). In group B we noticed that neither the ploidy values nor the percentage of S-phase cells represented a significant relationship with recurrences and metastases (table 4).
The DNA index in T4 tumors has a mean value greater than that in T1-3 tumors, which is statistically significant (p = 0.001), as seen in table 5. In the same way, the tumors in stage III and IV have a mean value greater than those in stages I and II (p = 0.002). However, there were no statistically significant differences between DNA index and positive lymph nodes (p = 0.104) and none in relation to the differentiation grading (p = 0.102).
The percentage of cells in S phase was greater in aneuploid than in diploid tumors, as well as in stages III-IV in relation to stages I and II. The same differences were seen in the case of positive lymph nodes and low differentiation grading (table 5). These differences were not statistically significant with regard to the size of the tumor.
In group A the S phase is higher in patients with recurrences and metastases, and in this case there were significant differences (table 4). In relation to survival, the higher S phase also allows us to see significant differences (Fig. 2).
By combining ploidy and S-phase percentage, we noticed four different clusters in relation to survival rate: diploid tumors with both high and low S-phase fractions and aneuploid tumors with high and low S-phase fractions. In diploid tumor cases with high and low S phases the differences were significant (p = 0.001). In addition, the difference between low S-phase diploids and aneuploids (p = 0.0005) was also found to be significant. However, between high S-phase diploids and aneuploids the differences were not significant (p = 0.195), nor were they between low and high S-phase aneuploid tumors. We define two different kinetic profiles of behavior: diploid tumors with low S-phase fraction (favorable kinetic profile) and diploid tumors with high S-phase fraction together with aneuploid tumors (unfavorable kinetic profile) (Figures 3, 4, and 5). In group B, no significant differences were detected in the survival curve for the four established groups combining ploidy and S phase.
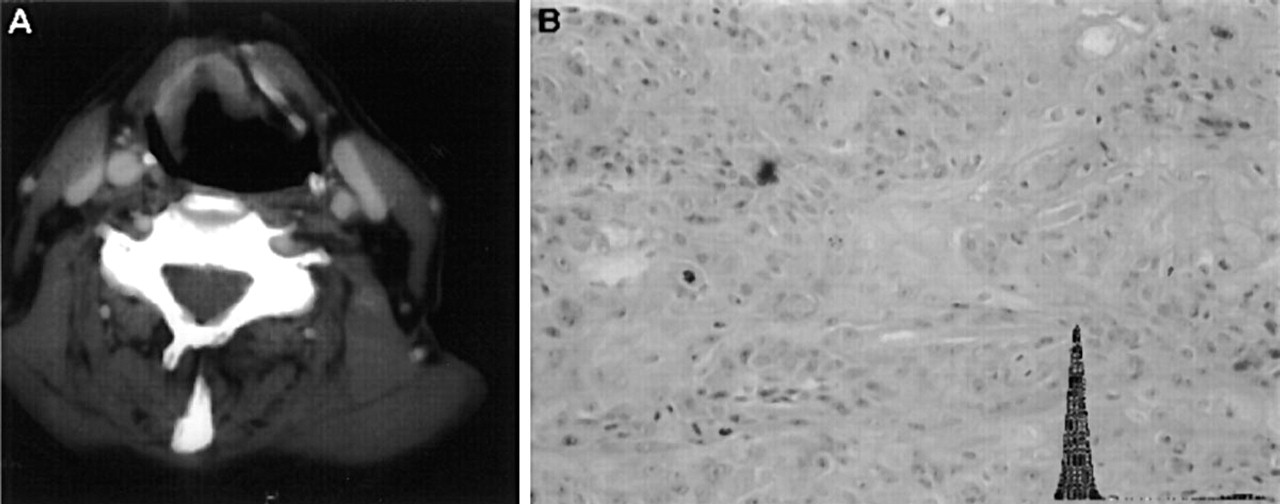
Simultaneus observation of case 23 from group A.
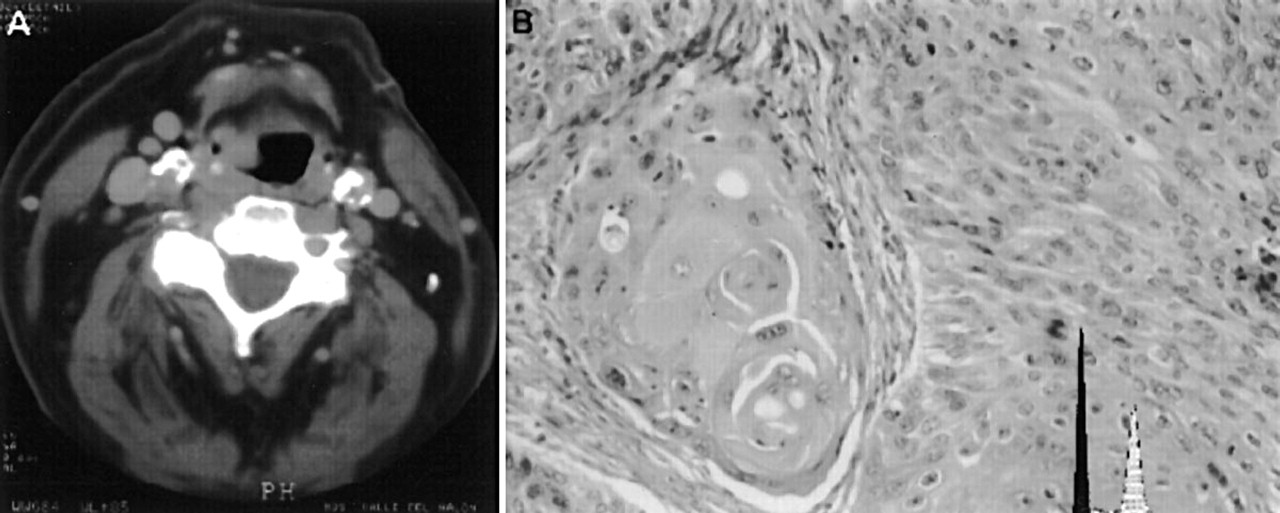
Simultaneous observation of case 22 from group A.
DISCUSSION
In the PLC we established that parameters such as the pTNM have been the main criteria used to establish the prognosis and to decide the type of treatment for these patients. 4 A histologic examination can complete this study by adding the differentiation grading and the type of microscopic invasion. However, it is accepted that the morphologic characteristics of the tumors do not explain the different behavior and response to treatment between patients in the same stage. 8 On the other hand, the diverse oncologic treatments and their potential aggressiveness toward the patient justify the search for more reliable predictive factors, which would allow us to estimate the prognosis and select the most appropriate individual therapy. 9 As a result, we believe that as well as the morphologic study of the tumors, we need to define biologic factors of tumor progression related to the proliferative activity, metastatic potential, and response to treatment.
In the clinical section of our study we have mentioned the results of anatomic spread which were as expected for our geographic area. However, a contrasting fact that arose, was the predominance of supraglottic tumors over glottic tumors and the high incidence of pharynx tumors compared with those of the larynx. 10 We noticed a predominance of pharynx tumors in group B, probably related with the radiotherapy applied in advanced stages in this area (tables 1 and 2).
Also, the differentiation grading has been useful as an indicator to apply continuing radiotherapy in the less differentiated tumors, although it is difficult to extract valid conclusions from our study (table 1). 11,12 As regards the follow-up, although the patients in group A have a slightly higher survival rate (table 1), none of the parameters of the progression of the disease have any relationship with the type of treatment used. This fact can be determined by the influence of morphologic spreading to select the follow-up radiotherapy or the inefficiency of this treatment in the control of the neoplasia (table 4).
As regards the cytometric study, 55 of the 91 cases studied were aneuploids, which represents 60%, a percentage in accordance with the mean found in the literature. 13,14 This percentage increases to 74% (34/46) in pharynx neoplasia and decreases to 46.6% at the larynx level (21/45) (table 2). The largest primary tumor and the advanced stage are variables significantly related to the DNA ploidy, as shown by other authors. 9 Despite the presence of lymph node metastasis and the poor differentiation grading associated with DNA aneuploid tumors, 14,15 we did not find statistical significance. The pTNM stage, as shown in table 3, is significantly related to the ploidy, as mentioned by other authors. 1,14,15 Similar results were also obtained with the DNA index parameter as a quantitative variable. 14
The S-phase fraction is much higher, with statistically significant values (table 5) in aneuploid tumors with respect to diploids, positive lymph nodes with respect to negative nodes, and advanced stages with respect to early stages. Also the S-phase fraction is higher in poorly differentiated tumors than in well-differentiated ones. On the other hand, in this work, the S-phase fraction is a good predictor of progression of neoplasia, as recognized in table 4. 16
In our study, the aneuploid tumors showed worse behavior in the group of patients treated by surgery alone (group A) and in those who also received radiotherapy (group B). These results correspond with those of other authors, 14,17,18 although more often, the aneuploidy and high S phase have been considered to be indicators of radiosensitivity and the best response to radiothera-py. 12,13,15,18,19 For one of these authors 19 this aspect is shown especially in the early stages and in certain locations. In our study we could not determine the exact role of the ploidy and S phase in relation to the radiotherapy because the sample studied corresponded to different locations and advanced stages.
By combining ploidy and S phase, we noticed four risk populations in the survival curves, emphasizing the best behavior of low S-phase diploid tumors in relation to the other three groups (Fig. 3). With regard to these results we defined a group with a favorable kinetic profile (low S-phase diploid tumors) and another with an unfavorable kinetic profile (high S-phase diploid and aneuploid tumors), with statistically significant values (Figures 4 and Fig 5). We have knowledge of other proposals for separation into prognostic groups related to ploidy analysis, but we are not aware of the formulation of a kinetic profile as a result of the combination of ploidy and S-phase fraction. 8,14,19,20