
Abstract
Background: One barrier to accurate interpretation of changes in hemodynamic pressures and cardiac output is lack of data about what constitutes a normal fluctuation. Few investigators have examined normal fluctuations in these parameters and none have done so in patients with left ventricular dysfunction. Aims: To describe normal fluctuations in pulmonary artery pressures and cardiac output in patients with left ventricular dysfunction. Methods: Hemodynamically stable advanced heart failure patients (N=39; 55±6 years old; 62% male) with left ventricular dysfunction (mean ejection fraction 22±5%) were studied. Cardiac output and pulmonary artery pressures were measured every 15 min for 2 h. Results: Mean±standard deviation fluctuations were as follows: pulmonary artery systolic pressure=7±4 mmHg; pulmonary artery diastolic pressure=6±3 mmHg; pulmonary capillary wedge pressure=5±3 mmHg; cardiac output=0.7±0.3 l/min. The coefficient of variation for fluctuations in pulmonary artery systolic pressure was 6.7%, in pulmonary artery diastolic pressure was 9.3%, in pulmonary capillary wedge pressure was 9.2%, and in cardiac output was 7.2%. Conclusions: Values that vary <8% for pulmonary artery systolic pressure, <11% for pulmonary artery diastolic pressure, <12% for pulmonary capillary wedge pressure, and <9% for cardiac output from baseline represent normal fluctuations in these parameters in patients with left ventricular dysfunction.
Keywords
Introduction
Precise evaluation of hemodynamic changes with appropriate modification of clinical therapy are important nursing interventions essential to achieving optimal patient outcomes. Pulmonary artery catheters with measurement of pulmonary artery pressures and thermodilution cardiac output are a key source of such hemodynamic information. Despite controversy about the use of pulmonary artery catheters in clinical practice [1,2], they are still used routinely in the assessment and management of hemodynamics in a variety of critically ill patients [1–4]. Although absolute values of pulmonary artery pressures and cardiac output are useful, trends in these values are most important for determining when to intervene and for assessing the impact of those interventions. One barrier to accurate interpretation of changes in pressures and cardiac output is lack of understanding about what constitutes spontaneous variability or normal fluctuation across time. Yet, few investigators have examined normal fluctuations in these parameters [5–8].
Nemens and Woods measured pulmonary artery pressures in 26 acutely ill patients to determine the range of normal fluctuations [5]. They measured pulmonary artery systolic, diastolic, mean and occlusion pressure every 5 min for 30 min. Only patients considered to be hemodynamically stable were included in this study, but 3 patients received blood transfusion during the study. The majority of patients were receiving mechanical ventilatory support; however, the mode of ventilation was not consistent in this group. The majority of pulmonary artery pressures in this sample were within the normal range. These investigators concluded that variations of 4 mmHg or less for pulmonary capillary wedge pressure and pulmonary artery diastolic pressure and 5 mmHg or less for systolic and mean pressures represented normal fluctuations in this group of patients.
Sasse et al. [8] and Huang et al. [7] both described normal fluctuations in cardiac output in medical intensive care unit patients, most of whom were mechanically ventilated. These investigators used the coefficient of variation to define spontaneous variability. Using this measure, normal fluctuations are reflected as percentages relative to the patient's mean value across a time period of interest. The mean coefficients of variation for both groups were less than 10% [7,8].
For years this work has guided practice, but many questions remain regarding normal fluctuations in hemodynamic parameters. There has been no systematic evaluation of normal fluctuations in pulmonary artery pressures or cardiac output in patients with severe left ventricular dysfunction or elevated pulmonary artery pressures and reduced cardiac output. Accordingly, the purpose of this study was to describe normal fluctuations in pulmonary artery pressures and cardiac output in hemodynamically stable patients with severe left ventricular dysfunction. To provide evidence that hemodynamic state did not change clinically during this study, catecholamines and oxygen consumption were measured at the beginning and end of the study period in a subset of patients. In addition, a number of factors such as patient position and fluid administration that could affect hemodynamics were controlled.
Methods
This descriptive study was part of a previously reported randomized, controlled study that was designed to determine the impact of a biofeedback-relaxation intervention on hemodynamics, plasma catecholamines and oxygen consumption [9]. Data for the current study were obtained from both the intervention (n=24) and control (n=15) groups from the parent study. For the current study, only hemodynamic data collected during the baseline period before the intervention were used from the intervention group, whereas all hemodynamic, catecholamine and oxygen consumption data were used from the control group because no intervention was introduced.
Sample and setting
Appropriate Human Subject Protection Committee approval was obtained for the conduct of this study and the investigation conforms with the principles outlined in the Declaration of Helsinki. This study was conducted among advanced heart failure patients who were undergoing elective heart transplant evaluation and in-patient optimization of medical therapy. This was an ideal population for this study, since these individuals exhibited hemodynamic stability in the presence of severe left ventricular dysfunction. These patients were admitted electively to the hospital for insertion of a pulmonary artery catheter with evaluation of hemodynamics followed by manipulation of pharmacologic therapies. We took advantage of a window of opportunity in these patients after insertion of the pulmonary artery catheter, but before manipulation of therapy to conduct our study. The study was conducted in the cardiac intensive care unit or in a specialized cardiac care unit. Inclusion criteria included: (1) diagnosis of chronic advanced heart failure; (2) left ventricular ejection fraction <35%; (3) New York Heart Association functional classification III or IV; (4) hemodynamically stable; and (5) afebrile. Exclusion criteria included: (1) endotracheal intubation; (2) intra-aortic balloon counterpulsation therapy; (3) administration of diuretics or vasoactive drugs needed during the study periods; and (4) administration of intravenous fluid at a rate >30 ml/h.
Instrumentation
Cardiac output and pulmonary artery pressures
Thermodilution cardiac output and pulmonary artery pressures were measured from a quadruple lumen pulmonary artery catheter (Edwards Laboratories, Model 93A-780H-7.5F, Santa Ana, CA) inserted via the right jugular vein. Appropriate catheter placement was evaluated by inspection of sequential waveforms during insertion and monitoring. This catheter was interfaced with a mercury calibrated, pressure transducer and a pressure module (Hewlett Packard, Model 78532B, Waltham, MA). The calibration accuracy for 24 h for this module is reported as ±1 mmHg with drift of ±0.2 mmHg/°C in the range of 0 to 300 mmHg. Transducer calibration accuracy for 48 h is reported as ±0.1 mmHg with drift of ±2 mmHg/°C in the range of −50 to 300 mmHg. Pressures were recorded by a graphic recorder (Hewlett Packard, Model 7754A). This recorder has a reported sensitivity of 1 mV/mmHg and a frequency response fault within 1 decibel of full scale at 30 Hz. A cardiac output module (Hewlett Packard, Model 785528B) and closed injectate system (Model 93-500) were used to measure thermodilution cardiac output. This module has a reported accuracy of ±3% with 0–4 °C iced injectate.
Oxygen consumption
Oxygen consumption was calculated from cardiac output, mixed venous oxygen saturation (SvO2), and arterial oxygen saturation (SaO2) by the following formula: oxygen consumption (VO2)=(cardiac output×1.34 ml/gm×Hgb) (SaO2−SvO2). SaO2 was measured using a pulse oximeter (Sensormedics, Oxyshuttle # 762220). Oxygen saturation was read from the digital display and properly placed sensors. SvO2 was measured from mixed venous blood drawn from the distal port of the pulmonary artery catheter and was determined by measurement of the mixed venous oxygen content from blood gas analysis. Each specimen was analyzed on two blood gas analyzers. The accepted variance for this duplicate analysis is pH ±0.002, pCO2 ±4, and pO2 ±4. Once every 8 h, the validity of the measurements made by the blood gas analyzers was tested by analysis of an aqueous substance known as Certain +, which is comprised of three levels of known values. Reliability is ensured by the performance of automatic one-point calibrations by the blood gas analyzers every 30 min, and automatic two-point calibrations every 2 h.
Plasma catecholamines
Plasma norepinephrine and epinephrine were measured from a blood sample obtained from the proximal port of the pulmonary artery catheter. Liquid chromatography with electrochemical detection was used for this bioassay. Intra- and inter-assay coefficients of variation were less than 8% for these measures.
Procedure
All measurements were taken in the late afternoon while patients rested quietly in bed with no visitors present. Pulmonary artery pressures and cardiac outputs were measured every 15 min for 2 h. Catecholamine levels and oxygen consumption were measured before and after the 2-h measurement period.
All measurements were made with the patient lying in the same supine position with the head of the bed elevated no more than 45°. The phlebostatic axis (fourth intercostal space, mid-axillary line) was marked and the pressure transducer leveled to this point. The monitor was zeroed and autocalibrated prior to data collection and after any position changes. For pulmonary artery pressures, end-expiratory pressure measurements [5,10,11] were obtained from the graphic print-out. Because, measurement of pulmonary pressure wave forms can be subject to marked observer variability, inter-rater reliability of pulmonary artery pressure measurements was determined for all sets of measurements in 10 patients (the first 5 and the last 5 subjects). Acceptable reliability was demonstrated for all pressure measurements: pulmonary artery systolic (r=0.88); pulmonary artery diastolic (r=0.90); and pulmonary capillary wedge pressure (r=0.96).
Cardiac output measurements were preceded by selection of the appropriate computation constant (0.574). For each determination, the same individual made three cardiac output measurements at the end-expiratory phase of the respiratory cycle. Injections were made in 4 s or less, and 1 min elapsed between subsequent injections. The three measurements were averaged to obtain the cardiac output in ml/min. All thermodilution curves were examined during cardiac output measurements to ensure appropriate technique was used. If the baseline was erratic, or the curve contour was not smooth, with a rapid upstroke and a gradual downslope, the data from that measurement was discarded and the measurement repeated [12].
To determine SaO2 from the pulse oximeter, the pulse oximeter sensor was placed on the index finger of the patient's nondominant hand. Proper placement was verified by comparing the patient's pulse to the oximeter's estimation of the pulse. The oxygen saturation was read from the digital display. To determine SvO2, 2 ml of mixed venous blood was drawn from the distal port of the pulmonary artery catheter (after aspiration and discard of the catheter dead space) in a heparinized syringe from which the excess heparin was expelled. Upon obtaining the blood sample, all air was removed from the syringe, which was immediately capped with a rubber stopper to maintain anaerobic conditions. The syringe was placed on ice and transported to the laboratory where the specimen was immediately analyzed on two blood gas analyzers.
Seven milliliters of blood for catecholamine determination was drawn (after withdrawal and discard of the catheter dead space) from the previously placed pulmonary artery catheter after the patient had been in the semi-fowlers position for 30 min, resting quietly to establish a neutral baseline. All subsequent blood draws were done with the subject in the same position. Blood was collected in a 7-ml prechilled Vacutainer tube anticoagulated with EDTA. The sample was immediately placed on ice and kept on ice until centrifuged at 1200×g (4000 rpm in the Beckman JA-20 rotor) for 15 min in a refrigerated centrifuge. All samples were centrifuged within an hour of collection. The plasma was then drawn off, placed in a polypropylene tube, and stored at −80 °C until the bioassay was run.
Data analysis
Data are presented as frequencies and percentages or means±standard deviations with 95% CI. To determine the maximal fluctuation in cardiac output or pulmonary artery pressure for each patient, differences between these measures for each pair of measures were calculated. The mean fluctuations across time were calculated and cut offs for normal fluctuations for discrete values were defined as the upper limit of the 95% CI of the mean value. The cut off for normal fluctuations expressed as a percentage was defined as the upper limit of the 95% CI for the mean of patients’ coefficient of variation across time. To determine the range of fluctuations from each patient's average value across the measurement period, the percent changes from lowest and highest measures to the average across the measurement period were calculated. To determine whether plasma epinephrine and norepinephrine, or oxygen consumption changed across the study period, paired t-tests were used to compare the baseline to the final value of each measure in patients in the control group only.
Results
Patient characteristics
A total of 39 patients with advanced chronic heart failure were enrolled in this study (Table 1). Their hemodynamic and biochemical status reflected the severity of their heart failure (Table 1). The mean age of patients enrolled in this study (55±6 years) is younger than that of heart failure patients in general because these patients were being evaluated for cardiac transplantation and this group is younger than the general heart failure population.
Patient characteristics (N=39)
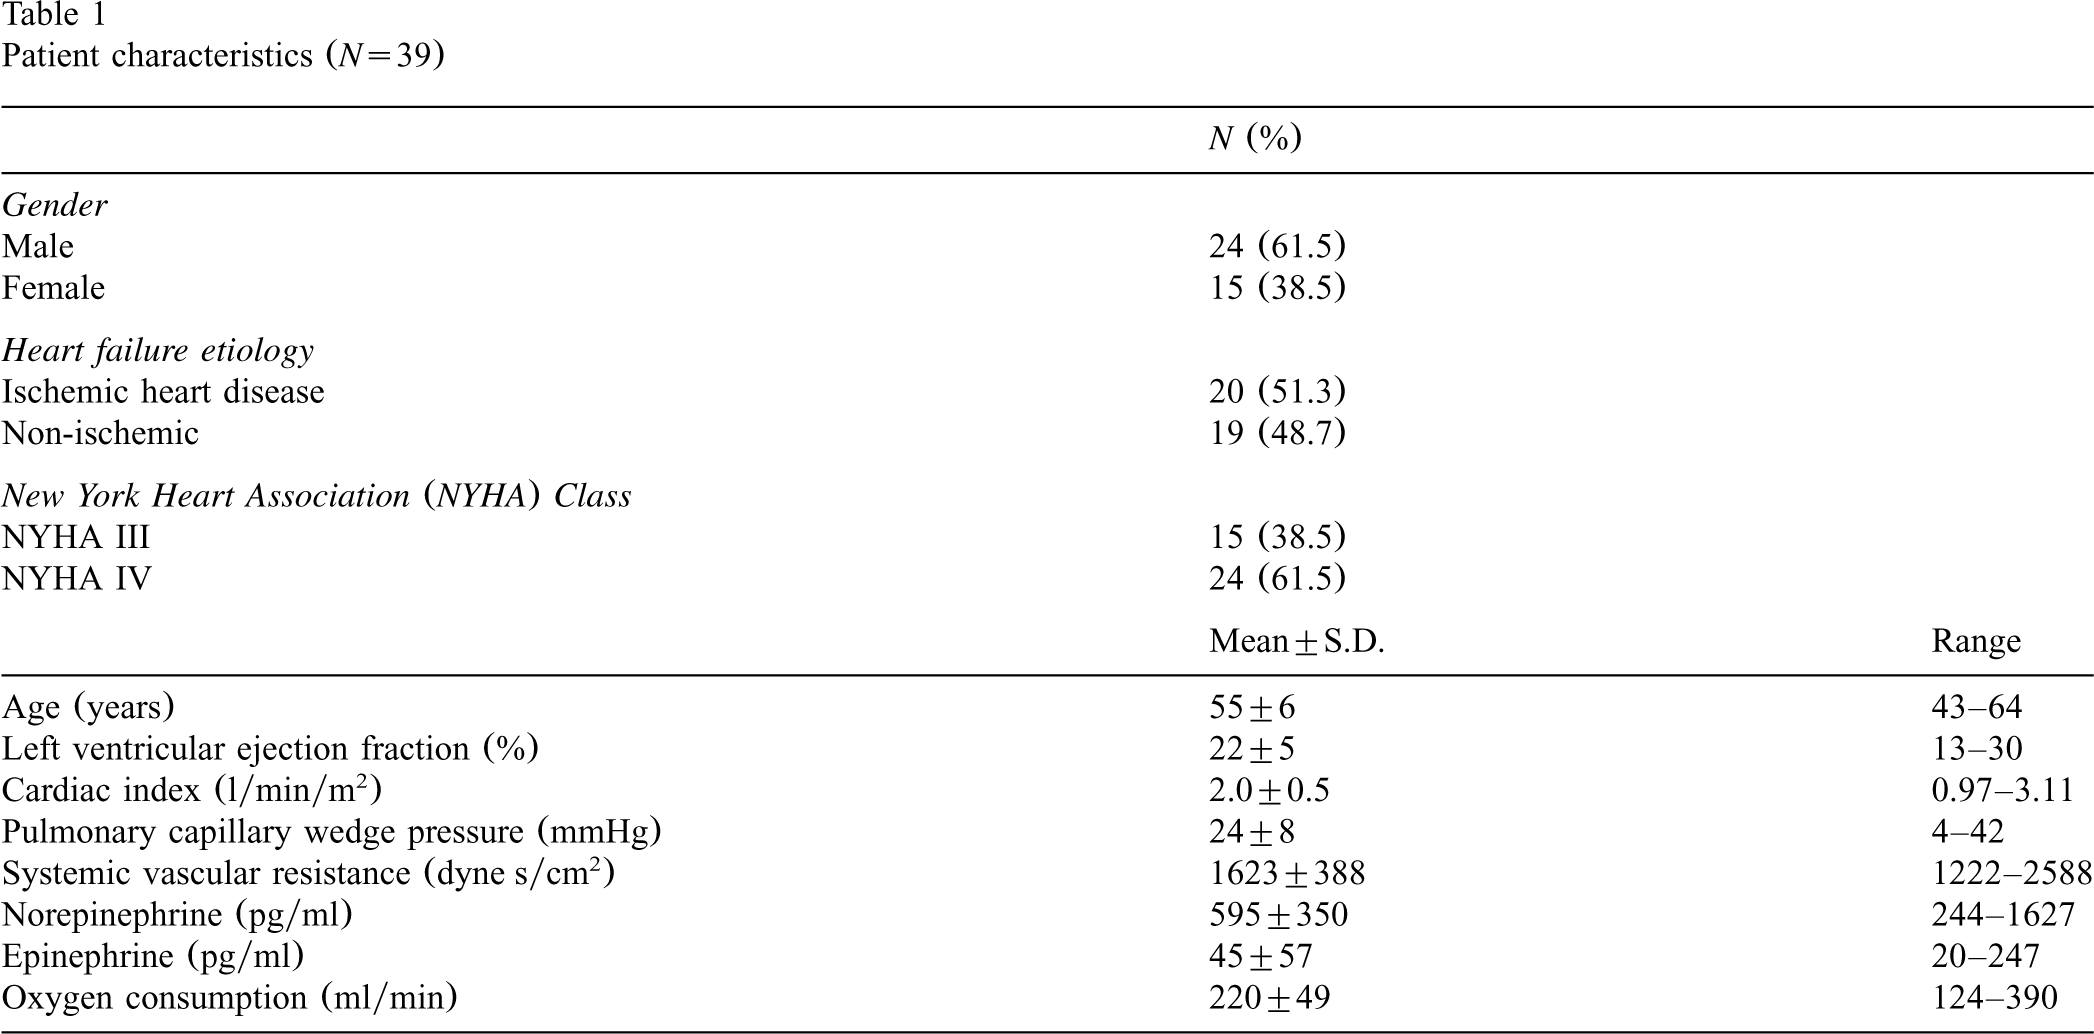
Patient characteristics (N=39)
Examination of values across the measurement period revealed considerable individual variability. The range of maximal fluctuations seen for pulmonary systolic pressure was 2–20 mmHg, for pulmonary artery diastolic was 1–16 mmHg, for pulmonary capillary wedge pressure was 0–12 mmHg, and for pulmonary artery mean pressure was 1–17 mmHg. Cardiac output fluctuated from 0.3 to 1.4 l/min. Mean maximal fluctuations are presented in Table 2. Fifty percent of patients experienced maximal fluctuations of ⩾6 mmHg across the study period in pulmonary artery systolic and diastolic pressures, ⩾4 mmHg in pulmonary capillary wedge pressure, and ⩾0.5 l/min in cardiac output.
Range and mean maximal fluctuations in pulmonary artery pressures and cardiac output
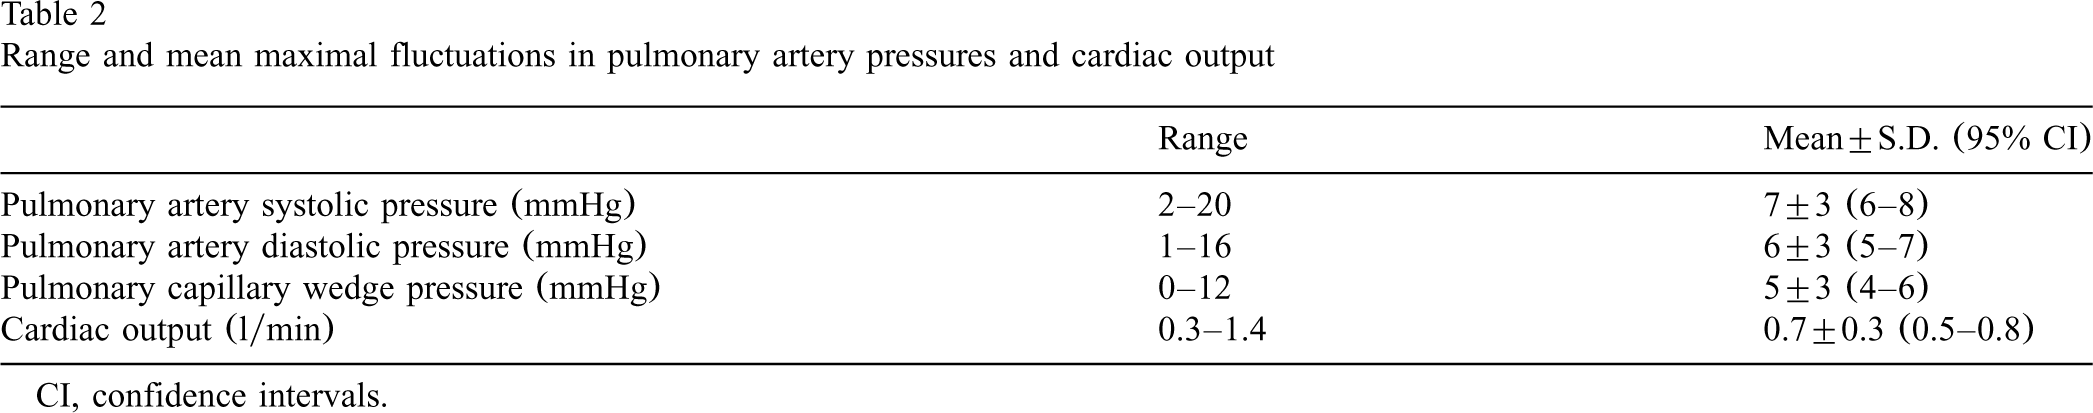
Range and mean maximal fluctuations in pulmonary artery pressures and cardiac output
CI, confidence intervals.
The coefficient of variation for pulmonary artery systolic pressure was 6.7% (CI=5.5–7.8%), for pulmonary artery diastolic pressure was 9.3% (CI=7.4–11.3%), and for pulmonary capillary wedge pressure was 9.2% (CI=6.6–11.7%). The coefficient of variation for cardiac output was 7.2% (CI=5.9–8.5%).
Translation from these data to specific values indicating normal fluctuations has been accomplished in various ways in previous literature [5–8]. These can be categorized in two basic ways: (1) use of absolute values derived from measures of central tendency [5,6]; and (2) use of percentages derived as coefficient of variations [7,8]. We chose to present data using both methods for purposes of comparison with other literature. Using the first method, we used the upper value of the 95% CI of the mean to define the limit for normal fluctuations. Based on our data, fluctuations of ⩽8 mmHg for pulmonary artery systolic pressures, ⩽7 mmHg for pulmonary artery diastolic pressures, ⩽6 mmHg for pulmonary capillary wedge pressures, and ⩽0.8 l/min for cardiac output are considered normal fluctuations. However, because patients can have widely varying baselines, expression of normal fluctuations as percentages based on coefficient of variations, rather than absolute values, may be preferable. Using this method and taking the upper limit of the 95% CI of the mean coefficient of variation we arrive at the following: values that vary <8% for pulmonary artery systolic pressure, <11% for pulmonary artery diastolic pressure, <12% for pulmonary capillary wedge pressure, and <9% for cardiac output from baseline represent normal fluctuations.
To indicate levels of individual variability we calculated the percent changes from the lowest and highest measures to the patient's average across the measurement period (Table 3). Again there was a wide range of variability among patients in fluctuations, but one-fifth or more of patients exhibited fluctuations of ⩾10% change from average across the recording period in each parameter measured (Fig. 1).
Fluctuation expressed as percent change from highest and lowest values to patient average value across the measurement period
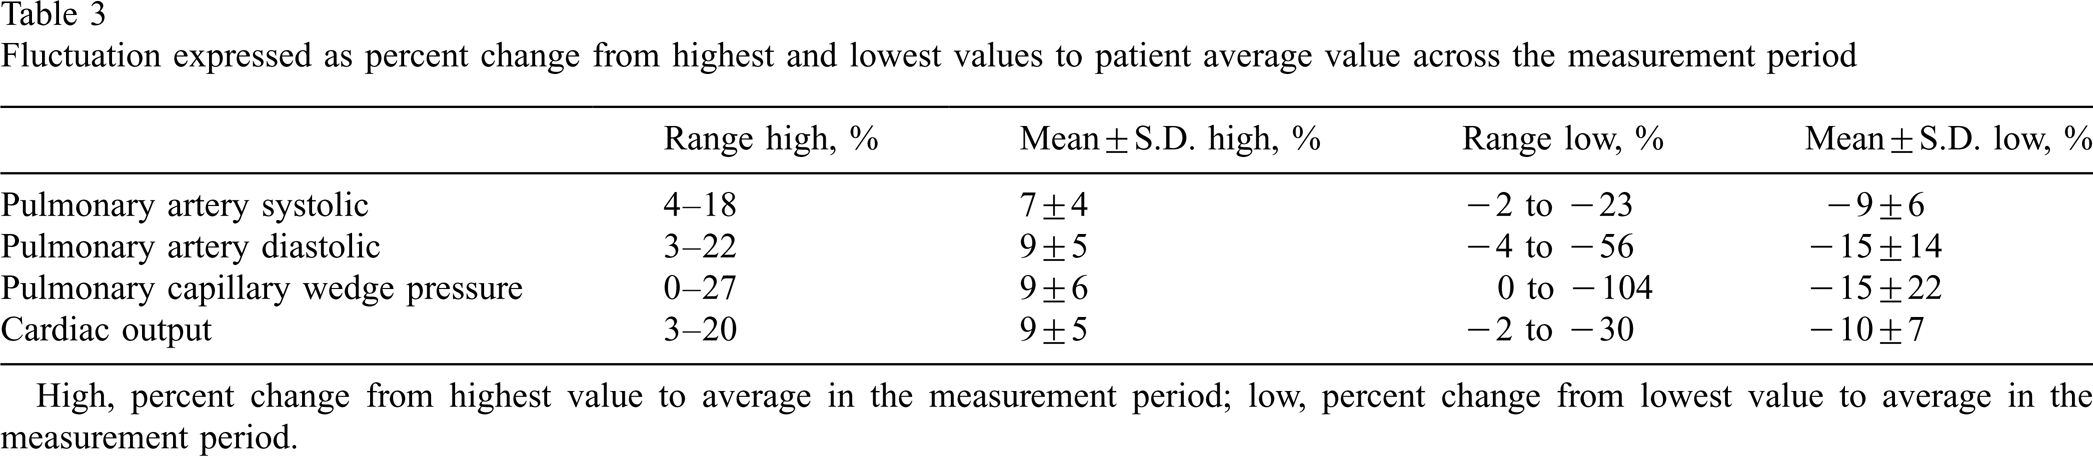
High, percent change from highest value to average in the measurement period; low, percent change from lowest value to average in the measurement period.
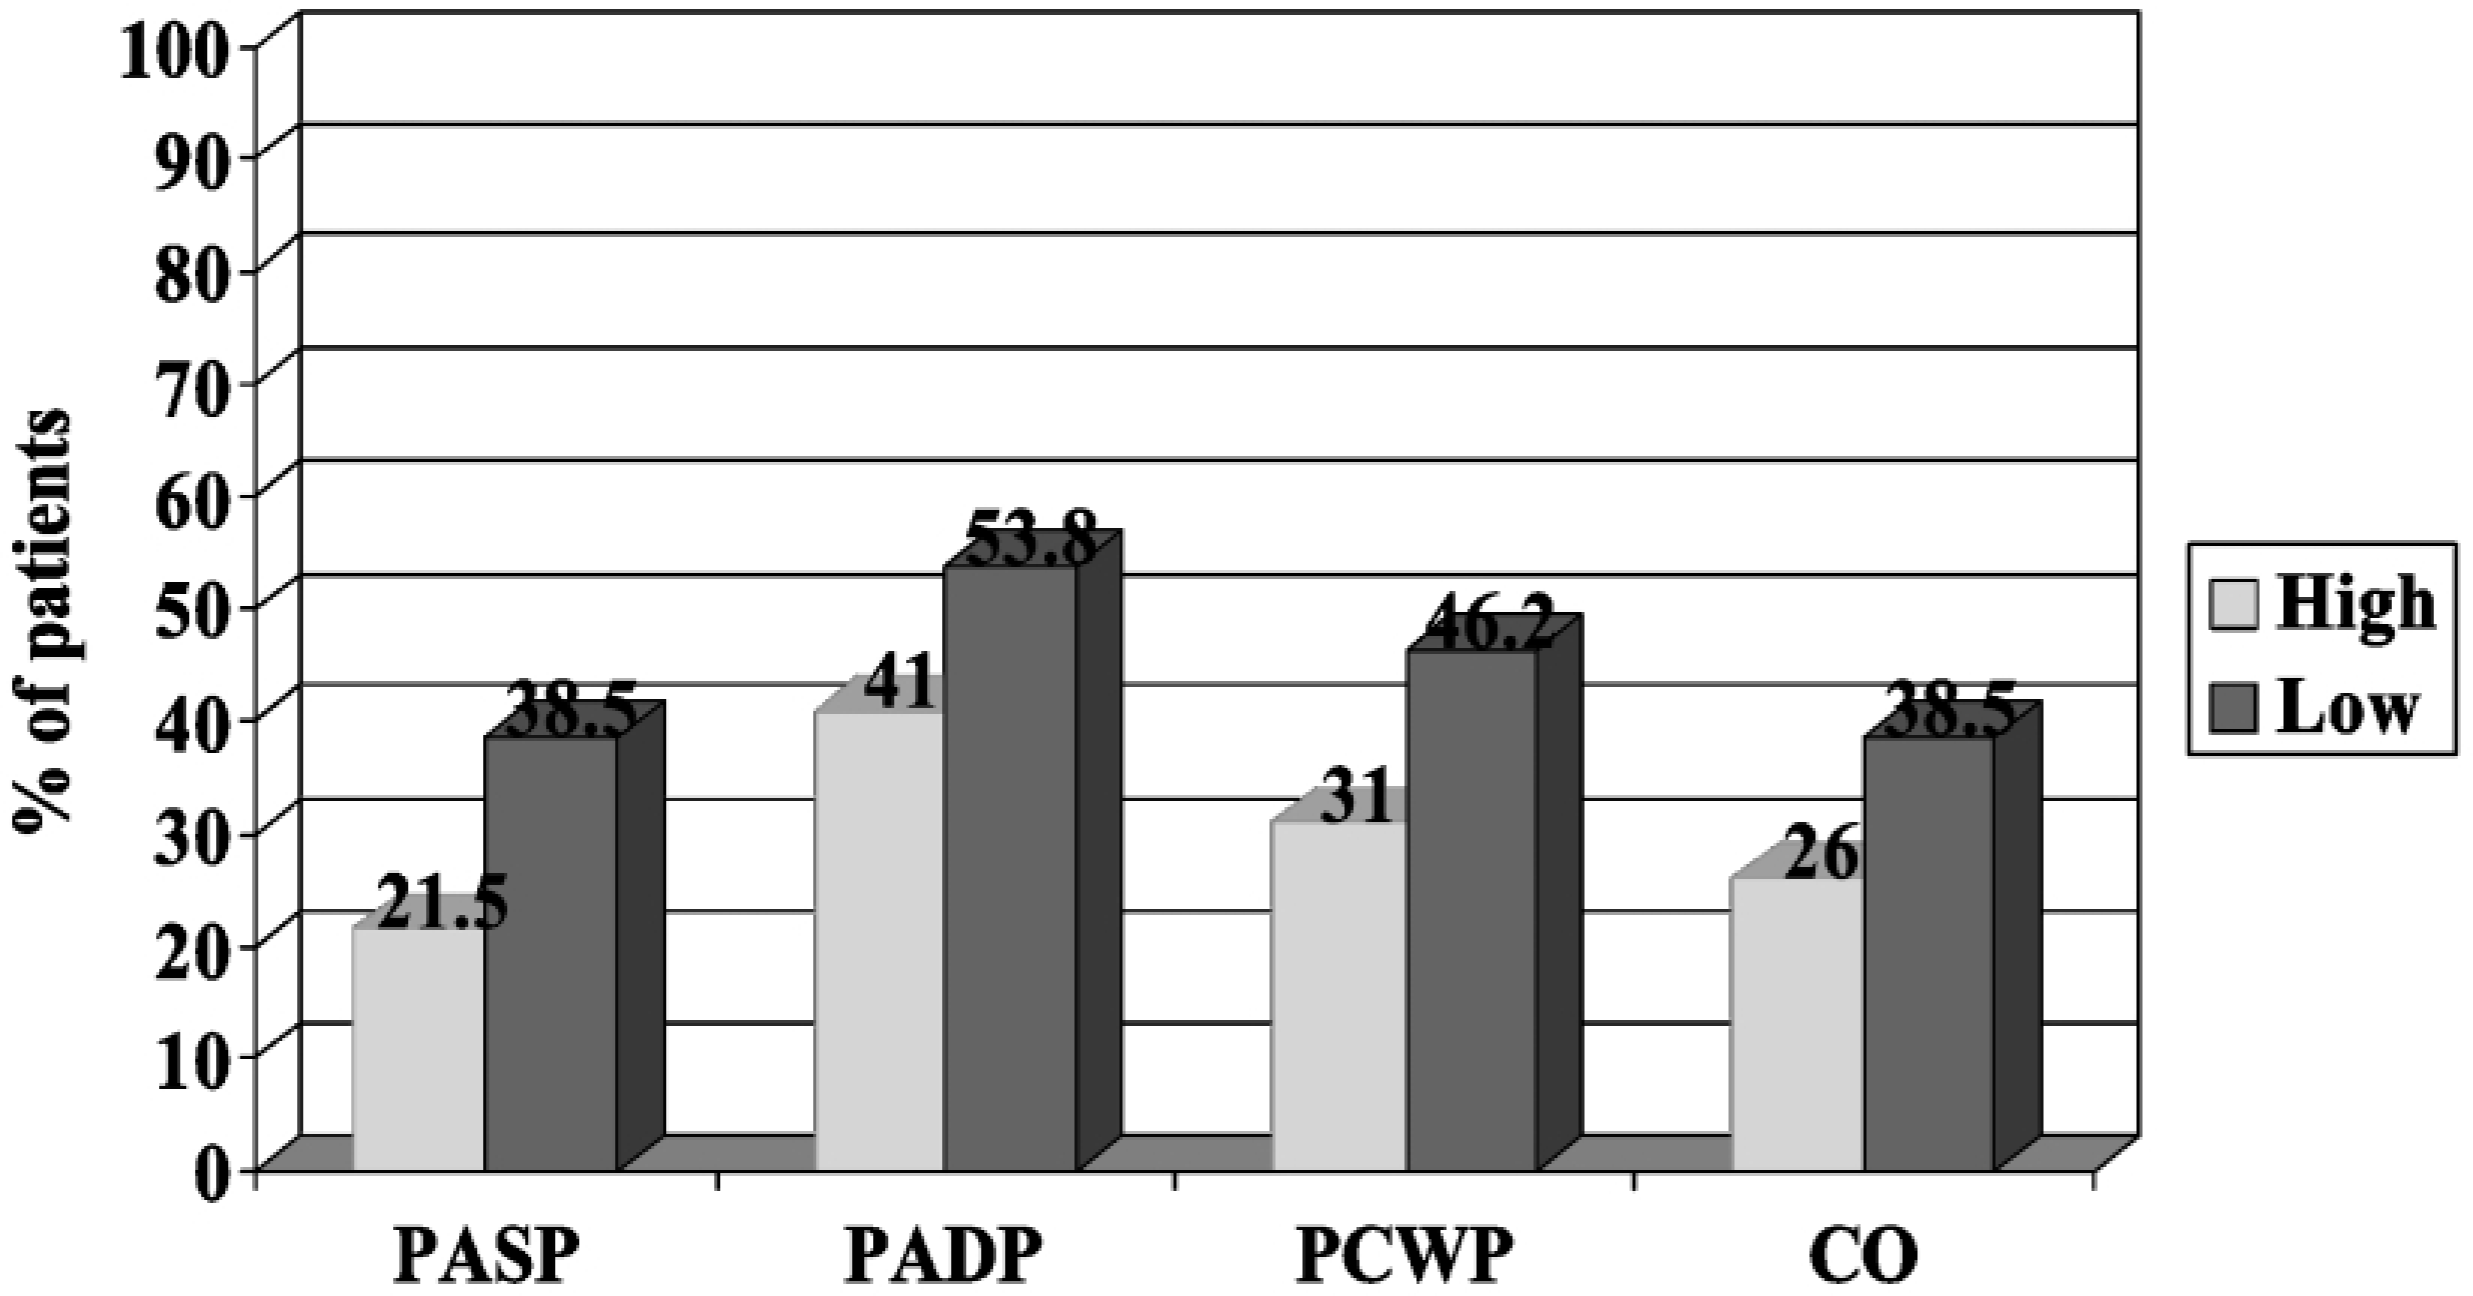
Percent of patients whose values fluctuated ⩾±10% from average over the measurement period; high, ⩾10% increase from average; low, ⩾10% decrease from average. PASP, pulmonary artery systolic pressure; PADP, pulmonary artery diastolic pressure; PCWP, Pulmonary capillary wedge pressure; CO, cardiac output
Norepinephrine, epinephrine and oxygen consumption were measured at baseline and each of these were again measured at the end of the study period to provide additional evidence that patients’ clinical status remained stable during the study period. There were no significant differences across time in these measures (Table 4). During the study period, no patient required vasoactive or diuretic medication administration or other therapeutic intervention, and intravenous fluid administration rate did not exceed 30 ml/h.
Baseline and end of study measures of epinephrine, norepinephrine and oxygen consumption in control group patients
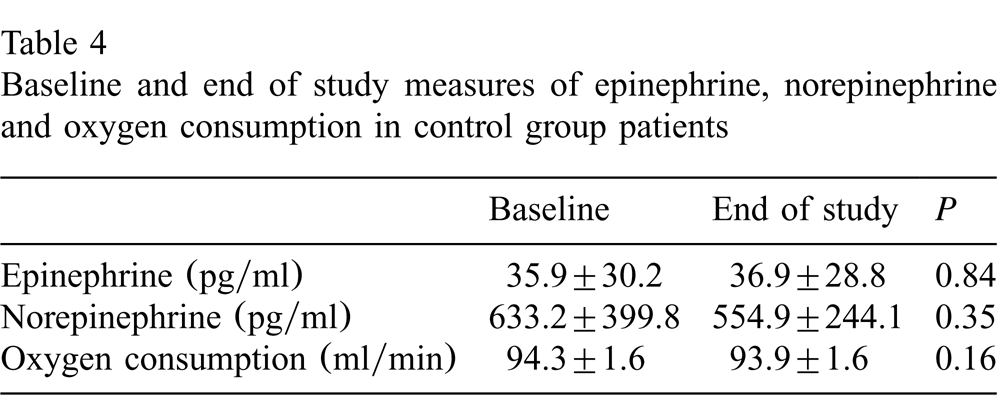
Baseline and end of study measures of epinephrine, norepinephrine and oxygen consumption in control group patients
A complete understanding of what constitutes normal fluctuations in pulmonary artery pressures and cardiac output is vital to interpreting and treating patients as they experience changing values of these measurements. Yet, this report is one of only a few investigations in which normal fluctuations in pulmonary artery pressures and cardiac output have been described [5–8]. Our data suggest that in patients with heart failure and severe left ventricular dysfunction, values of pulmonary artery pressure can fluctuate normally up to 8 mmHg for pulmonary artery systolic pressure, up to 7 mmHg for pulmonary artery diastolic pressure, up to 6 mmHg for pulmonary artery wedge pressure, and up to 0.8 l/min for cardiac output. However, because patients have a wide range of pulmonary artery pressures and cardiac outputs, and because spontaneous variability is dependent, in part, on the patient's baseline, normal fluctuations are best expressed as percentages. Based on our data in patients with left ventricular dysfunction fluctuations of 8–12% in pulmonary artery pressures and of 9% in cardiac output are expected.
Our values for normal fluctuations in pulmonary artery pressures are higher than those previously reported [5,6]. In previous investigations, normal fluctuations were defined as <4–5 mmHg for pulmonary capillary wedge pressure and pulmonary artery diastolic pressure, and <5 mmHg for pulmonary artery systolic pressure. Our values likely were higher because, we studied heart failure patients with high pulmonary artery pressures, whereas the previous investigators included patients with substantially lower pressures [5,6]. These differences again highlight the importance of considering spontaneous variability as a percentage from the patient's baseline and not as an absolute number.
This was the first study, to our knowledge, in which patients were studied who had severe left ventricular dysfunction and objective evidence was provided that patients were hemodynamically stable. In addition, patient position, and medication and fluid administration were controlled. In past studies, neither patient position nor therapy were controlled (e.g. some patients received fluids, blood, or inotropic support) during the study period, some patients were receiving mechanical ventilatory support, and there was no objective evidence of patient stability [5–8]. Thus, in this study, there appears to be greater validity for the assertion that the fluctuations described are indeed a reflection of normal oscillations in hemodynamic values.
Although our findings provide evidence that subjects with left ventricular dysfunction experienced average normal fluctuations of less than 12% for pulmonary artery pressures and 9% or less for cardiac output, some of our subjects demonstrated much greater variation in hemodynamic values. We found pulmonary artery systolic variations as great as 23%, pulmonary artery diastolic pressure variations as great as 56%, pulmonary capillary wedge pressure variations as great as 104% and cardiac output variations as large as 30% in this homogeneous group of subjects. Clearly, some of our subjects experienced significant variation in hemodynamics that were not related to catecholamine or oxygen consumption increases during this controlled study. Thus, the use of the mean coefficient of variation as an indicator of expected variation in pulmonary artery pressures and cardiac output provides only a broad guideline for clinicians and is not meant to be used as an absolute value of normal fluctuation in subjects with left ventricular dysfunction.
Clinicians working in critical care settings can use the results of this study to better evaluate the significance of changes in hemodynamics in their patients with severe left ventricular dysfunction and elevated pulmonary artery pressures. In addition, these data are important for researchers attempting to define clinical significance. These findings also underscore the importance of critically evaluating the significance of individual measure-to-measure hemodynamic changes. Clinical significance is best determined after examining trends over time in the context of other clinical indicators, and considering data such as that presented here and in other investigations that define normal fluctuations [5–8].
Footnotes
Acknowledgements
Grant support from the American Association of Critical-Care Nurses (AACN).