
Abstract
DNA array technology makes it possible to simultaneously study the expression of thousands of genes in a single experiment. DNA arrays are microscope slides (microarrays), or membrane filters (macroarrays) containing a large number of immobilized DNA samples. An array of cDNA-spots is subsequently probed with labeled cDNAs, which are obtained by reverse-transcriptase reaction from total RNA pools corresponding to the test and reference biological sources. Following the above hybridization step with dye-tagged or radioactively labeled probes, the DNA array is scanned to generate two images, each corresponding to one of the dye “colors.” A DNA array project typically requires iterations of series of processes, starting from experiment design and array fabrication, through array scanning, image analysis, and finally gene expression data analysis.
In the maturation process of microarray technology, there are two kinds of challenge. One is to develop the hardware for conducting hybridization experiments. The other is to manage the massive amount of information associated with this technology, so that results can yield insight to the genomic functions in biological systems. The fundamental challenge from hardware has been mostly resolved. On the other hand, the informatics challenge has just started.
ARRAY IMAGE ANALYSIS
The goal of array image processing is to measure the intensity of the spots, quantify gene expression values based on these intensities, assess the reliability of the data, and generate warnings to the possible problems during the array production and/or hybridization phases. Microarray images consist of arrays of spots arranged in grids. All the grids may have the same numbers of rows and columns of spots. These grids, called “sub-grids,” are arranged in relatively equal spacing with each other, forming a “meta-array.” Each sub-grid is created by one pin of the printing-head. Ideally, a simple computer program could easily accomplish the image-processing task by superimposing an array of circles with the defined dimensions and spacing. The pixels falling inside these circles would be considered signal and those outside would be background. However, for realistic arrays, the exact location of each grid may vary from slide to slide. There are a number of sources contributing to the problems, mainly due to mechanical constraints in the spotting process, hybridization inconsistencies, and the necessity to spot dense arrays to increase the efficiency of the hybridization experiments.
SPOT FINDING METHODS FOR RESOLVING THE SPOT LOCALIZATION ERRORS
The spot finding operation aims to locate the signal spots in images and estimate the size of each spot. There are three different levels of sophistication in the algorithms for spot finding, corresponding to the degree of human intervention in the process. These are described below, in order, from greatest to least amount of manual intervention.
Manual spot finding
This method is essentially a computer-aided image processing approach. The computer itself does not have any visual capabilities to ‘see’ the spots. It provides tools to allow the users to tell the computer where each of the signal spots are in the image. To conduct an accurate measurement, this method is prohibitively time-consuming and labor intensive for images that have thousands of spots. Thus, considerable inaccuracy of the data may be introduced due to human errors, particularly with arrays having irregular spacing between the spots and large variation in spot sizes.
Semi-automatic spot finding
The semi-automatic method requires some level of user interaction. This approach typically uses algorithms for automatically adjusting the location of the grid lines, or individual grid points after the user has specified the approximate location of the grid. What the user needs to do is to tell the program where the outline of the grid is in the image. For example, the user may need to put down a grid and adjust the size of it to fit on the array of the spots, or to tell the program the location of the corners of the sub-grids in the images. Then the spot finding algorithm adjusts the location of the grid lines, or grid points, to locate the arrayed spots in the image. User interface tools are usually provided by the software to allow for manual adjustment of the grid points if the automatic spot finding method fails to correctly identify each spot.
This approach could potentially offer great timesaving over the manual spot finding method since the user needs only to identify a few points in the image and make minor adjustments to a few spot locations if required. Such a process is provided within the interface of ImaGene™ (BioDiscovery, Los Angeles, CA).
Automatic spot finding
The ultimate goal of array image processing is to build an automatic system, which utilizes advanced computer vision algorithms, to find the spots without the need for any human intervention. This method would greatly reduce the human effort, minimize the potential for human error, and offer a great deal of consistency in the quality of data (table 1). Such a processing system would require the user to specify the expected configuration of the array (e.g., number of rows and columns of spots), and would automatically search the image for the grid position. Having found the approximate grid position, which specifies the center of each spot, the neighborhood can be examined to detect any signal and background. Knowledge about the image characteristics should be incorporated to account for variability in microarray images. The spot location, size, and shape should be adjusted to accommodate for noise, contamination and uneven distribution. AutoGene implements such a process (table 2).
Benefits of fully automated microarray image processing.
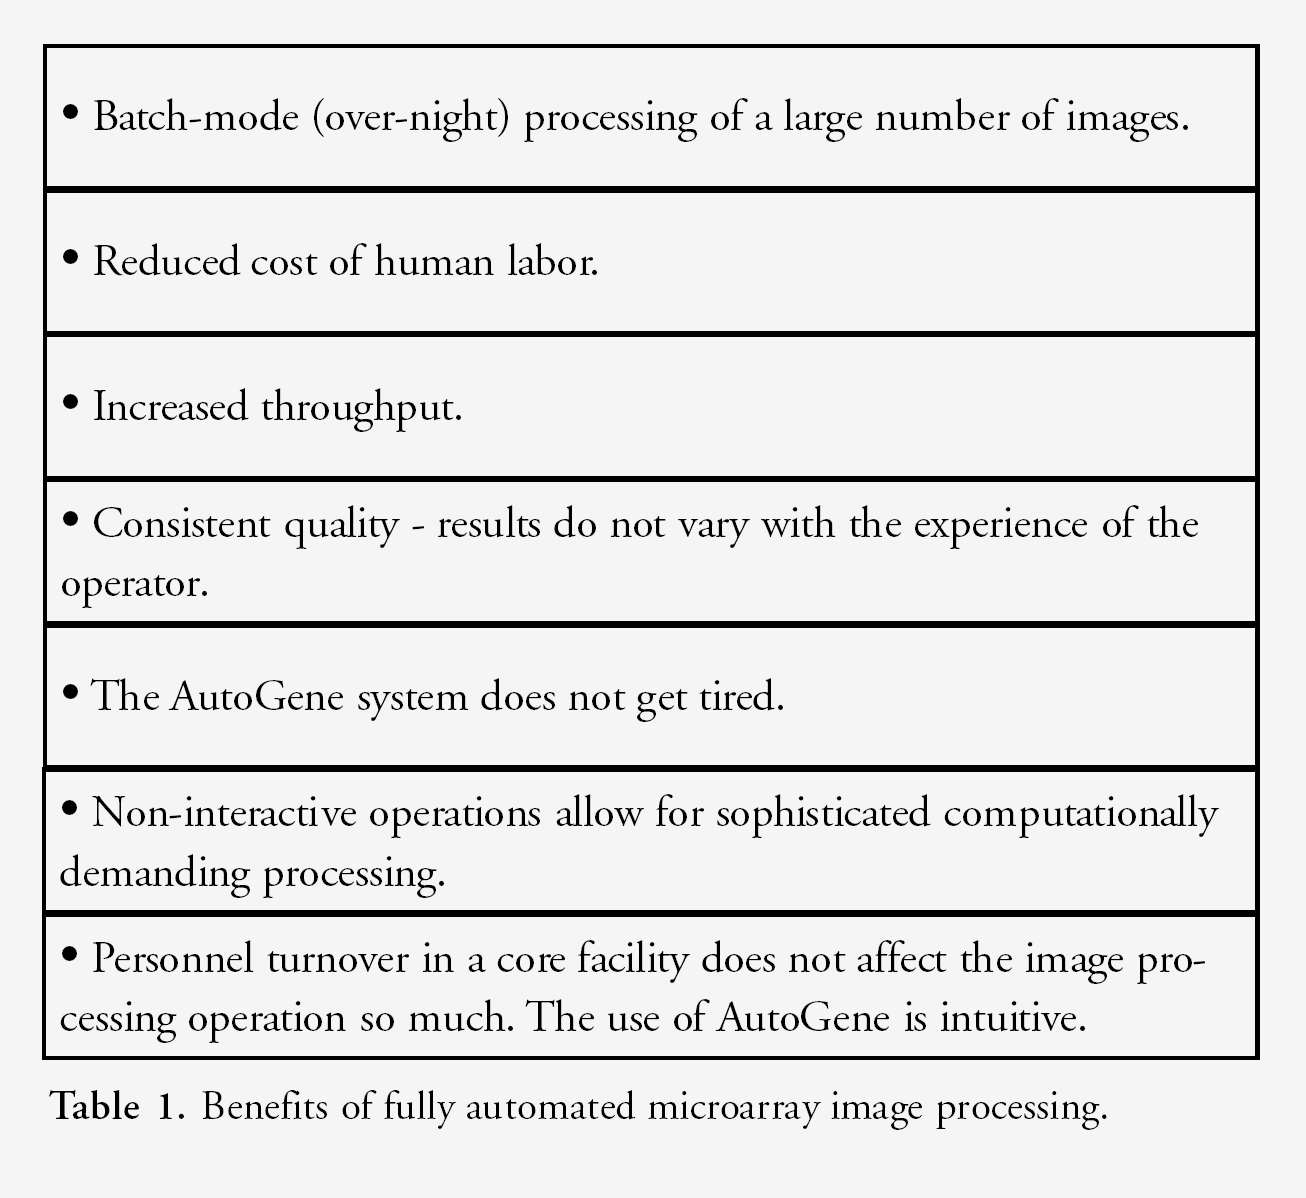
A Summary of AutoGene technology. The AutoGene system needs only input of the microarray configuration (number of rows and columns of spots in a sub-grid and number of rows and columns of sub-grids in the metagrid) and a list of image files for analysis. AutoGene will search the image for grid position without operator's help.
THE AUTOGENE MICROARRAY IMAGE ANALYSIS SYSTEM
AutoGene is a fully automated system that allows for batch processing of hundreds of images at a time and also incorporates more sophisticated image analysis and statistically reliable data quantification. The system has been designed to fully automate image analysis and data quantification operations and answer the need of the pharmaceutical drug discovery laboratories and academic core facilities.
The first main characteristic of AutoGene is automatic spot finding. The AutoGene system needs only input of the microarray configuration (e.g., number of rows and columns of spots) and a list of image files to process, after which analysis is performed automatically. The system will search the image for grid position without operator's help. It identifies the layout of the array, localizes the spots, and performs measurements without the need of user intervention.
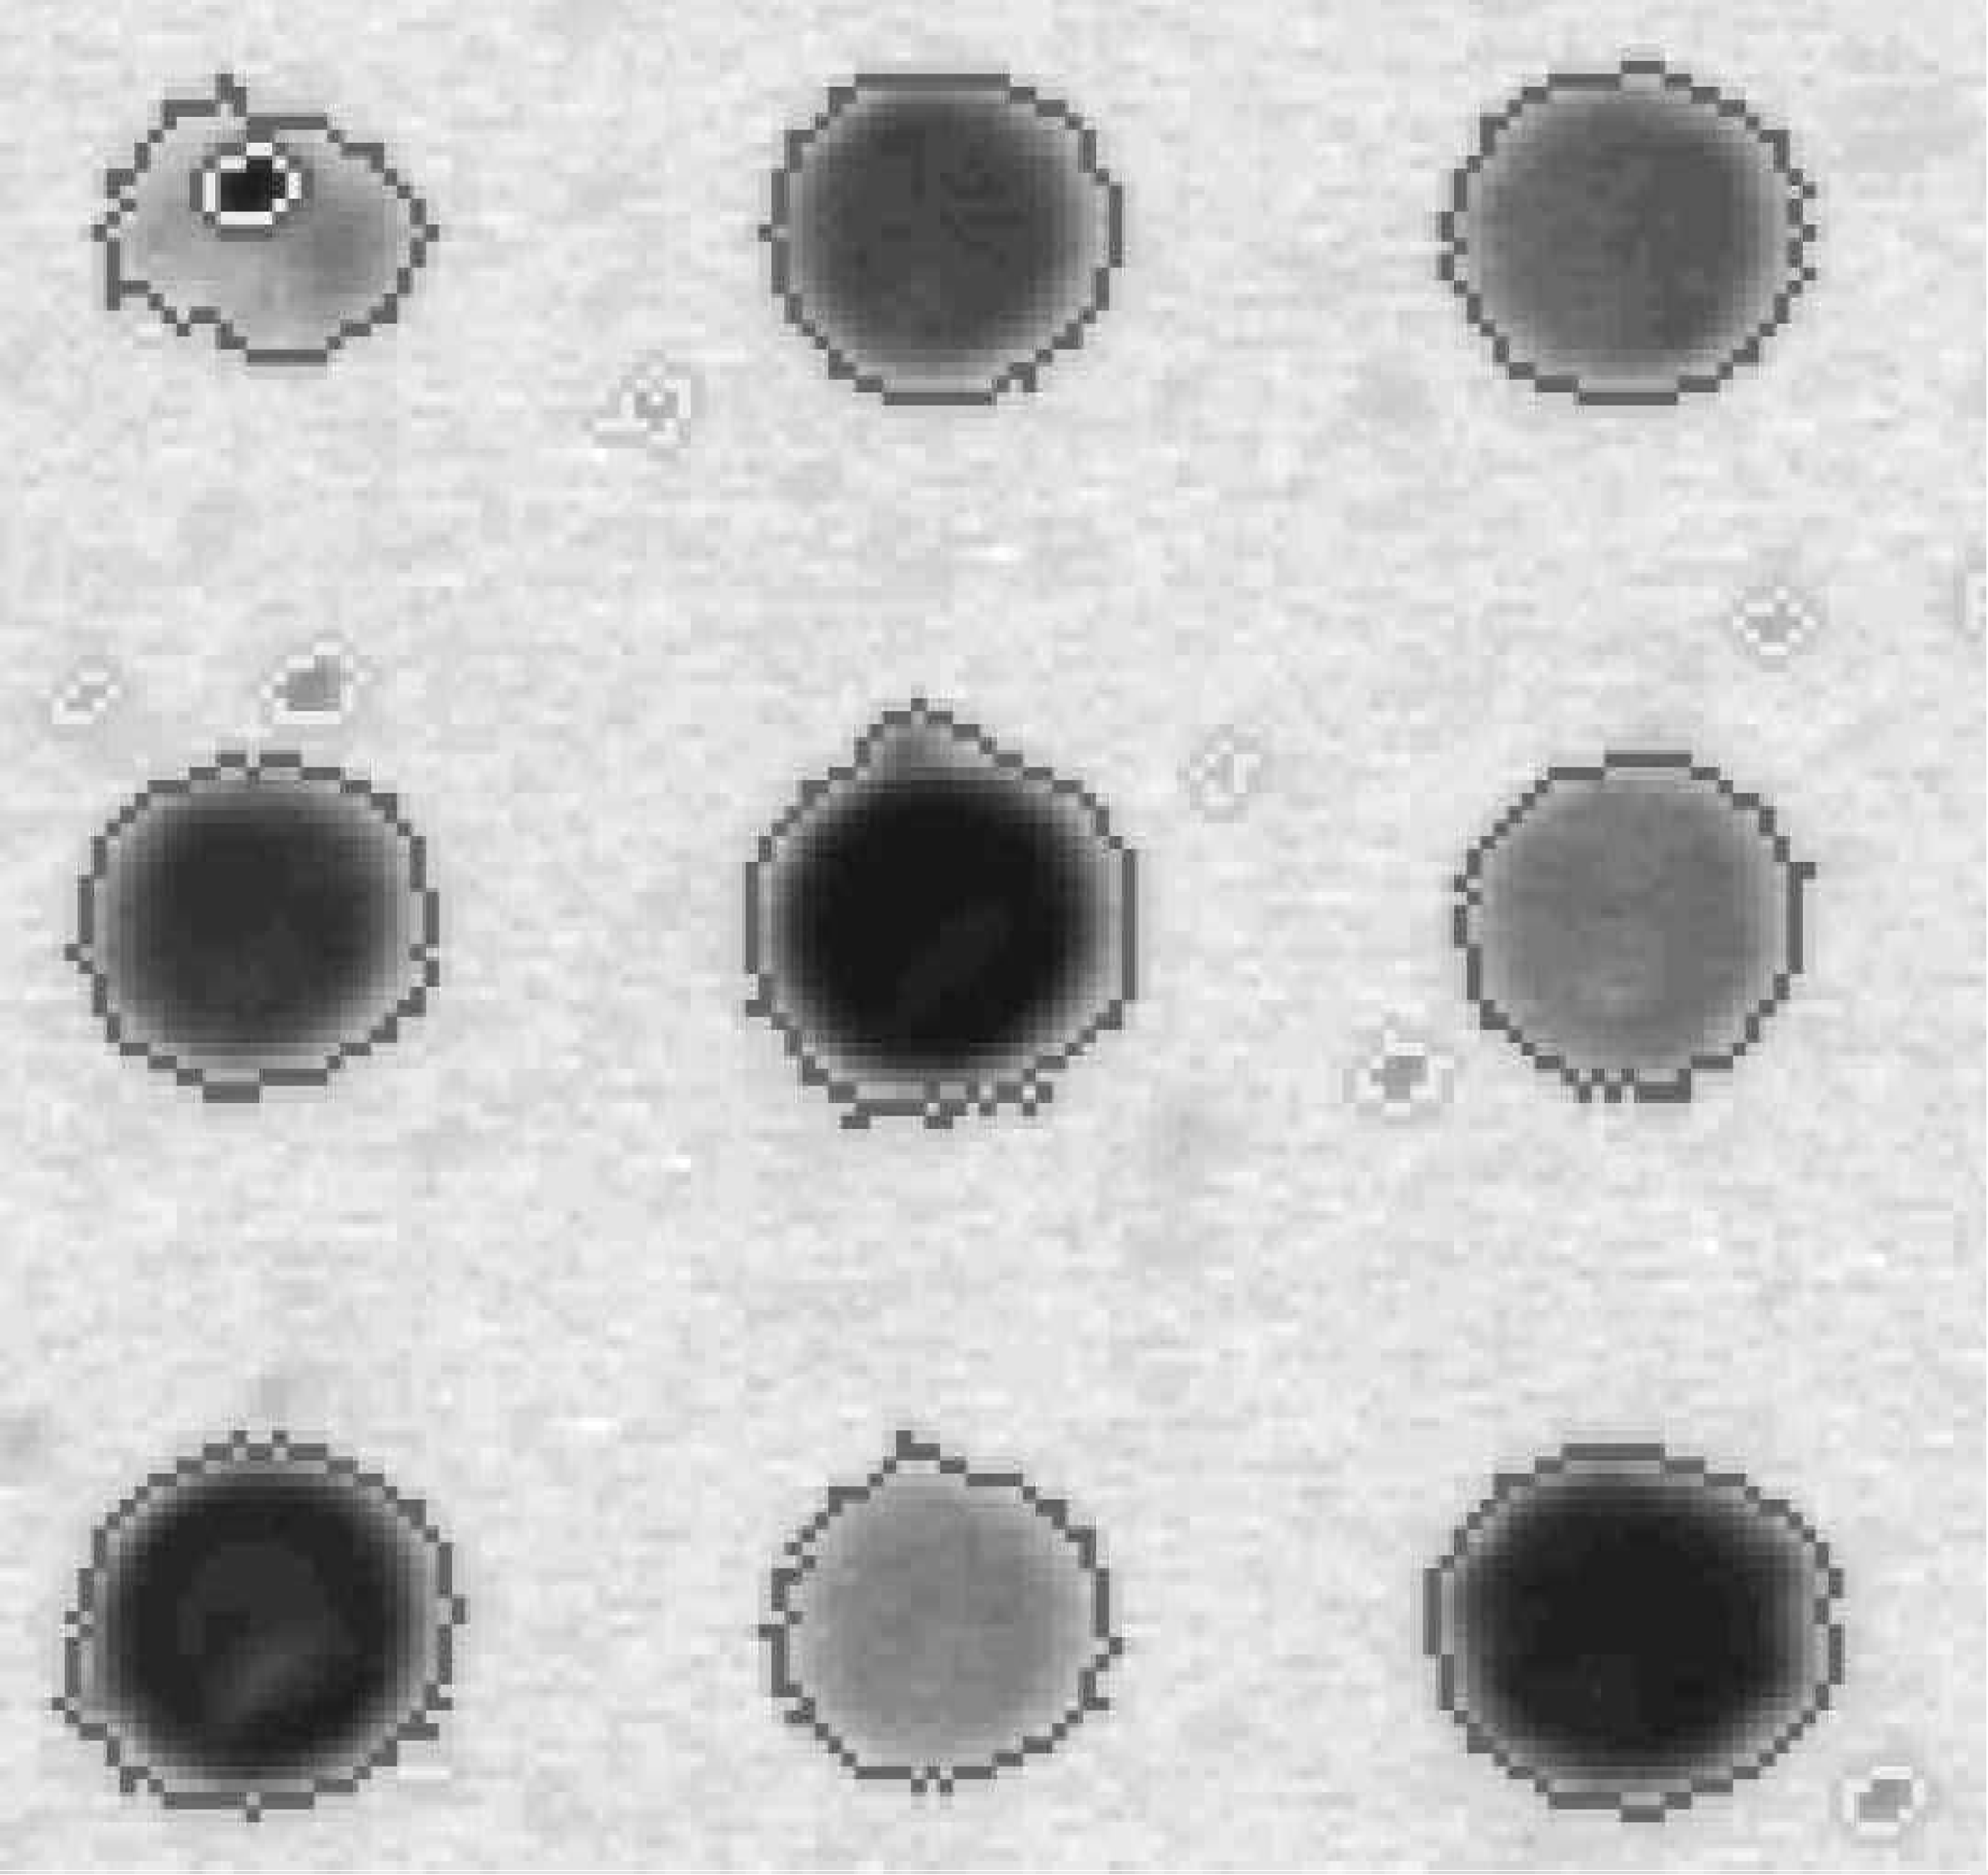
Spots are quantified and assessed for artifacts individually using several patent-pending computer vision algorithms, which increases the reliability of the data (Fig. 1). The software can automatically detect and remove contamination from the images. Robust statistical algorithms process irregularity of spot sizes and shapes, which is caused by spot-printing hardware errors.
Multiple quality measures per spot are obtained, which allow for association of confidence values to each measurement (table 3). The program correctly identifies signal pixels from background, and throws away the contamination pixels. The measurements are of high accuracy thus providing quality data. AutoGene offers consistent quality because results do not vary with experience of the operator.
Selected quality measurements available in AutoGene.

The second main characteristic of AutoGene is its autonomous operation, which offers batch-mode (over-night) processing of multiple images (Fig. 2). An operator will load the images for analysis and the experimental configuration and start the system. This walk-away approach allows one person to set many images for analysis for less than several minutes.
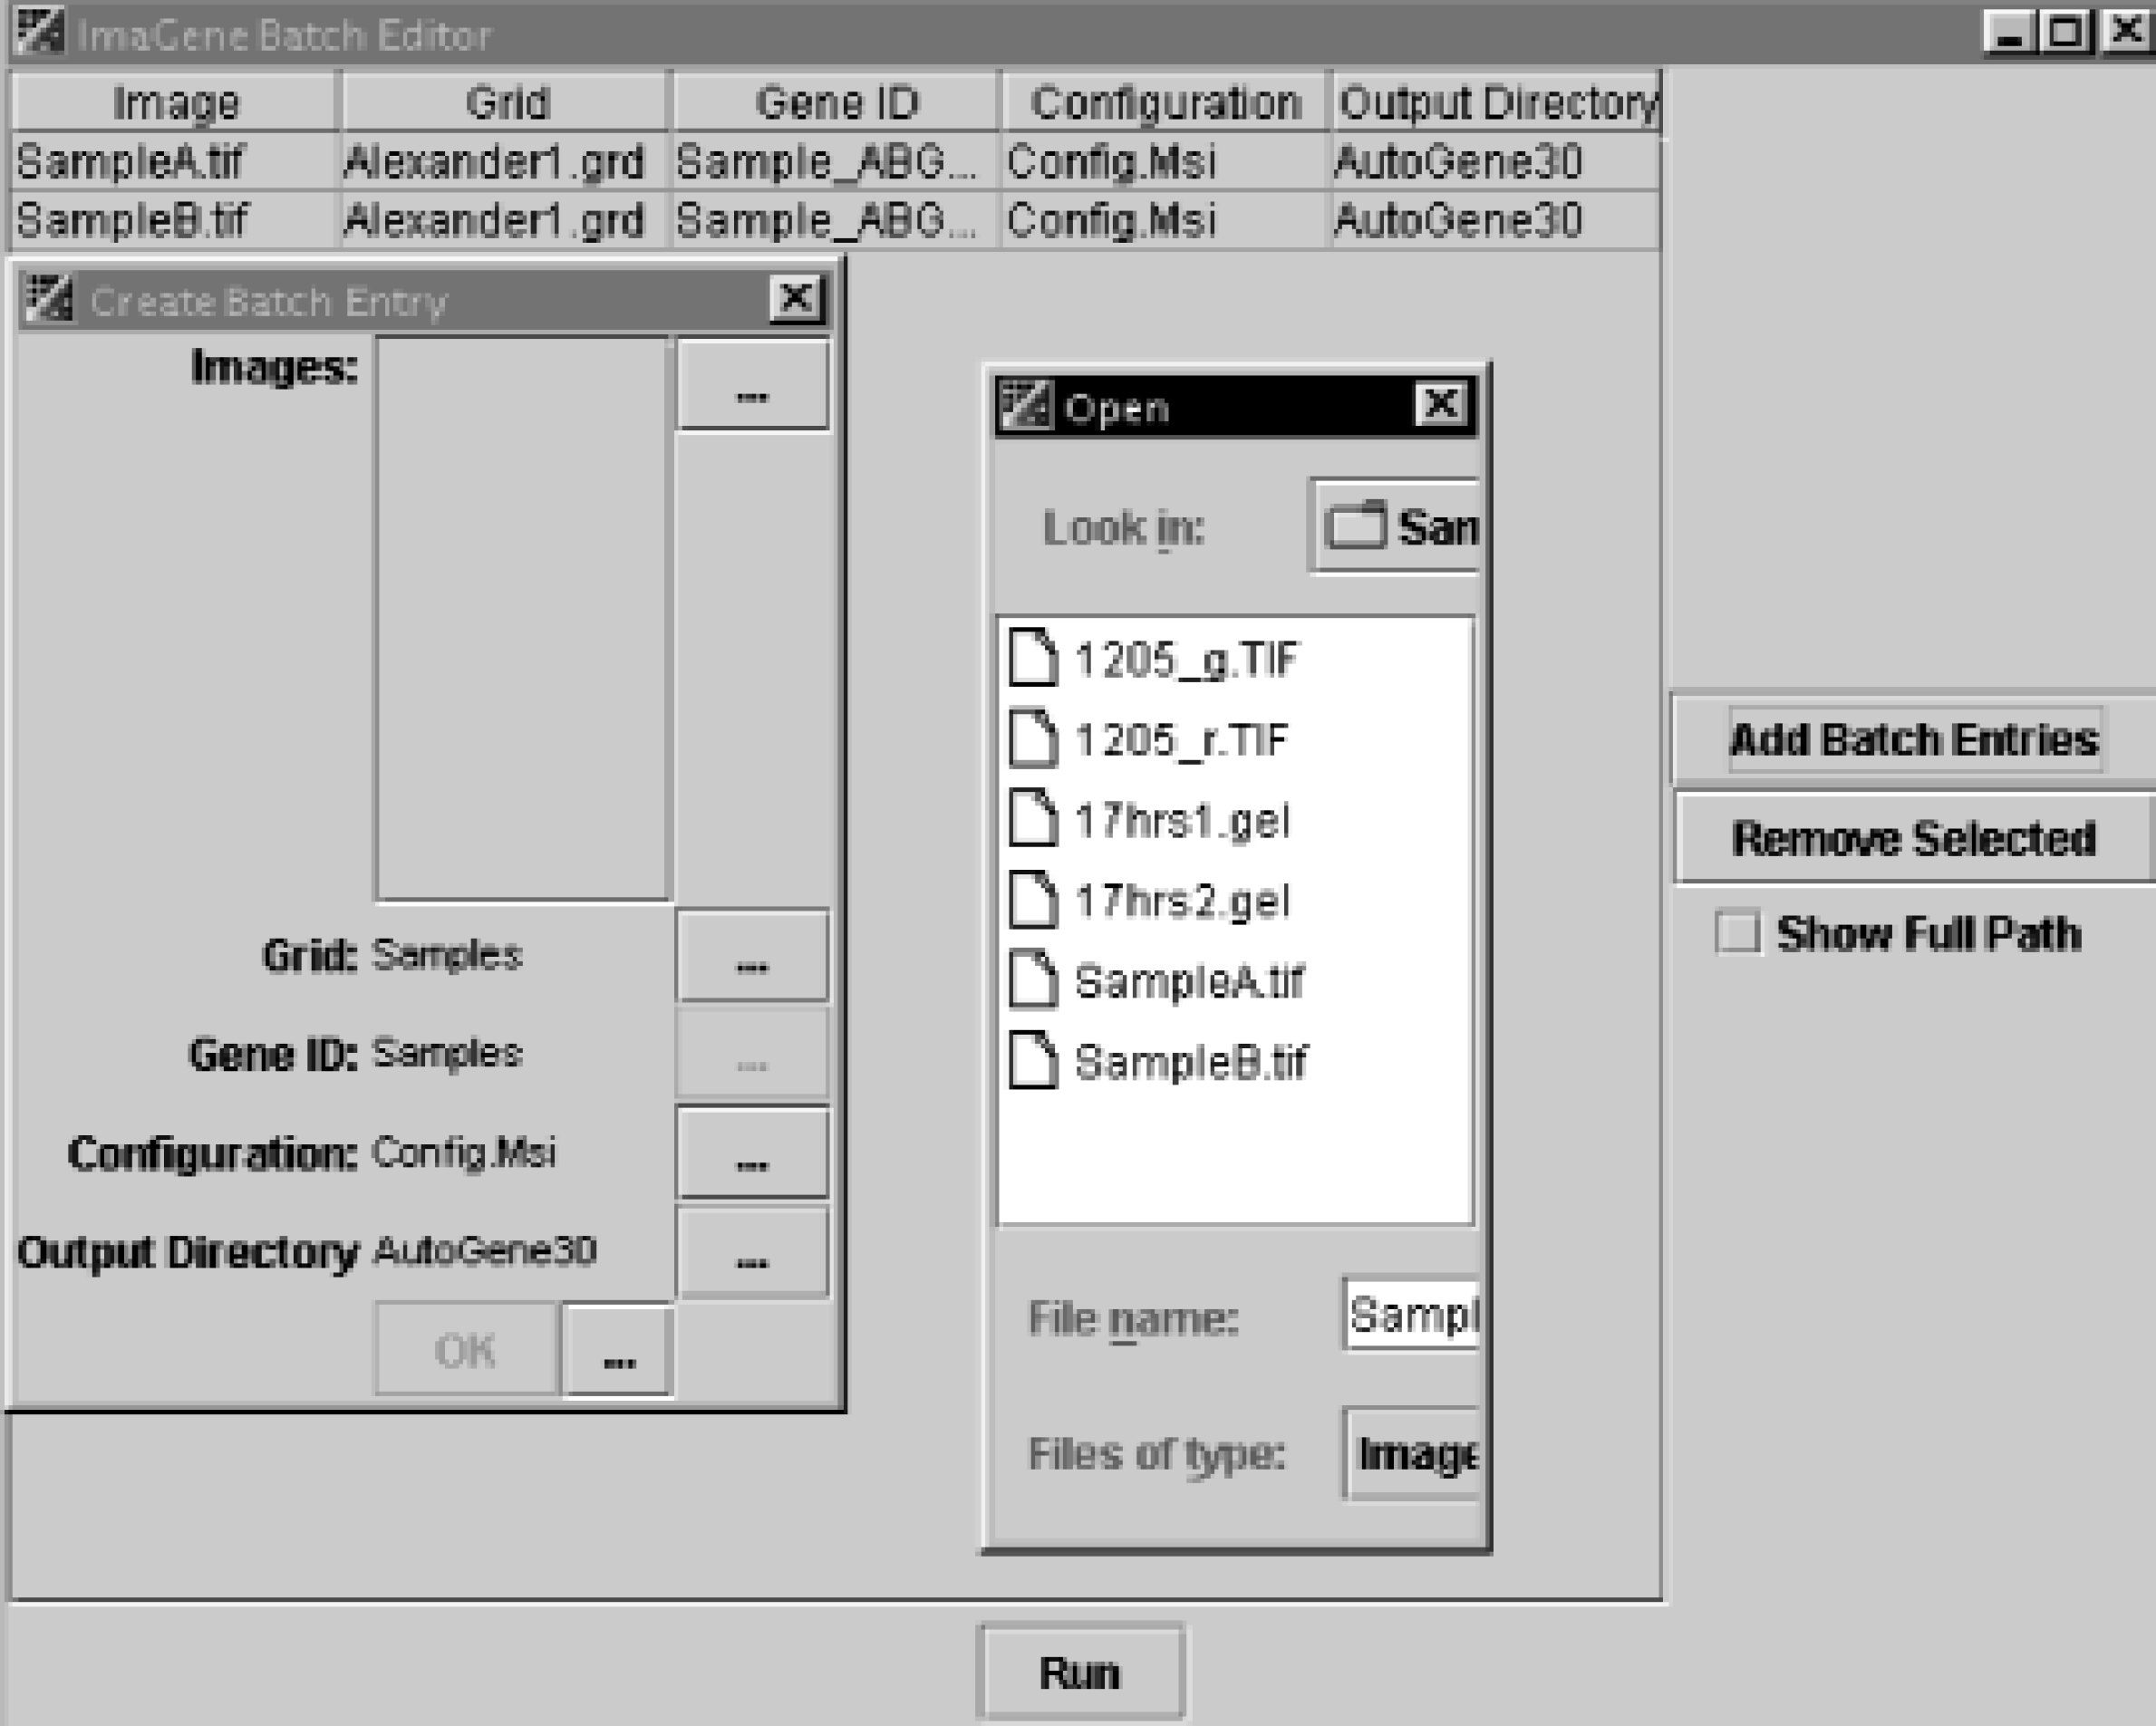
AutoGene offers autonomous batch-mode (over-night) processing of multiple images. Microarray images are loaded for analysis together with the experimental configuration and the system starts processing them without a human in the loop.
After quantification, the files are saved for further analysis. AutoGene has been designed as a shared resource to be executed on a server (Fig. 3). Users will be able to review saved data from their personal computers with ResultsReviewer™ at a later time.
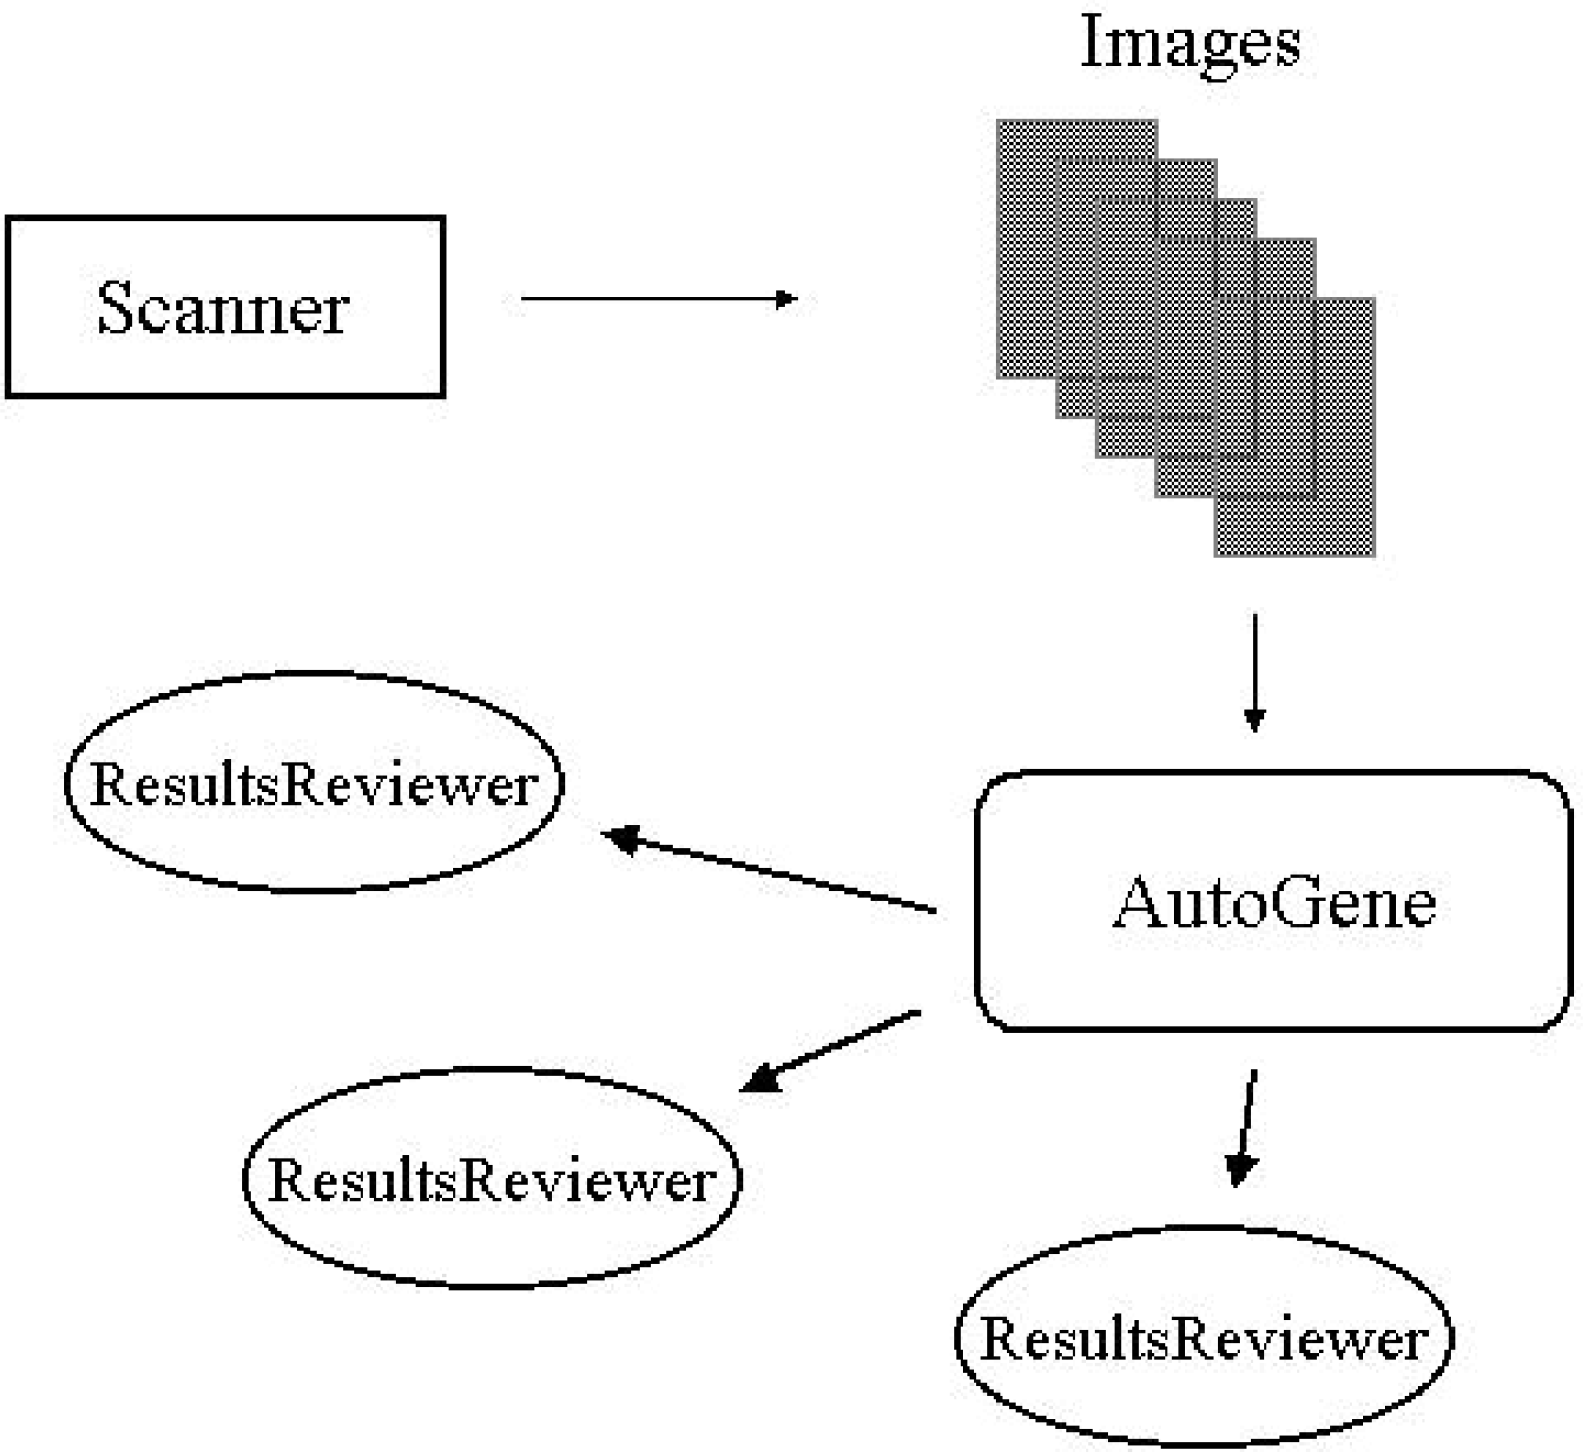
AutoGene has been designed as a shared resource to be executed on a computer-server. Analyzed data are reviewed with ResultsReviewer™ on researchers personal computers.
Results Reviewer is an auxiliary software tool created to allow AutoGene to continuously operate in a batch mode while freeing researchers to review data generated by AutoGene at any time. ResultsReviewer offers visual presentation of the results for manual inspection of AutoGene. Additionally, it is equipped with visualization tools to view data in scatter plots, GenePie™ (Fig. 4), and ratio histograms. In a scatter plot each point represents the expression value of a gene in two experiments, one plotted on the x-axis and the other on the y. Genes with equal expression values would line up on the identity (diagonal) line, whereas outliers will correspond to up or down regulated genes. In GenePie, the ratio of expression levels between multiple channels is shown graphically with an intuitive pie chart display.
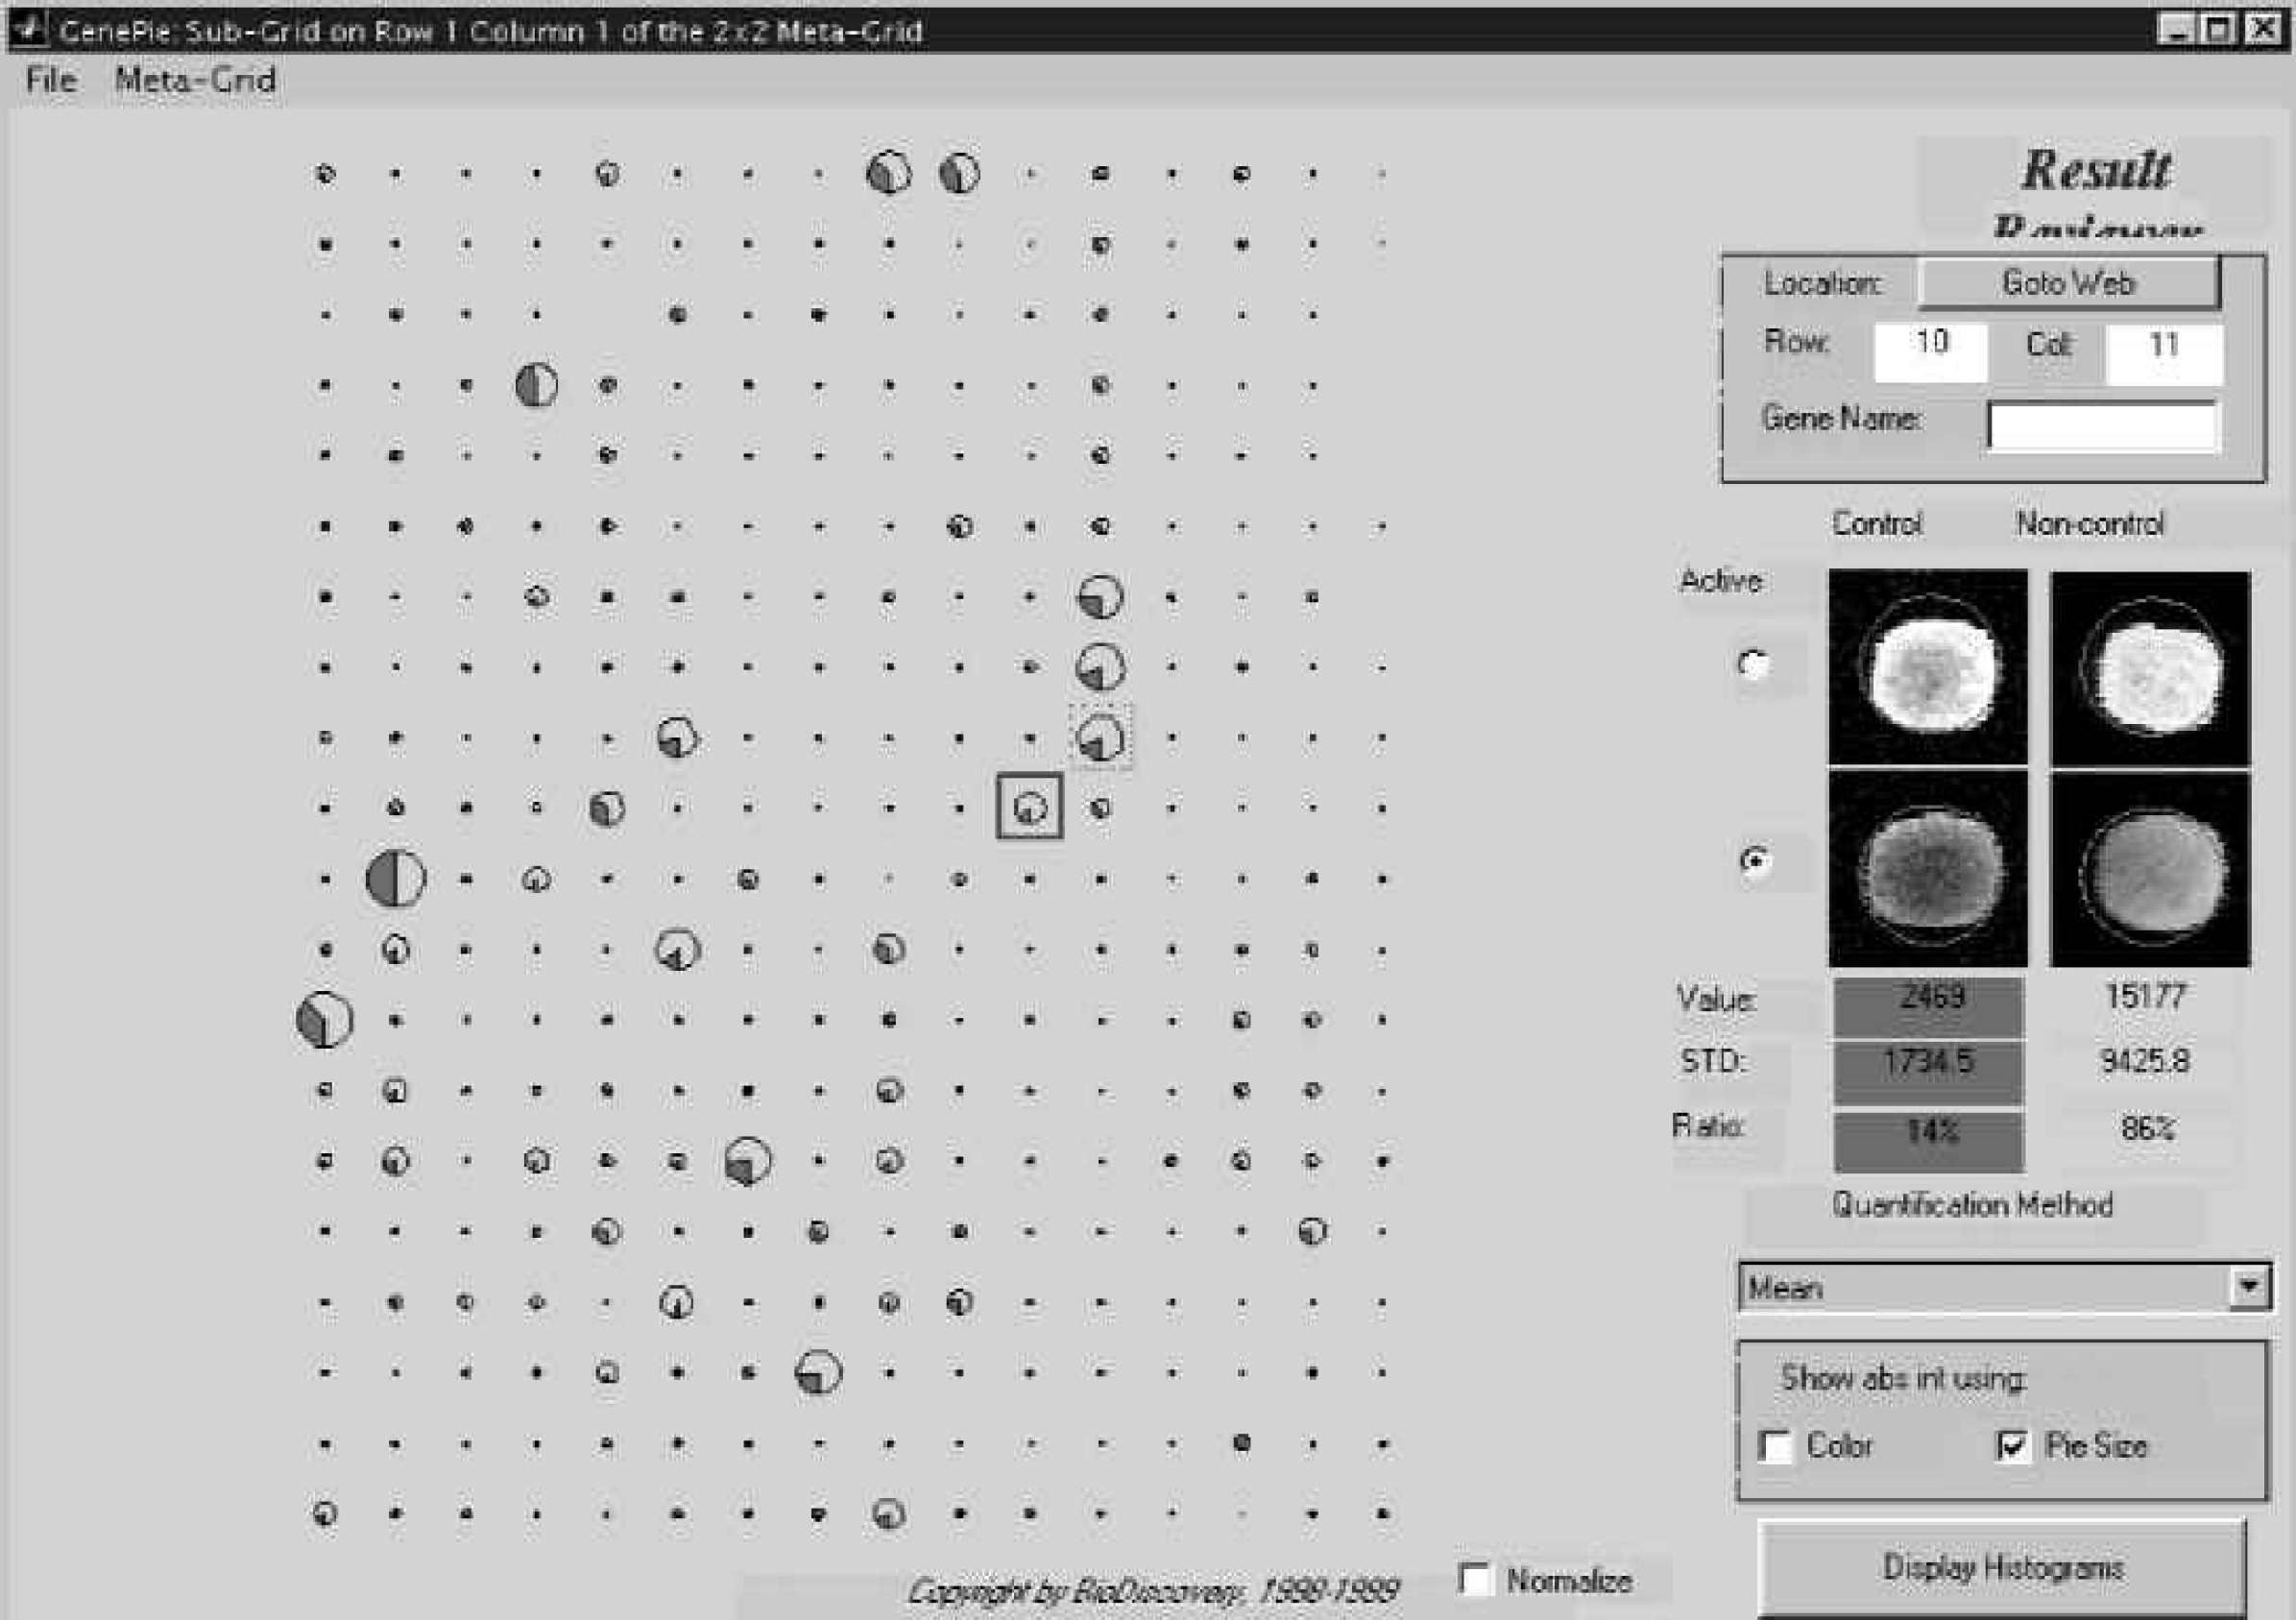
ResultsReviewer™ (BioDiscovery) is a software designed to access processed data by AutoGene on a remote computer or workstation, while AutoGene is running in a batch mode. Pie charts in GenePie™, a module in ResultsReviewer, use color to show the ratio of control to non-control (test) gene expression levels. In the “PieSize” option, the size of the pie is proportional to the sample's intensity.
The user has an option to control the quality of the automated process of image analysis by setting alert parameters (Fig. 5). Control spots can be assigned and identified in the gene ID file. Minimum and maximum settings for these spots are entered. If the measured intensity of any control spot is smaller than its minimum intensity allowed, a warning message would be printed in the logfile.txt file.
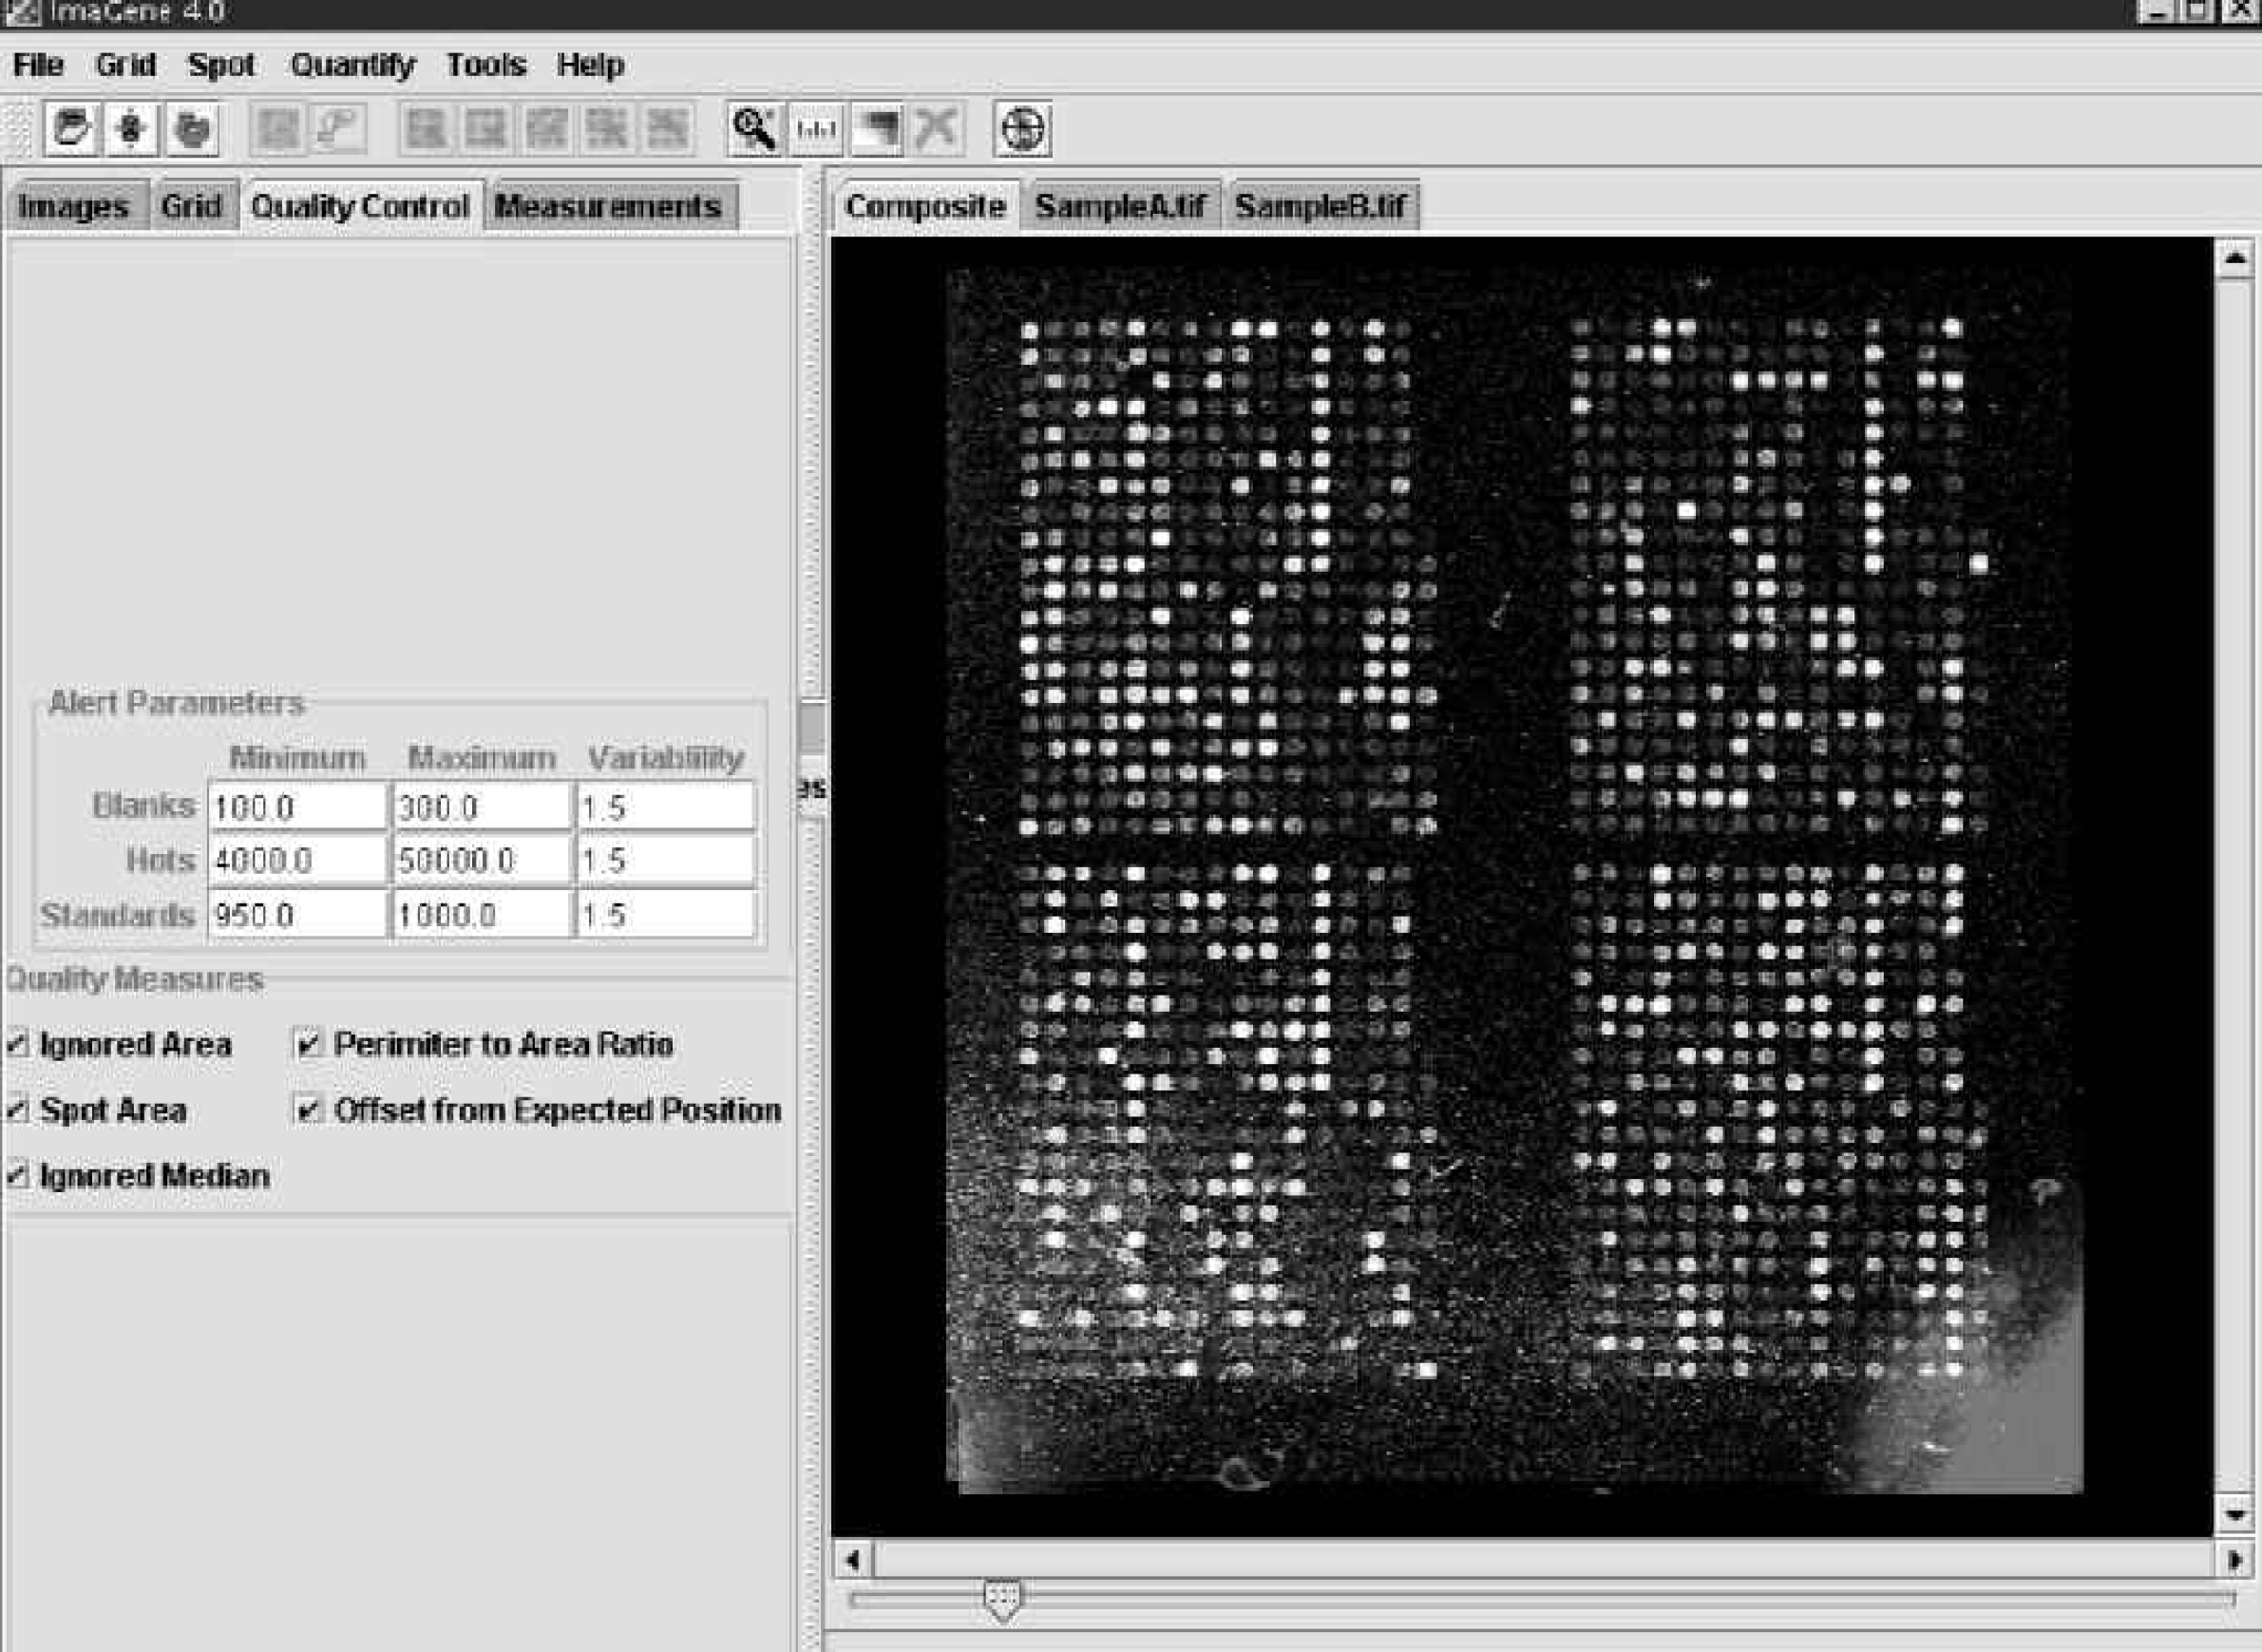
AutoGene has alert parameters for the batch processing step. An operator can specify the maximum and minimum intensity of control spots such as blanks, hots (genes known to be overexpressed at the studied condition), and control spots (house keeping or other genes). Researchers can choose out of several quality measures for their final report.
CONCLUSION
Automation of microarray image processing has become an absolute necessity for many pharmaceutical and academic microarray core facilities. AutoGene has been successfully used in various research environments to speed the image-processing step of microarray operations. Its files can be exported to the data-mining tool GeneSight™ (BioDiscovery) for data analysis with advanced multivariate analysis techniques.