
Abstract

Overview
Small systematic spatial errors can result in significant errors in the results of a large array of experiments. For example undetected column or row or edge errors can result in a positive response failing to meet a threshold, missing that hit, or cause a negative response to be called positive, consuming resources in following it up.
Typically, array data from automated experiments is presented as an image, allowing a visual examination of the intensity of the response in each spot or location. With this visual examination, scientists can identify gross systematic errors from the patterns in the image. For example, a dark column or row of experimental data may indicate a problem with a reagent dispenser and a completely bright or dark array may indicate a problem with the reader. However when a range of random real experimental responses and a systematic error appear together, the systematic error is often hard to spot.
The Array Validator™ is used to automatically validate large batches of data, alleviating the need for time consuming manual examination of all data and results. With this technology, scientists can have confidence in the majority of the validated data and focus their attention on just the results that the system indicates are potentially problematic.
Array Validation Technology
The Discrete Fourier Transform (DFT) is used in periodogram analysis in which the power density spectrum of a signal is estimated. The power density spectrum shows the energy contained in each frequency component represented in a signal. If particular frequencies dominate the original signal, the Fourier transform will have large amplitudes at the frequencies. For the case of spatially arrayed data, these frequencies represent spatial frequencies such as a signal occurring in every other array position, every fourth array position and so on. DFTs have been used extensively for locating and removing spatial and temporal signals in image and signal processing.
In order to identify spatially non-random plates, we employ the Kolmogorov-Smirnov (KS) test to determine if the observed periodogram distribution is statistically different from a random non-correlated distribution. Using this test we compute the probability that the observed periodogram is drawn from the same distribution as a periodogram generated from random data. The KS test is used instead of the well-known student's t-because the periodogram distribution is not a normal Gaussian distribution and that a plate with uncorrelated signal and a plate with systematic error may have close to the same periodogram mean. The KS test captures these differences where the t-test does not. Low probability values (p-values) indicate that the observed periodogram is not random and therefore contains correlated signal.
Figure 1 shows an example of an array of data that has larger-than-random high frequency distributions and the slight differences in the periodograms that result in the suspicion that the data has a non-random component.
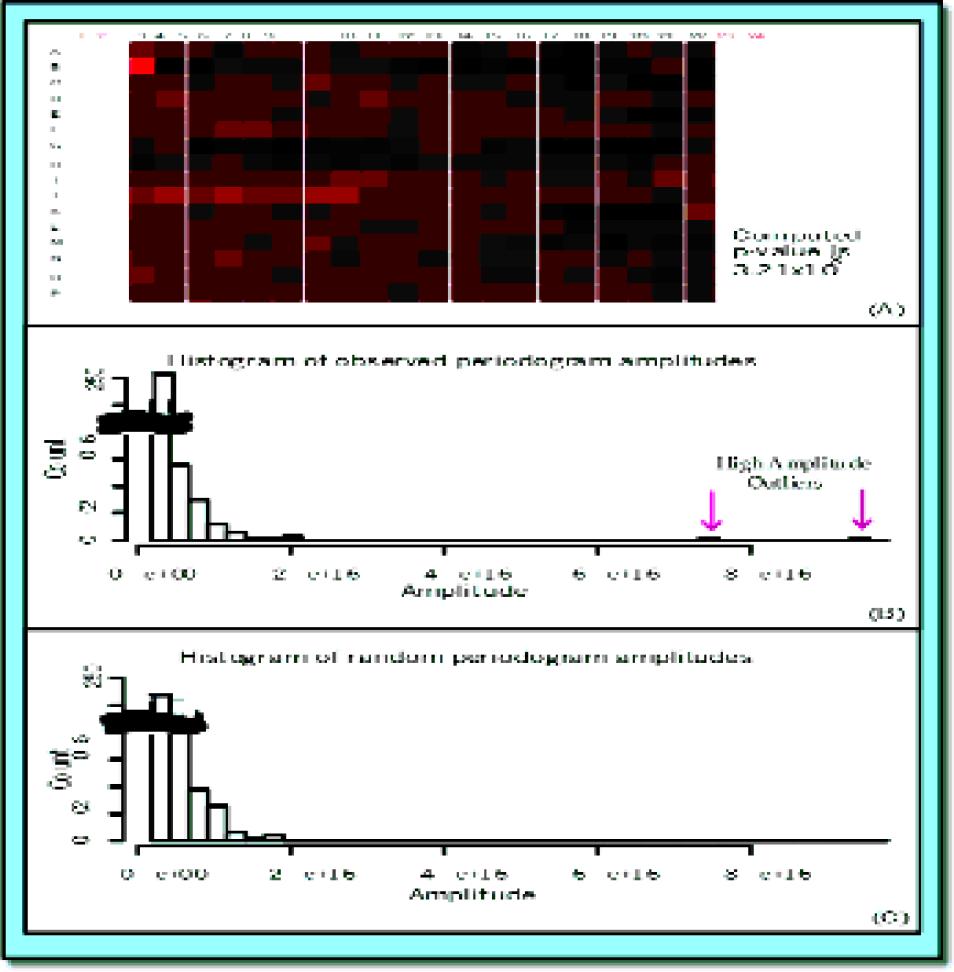
An example of an array of data, top, that has larger-than-random high frequency distributions. The periodograms from this data, middle, and the periodograms from a random distribution, bottom, show the subtle difference in the frequencies that signal a non-random spatial correlation.
When the probability value indicates that the array of results may be non-random above a threshold, the frequencies in the periodogram and the spatial correlations in the experiment can be analyzed to determine if they are derived from allowed correlations between the responses of this particular experiment or if the correlations are an indication of a problem.
This technology also provides powerful troubleshooting tools for scientists reviewing the data and Alert messages. The software allows the scientists to visualize and explore the non-random pattern in the process of making the final decision of how to handle the Alert message. These tools are also very useful when scientists are developing and testing new experiments.
Array Validator™ System
This technology is deployed as standalone software with a Microsoft® Excel user interface and front end. The system runs a DFT and analyses the periodogram with a single function on any type of array data in an Excel spreadsheet. The function produces a probability value that indicates the degree of randomness of the data. The software also provides a default built in threshold that summarizes the output probability value with a rule-of-thumb indication that the data is acceptably random or warrants further attention. An example array with the calculated probability value and evaluation is shown in Figure 2.
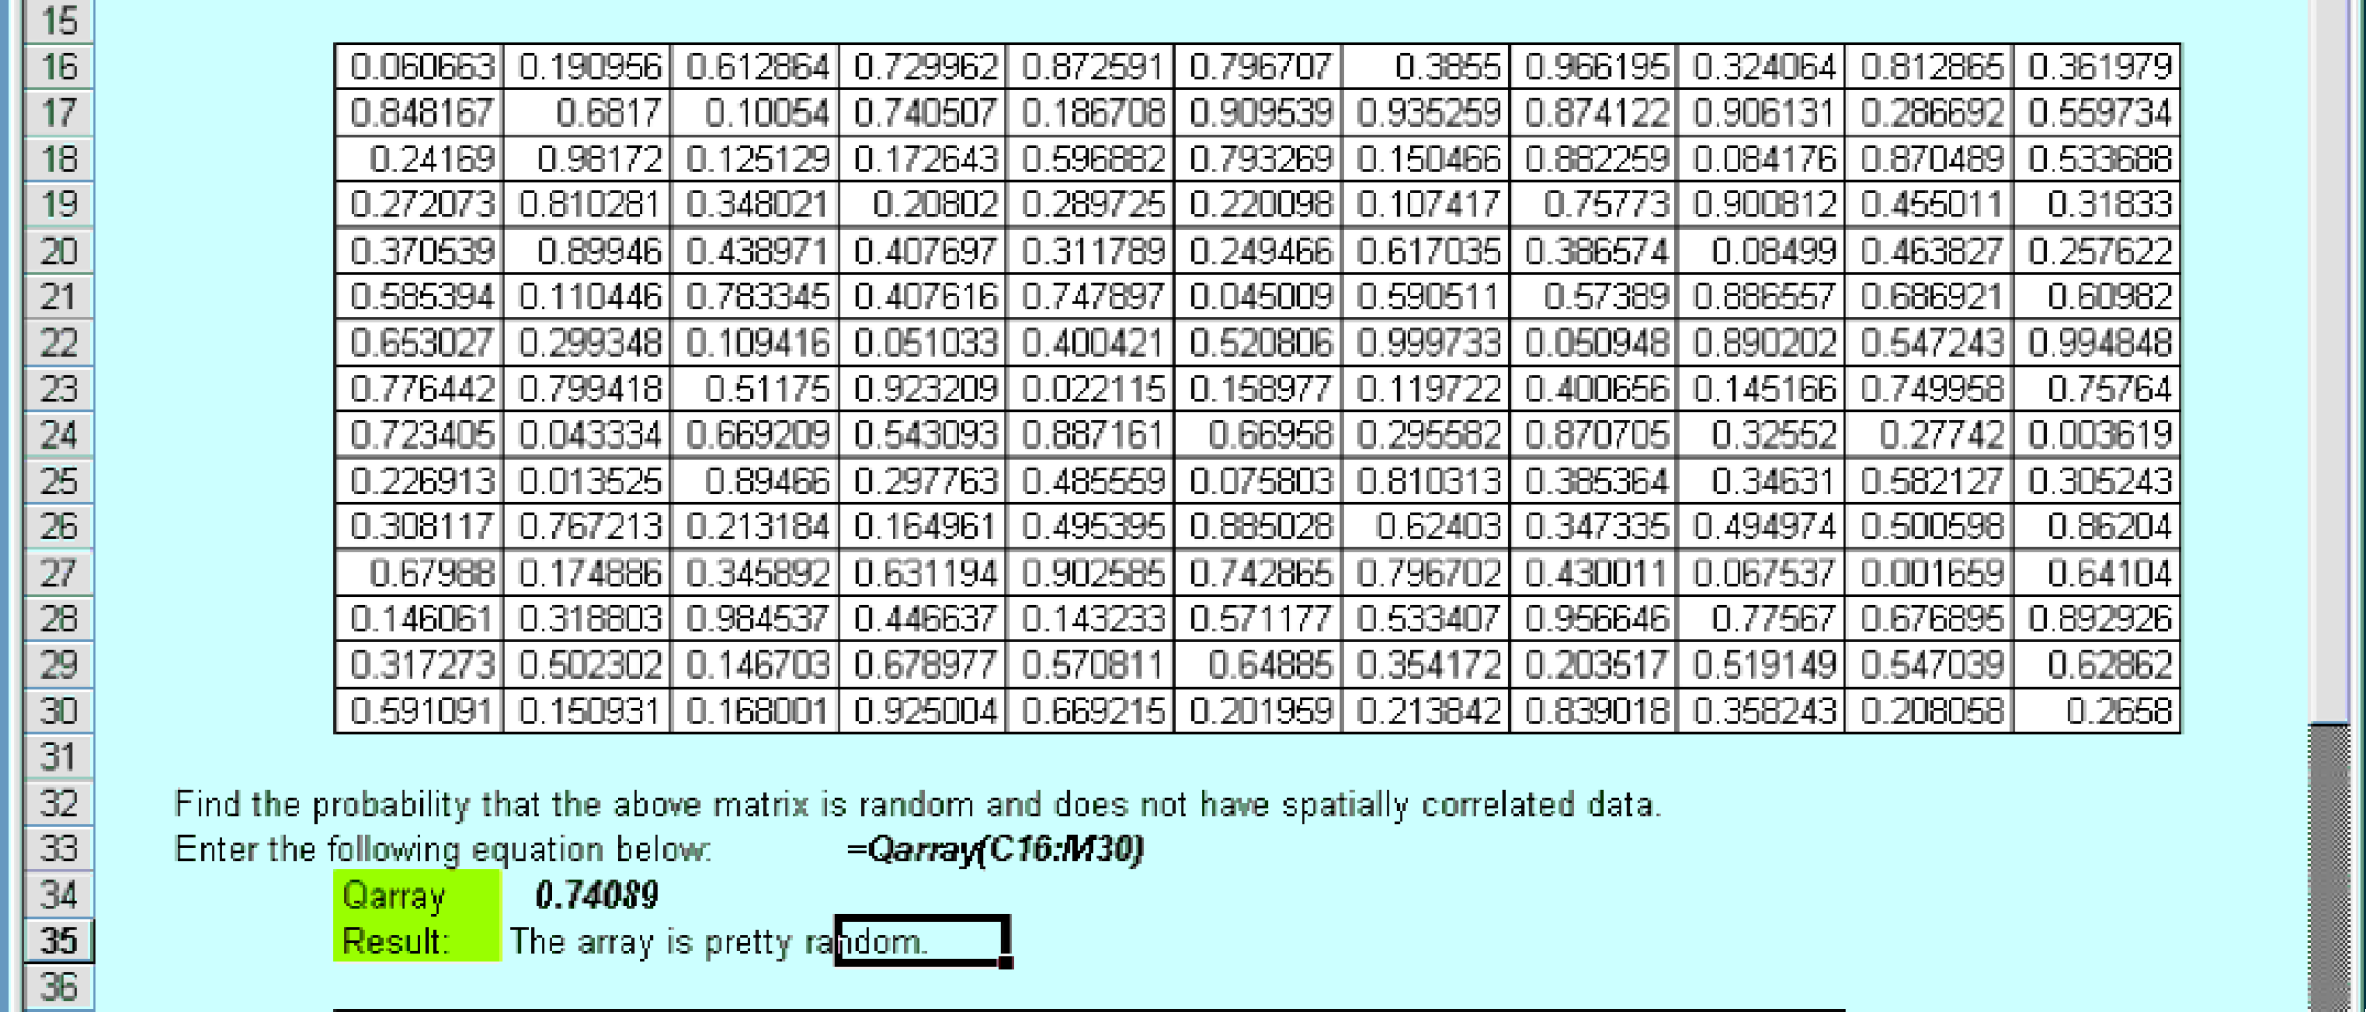
Array response values in a Microsoft® Excel spreadsheet and the results of the statistical analysis of the DFT Periodogram. The 0.3001 p-value indicates that the array responses are fairly random.
Datect has also developed a user-interface to the Array Validator™ that allows scientists to visualize the periodograms and review any spatial correlations that are detected from them. This user interface is a valuable tool for reviewing any Data Validation Alerts that Datect's system may have generated on potentially problematic data. The user interface can also set up rules for Periodogram Analysis that describe expected and allowed spatial correlations in the data - the detection of which should result in the generation of a Data Validation Alert message from an automated system. The user interface is also conveniently deployed as Excel macros that may be automated with Visual Basic for Applications or simply placed in Excel Templates. An example of an array analysis and error reconstruction is shown in Figure 3.
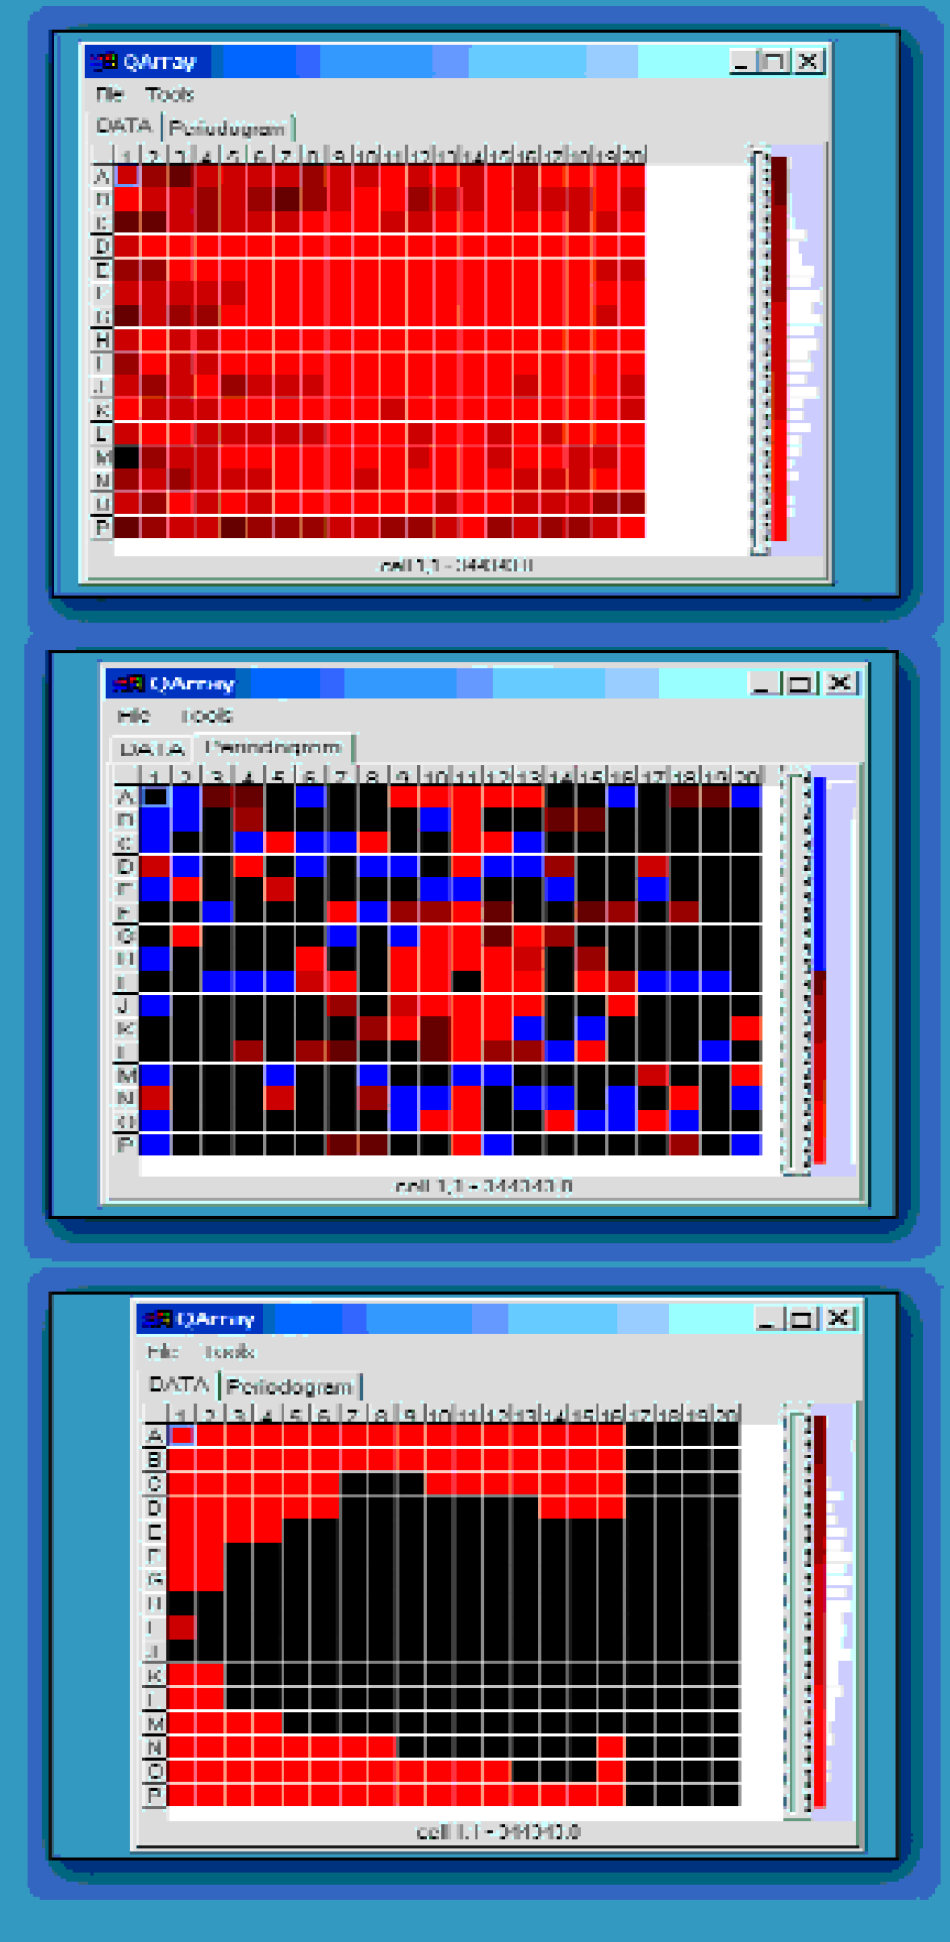
The data from a standard 384-well experiment is shown in Figure 3a, with color intensity used to highlight the intensity of the response in each well. In Figure 3a, no systematic error is apparent by eye, however the analysis of this data with Array Validator produces a low probability that the data is random. The periodogram of the array in Figure 3b shows higher amplitudes of the low frequencies (in the middle of the array) than is normal for a random distribution. Reconstruction of the array in Figure 3c using these low frequencies reveals that the data at the left, top, and bottom of the plate are considerably brighter than the rest of the plate.
The Microsoft® Excel deployment makes this data validation technology immediately and easily accessible to the majority of LIMS systems and reader data files. Datect's software can also be customized and integrated so that this data validation is seamlessly automated with specific workflows.
Conclusions
Discrete Fourier Transforms and analysis of the resulting periodograms provides a sensitive assessment of the randomness of an array of values. Non-random patterns may be an indication of a systematic error in the experiments. These techniques also allow the reconstruction of any spatial non-randomness in order to evaluate the potential problem.
The Datect Array Validator™ provides a way to automatically validate array data and generate an alert message when spatial non-randomness is detected. The system can also be designed to analyze any detected spatial correlations to see if they are a valid experimental response before generating a data validation error. Datect can customize the Array Validator™ for each customer's experiments, data, instruments, and automation, increasing the speed and lowering the cost of creating an automated Array Validation system.
The Datect Array Validator™ can be integrated into any existing instrument control, data acquisition and information management environment. The Datect software is platform independent and can be a centralized server, allowing customers to centralize data analysis and maintain central control of the data validation process.