
Abstract
The world is facing an environmental crisis. Long-term environmental sustainability requires social change: individuals need to take personal responsibility for the environment and change their behaviour. Environmental volunteering organisations play a key role in this process: they create opportunities for individuals to improve their natural environment, they facilitate behavioural change. Successful facilitation of behavioural change requires in-depth understanding of the environmental volunteering market to identify those individuals most likely to volunteer, compete successfully and create targeted, motivating marketing campaigns.
The present study (1) assesses the usefulness of a novel method (PBMS) to explore volunteering markets, and (2) provides insight into the Australian environmental volunteering market structure. Results indicate PBMS analysis provides unique insights into the volunteering market with respect to image, competition and suitable market segments. The environmental volunteering organisation considered in this study, Bushcare, is perceived as “outdoorsy”, “Aussie” and “supporting local community” and competes primarily with Surf Life Saving and the Rural Fire Service for volunteers.
Keywords
“My fellow Americans, people all over the world, we need to solve the climate crisis. It's not a political issue, it's a moral issue. We have everything we need to get started, with the possible exception of the will to act, that's a renewable resource. Let's renew it.” Former US Vice President and Nobel Peace Prize winner Al Gore's Academy Award Acceptance Speech 25 February 2007
Introduction
The current global environmental crisis is arguably unmatched in terms of its potential to affect the lives of individuals and the way in which societies as a whole operate. Regardless of the amount of resources dedicated to climate change and its catastrophic effect on the natural environment, ultimately social change will be the key to developing sustainable solutions to the problem. Social change, in the form of individuals’ “will to act”, involves people taking personal responsibility for their role. Being part of the solution and being willing to get involved in activities that support it is vital. One example of such individual activity is giving one's time, or volunteering, for an environmental cause.
The value of volunteering worldwide has grown exponentially in recent decades. In the United States alone, 83.9 million adults volunteer each year. This is the equivalent of over 9 million full-time employees offering their time, at a value of US$239 billion (Independent Sector, 2001). In the UK 23 million people volunteer each year, which is the equivalent of 180,000 full-time workers to the value of ₤44 billion per annum (European Volunteer Centre, 2006). In Australia, the monetary value of volunteering is estimated to be in the tens of billions of Australian dollars each year with a total of 836 million hours being contributed by 6.3 million individuals annually (Volunteering Australia, 2006).
However, despite the significant contribution of volunteers, there is a growing need for unpaid workers in order to achieve the social and environmental changes required to ensure the long-term sustainability. This is particularly the case for environmental causes. While recognised by the government and other authorities as important issues, such causes have not made it to the formal political agenda such that they attract the funding resources that other social issues do. Therefore, environmental organisations increasingly rely on changes in the social values and behaviour of individual community members that will encourage an increase in personal contributions (in this case the contribution of time) to the common good. This is the challenge of many volunteering organisations: how to get more individuals to voluntarily donate their time to their particular cause.
In recent years there has been an influx of new volunteering organisations established with the purpose of arresting the dramatic degradation of the natural environment. In Australia, one such organisation is the “Bushcare” program, an environmental program run by local councils that relies on unpaid helpers (volunteers) to help conserve and restore local natural areas. Volunteers are involved in various activities, including collecting and planting seeds, removing weeds, restoring creeks, and preserving wildlife habitats. However, in common with many other environmental agencies, Bushcare finds itself operating in competition with a growing number of other volunteering organisations for what is a limited number of volunteers.
This scenario is actually a common marketing problem: how to identify the right consumers (those individuals most likely to become involved in volunteering); design a product that will be attractive to them (that is, a volunteering experience that is rewarding and beneficial to them in some way); attract them (entice them to begin volunteering); and then keep them loyal (have them continue to volunteer over a long period of time).
The problem investigated in the present study is one commonly encountered by environmental volunteering organisations competing for volunteers. Currently there is a lack of knowledge about the social and environmental behaviour of individuals within the market. Volunteering organisations do not have the level of understanding of the market that is required to develop and implement successful competitive strategies and, in doing so, secure a sustainable future for both the volunteering organisation and the natural environment. In particular, a distinct lack of knowledge exists with respect to heterogeneity of individuals and heterogeneity of volunteering organisations. As a consequence, volunteering organisations cannot use knowledge about heterogeneity of consumers to identify those consumer segments most likely to contribute time, position themselves in the most attractive way for such segments, identify their main competitors, and differentiate their product from competitors’ products.
This study contributes to knowledge by (1) introducing the notion of heterogeneity to the field of volunteering (and nonprofit) research. While typically marketing research accounts for only one source of heterogeneity (heterogeneity of individuals), we account for two sources of heterogeneity: heterogeneity of individuals and heterogeneity of volunteering organisations. In addition, (2) we propose the use of an innovative measure of competition – perceptual competition – to gain insight into the competitive market structure in the volunteering market. Perceptual competition, as opposed to competition measured by market share, is prospective rather than retrospective. Consequently this allows organisations to take defensive managerial action even if market shares are not known – a common situation faced by volunteering organisations. Finally, the fact that two sources of heterogeneity are accounted for requires (3) the use of an innovative methodological framework, referred to as perceptions-based market segmentation (PBMS, Buchta et al., 2000; Mazanec and Strasser, 2000). PBMS can simultaneously analyse two sources of heterogeneity if certain data requirements are met. It thus provides a basis for the formulation of segmentation, positioning and competition strategies without suffering from sub-optimalities that result from the sequential processing of each of those strategic areas.
The volunteering marketplace
Marketing is emerging as the new operational paradigm for volunteering organisations. It has arguably overtaken the traditional disciplines of economics and sociology in its contribution to understanding the environment in which volunteering organisations operate (Helmig et al., 2004). Despite this, studies that provide insight for policymakers into the structure of the volunteering market are still scarce in the leading marketing journals. This information gap is even more pronounced in relation to environmental volunteering organisations, despite the widely recognised importance of the ecological crisis facing the planet. In their review of the top three nonprofit marketing journals, Helmig et al. (2004) failed to find one marketing-related study that focused specifically on environmental volunteering organisations.
Positioning
There have, however, been a limited number of marketing studies that provide a somewhat generalised picture of the environment in which volunteering organisations are operating. A voluminous amount of work has been done in the areas of branding, image and positioning in the commercial sector in recent decades (Aaker, 1997). Few, however, have extended this area of research to the volunteering sector and investigated the role of image and brand positioning for volunteering organisations.
A notable exception is Venable et al. (2005), who in a US based study extended Aaker's (1997) brand personality work to nonprofit brands. They found that stakeholders do use brand personality to differentiate between nonprofit organisations, as also happens in the commercial sector. Based on this work and that of Berry (2000) and Tapp (1996), the investigation of image within the volunteering sector can be extended by hypothesising that:
According to Keller (1993): “brand image is defined […] as perceptions about a brand as reflected by the brand associations held in memory”. Generic perceptual positions fit Keller's definition of images, except that they are not initially tied to one brand only. They are generic, and therefore associated with multiple brands. The extent to which each brand is associated with each generic position is indicative of the brand image for each volunteering organisation.
Competition
Considerable research has gone into the competitive environment of the commercial sector. Studies have included generic investigations into the phenomenon of competition (Porter, 1980) and generic categorisation of types of competitive environments (Putsis and Dhar, 1998). Others have investigated the interaction between competition and other key aspects of marketing such as positioning (Stearns et al., 1995), price (Ramaswamy et al., 1994) and advertising expenditure (Erickson, 1985). In recent times, researchers have used market simulations to evaluate and recommend optimal strategies for organisations operating in markets with varying levels of competition (Dolnicar et al., 2005).
None of these approaches, however, have been applied to investigations of the volunteering market. Traditionally, volunteering organisations have largely ignored the notion of competition, which is thought to belong more appropriately in the for-profit sector. Existing providers have often viewed new entrants to the volunteering sector as additional resources helping to achieve a common good, rather than as a competitive threat for the same limited pool of resources (Andreasen and Kotler, 2003). Helmig et al. (2004) highlighted the lack of studies in this area; in their review of marketing-related studies in leading nonprofit journals, they could not identify one study of competition within the nonprofit setting.
Based on this insight and considering the known market dynamics of the commercial sector as communicated through leading marketing journals (Gatignon et al., 1997; McAfee and McMillan, 1996), it is reasonable to assume that similar competitive pressures do exist in the volunteering market to some extent. It is hypothesised that:
Perceptual competition occurs when one consumer perceives two or more organisations as having the same set of characteristics. It is a concept that is oriented towards the future; if consumers perceive two organisations to be similar, it is possible that they may switch organisations in future. Traditional competition measures are retrospective, typically using the mere existence of competitors as an indicator or measuring actual market share based on past consumer choices.
Segmentation
Market segmentation is a well-known and commonly used concept in strategic marketing that can account for heterogeneity among consumers. Researchers use it to identify subgroups of individuals who are similar to each other with regard to some predefined criterion. Unlike studies of competition, there has been some application of segmentation techniques to the volunteering sector. For the most part this has taken the form of a priori segmentation whereby the researcher assumes to know the variable most appropriate for grouping homogenous subsets of consumers, for example age, sex, income and so on.
Alternatively, if there is no clear assumption about which criteria are best for grouping, a set of variables can be used to conduct a posteriori or post-hoc segmentation studies (Myers and Tauber, 1977; Wedel and Kamakura, 1998). Psychographic characteristics are commonly used for this purpose, an approach originally introduced by Haley (1968) in the context of benefit segmentation. Only a few studies have so far taken this approach in the study of volunteering (Ewing et al., 2002; Shelley and Polonsky, 2002), with needs and motivations used as the segmentation base.
An approach that has not been taken previously is to use consumers’ perceptions about a range of volunteering organisations, as well as their preferences, as the segmentation base. It is this approach that the authors hypothesise may represent a more effective base for segmenting the volunteering market. We hypothesise that:
Perceptions-based market segmentation
Market structure analysis provides insight into the characteristics of the market and enables managers to make three fundamental decisions: which market segment to target, which image to convey (product positioning), and how to deal with competition. While there has been a substantial amount of research within all of these areas, the interdependence of these decisions is typically not accounted for (thus implicitly assuming conditional dependence between the three components).
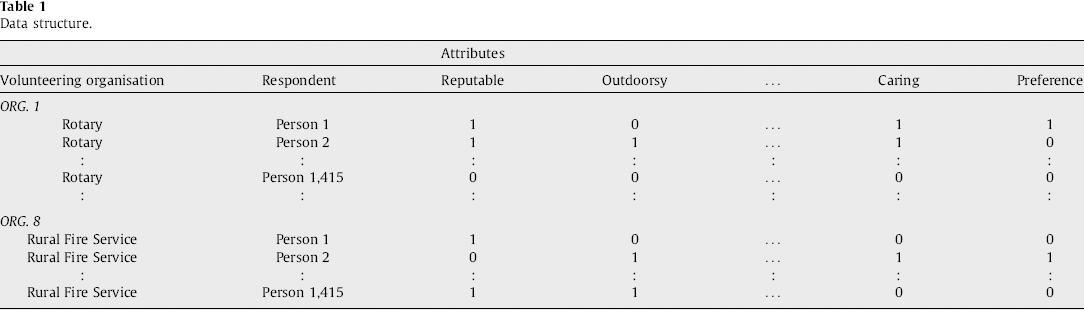
A proposal for integrating the three fundamental areas of market structure analysis (targeting, positioning and competition) forms the methodological framework for this study: PBMS. PBMS is a stepwise framework that enables simultaneous accounting for different sources of heterogeneity and in doing so provides insight into segmentation, positioning and competition. PBMS consists of three steps: (1) answer pattern compression, (2) perceptual competition analysis, and (3) segment evaluation. A three-way data set is required to conduct PBMS, meaning that each individual respondent must have assessed each object along each attribute. The three-way data structure for the present environmental volunteering study is illustrated in Table 1.
Data structure.
Data structure.
In Step 1 of PBMS analysis, respondents’ answer patterns are compressed through a partitioning algorithm. Each answer pattern is one individual's evaluation of one object along all attributes (one row in the three-way data set). This step consequently accounts for heterogeneity among respondents as well as heterogeneity in the way different objects are perceived. The actual answer pattern compression can be achieved by using any algorithm that groups vectors based on their similarity: cluster analytic procedures (Everitt et al., 2001), latent class analyses (Formann, 1984), finite mixture models (Wedel and Kamakura, 1998), or neural networks (Kohonen, 1997; Martinetz and Schulten, 1994).
The result of answer pattern compression is a number of groups of answer patterns that represent prototypical perceptions of objects, in this case, relating to volunteering organisations. For instance, one group of answer patterns could describe volunteering organisations that are caring, social and warm; another group could describe volunteering organisations that are tough and outdoorsy. We refer to these groups of answer patterns as generic perceptual positions.
By analysing the assignment frequencies of each object to each of those generic perceptual positions, it can be established whether different objects are distinctly associated with certain positions and indicate a clear positioning in individuals’ minds. Furthermore, if preferences are collected from respondents, each of the generic positions can be assessed in terms of overall preference as well as object-specific preference. This allows conclusions not only to be drawn about how individuals perceive alternative objects but also which of these perceptions are considered desirable and which are not.
In Step 2 the study uses results from Step 1 to determine the extent of perceptual competition faced by the objects. The frequency with which each of the objects was assigned to each generic position does not on its own provide insight into perceptual competition because it is possible that different people contribute to different objects being located at the same position. Pairwise contingency tables are needed to assess how frequently each individual places two or more object in the same generic position and in doing so perceives them as similar and potentially substitutable for each other. Two indicators of perceptual competition can be derived from the contingency tables: the competition coefficient for each pair of brands (sum of frequencies located at the main diagonal of the contingency table), and the Kappa-coefficient, which ranges from 0 to 1 (with a higher value denoting higher perceptual competition). Kappa-coefficients are calculated by summing the respondents who assigned two organisations to the same perceptual position and dividing the summed value by the total sample size (in this case 1415).
Finally, in Step 3 segments resulting from PBMS can be investigated and described in more detail. Numerous possible and plausible segments can be derived from the PBMS analysis. For instance, one could study the segment that currently has very weak perceptions about an object and develop communication messages to support the development of an image. Alternatively, a segment could be defined as people who view one object very favourably and view the competitors unfavourably. Targeting such a segment may strengthen loyalty of consumers with an already positive perception. Whichever segmentation approach is chosen, it is inherently accounting for positioning and competition rather than separating these strategic decisions.
Methodology
The researchers designed a questionnaire following an exploratory study that identified the key volunteering organisations in the marketplace and those attributes used by individuals to describe volunteering organisations. The questionnaire was administered during October 2006 using a quota sample from a permission-based internet panel set up and maintained to be representative of the Australian population. Respondents were invited to complete a 30-min self-completion questionnaire that was available online for four weeks, leading to a sample of 1415 respondents.
The questionnaire included a list of 18 randomly ordered attributes presented eight times – once for each organisation included in the study. The 18 attributes were honest, mainly for men, prestigious, compassionate, political, reputable, outdoorsy, upper class, loving, reliable, Aussie, popular, caring, well organised, committed, heroic, supports local community and positive influence. The eight volunteering organisations included in the study were Bushcare, Surf Life Saving, the Rural Fire Service, the State Emergency Service, Rotary, St. Vincent de Paul, P&C Associations and the Red Cross. Respondents were asked to indicate on a binary scale which of the attributes they thought described that organisation.
In addition, respondents were asked to indicate which of the eight volunteering organisations they most preferred. This was done be asking respondents: “If you had to give unpaid help to one of the following organisations, which one would you choose?” Respondents were also asked to answer a number of demographic questions for the purpose of profiling segments. To measure past volunteering behaviour, respondents indicated whether or not they had volunteered in the past 12 months. To measure behavioural intention, respondents indicated on a Juster scale (Juster, 1966) their intentions to volunteer in the next three months.
Measures and data
Table 1 illustrates the three-way data structure of the collected data set for a subset of two organisations and three attributes. Note that this differs from a standard two-way data set in that every respondent is included in the data set eight times, once for each of the organisations measured. Therefore, for PBMS analysis, the data set includes 11,320 rows of data (1415 respondents times eight organisations). A “0” value indicates that that respondent did not assign that attribute to the particular organisation, a “1” value indicates that that respondent did assign that attribute to the particular organisation. In addition, the most preferred volunteering organisation for each respondent is coded as a “1” in a separate preference variable.
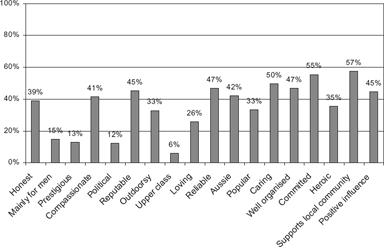
Fig. 1 shows how often each attribute was assigned across all volunteering organisations contained in the questionnaire. Respondents associated “honest” with volunteering organisations in 39% of all possible cases. They thought that the attributes “supports local community”, “committed” and “caring” applied most often, while the attributes “upper class”, “political” and “prestigious” applied to these organisations least often. This graph demonstrates that volunteering organisations are not perceived identically. If all volunteering organisations were perceived as having the same combination of image attributes, percentage values for every image belief would either be 100 (all people assigning a particular image belief to all organisations), or zero (nobody assigning a particular image belief to any of the organisations).
Aggregate perception values.
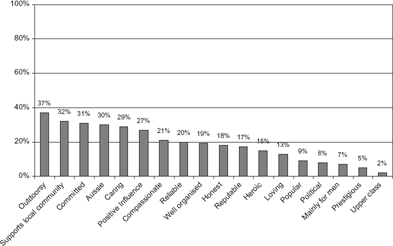
However, while Fig. 1 confirms that heterogeneity exists at the organisational level, it does not indicate whether heterogeneity exists at the individual level. That is, it does not show whether different individuals have different image perceptions of the same volunteering organisation. Answering this question requires an analysis of the percentage of image beliefs for one organisation only. Fig. 1 shows how often respondents chose each image belief to describe Bushcare.
Fig. 2 demonstrates that different people have different image perceptions of Bushcare. For example, 37% of the sample thought the image belief “outdoorsy” applied to Bushcare, 63% did not. Similarly, 32% of the sample thought that the image belief “supports local community” applied to Bushcare, while 68% did not.
Percentage of image attributes for Bushcare.
Importantly, this illustrates that heterogeneity exists in image beliefs towards volunteering organisations and that, as a consequence, ignoring heterogeneity is likely to lead to incorrect conclusions about the volunteering market. If image beliefs regarding Bushcare were the same for all individuals, percentage values for every image belief would be close to 100 (all people assigning a particular image belief to Bushcare) or zero (nobody assigning a particular image belief to Bushcare).
PBMS was conducted. We report results by the stages of PBMS as outlined above.
Step 1: Answer pattern compression
The partitioning method used for this study is a self-organising neural network algorithm referred to as topology representing network (TRN, Martinetz and Schulten, 1994). We chose this algorithm because a Monte Carlo simulation of alternative partitioning algorithms on a set of artificial data sets demonstrated that TRNs reproduced the data structure most successfully (Buchta et al., 1997).
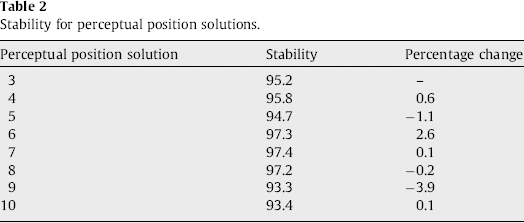
Before partitioning answer patterns, the authors determined the number of generic perceptual positions. Stability of the partitioning solution was used to select the most suitable number of positions, where stability is defined as pairs of answer patterns being assigned to the same position across repeated computations. Fifty repeated calculations of TRN were conducted for each number of positions ranging from three to ten and improvement in stability with increasing number of positions was assessed. Table 2 provides the stability values for all numbers of positions. As can be seen, a jump in stability occurs when the number of positions is increased from five to six (shown in bold).
Stability for perceptual position solutions.
Stability for perceptual position solutions.
After completing a stability analysis, the authors computed a final run of the TRN algorithm, identifying six generic perceptual positions for environmental volunteering organisations. These positions can be interpreted by comparing the average assignment of each attribute to the position and the average assignment of each attribute to all environmental volunteering organisations. Strong deviations from the total average indicate distinct perceptions and can thus be considered marker variables for interpretation. To identify these marker variables for each position, Figs. 3 and 4 provide the average assignment within the position (grey columns) and the average assignment across all environmental organisations (dark horizontal lines).
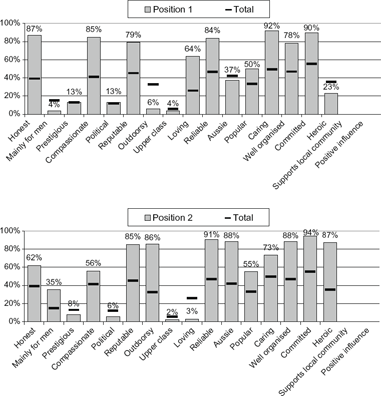
Generic perceptual positions 1 and 2.
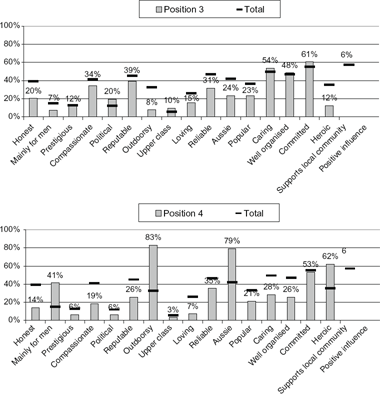
Generic perceptual positions 3 and 4.
Fig. 3 illustrates generic perceptual position #1 and is characterised by particularly high levels of agreement with the attributes “caring”, “committed”, “honest” and “compassionate”. This position also rates high on other positive attributes, such as “reliable”, “supports local community” and “positive influence”. It rates low on the attributes “upper class”, “mainly for men” and “outdoorsy”. Overall this position is characterised by attributes that are softer and more altruistic and humanitarian in nature, and has thus been labelled the “do-gooder” position. Generic perceptual position #1 contains 1813 perceptions, which amounts to 16% of the data.
Generic perceptual position #2 contains 1394 perceptions (12% of the data) and rates higher than average on a number of attributes. The most highly rated attributes include the more practical descriptors, such as “committed”, “reliable”, “supports local community” and “well organised”. It also rates higher than average on some hero-type attributes, including “heroic”, “Aussie” and “outdoorsy” and on some of the softer attributes, such as “caring” and “compassionate”. This position is characterised by a broad range of attributes and has such been labelled the “all rounder” position.
Generic perceptual position #3 rates most highly on the attribute “supports local community” and rates higher than average on three other attributes – “committed”, “caring” and “well organised”. These attributes are the more rational and less emotional attributes and point to a perceptual position that is characterised by good management and a focus on improving and providing services for the local area. For this reason, perceptual position #3 has been labelled the “local community” position. It includes 1931 perceptions, or 17% of the data.
Generic perceptual position #4 is characterised by five distinct marker variables – “outdoorsy”, “Aussie”, “supports local community”, “heroic” and “mainly for men” – and has thus been labelled the “adventurer” position. In addition, this position rates lower than the sample average for all other attributes. It contains 1257 perceptions (11% of the data) and is graphically presented in Fig. 4.
Generic perceptual position #5 is characterised by the fact that agreement levels for all attributes are very high. For this reason it has been labelled the “everything applies” position (1333 perceptions, 11% of the data). Organisations located at this position are known by individuals within the community and associated with a broad range of attributes; however, they lack a distinctive image that differentiates them from other volunteering organisations. Organisations finding themselves located in this position need to refine their image to more accurately reflect the specific values of the organisation and the type of volunteering experience they offer. By doing this, they are more likely to attract volunteers who are a good match for their particular organisation and who will continue to volunteer for longer periods of time.
In contrast, generic perceptual position #6 consists of 3592 perceptions or 32% of the data, and has been labelled “nothing applies” because agreement with each attribute is lower than average. This means that organisations located at this position do not evoke many associations for respondents. This is illustrated by the fact that for every single attribute, agreement levels are well below the sample average. This could be because the respondent has never heard of the organisation before, or if they have, they are not familiar enough with the organisation to nominate any of the attributes as describing it. Generic image position #6 also contains all individuals who selected the “never heard of it before” answer option. These responses, also known as “zero vectors”, cannot be excluded from the analysis because of the block design of the data. This design is necessary to allow for all three dimensions of analysis.
This is not problematic, however, because the PBMS procedure enables the formation of a “zero cluster” (in this case, generic image position #6). As all of the zero vectors are contained within this zero cluster, they have no confounding effect on the other generic image positions identified.
Note that respondents were not forced to trade-off image beliefs in relation to organisations. They were able to choose as many or as few image attributes to describe an organisation as they liked. When partitioning algorithms are applied to data of this kind, it is not uncommon for the result to include two generic image positions that “collect” all responses that either (1) assign no or very few image attributes to an organisation, or (2) assign all or almost all of the image attributes to an organisation (Buchta et al., 2000). Consequently, these generic “above-average” and “below-average” image positions (as described in generic image positions #5 and #6) need to be analysed with care as they may simply represent individual response styles and are not interpreted in detail in the following analyses.
The segmentation and positioning analysis conducted so far has demonstrated that distinct generic perceptual positions exist within the volunteering market. Therefore hypothesis H1 – that generic perceptual positions exist in the volunteering marketplace – cannot be rejected.
Each of the six generic perceptual positions can be described using the attribute profiles above. They represent judgements of volunteering organisations by the 1415 respondents. The proportion of volunteering organisations perceived in the way captured by these generic perceptual positions is determined by revealing the organisations it related to for all answer patterns assigned to each generic position. The result is provided in Table 3, which contains the absolute number of answer patterns assigned to each position as well as the percentage of each organisation at each position. In addition, the table provides the number of preferences at each generic position.
Aggregate generic perceptual positions.
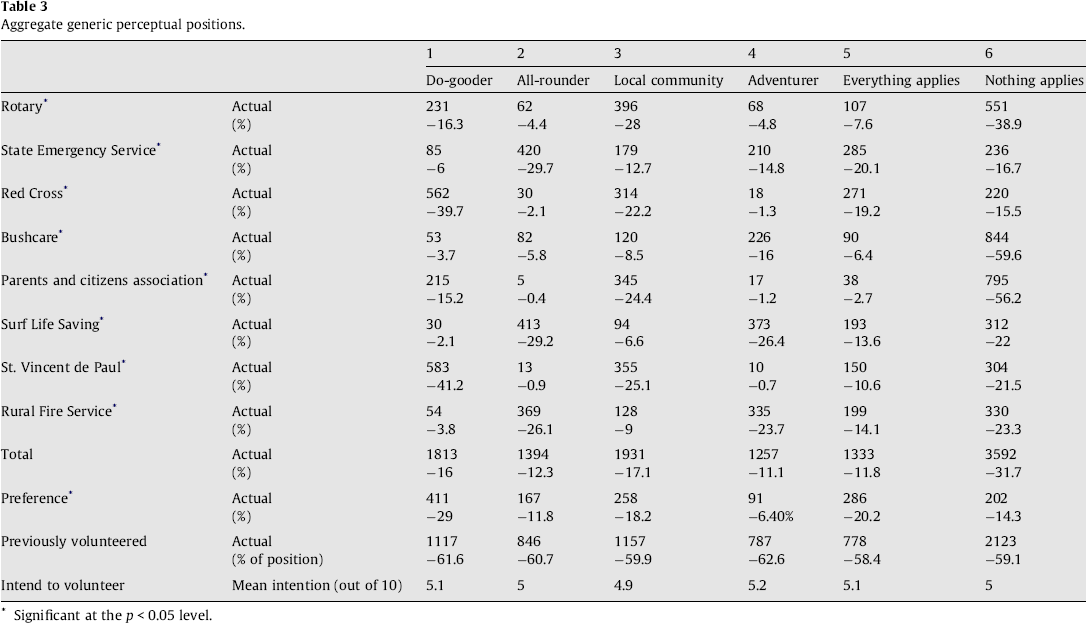
Significant at the p < 0.05 level.
Table 3 presents some interesting aggregate insights into the volunteering sector. Firstly, generic perceptual positions of volunteering organisations differ in their level of preference. This information is interesting to volunteering managers because preferred perceptual positions have better prospects for successful marketing campaigns than non-preferred positions. On this basis, and taking an aggregate view, it could be concluded that perceptual position #3 (the “do-gooder” position) would provide a solid basis for a general marketing strategy, not accounting for consumer heterogeneity.
Secondly, the number of perceptions at each position varies. Position #6 (the “nothing applies” position) includes the highest number of perceptions (32%), while position four (the “adventurer” position) has the lowest number of perceptions (11%). Information about the size of each position also indicates the usefulness of the position for strategic targeting. Positions with a high number of perceptions indicate that the position has a very specific and commonly agreed upon profile and may represent a good target for marketing activity. Notably, Bushcare received the largest number of respondents who allocate it to the “nothing applies” segment (844 individuals or almost 60% of the sample). Even the organisation with the smallest number of allocations to this position, the Red Cross (with 220 allocations), still has over 15% of respondents saying that they really could not associate any of the attributes with the organisation. This implies that while distinctly different perceptual positions do exist within the volunteering marketplace, there is still a large portion of the general public that is unfamiliar with any of the organisations measured here. The particularly high “nothing applies” level for Bushcare means that it needs to start building awareness of the organisation amongst the general public, as well as developing a brand image that clearly conveys its values and contributions to society and the environment.
Thirdly, the perceptual positions vary in the proportion of them made up by the different volunteering organisations. Most of the perceptual positions are dominated by two or three organisations. For example, St. Vincent de Paul (31%) and the Red Cross (31%) combined comprise over 60% of perceptions in the “do-gooder” position, while Surf Life Saving (30%), Rural Fire Service (27%) and Bushcare (18%) represent three quarters of the perceptions in the “adventurer” position (this example is graphically illustrated by the pie chart in Fig. 5).
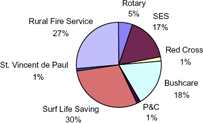
Organisations allocated to the “adventurer” position.
In the case of Bushcare, its perceptual allocations are distributed across all six of the generic positions identified. Of the four positions identified that can safely be interpreted as generic perceptual positions, the highest number of allocations are in position #4, the “adventurer” position (226 allocations, or 16% of respondents). The next most common placement for Bushcare is position #3 (the “local community” position). In position #2 (the “all rounder” position), Bushcare has 82 allocations. Finally, the position in which Bushcare receives the lowest number of allocations is the “do-gooder” position. Intuitively, it seems reasonable to assume that St. Vincent de Paul (583 allocations) and the Red Cross (562 allocations) dominate this position.
It is important to note, however, that the proportion of answer patterns at a position is not necessarily an indication of competition. Given that each respondent has provided eight different perceptions (one per volunteering organisation measured), it is possible that the perceptions comprising the different pie pieces were contributed by entirely different respondents. For example, an initial examination of the “do-gooders” position may suggest that, as they have equally large pieces of the pie, St. Vincent de Paul and Red Cross organisations are both seen at this position and are therefore interchangeable in the minds of potential volunteers. This would only be the case if the individuals who placed St. Vincent de Paul in this position were the same individuals who placed the Red Cross in the “do-gooder” perceptual position. If, on the other hand, the individuals who placed St. Vincent de Paul in the “do-gooder” perceptual position were an entirely different group to those who placed the Red Cross in the “do-gooder” perceptual position, then concluding that these two organisations are in competition with each other would be incorrect.
This analysis highlights an unequal distribution of perceptions of organisations between positions. Therefore, hypothesis H2 (that the distribution of volunteering organisations across generic perceptual positions is not equal, thus indicating the existence of distinct volunteering organisation brand images) cannot be rejected.
The analysis so far has revealed the generic perceptual positions that exist in the market and how Bushcare is considered in relation to these. However, this information is of limited value if preference levels for each organisation at each position are not known. In this study “preference” is defined as the organisation (out of the eight included) that the individual would most prefer to volunteer for (this, after all, is the key measure of importance to many volunteering organisations struggling to attract sufficient volunteers).
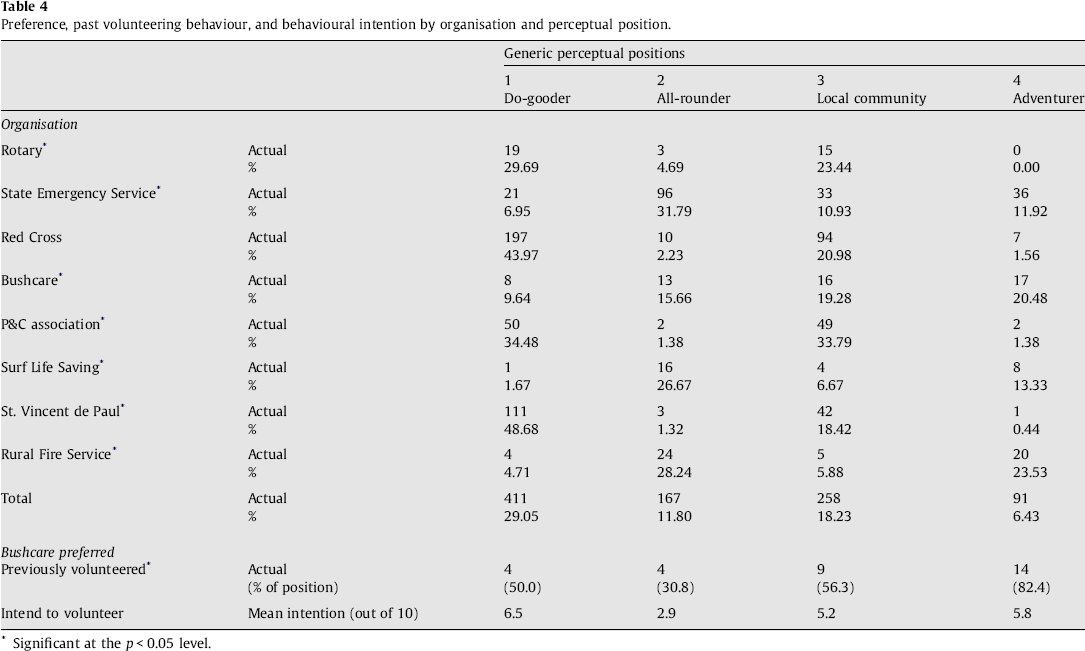
General levels of preference for each perceptual position are known but the individual preference levels for each organisation at each position are not known. Table 4 illustrates the levels of preference for each organisation at each position. Two measures are presented here. Firstly, the actual number of preferences for each organisation allocated to each position is given (rows labelled “actual”). The problem with these actual numbers, however, is that they are obviously far more favourable in all positions for those organisations that received a large number of preferences to start with. In part, this could be due to the lack of awareness of some of the organisations, as previously discussed. By default this means people are less likely to choose them as their preferred organisation. To overcome this, a second row of data is also presented for each organisation. This shows the percentage of the total preferences for that organisation that have been allocated to the particular position (indicated by the percentage rows).
Preference, past volunteering behaviour, and behavioural intention by organisation and perceptual position.
Significant at the p < 0.05 level.
A total of 83 people stated that they would most prefer to volunteer for Bushcare. One in five people (approximately 20%) who gave their preference to Bushcare placed them in position #6 (the “adventurer” position). This is actually the second highest percentage for this position and significantly higher than the percentages for Surf Life Saving or the State Emergency Service. This result may be driven by a perception that the job itself is either too physically demanding or otherwise too inconvenient, even though every beach-loving Australian would like the Surf Life Savers to continue doing their extremely valuable work. For this reason the preference levels for these types of “danger” organisations when placed in the “adventurer” position are relatively low. However, this does not seem to be the case for Bushcare in the “adventurer” position, probably because although it is outdoors and can be physical, it is not considered a particularly dangerous job and is therefore far more achievable in the eyes of everyday individuals.
Table 4 shows that different organisations have different levels of preference at different positions. This is perhaps most clearly demonstrated by the preference distribution for St. Vincent de Paul, whereby almost half (49%) of those who indicated that it was their preferred organisation saw it as a “do-gooder” organisation, while only 1% of those who nominated it as their preferred organisation saw it as an “all rounder” organisation.
However, behavioural intention and past behaviour do not mirror these findings. At the aggregate level, no significant differences are found in past volunteering behaviour or in the intention to volunteer between different perceptual positions (presented in last two rows of Table 3). This indicates that volunteering organisations located at each of the generic perceptual positions have not (at aggregate level) received more time donations in the past and that behavioural intentions are not higher for one of these positions. This means that accounting for organisational heterogeneity alone is insufficient to understand consumer behaviour.
If, however, we investigate preference for specific organisations being located at particular generic image positions (and in doing so account for both organisational and consumer heterogeneity), the differences in past behaviour are significant, X2(5, 83)=11.182, p<0.05. These significant results for Bushcare are presented in the second last row of Table 4. For Bushcare over the past 12 months, position #6 has attracted significantly more time donations from people who prefer Bushcare than the other positions have. This is not, however, the case for behavioural intentions (shown in the last row of Table 4), where results are insignificant. This insignificance could be partly due to the small sample sizes available for testing. We would expect that, while hypothesis three is rejected for the aggregate data, it should hold for single organisations that are preferred by consumers.
While the analysis so far has provided insight into the generic perceptual positions within the volunteering sector, it has not offered any conclusions about the perceptual competition between volunteering organisations, nor the competitive position of Bushcare. Insight in terms of perceptual competition lies not in the number of times organisations are assigned to the same position, but how many times one individual respondent assigns the same attributes to two or more organisations. Only where one individual respondent has the same perception of two different organisations could these organisations then be considered as being in perceptual competition with each other, and thus, potential substitutes.
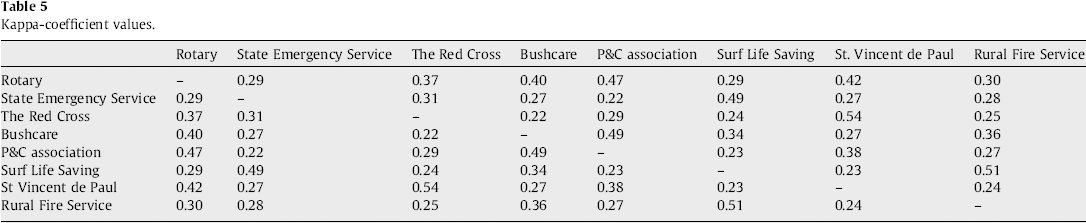
Kappa-coefficient values are provided in Table 5. The Kappa-coefficients range from 0 to 1, with values close to 1 indicating stronger levels of competition between the two organisations. Accordingly, the data in Table 5 indicates that St. Vincent de Paul is high in perceptual competition with the Red Cross, and the Rural Fire Service encounters high perceptual competition with Surf Life Saving (coefficients are both above 0.5 indicating that over 50% of respondents place the two organisations in the same perceptual position). In the case of Bushcare, the data indicates that it is high in perceptual competition with P&C Associations (almost half of respondents place them in the same perceptual position – coefficient is 0.49) and moderately high in competition with Rotary (coefficient is 0.40). On the other hand, Bushcare could be said to have low perceptual competition with the Red Cross with a coefficient of 0.22 (only slightly more than 22% of respondents place them in the same perceptual position). The other three organisations measured – St. Vincent de Paul, the SES and Surf Life Saving – could all be interpreted as being moderately competitive with Bushcare (coefficients ranging from 0.27 to 0.34).
Kappa-coefficient values.
Kappa-coefficient values.
The Kappa-coefficients add an interesting perspective to the question of competition and allow two key conclusions to be drawn. Firstly, if only the frequency counts are considered it could be concluded that Bushcare competes primarily with Surf Life Saving and the SES, because these are the organisations most prevalent in the positions where Bushcare is most commonly found. However, the Kappa-coefficients indicate that it is actually different individuals that place these organisations in the same position. That is, the people who place Bushcare in the “adventurer” position are different from those who place Surf Life Saving and the Rural Fire Service in the “adventurer” position. Therefore, hypothesis H4 (individuals differ in their perceptions of different volunteering organisations) cannot be rejected.
Secondly, the coefficients in Table 5 indicate that Bushcare is reasonably susceptible to substitution because it has two Kappa-coefficients that are above 0.4. This analysis confirms that consumers do demonstrate perceptual competition between volunteering organisations. Therefore, hypotheses H5 (perceptual competition exists between volunteering organisations) cannot be rejected.
The next step in practically using the information presented so far relies on managers of volunteering organisations being able to identify those individuals most likely to become involved in their particular cause. In this way, they are able to develop marketing messages that are meaningful and motivating for their potential volunteers and that will result in attracting them to the organisation in question. For this, information is required on the individuals that prefer Bushcare at different positions to assess whether they do differ significantly from each other.
A series of cross-tabulations indicates that those individuals who nominate Bushcare as their preferred organisation at different perceptual positions do differ in terms of their personal characteristics. Results are presented below. It should be noted that the absolute number of respondents who preferred Bushcare over all other volunteering organisations included in this study at the four generic perceptual positions of particular interest is low (54). Segment profiles from this data set are therefore presented mainly to illustrate one possible approach to deriving segments from the PBMS framework.
Results indicate that there are differences between those people who prefer Bushcare in different perceptual positions. For example, those who prefer Bushcare at position #1 (the “do-gooder” position) are likely to be female (75%), aged between 18 and 35 (72%) and either married or living with a partner (50%). They are most likely to be employed part-time (38%) and earn less than $40,000 per annum (80%).
On the other hand, those people who prefer Bushcare at the “adventurer” position are likely to be more balanced between male and female (41% and 59%, respectively), and have a more even spread across the age groups. They are most likely to be single (35%), or if they are with a partner, be married (also 35%). They are unlikely to have children (77% have no children) and are the group most likely to be employed full-time (65%). Bushcare can use this information to target this particular group of individuals preferring Bushcare and assigning them to the “adventurer” position. Firstly, it can be used to identify the best communication channels to use, for example the fact that they are likely to be employed full-time means that Bushcare could communicate and advertise through professional or labour union publications. This information can also be used to design appropriate messages, in this case messages associated with the desired positioning – the “adventurer” position – would be most effective as this is where individuals’ preference is likely to lie. Therefore, hypothesis H6 (individuals who prefer different volunteering organisations differ in their personal characteristics) cannot be rejected.
Conclusions and limitations
This study addresses a key social issue facing many societies in the 21st century: how to promote social change by encouraging individuals to take on environmentally responsible behaviours (in this case, environmental volunteering) to ensure long-term ecological sustainability. It does this by providing insight into the structure of the volunteering market, which gives environmental volunteering managers tools to identify and target those most likely to become involved in their cause.
Results add to current knowledge by extending the investigations of the volunteering market to include two sources of heterogeneity: heterogeneity of individuals and heterogeneity of volunteering organisations. This approach is an extension of typical heterogeneity studies in marketing research (where consumer heterogeneity alone is accounted for), and consequently requires the use of a method that is able to simultaneously analyse two sources of heterogeneity. A recently proposed method that achieves this aim (PBMS) is used for this purpose. In addition, the study introduces the concept of perceptual competition to the volunteering market and illustrates the value of this concept for gaining insight into competitive market structure in advance, rather than analysing competition after the consumer purchase (in this case the decision to volunteer).
The new insights resulting from this study are multiple. Firstly, distinct generic perceptual positions exist in the volunteering marketplace and the distribution of volunteering organisations across these positions is not equal, indicating the existence of distinct volunteering brand images. In addition, preference levels differ for volunteering organisations located at these different generic perceptual positions, while no significant difference could be detected for past behaviour and behavioural intentions at the aggregate level. At the disaggregate level (preferred assignments of one organisation to generic positions) results were mixed but would have to be tested in a follow-up study due to sample size restrictions. In relation to the competitive market structure, findings indicate that differences exist between individuals in the way they perceive volunteering organisations, and that perceptual competition also exists between volunteering organisations. The study also found differences between segments of individuals who prefer different volunteering organisations in terms of their personal characteristics.
A number of key findings that can readily be applied by policy makers and volunteering managers have emerged from this study. Firstly, the large total number of allocations to the “noting applies” position (32% of respondents, and the position that receives by far the highest number of assignments) sends a clear message to the volunteering sector in general. Despite the fact that distinct perceptual positions do exist in the volunteering sector, there is a large portion of the general public that does not have a clear perception of volunteering organisations. This represents an opportunity for volunteering brand managers to build a strong, clear and distinct brand when others are failing to do so.
More specifically for Bushcare, the insights from this study will allow them to make more informed strategic decisions in relation to their marketing strategy. It provides the generic perceptual positions of volunteering organisations so that Bushcare knows how it is perceived by individuals compared to other organisations (and by default, how it is not perceived). It also provides information on the strength and clarity of the current position of the Bushcare organisation.
This study highlights the fact that perceptual competition does exist amongst individuals and should reinforce the necessity of a competitive mindset to volunteering organisations when developing strategic plans. Bushcare's key competitors currently are the P&C Associations, which compete in the “none apply” position, and Surf Life Saving, the Rural Fire Service and the SES, which compete in the “adventurer” position. The key to developing a positioning strategy, however, lies in the distribution of the preferences for Bushcare, which indicate that preference levels for Bushcare in this position are higher in terms of percentage of total preferences, despite the fact that the other “adventurer” organisations are currently stronger in that position. This means that the people who prefer Bushcare are most likely to view them in this “adventurer” position than in the other positions. Therefore, a solid basis for Bushcare's marketing strategy would be to position itself in the “adventurer” position, but in fact gain a competitive advantage by being far more accessible to the general public than any of the other organisations placed there – all of whom seem to be characterised by danger-type qualities that effectively alienate them from the general public and result in reduced preference levels.
Sample size is a limitation of this study. In general the sample size is insufficient to allow detailed analysis of preference patterns by generic perceptual position for some organisations and limits the conclusions that can be drawn regarding past behaviour and behavioural intentions for single organisations in their most preferred perceptual positions. In addition, the results of this study focus on one type of environmental volunteering organisation in one particular country. While we expect that testing the same hypotheses for other volunteering organisations in other countries will lead to the same findings, the detailed generic perceptual positions, competitive situation and segments will differ in countries where other organisations compete for volunteers. Future research could add further insight into the competitive structure of volunteering markets by extending this research to other international markets, and to include other types of volunteering organisations.
Footnotes
Acknowledgements
This research is supported by the Australian Research Council through the Linkage Grant Scheme (LP0453682) and our industry partner, Bushcare Wollongong, a division of Wollongong City Council. We would particularly like to thank Paul Formosa, Natural Areas Coordinator for Wollongong City Council, for his support and assistance with this project.