
Abstract
We analyse the purchasing of brands at both regular and promotional price over time. The goal is to better understand the extent of consumer deal-proneness. Our analysis shows most consumers buy brands on promotion at least some of the time, and the tendency to buy on promotion relates mostly to how much promotion is available in a category, suggesting little innate deal-proneness. The extent of promotion can be so high that as many as half of all brand buyers buy the brand solely when it is on promotion. However, this amount of on-deal buying is only very slightly higher than would be expected given the amount of promotion available. We find few buyers buy only on promotion. Promotion buyers of a particular brand also buy other brands on and off promotion more or less in line with the market share those other brands have at regular and promotional price. The three main implications are: (1) brand loyalty is still an important aspect of purchase, (2) a brand's normal-price buyers are a major source of its volume from price promotions, and (3) there is only a small effect of deal-proneness on promotion buying over and above that of promotion prevalence in a category.
Introduction
Price promotions 1 are a very expensive activity for consumer packaged goods marketers. Between 50% to 60% of CPG firms’ marketing budgets is reportedly spent on price promotions (Bolton et al., 2010, Nielsen, 2009). Marketers, finance directors, as well as academics worry that costly price promotions have no positive impact on the brand long-term (Jones, 1990; Nijs et al., 2001).
We use the terms ‘price promotion’ and ‘deal’ interchangeably, meaning a temporary offer involving a lower price or extra value to consumers.
Extensive literature on the topic generally agrees that price promotion produces a short-term spike in sales that then return to normal when the promotion finishes (e.g. Dawes, 2004, Drechsler et al., 2017, Totten and Block, 1994). Furthermore, some studies have suggested a possibility that price promotions have undue appeal to only a portion of buyers – a promotion-buying or deal-prone buyer segment (Lichtenstein et al., 1995; Webster, 1965). A deal-prone buyer is defined as having a high tendency to buy brands on promotion, over and above the extent of price promotion in the category (Webster, 1965). Deal-proneness also implies a tendency to switch between brands to take advantage of deals (Dodson et al., 1978).
Aside from marketer's concern about expense and lack of positive long-term impact, there is also worry that price promotions may train consumers to become deal prone, moving their loyalty from brands to the deal itself (e.g. Mela et al., 1997). That concern provides the central motivation for this research. The study aims to understand how the overall prevalence of deals or price promotions in a category is related to how many households buy brands only on promotion/deal, only at normal price, or both over a one-year time period. The findings will also help to clarify the influence of brand loyalty in promotion-intense categories.
The concept of the deal-prone buyer has a long history. Deal-proneness has been generally investigated as a consumer trait that is linked to demographics, resource constraints (e.g. ability to travel), and category usage rate (Blattberg et al., 1978). Other studies have sought to extend the list of traits to psychographic and shopping-related variables to characterize more and less deal-prone consumer segments (Martînez and Montaner, 2006; Palazon and Delgado-Ballester, 2011). But Webster (1965) identified early on that deal proneness is complex to measure, because it is confounded by the amount of deals offered by brands. Moreover, deal-proneness will be influenced by retailer decisions. That is, if consumers tend to buy at retailers that constantly run promotions, a large proportion of their purchases will be made on-promotion. But they may not be necessarily deal-prone. Indeed, Pechtl (2004) found nearly 50% of consumers were not deal-prone and that deal-proneness had only a weak link with shopping at either an Every Day Low Price (EDLP) or Hi-Low price retailer. Furthermore, the study showed self-identified deal-prone shoppers actually bought less than 20% of their grocery items on deal.
Another stream of research has examined the extent to which households might become more deal-prone or promotion-sensitive over time. To this end, a number of studies have sought to identify whether a household's purchase history alters its current purchase behaviour. For example, Hardie et al. (1993) found evidence that past purchases for a brand on-deal made households slightly less likely to buy the brand again at regular price. Mela et al. (1998) found increased incidence of promotions in a category resulted in slightly less frequent purchases, with slightly more quantity bought each time. The theoretical explanation for these phenomena invoke the concept of a reference price (Mazumdar et al., 2005), which means consumers remember and are influenced by previous prices paid. If a previous purchase was made at a reduced price, it is believed that the consumer's reference price for the brand is lowered. Consumers are thought to be resistant to pay more than their reference price, in line with loss aversion (Bell and Lattin, 2000; Klapper et al., 2005). Kalyanaram and Winer (1995) support this view, concluding “reference prices have a consistent and significant impact on consumer demand” (1995, G 163). If a shopper's reference price is lowered, logically this should induce them to seek deals, hence become more deal-prone.
Therefore, there is some evidence that deal-proneness is not necessarily just a fixed trait arising from household variables (as per Blattberg et al., 1978), but something that may be affected by brands’ and retailers’ promotion activities. The increasing incidence (Bogomolova et al., 2015), and prevalence of promotions for brands in packaged goods markets (Nielsen, 2009) should arguably make for a large, and growing, deal-prone segment. However - is there really a large proportion of shoppers who are quite deal-prone, that is, purposively selecting only brands that are price-promoted at the time? If there is, it implies brand loyalty should be declining, with more consumers readily swapping between any brands to take advantage of price deals. Yet multiple studies have found considerable stability in brand loyalty over time (Dawes et al., 2015; Johnson, 1984). Furthermore, whilst it seems reasonable that repetitive promotions can train consumers to buy on deal (Mela et al., 1997), several studies show little effect of leading brands regularly running temporary deals or promotions. Ehrenberg et al. (1994) found a high level of stability in an analysis of repeat-purchasing before and after promotions. Dekimpe et al. (1998) found brand sales to be predominantly stationary in the medium term in markets characterized by frequent promotion activity.
The literature therefore portrays a mixed picture on the issue of how promotions might exacerbate deal (or promotion) proneness. Some evidence shows that price promotions should erode reference prices, heightening deal-proneness. However, several studies show little effect in terms of brand sales or repeat-purchase. To address this somewhat confusing picture, the paper presents an empirical analysis of sixteen categories of packaged consumer goods with different levels of price promotion, examining how consumers purchase brands at both promotion and regular price. The intended contribution is to establish if we can observe any empirical generalisations across a diverse set of packaged consumer goods categories, concerning how many households buy categories and brands on promotion, compared with the overall amount of promotion occurring. The time period of the analyses is one year. The study then goes on to examine how buyers of brands at regular and promotional price buy other brands at regular and promotional price, to establish how much, if any, partitioning there is between regular and promotional price buying. This cross-purchase analysis in turn provides a measure of how much consumers seek out promotions, compared with simply taking advantage of promotions because they are available.
Method
The data consisted of purchasing records in two different time periods for Fast Moving Consumer Goods (FMCG) categories kindly provided by Kantar Worldpanel from its UK consumer panel. The panel comprises a demographically balanced sample of over 15,000 households, who scan their grocery purchases (Kantar, 2015). We use eleven product categories from 2007, and six from 2014. One category, Fabric Care, appears in both time periods. We also use data from different time periods in an effort to produce generalisable results across categories and time. We use categories that vary greatly in average purchase frequency, as shown in Table 1. Figures for purchase frequency were not able to be extracted for three categories (the data is provided via a database-like format that occasionally precludes certain calculations).
Category buying at regular and promotion price in a year.
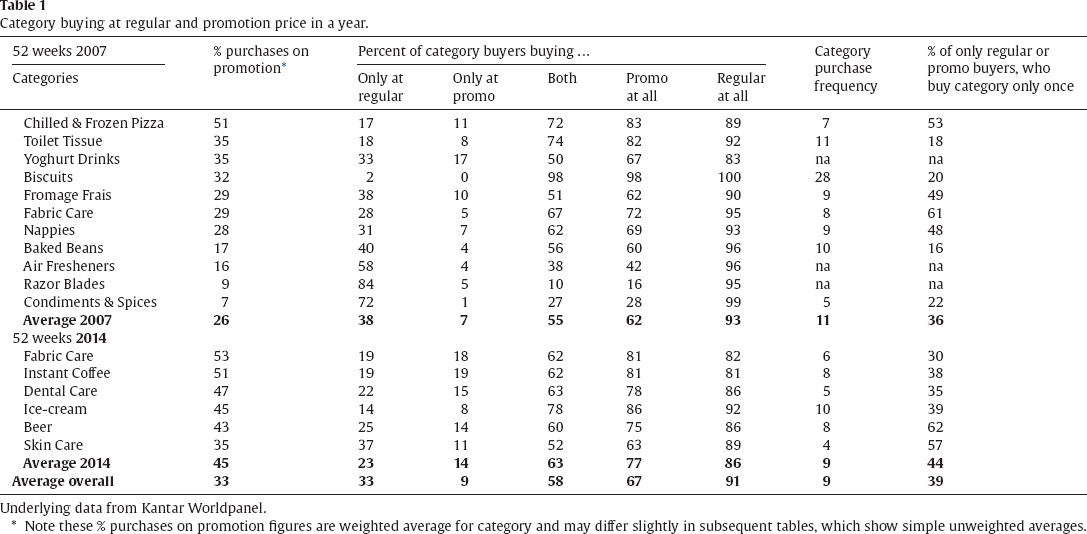
Category buying at regular and promotion price in a year.
Underlying data from Kantar Worldpanel.
Note these % purchases on promotion figures are weighted average for category and may differ slightly in subsequent tables, which show simple unweighted averages.
Our choice of categories was based on data availability. The categories comprise only a sample of all consumer goods, but include food, beverage, cleaning, and personal care. Our analysis is of purchase-based metrics, so promotion incidence is measured by percentage of total sales made on deal, not weeks on deal nor depth of discount. Purchases were classified as either made at regular price, or on price-related promotion (cut price, extra volume free, buy one get one free etc.). Share of purchases and penetrations (% of households buying) were calculated for regular price and promotional price for each category and the five largest brands in each category. Penetrations were broken down into those who only bought at regular price, those who only bought at promotional price and those who bought at both in the year. Hence penetration at promotional price is the sum of penetration at promotional price only, and at both. We also calculated the proportion of shoppers who only bought at regular or promotional price that were one-time category buyers - to identify the extent that light category buying is related to promotion-only or regular-only buying.
Next, we conducted purchase duplication analysis (Dawes, 2016; Tanusondjaja et al., 2016) of the brands in each category, with each brand split into regular and promotion price purchases. The duplication analysis method calculates the proportion of those buying brand A that also buy other brands B, C, D and so on in a time period. The method is versatile, having been principally applied to brands (Ehrenberg, 2000), but also in other contexts such as the cross-purchasing of retailers (Dawes and Nenycz-Thiel, 2014), and buying of wine across different price tiers (Romaniuk and Dawes, 2005).
There is a great diversity in the incidence of price promotion across the categories, from 53% of purchase occasions in Fabric Care (2014), 51% for Pizza (2007) and Instant Coffee (2014), to only 7% in condiments (Table 1, column 2). Biscuits appear to be quite different to the other categories with very low incidence of buying only promotion, or only at regular price – this is likely due to its very high average purchase frequency of 28 occasions per year.
Apart from the categories with low incidence of promotion – Razor Blades and Condiments & Spices, the majority of category buyers buy on promotion at some time during the year. We see that the figures are generally above 50% in the ‘Promo at all’ column. However, very few (less than 10% of category buyers on average, and at most 19%, see ‘Only at Promo’ column) buy the category only when via a price promotion, even in the very heavily promoted categories. Almost everybody – around 90% who buy a category – buy a brand at regular price at some time. This is quite apparent in the ‘Regular at all’ column with averages of 93% and 86%. Therefore, it appears there is only a fairly small proportion of shoppers who will only buy a category when they can take advantage of a price promotion. There is never more than around 20% of buyers who only buy the category on promotion, and the averages across the categories for the two years are 7% and 9%.
The question arises as to how much of the incidence of buying only on promotion (or only at regular price) in a year pertains to the prevalence of very light buyers, who buy the category only once in the year. In Table 1 we include the proportion of households that bought only at regular price, or only on promotion – that are also one-time category buyers. Overall, this proportion is 39%. This indicates that a reasonable proportion (but a minority) of promotion-only buying occurs simply because the shopper bought the category only once. Also, the overall extent of promotions in the category will still influence whether a one-time buyer buys on promotion or not, when they do happen to buy the category.
We can also make some observations about how increases in overall promotion prevalence lead to increases in only buying on deal. In 2007, Fabric Care had 29% of all purchases on promotion and 5% of households bought only on promotion. In 2014 the proportion of all purchases on promotion rose to 53%, and households buying only on promotion rose markedly to 18%.
Results for specific brands
What do these metrics look like for brands within these categories? Does the amount of promotion in a category reflect the amount of promotion that goes on for each brand? For example, are all brands in heavily promoted categories also heavily promoted, or do some brands resist the tactic even though it is the norm? Do some brands promote heavily even if the category is not that heavily promoted? In general we find that brands follow their category norm: in heavily promoted categories all brands offer a lot of deals. We show detailed results for several of the categories to highlight specific points in detail. We then combine all the categories and use them in Table 8 to convey generalized findings and take-outs.
Table 2 shows the top five brands in Chilled & Frozen Pizza, the most heavily promoted category in our 2007 data (51% of all purchase occasions bought on promotion, 50% among the top 5 brands). All the brands are heavily promoted, with the three leaders each having 59% + of purchase occasions made on promotion.
Brand buying at regular and promotion price in a year: Pizza.
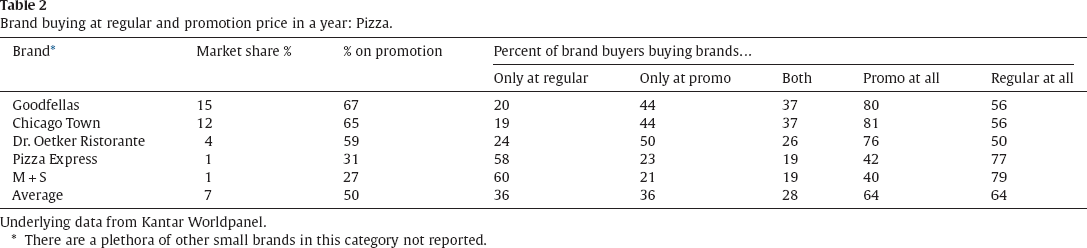
Brand buying at regular and promotion price in a year: Pizza.
Underlying data from Kantar Worldpanel.
There are a plethora of other small brands in this category not reported.
About two-thirds (64%, range = 80% to 40%) of each of these brands’ buyers made a brand purchase on promotion (next to last column), and 36% on average only bought the brand when on promotion. Even the small share premium brands Pizza Express and M&S have about 30% of occasions on promotion and around 40% of their buyers buy sometime on deal, although the proportion of ‘Only at promo’ buyers for these two brands is lower at approximately 20%.
Table 2 shows there is a high incidence of promotion-only buying for these leading Pizza brands, coupled with only about half their buyers buying at regular price. This suggests a strong propensity to switch between these leading brands for a deal. If the promotion-only buying figures were lower, it would indicate that buyers of any particular brand alternated between buying that same brand on and off promotion, rather than switching between the leading brands. In part this switching may be due to the high frequency of deals (so that probably at least one of the major brands can be found on deal at any time). A lower incidence of overall promotion would likely have resulted in consumers merely taking a deal when available (rather than switching for a deal), which we would see reflected in a higher incidence of buying at both regular and promotional price. Interestingly, the figures for ‘Both’ in Table 2 decline in line with brand size, which suggests a Double-Jeopardy effect – small brands are bought a bit less often, so there will be fewer buyers buying them at normal price and on promotion.
The Yoghurt Drinks category is somewhat similar, as Table 3 shows. The main brands, Danone and Muller with 39% and 26% market share respectively have 37% and 55% of sales respectively on promotion. 65% of Danone buyers buy it sometime on promotion and 24% only on promotion. For Muller, it is 74% buying it sometime on promotion, and 39% only on promotion. An interesting oddity in this category is the brand Yakult, the founder of the category but now a minor brand with 9% share. It does almost no price promotion at all, and hence has very few promotion buyers and almost none who only bought it on promotion.
Brand buying at regular and promotion price in a year: Yoghurt Drinks.
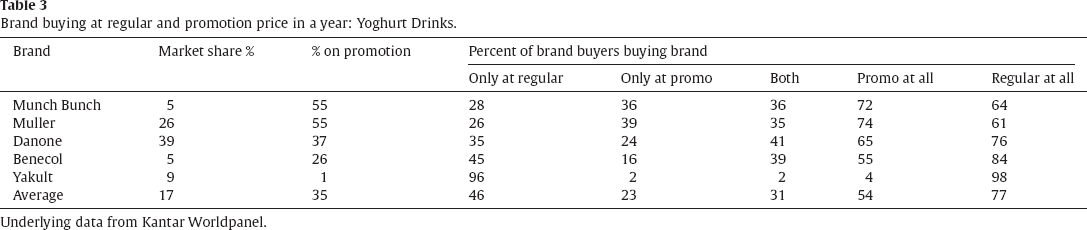
Underlying data from Kantar Worldpanel.
In contrast, Table 4 shows the same metrics for brands in Condiments & Spices, where there is little promotion on any brand. Here every brand is closer to Yakult in drinking yoghurt – for most brands in this category, fewer than 15% of their buyers buy it on promotion at all (% on Promotion column), and hardly any buy a brand only when it is on promotion: an average of 5%.
Brand buying at regular and promotion price in a year: Condiments & Spices.
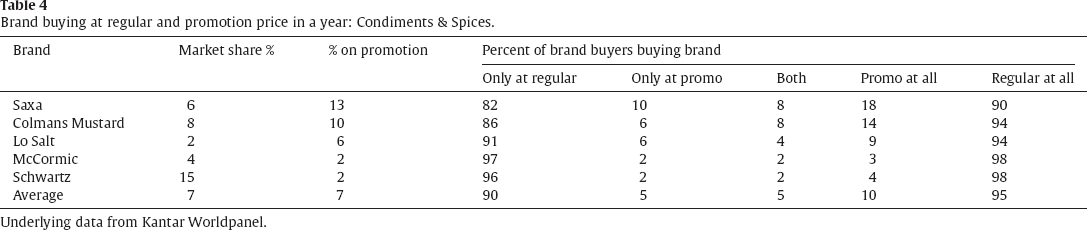
Underlying data from Kantar Worldpanel.
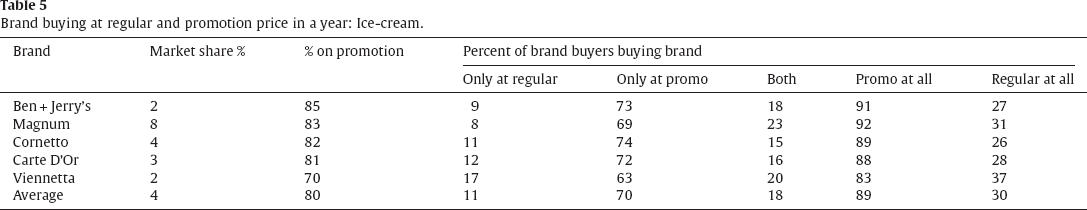
We show one more example table of this type, using a category from our 2014 data, Ice-cream, which had a very large proportion of occasions purchased on deal (80%). We see the brand with the largest amount of promotion, Ben + Jerry's sold 85% on promotion, meaning that few of its buyers were able to buy it only at regular price (9%) and 73% bought it only on promotion. However, 27% of its buyers still buy it at regular price at least once. By comparison, Viennetta, the brand with the least (comparatively) amount of promotion sales, but still high at 70%, had a much larger proportion buying it only at regular price (17%) and even with 70% in total sold on promotion, 37% of its buyers managed to buy it at regular price at least once. (Table 5)
Brand buying at regular and promotion price in a year: Ice-cream.
The previous four tables show that the more of a brand's sales that are on promotion, the more its buyers buy on promotion and there are more who have only bought on promotion. It is unsurprising that these metrics are related, logically if a brand sells 100% on deal then also 100% of buyers of it will buy on deal and no one at regular price. If very few sales are on deal (like the rarely promoted Yakult) then almost no one will buy only on deal. But what is surprising is the strength of the relationship, it is near perfect, and perfectly linear, i.e. if the proportion a brand sells on deal is double a rival brand then the percentage of its buyers who buy on deal is also double. Figs 1 and 2 illustrate the strong relationship (R2 = .88,.89) between the percentage of all occasions on which a brand is bought on deal, and the percentage of buyers who only buy the brand when on deal. This pattern is equally apparent in 2007 and in 2014.
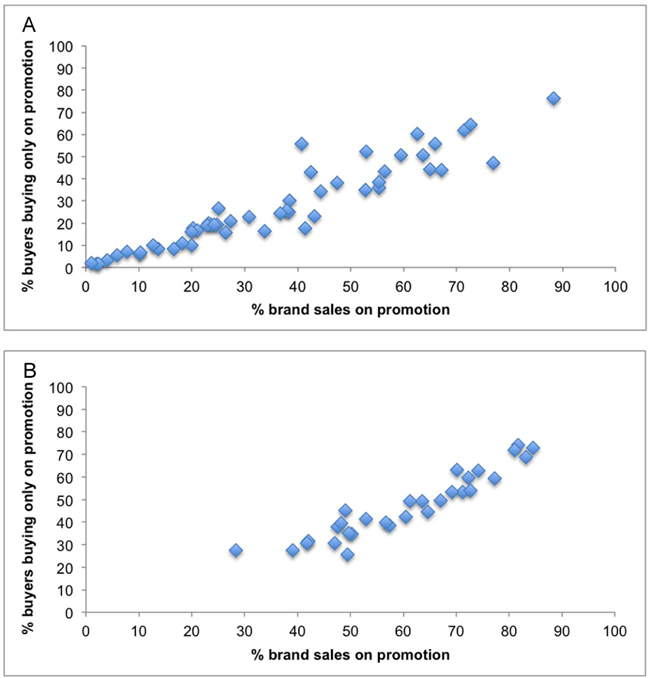
Relationship between overall promotion incidence and buying brand only on promotion.
These results strongly suggest that there is not an appreciable segment of deal-prone consumers. If such a segment existed then the relationship would not be linear. For example, if a brand's customer base consisted of ‘loyals’ and ‘switchers,’ as is sometimes portrayed in the academic literature (e.g. Rossiter and Bellman, 2005), we should expect something of a floor for the percentage of buyers buying on deal. If half of a brand's buyers were switchers, then even if a small proportion of a brand's sales were on deal in a period, around half of its buyers should have bought on deal, i.e. the switchers rush in when the brand is on deal, even if they don't contribute a great deal of overall sales (being swamped by the more regular buying of the ‘loyals’) they make up a large proportion of the buyer base and most of those buying on deal. The linear relationship between these metrics does not fit with the theory of a brand's customer base being made up of very different segments of ‘loyals’ and ‘switchers’. The customer base is then much better described as one of polygamous loyal buyers with different weights of purchase frequency (as described in Sharp et al., 2012).
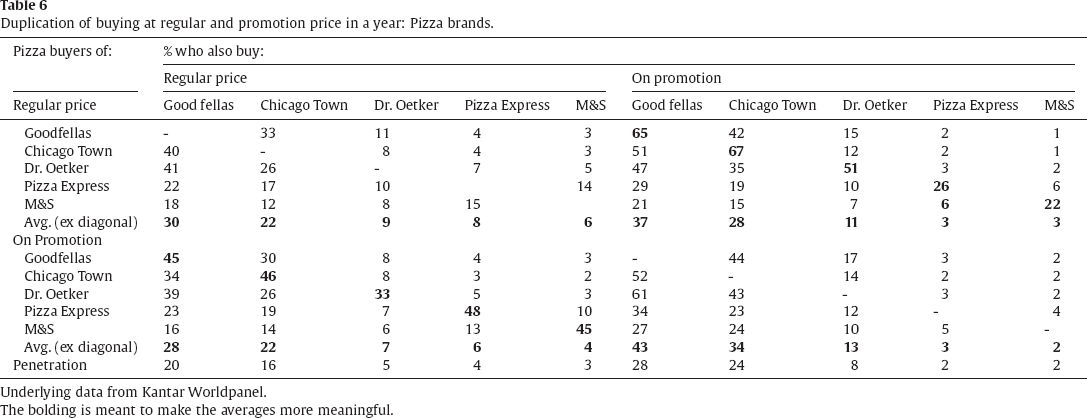
In order to further explore deal proneness, the last part of the analysis looks at how buyers duplicate their purchasing between brands on and off promotion (i.e., buy both on and off promotion in the time period). The key question is, are buyers of one brand on promotion much more likely to buy other brands on promotion and less likely to buy brands at regular price? Again we illustrate with the Pizza market in Table 6 before summarizing with averages across all the categories.
Duplication of buying at regular and promotion price in a year: Pizza brands.
Duplication of buying at regular and promotion price in a year: Pizza brands.
Underlying data from Kantar Worldpanel.
The bolding is meant to make the averages more meaningful.
The top half of Table 6 shows the percentage of buyers of each brand at regular price (the rows) who also bought other brands at regular price (the first five columns) and each brand (including the brand in question) at promotional price. The bottom half of the table gives the equivalent figures among those who bought each brand on promotion. The bottom row of the table shows the penetration, i.e. percent buying in the population, for each brand at regular or promotion price. The main pattern in the duplication table is in line with the Duplication of Purchase Law, which states that buyers of X who also buy Y is proportional to the size (penetration) of Y (Ehrenberg and Goodhardt, 1968, 1969; Goodhardt and Ehrenberg, 1969; Tanusondjaja et al., 2016). Thus the numbers in the columns are similar to each other, but different from column to column (descending from left to right within each quadrant, see averages rows). There is a little variation within a column due to some partitioning between the premium brands Pizza Express and M&S and the others. There is then one obvious big deviation, that the diagonals of the NE and SW quadrants (highlighted in bold) representing the buyers of a brand at regular who also buy that brand on promotion and vice versa, are much higher than the rest of their column. This tells us that:
people attracted to buy a brand on promotion are highly likely to also buy it at regular price, and conversely, those who buy a brand at regular price are a major source of custom when the brand is promoted.
These are clear evidence of brand loyalty, something widely observed across markets, and a natural part of human behaviour (see Sharp, 2010, Sharp, 2013).
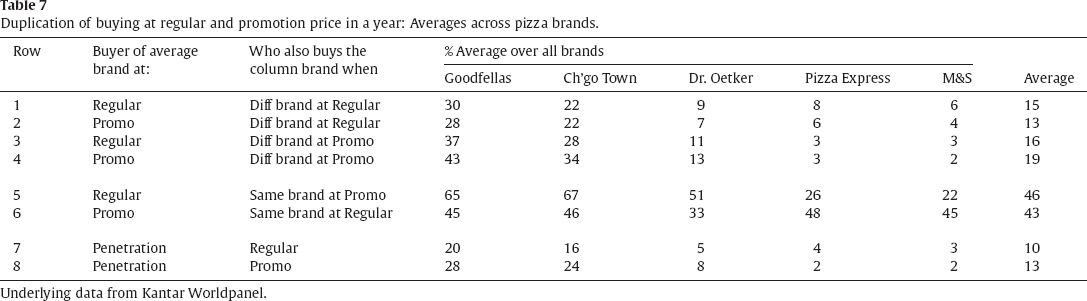
There is a further small, but consistent deviation from the Duplication Law, which is best seen in Table 7, which takes the averages plus the diagonals from Table 6. In Table 7, row 1 is always slightly higher than row 2, summarized by the averages of 15 to 13. This says that among buyers of a brand at regular price, the average sharing with each competitor is 15%. Then, among buyers of a brand at promotion price, average sharing is similar, at 13%.
Duplication of buying at regular and promotion price in a year: Averages across pizza brands.
Underlying data from Kantar Worldpanel.
Conversely, if we look at rows three and four, row four is generally higher than row three (average 19 vs. 16). Thus the buyers of a brand on promotion are a little more likely to buy another brand on promotion than buyers at regular price are to buy that brand on promotion. These small differences represent the amount of price proneness over and above what we might expect simply from the availability of price promotion. That is, promotion buyers are a little more likely to buy another brand on promotion than regular buyers, and regular buyers are a little more likely to buy another brand at regular price than promotion buyers are. In rows 5 and 6 we see the proportions of regular-price buyers of a brand who buy the same brand at promo price; and vice versa. These figures are 46 and 43 respectively. The small 3-point difference here is due to lower promotion incidence for Pizza Express and M&S: if these brands have fewer promotions, then there is less opportunity for regular buyers to also buy the brand on promotion. Overall, the figures of 46 and 43 (average 44) can be compared to the other figures (15 and 13, 16 and 19 = average 15) to indicate the extent to which buyers buy the same brand on and off promotion, compared to buying any other brand on and off promotion: about 44/15 = 3 times as likely (showing the already noted brand loyalty effect).
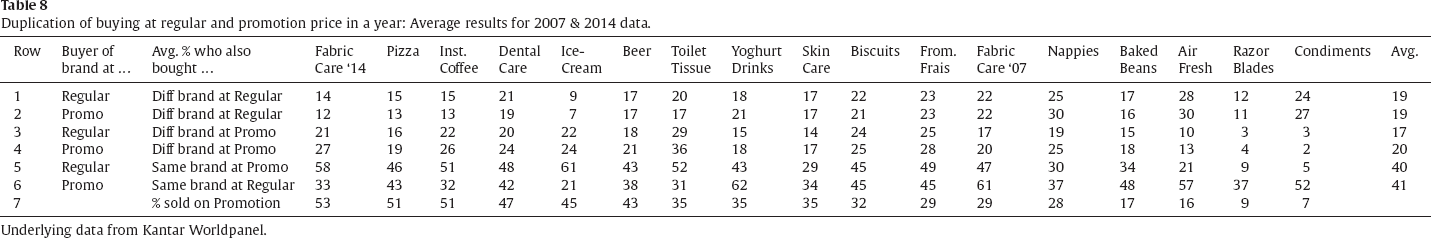
Table 8 extends the analysis in Table 7 to all the categories in our dataset.
Duplication of buying at regular and promotion price in a year: Average results for 2007 & 2014 data.
Underlying data from Kantar Worldpanel.
Across all the categories, we see in Table 8 that on average, promotion buyers are as likely to also buy a different brand at regular price as regular-price buyers are (rows 1 and 2 – both 19%). However, as per rows 3 and 4, promotion buyers are a bit more likely to buy a different brand on promotion compared to regular-price buyers (20 vs. 17, row 4 compared to 3). This reflects the smallish incremental effect of deal-proneness over and above the amount of promotions available in the category. However, we can clearly also take out from this information that buying a brand on promotion does not deter consumers from buying other brands at normal price. The results underscore that brands are still a very important purchase driver, consumers don't just buy based on what is on promotion. It is also possible that some of this small effect are due to high levels of promotion coinciding with seasonality. This would mean less frequent buyers entering the category at its high point, and also encountering more promotions at the time.
Buying the same brand
Next, in Table 8 we see figures of 40 and 41 for the average proportions buying the same brand at promo or regular. Firstly, both these figures are much higher than those for buying different brands (19, 19, 17, 20 for rows 1, 2, 3, 4) – this indicates that the likelihood of buying the same brand on/off promotion is, on average, around twice as high as buying other brands on/off promotion. Second, the average figure of 40 for regular-price buyers buying the same brand at promo is essentially the same as that of 41 for promo buyers also buying the same brand at regular. This strongly implies that buying a brand on promotion does not tend to diminish buyer's propensity to also buy it at regular, any more than buying a brand at regular price would diminish their propensity to also buy it on promotion.
As a final note to the analysis, we build on the main finding (section 3.1) that the overall extent of promotion sales volume in a category drives the extent to which consumers only buy on promotion. To do so, we correlate the overall promotion extent in each category (Table 8, row 7) with the proportion of regular-price buyers who buy a different brand on promotion (row 3), and with the proportion of regular-price buyers who buy the same brand on promotion (row 5). The correlation for different brand is.66, whereas the correlation for same brand is.84. This finding suggests that promotion prevalence tends to result in buyers buying their same brands on promotion, more so than driving them to seek out different brands on promotion. The general impression from these findings is that the extent of consumers actively seeking deals is low, which is consistent with past research (Pechtl, 2004).
Concluding discussion on brand loyalty and deal proneness
Brand loyalty, in terms of biasing purchases to a small personal repertoire and therefore returning to the same brands over and over, has been documented in a wide range of product and service categories (Ehrenberg et al., 2004), durables (Bennett, 2008), luxury goods (Romaniuk and Sharp, 2016), and in business-to-business buying (Pickford and Goodhardt, 2000). The patterns of brand loyalty are therefore quite law-like (Ehrenberg, 1993). Such loyalty has also been observed beyond buying, for example in TV program choice (Sharp et al., 2009) and even in university lecture theatre seating (Livaditis et al., 2012). It has been strongly suggested that it is natural human behaviour, rather than marketing induced (Sharp et al., 2013). Our findings provide further support that loyalty is a fundamental aspect of buying and perhaps all human choice behaviours. In the face of regular attractive price discounts, brand loyalty is still very starkly apparent.
It is commonly, and not unreasonably, thought that buying a brand on deal is the antithesis of brand loyalty. However, our data shows that even in categories where more than half of sales are on deal there is a high degree of brand loyalty. Indeed our results indicate price promotions gain a large proportion of their sales from people who already include the brand within their repertoire. This finding closely corroborates past findings by Ehrenberg et al. (1994) that showed the majority of people who buy a brand on price promotion had already bought the brand in the recent past.
This study has uncovered three main patterns in buying brands on and off promotion, which have not been previously investigated. First, that the tendency for a high proportion of brand buyers to buy a brand only when it is on promotion is directly related with the total amount of sales bought on promotion for a brand. Next, those who buy a brand on promotion are a little more likely than regular-price buyers to buy other brands when they are on promotion, but buying a brand on promotion does not lower a shopper's likelihood of buying other brands at normal price. Third, more volume sold on deal has a stronger relationship with regular-price buyers buying the same brand on promotion, compared to buying different brands on promotion.
Price promotion therefore does not create big divisions (segments) in markets between the deal-prone and those buyers who are not, but rather creates the possibility for most buyers to take advantage of promotions when they are available. Buying on deal is a reflection of the tendency of brands to sell a lot on promotion rather than of consumers to seek out deals. Here we have examined this issue across 16 diverse CPG categories, but extending the analysis to even more categories and countries would strengthen the conclusion.
Limitations and directions for future work
Our study examined behaviours, not price promotions. We documented mainly cross-sectional differences in buying between brands and categories with different levels of promotion and normal sales. This somewhat limits our ability to comment on whether increasing amounts of price promotion encourage sensitivity to price promotion (e.g. learning effects). This is certainly a direction for further work.
In this study we undertook one comparison over time for a category (Fabric Care) for which we had data for two time periods, seven years apart. It would be fascinating and enlightening to carry out a full longitudinal study to examine how the incidence of households buying categories and brands only on deal, only on promotion, or both, might change in cases where brands have changed their price promotion strategy. However, finding cases of significant changes in price promotion strategy, particularly reductions in promotion incidence, may prove difficult.
Lastly, our measure of promotion prevalence was the total proportion sold on deal (promotion) in each category. An alternative measure of promotion prevalence is the amount of promotion offered by brands over a period of a year. However, calculating such a measure would be challenging because brands cannot be neatly classified as on or off promotion in any given week. Rather, any brand is likely to have some of its SKUs or variants on promotion, in some retailers and not others, in any given week. It is therefore not possible to simply add up the proportion of weeks brands are on or off promotion. With that in mind, a direction for future research is to develop a way to calculate this prevalence or availability of price promotions for a category, taking into account multiple SKUs per brand, some on deal or not at any given time, different levels of brand market shares, and multiple retailers. These measures could then be used in future examinations of the interplay between promotion availability, total sales sold on deal, and the extent of households buying on and off promotion.