
Abstract
Purpose
We sought to compare the performance of 3 computer-aided detection (CAD) polyp algorithms in computed tomography colonography (CTC) with fecal tagging.
Methods
CTC data sets of 33 patients were retrospectively analysed by 3 different CAD systems: system 1, MedicSight; system 2, Colon CAD; and system 3, Polyp Enhanced View. The polyp database comprised 53 lesions, including 6 cases of colorectal cancer, and was established by consensus reading and comparison with colonoscopy. Lesions ranged from 6-40 mm, with 25 lesions larger than 10 mm in size. Detection and false-positive (FP) rates were calculated.
Results
CAD systems 1 and 2 could be set to have varying sensitivities with higher FP rates for higher sensitivity levels. Sensitivities for system 1 ranged from 73%–94% for all lesions (78%–100% for lesions ≥10 mm) and, for system 2, from 64%–94% (78%–100% for lesions ≥10 mm). System 3 reached an overall sensitivity of 76% (100% for lesions ≥10 mm). The mean FP rate per patient ranged from 8–32 for system 1, from 1–8 for system 2, and was 5 for system 3. At the highest sensitivity level for all polyps (94%), system 2 showed a statistically significant lower FP rate compared with system 1 (P = .001). When analysing lesions ≥10 mm, system 3 had significantly fewer FPs than systems 1 and 2 (P < .012).
Conclusions
Standalone CTC-CAD analysis in the selected patient collective showed the 3 systems tested to have a variable but overall promising performance with respect to sensitivity and the FP rate.
Computed tomography colonography (CTC) has evolved into an accepted alternative diagnostic tool for the detection of colorectal polyps and cancer. Comparative studies found CTC to be equivalent to colonoscopy in terms of sensitivity and specificity in both symptomatic [1] and asymptomatic (screening) patients [2,3]. In a multicenter study by Cotton et al [4], CTC was considered less effective for the detection of colonic lesions. However, meta-analyses [5] and a recent major trial [6] demonstrated the performance of CTC in detecting adenomatous polyps and invasive cancer to match that of the reference method, fiber-optic colonoscopy.
Interpretation of CTC examinations is time consuming, and differentiation of polyps from stool and mucosal folds is not always easy [7,8]. Computer-aided detection (CAD) systems were developed and are used as adjuncts for digital mammography and detection of pulmonary nodules on chest CT (computed tomography) [9,10]. A recent study on CAD in CTC compared 2 systems on data without fecal tagging [11]. However, both stool and fluid tagging are considered routine techniques in CTC at most clinical institutions. The purpose of our study was to compare the standalone performance of 3 different CAD algorithms in terms of sensitivity and false-positive (FP) rate when applied on fully tagged CTC data of patients.
Patients and Methods
Patient Population
Thirty-three patients (16 women, 17 men; mean age, 66 years; age range, 51–83 years) referred to our department for CTC were included in the study. All patients examined were symptomatic. Indications for CTC in the series of symptomatic patients had been chronic abdominal discomfort, a positive fecal occult blood test (FOBT) test, or incomplete optical colonoscopy. Inclusion criteria were the presence of polyps, adenomas, or colorectal cancer with lesion size ≥6 mm, and CTC image data of sufficient quality, that is, bowel preparation with tagging of fecal residues and fluid (required density for residual stool and fluid tagging, 200 HU), absence of nondistended colon segments, and absence of motion artifacts.
Imaging Protocol
All of the referred patients followed the institution's standard bowel preparation procedure. The bowel preparation regimen consisted of oral ingestion of a phosphosoda preparation (bisodium hydrogen phosphate) together with iodinated oral contrast medium (Peritrast-oral-CT; Koehler Chemie GmbH, Alsbach-Haenlein, Germany). The bowel preparation started after lunch on the day before the examination. Patients were examined the following morning, after they skipped breakfast. The bowel preparation regimen was identical to a regimen used in a previous published study [12].
After rectal palpation and the insertion of a rectal tube (E-Z-EM Inc., Westbury, NY), automated carbon dioxide (CO2) insufflation via the rectal tube was initiated with the patient in the supine position. After acquisition of a localizer, 40 mg butylscopolamine for spasmolysis was injected intravenously. Colon insufflation was continued by using a commercially available automated system (E-Z-EM). A total volume of 120 mL of nonionic intravenous contrast medium (iopromide, Ultravist 370; Bayer Schering Pharma AG, Berlin, Germany) was injected during insufflation at a flow of 2.5 mL/s. The multislice spiral CT examination (16-slice, MDx 8000; Philips Healthcare, Eindhoven, The Netherlands) was acquired after a delay of 60 seconds, during 1 single breath-hold and continuous CO2 insufflation. The scanning parameters were 16 × 1-mm slice collimation, 23:16 pitch, 180 mA, and 500 ms rotation time. Images were reconstructed at 1-mm-slice thickness (20% overlap). The patients were first examined in the supine position, then a CT examination in the prone position was performed with a low-dose protocol (50 mA). The study had approval of the institutional review board.
Polyp Database
Included in the study were all consecutive patients examined between February 2005 and July 2006 for whom correlation with conventional colonoscopy or surgical correlation was available. Overall, 150 CTC data sets were reviewed, and data sets of 39 patients met the inclusion criteria. None of the cases had to be excluded because of insufficient image quality or bowel distension. Six of the 39 data sets had to be excluded because of insufficient conversion to the specific format of the CAD systems in 3 cases for system 1 and in 3 cases for system 3. No other data sets were retrospectively excluded, which resulted in inclusion of 33 patients in the final CAD analysis.
Lesions within the colon were proven in all but 3 cases (3 polyps 6–9 mm in size) by fiber-optic colonoscopy or surgical removal. The reference standard was established by means of consensus reading of the CTC data by 3 expert readers (10, 5, and 4 years of experience) for CTC by using 3-dimensional (3D) reading with 2-dimensional problem solving. Nonproven, sessile polyps (6–9 mm) were included after consensus of the expert readers for CTC. Lesions not proven histologically were only included if they demonstrated typical characteristics and all 3 expert readers agreed about their nature in the consensus reading. To determine the location of the lesions, the colon was divided into 6 segments (rectum, sigmoid colon, descending colon, transverse colon, ascending colon, and cecum). The location and number of polyps were recorded for each segment. Polyp size was determined by means of a digital caliper on axial CT slices, with a window setting of 2,000/0 (W/C).
A total of 53 lesions, which ranged in size from 6–40 mm (mean diameter, 12 mm), were included in the reference standard. Ten lesions were located in the rectum, 18 in the sigmoid colon, 5 in the descending colon, 3 in the transverse colon, 8 in the ascending colon, and 9 in the cecum. In 10 patients, more than 1 lesion was identified. The maximum of 3 lesions was identified in a single patient, including 2 lesions that represented colorectal carcinomas. Six of the 53 polypoid lesions identified were surgically proven colorectal carcinomas. Carcinomas were located in the rectum in 3 cases, in the sigmoid colon in 2 cases, and in the transverse colon in 1 case (diameter range, 18–40 mm, mean, 22 mm). The morphology of the carcinomas was anular mass-like in 3 cases and more or less flat in the other 3 cases (colon-wall thickness, 6 mm). A total of 25 lesions (including the 6 cases of colorectal cancers) ≥10 mm in size were detected in 18 patients. Four lesions were located in the rectum, 8 in the sigmoid colon, 3 in the descending colon, 2 in the transverse colon, 2 in the ascending colon, and 6 in the cecum. The morphologies of the 19 histologically noncancerous lesions ≥10 mm were sessile in 13 cases and pedunculated in 6 cases.
CAD Analysis
CTC data were analysed with the Vitrea Workstation (version 3.9; Vital Images, MN), which ran the CAD by MedicSight (system 1), with the ViewForum Workstation (version 6.2; Philips Healthcare), which ran the Colon CAD (system 2), and by Polyp Enhanced View (system 3), which operated on the Syngo Workstation (Siemens, Erlangen, Germany). None of the CAD systems was trained with the data sets analysed. None of the CAD algorithms, in the tested versions, included automatic virtual bowel cleansing. Polyp detection when using the CAD systems were established per patient, not per-patient position. In case a polypoid lesion was detected in a single position, the lesion was recorded as a successful detection regardless of whether the polyp detection system detected the lesion in the complementary position.
CAD systems 1 and 2 offered user interaction. A slide control bar in the colon package of the system 1 allows the user to freely select a so-called sphericity level (SL) of the CAD algorithm. The default setting is roughly 30% on a scale from 0%–100%. To investigate the sensitivity of the algorithm, the control was divided into 5 equal parts by means of a transparent ruler attached to the liquid crystal display (LCD) screen (0% SL, 25% SL, 50% SL, 75% SL, 100% SL, and default SL). When using the colon CAD algorithm of system 2, a “confidence/roundness level” (CL) can be assigned. Sensitivities for all patients and FP rates were calculated for 5 groups of probabilities, from 80%–100% CL to 0%–100% CL. Sensitivities were expected to increase when using higher SLs for system 1 and when using larger ranges of the CL for system 2. CAD system 3 allows no user interaction.
After CAD analysis, the polyp candidates identified by the algorithms were then compared with the established reference standard, and each polyp candidate was classified as true positive or FP. Sensitivities and FP rates were then determined for each CAD system. Moreover, sensitivity and FP rates were calculated for different SLs and CLs. Sensitivity and FP rate were calculated for all lesions and for lesions ≥10 mm. The total number of FP findings was recorded from the analysis of the CTC data set acquired with the patient in the supine position. All FP markers were recorded independently of the location or reason for the FP finding.
To compare the 3 systems statistically, we ranked the performance by selecting the highest sensitivity and also by indicating the FP rate at various sensitivity levels. Furthermore, with respect to FP rates at comparable SLs, a receiver operating characteristics curve was assumed. CAD systems were then statistically analysed by using the Student t test and the Wilcoxon signed rank test for paired samples.
Because of the high overall number of FP findings for the different SCLs and CLs of the CAD system 1 and system 2, a detailed analysis of all FP findings with respect to reason and location was not attempted. However, to give an approximation to the distribution of FP findings after CAD analysis with the 3 different systems, a subset of 18 patients was chosen. For default SL, system 1; 0%–100% CL, system 2; and system 3, the relative percentage of causes for FP findings was calculated.
Results
CAD Analysis of All Lesions
Sensitivities calculated for all lesions (n = 53, size ≥6 mm) ranged from 73% (0% SL) to 94% (100% SL, default SL) for system 1 and from 64% (80%–100% CL) to 94% (0%–100% CL) for system 2. CAD analysis when using system 3 resulted in a sensitivity of 76%. The 3 non–histologically proven polyps as well as the malignant lesions were detected by all CAD systems.
CAD analysis of all lesions revealed corresponding mean FP rates (mean FP per patient) ranged from 8 FPs (0% SL) to 32 FPs (100% SL) for system 1. The FP rate of the default SL (roughly 30% SL on the scale from 0%–100%) of system 1 was 16 FPs, lower than the FP rates at the close by SLs, 25% SL and 50% SL. The FP rate for system 2 ranged from 1 FP (80%–100% CL) to 8 FPs (0%–100% CL). For system 3, a FP rate of 5 FP lesions per patient was calculated.
A maximum of 112 FP and a minimum of 0 FP findings in a single patient were recorded at 100% SL of system 1. CAD analysis when using system 2 resulted in a maximum of 53 FP findings and a minimum of 0 FP findings at 0%–100% CL. Analysis with system 3 yielded a maximum of 24 FPs and a minimum of 0 FP in a single patient.
For all lesions, system 1 and system 2 achieved a higher maximum sensitivity (94% for both systems) than system 3 (76%). At the highest sensitivity, analysing the respective average FP rate at default SL for system 1 and 0%–100% CL for system 2, system 2 showed statistically significantly fewer FPs than system 1 (P < .001, t test; P < .001, Wilcoxon test). There were more FPs per patient for system 1 compared with system 2 in 31 of the 33 cases and fewer FPs per patient in 2 cases. CAD analysis when using system 3 resulted in a sensitivity of 76%. When assuming a receiver operating characteristics curve by disregarding the results of CAD analysis of system 1 at default SL, the 3 systems could be compared with respect to FP rates at the achieved 76% sensitivity level of system 3. When doing so, system 2 showed fewer FPs than system 3, and system 3 had fewer FPs than system 1 at the respective sensitivity level.
CAD Analysis of Lesions ≥10 mm
Twenty-five lesions, in 18 patients, were ≥10 mm in size. The SLs for the detection of lesions ≥10 mm in size ranged from 78% (0% SL) to 100% (100% SL and default SL) for CAD system 1. CAD analysis, when using system 2, resulted in sensitivities that also ranged from 78% (80%–100% CL) to 100% (0%–100% CL). When considering only lesions ≥10 mm, system 3 was capable of achieving a sensitivity of 100%. For the maximum sensitivity, the statistical analysis revealed fewer FPs when analysing the CTC data with system 3 than with system 2 (P = .012, t test; P = .016, Wilcoxon test) and compared with CAD system 1 (P < .001, t test; P = .016, Wilcoxon test). System 2 showed statistically significant fewer FPs than system 1 (P = .001, t test and Wilcoxon test).
FP Findings
Residual feces, colonic folds, the rectal tube, and the ileocecal valve were reasons for FP findings. We did not observe any CAD marker outside the colon wall for any system and at any presetting. A subset of patients (n = 18, lesion size ≥10 mm) and specific SLs and CLs were chosen to give an approximation to the distribution of causes for FP findings of the different systems. According to the analysis, 50% of FP findings of system 1 were related to residual stool, 30% of FP findings related to folds, 10% to the ileocecal valve, and 10% to the rectal tube. System 2 showed FP findings related to stool in 30%, to folds in 50%, and to the ileocecal valve and rectal tube in 10%. System 3 showed FP findings related to stool in 40%, to folds in 20%, to the ileocecal valve in 10%, and to the rectal tube in 30% (the higher relative percentage of FP findings associated with the rectal tube can be attributed to the lower number of FP findings of system 3 within the patient subset).
Sensitivities with respect to the preset SL or the assigned CL plotted against the mean FP rates are illustrated in Figure 1 for all lesions and in Figure 2 for lesions ≥10 mm in size. Representative axial CT images of the CAD analysis that illustrate a true positive and typical FP finding as well as a polyp detected by all systems illustrated in an endoluminal, 3D-rendered view are shown in Figures 3–5.
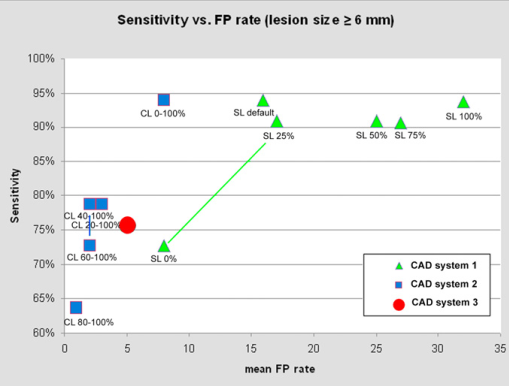
The graph shows the calculated sensitivities for the 3 computer-aided detection algorithms for the detection of all polyps plotted over the number of false-positive findings. SL = sphericity level of system 1; CL = confidence level of system 2.
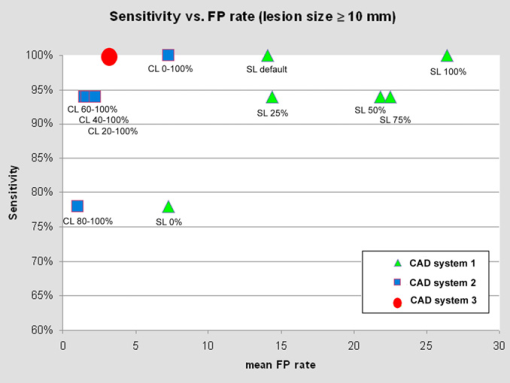
The graph shows the calculated sensitivities for the 3 computer-aided detection algorithms for the detection of polyps ≥10 mm plotted over the number of false-positive findings. SL = sphericity level; CL = confidence level.
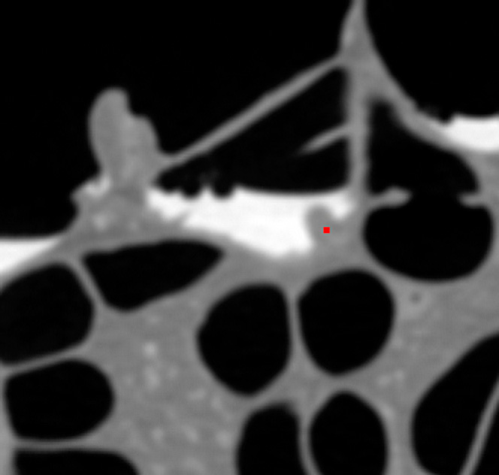
Axial image of a CTC data set in supine-position, illustrating the successful computer-aided detection of a polyp, despite overlying residual opacified fluid in the colon. The sessile polyp detected in a 66-year-old patient with chronic abdominal discomfort was detected by all 3 computer-aided detection systems.
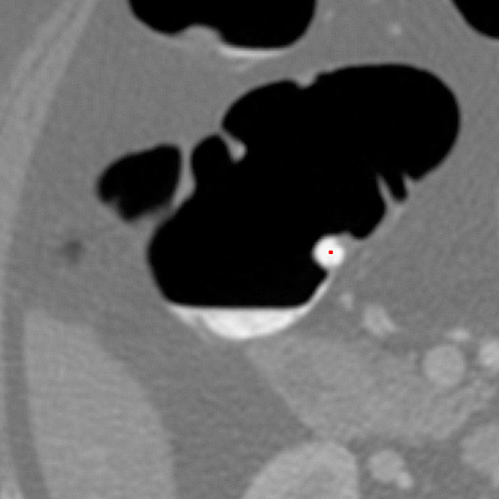
A typical false-positive result within the computer-aided detection analysis because of residual feces that mimicked a polyp, illustrated in an axial reconstruction of the computed tomographic colonography data with the patient in the supine position. The false-positive finding was observed after computer-aided detection analysis with system 1.
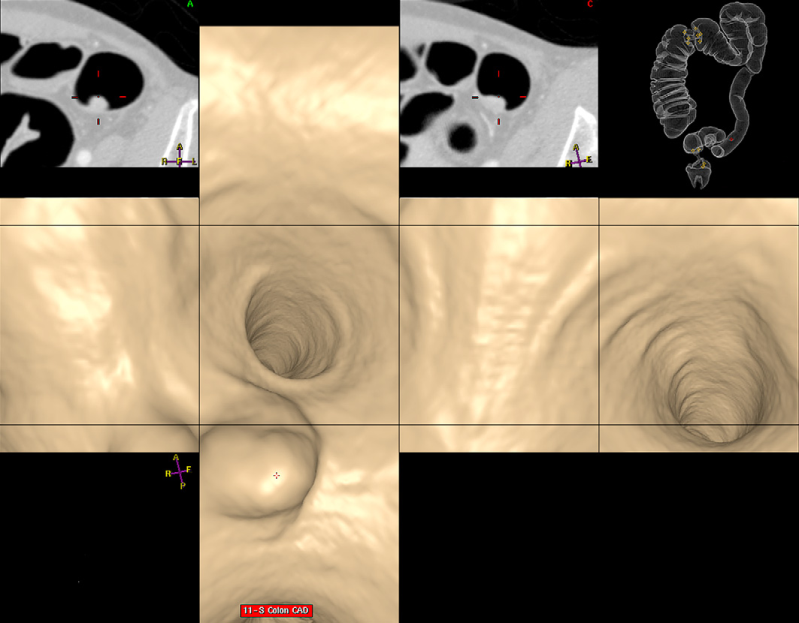
Successful computer-aided detection of a sessile polyp in the sigmoid colon depicted in a 3-dimensional endoluminal unfolded view. The lesion was detected by all 3 computer-aided detection systems.
Discussion
Based on the sensitivity and specificity levels reported by the investigators of a recent large trial of CTC, the American Cancer Society recommends including CTC as an alternative screening modality for the detection of adenomatous polyps and cancer in the large bowel [6,13]. Although CTC has been recognized as a promising minimally invasive imaging tool for some time, recent multicenter trials show a large variation in per-polyp sensitivity for CTC [2,4]. Differences in the CT scanner technology, interpretation methods, and bowel preparation regimens might explain the observed differences in sensitivity.
Beside technical factors, readers' expertise, fatigue, distraction, and perceptual errors are considered important factors that affect polyp detection by CTC. Perceptual errors may result from the misinterpretation of normal structures, such as colonic folds, or variable conspicuity of polypoid structures [11]. Although the interpretation of CTC studies that primarily used 3D endoluminal views may increase the individual reader's performance, it can also contribute to perceptual errors because of the necessity of a bidirectional data analysis. CAD systems for CTC studies have been developed to overcome these limitations of human readers. The automated, objective, and consistent analysis of the CTC data is not affected by radiologists' expertise and skills.
On the basis of thin-slice CTC data sets, we compared the standalone performance of 3 different polyp detection systems by using a retrospectively selected patient group. We evaluated lesions ≥6 mm in size as defined by the reference standard on CTC data with fecal tagging. The 3 automated detection systems operated on a rather high performance level, with sensitivities that ranged from 64%–94% for the detection of all lesions and reached 100% sensitivity for lesions ≥10 mm. However, the mean FP rates substantially varied among the CAD systems as well as among the levels of preset sphericity or confidence. Moreover, the absolute number of FP findings in a single patient might be excessively high.
CAD analysis of radiologic image data will invariably lead to FP findings, and visual verification of CAD detections by the radiologist is required. If the rate of FP findings is low, then these can be easily and rapidly dismissed or confirmed by an experienced radiologist reviewing the CAD findings. However, an excessive number of FP findings can distract and mislead the radiologist, which is why efforts have been made to diminish the FP rate of CAD systems. Typical sites known to be prone to FP findings are the rectal tube, fecal residues, and the ileocecal valve. The options proposed to reduce FP findings include an algorithm that checks for region-based supine-prone correspondence for minimizing FPs because of fecal residues [14,15] and definitions of volume and attenuation thresholds to reduce FPs induced by the ileocecal valve [16].
FP rates as well as reported sensitivities substantially vary in different studies on CAD in CTC as well as among different CAD systems. For different CAD systems and different patient cohorts, reported sensitivities for the standalone performance of CAD ranged between 80% and 90%, with FP rates that ranged between 2.1 and 32 FP findings per patient [14,17–24].
In a recent comparative study, Fletcher et al [11] investigated CAD on 65 CTC data sets when using 2 different CAD systems. Analysis with the first CAD system yielded 96% sensitivity for lesions ≥10 mm, with an average FP rate of 5.2 per patient (range, 1-26). When using the second CAD system, a lower sensitivity (61%) for lesions ≥10 mm was recorded, but the FP rate was also lower, with 1.18 per patient. Similarly, in our analysis, the 3 systems showed different characteristics with respect to sensitivity and the average FP rate. According to our results, for the detection of lesions that ranged in size between 6 and 9 mm, CAD systems 1 and 2 had the higher potential to detect smaller lesions compared with CAD system 3. Although system 1 comes with user interaction available, the default setting, in fact, gives optimum results. To achieve the optimum sensitivity level of 94%, the entire range of CLs (0%–100%) had to be selected when using system 2. Regarding the sensitivity:FP ratio for lesions ≥10 mm in size, however, CAD system 3 showed the most favorable result, with a rather low rate of FP findings. Interestingly, system 3 showed, in our patient cohort, a higher sensitivity for the detection of lesions ≥10 mm in size compared with the sensitivity level reported by Fletcher et al [11] for the same system.
There are limitations to the study. The ground-truth definition was based on consensus reading by using the additional information provided by the invasive procedures to define the reference standard. The effect of intravenous contrast administration and fecal tagging on the performance of the CTC-CAD systems remains unclear. However, with regard to the results of system 3 and in comparison with the previous comparative study [11], the effect of fecal tagging on CAD sensitivity cannot be considered negative. Further limitations are the approximate evaluation of causes for FP findings after CAD analysis and the rather small patient collective in our study.
In conclusion, the 3 CAD systems investigated in the selected patient collective differed in sensitivity and FP rate, whereas their overall performance was promising. Although CAD systems 1 and 2 have the higher potential for the detection of smaller lesions, CAD system 3 showed the most favorable sensitivity:FP rate ratio for lesions ≥10 mm.