
Abstract
Purpose
To evaluate the value of cardiac magnetic resonance imaging (MRI)–based measurements of inferior vena cava (IVC) cross-sectional area in the diagnosis of pericardial constriction.
Methods
Patients who had undergone cardiac MRI for evaluation of clinically suspected pericardial constriction were identified retrospectively. The diagnosis of pericardial constriction was established by clinical history, echocardiography, cardiac catheterization, intraoperative findings, and/or histopathology. Cross-sectional areas of the suprahepatic IVC and descending aorta were measured on a single axial steady-state free-precession (SSFP) image at the level of the esophageal hiatus in end-systole. Logistic regression and receiver-operating curve (ROC) analyses were performed.
Results
Thirty-six patients were included; 50% (n = 18) had pericardial constriction. Mean age was 53.9 ± 15.3 years, and 72% (n = 26) were male. IVC area, ratio of IVC to aortic area, pericardial thickness, and presence of respirophasic septal shift were all significantly different between patients with constriction and those without (P < .001 for all). IVC to aortic area ratio had the highest odds ratio for the prediction of constriction (1070, 95% confidence interval [8.0-143051], P = .005). ROC analysis illustrated that IVC to aortic area ratio discriminated between those with and without constriction with an area under the curve of 0.96 (95% confidence interval [0.91-1.00]).
Conclusions
In patients referred for cardiac MRI assessment of suspected pericardial constriction, measurement of suprahepatic IVC cross-sectional area may be useful in confirming the diagnosis of constriction when used in combination with other imaging findings, including pericardial thickness and respirophasic septal shift.
Pericardial constriction is a relatively rare condition characterized by impedance to diastolic filling caused by a fibrotic, calcified, or thickened pericardium [1]. Although several diagnostic criteria have been proposed, the diagnosis of pericardial constriction remains challenging and is often delayed [2],[3].
Cardiac magnetic resonance imaging (MRI) is increasingly used as a diagnostic tool in the evaluation of patients with suspected constriction [4],[5]. Increased pericardial thickness (>4 mm) has been the predominant imaging criteria used to establish the diagnosis, however, approximately 18% of patients with constriction may have normal pericardial thickness [6]– [8]. The hemodynamic consequences of constriction can be assessed by cardiac MRI with the use of real time imaging to identify respirophasic septal shift and phase contrast imaging to detect discordant respirophasic variations in transmitral and tricuspid flow [9]– [11].
Measurement of inferior vena cava (IVC) size is an indirect method to assess the hemodynamic consequence of constriction and is readily measured from standard MRI sequences [12]. The suprahepatic IVC is normally similar in size to the descending aorta at the same level [13]. However, in patients with constriction the IVC may be dilated, suggestive of increased right atrial (RA) pressures and impaired diastolic filling of the right ventricle (RV) [12]–[15].
We hypothesized that an enlarged IVC cross-sectional area and increased IVC to aortic cross-sectional area ratio as assessed on cardiac MRI would be useful in establishing the diagnosis of pericardial constriction. The aim of the present study was to evaluate IVC dimensions in patients referred for cardiac MRI with clinically suspected pericardial constriction, and to determine the predictive value of these measurements in the diagnosis of constriction.
Materials and Methods
Patients and Protocol
This retrospective cohort study was approved by our institutional research ethics board. The requirement for patients’ signed informed consent was waived. A consecutive sample of patients who had undergone cardiac MRI for evaluation of clinically suspected pericardial constriction at a single center between 2005 and 2012 were identified retrospectively from an institutional database. Patients were excluded if they had clinical follow-up of less than 1 year after cardiac MRI, greater than moderate tricuspid or pulmonic regurgitation, any tricuspid or pulmonic stenosis, greater than mild pulmonary hypertension (pulmonary arterial systolic pressure ≥45 mm Hg), known restrictive cardiomyopathy, and known aortopathy or aortic dilation.
Data were abstracted on demographic characteristics, imaging findings, and clinical and surgical outcomes from the electronic patient record. The standard for establishing the diagnosis of pericardial constriction has been published previously [15], and included: 1) noninvasive imaging findings on transthoracic echocardiography (TTE) or cardiac MRI; 2) findings from invasive cardiac catheterization; and 3) intraoperative and histopathology findings along with a concordant clinical history. TTE criteria included early diastolic septal bounce, respirophasic septal shift, respirophasic variability in Doppler flow velocities across the mitral value of >25% or across the tricuspid valve of >40%, and hepatic vein diastolic flow reversal in expiration [16]. Hemodynamic evaluation on cardiac catheterization included left ventricular (LV) end-diastolic pressure – RV end-diastolic pressure difference of ≤5 mm Hg, pulmonary arterial systolic pressure <55 mm Hg, RV end-diastolic pressure/RV end-systolic pressure >1/3, inspiratory decrease in RA pressure <5 mm Hg, dynamic discordant respiratory variation between LV and RV pressure tracings, and systolic area index >1.1 [17]. Surgical findings included obliteration of the pericardial space and the presence of abnormal pericardial thickening and/or calcification. Histopathology findings included pericardial fibrosis, thickening, calcification, and/or inflammation.
A diagnosis of pericardial constriction was established if hemodynamic findings on cardiac catheterization were consistent with constrictive physiology, along with a concordant clinical presentation. If cardiac catheterization was unavailable, then other imaging findings including respirophasic septal shift on cardiac MRI or TTE, and/or other TTE criteria outlined above were used to establish the diagnosis. The diagnosis was then also confirmed based on surgical and histopathology findings when available.
The diagnosis of pericardial constriction was excluded based on absence of typical hemodynamic findings on cardiac catheterization, echocardiography and/or cardiac MRI as described previously. In addition, patients must not have had subsequent surgical pericardiectomy over the follow-up period of at least 1 year, nor further cardiac investigations for ongoing symptoms, such as repeat cardiac catheterization.
Cardiac MRI
Cardiac MRI studies were performed using a 1.5-T scanner (MAGNETOM Avanto, Siemens Healthcare, Erlangen, Germany) with commercially available cardiac phased-array coils. Short axis and axial steady-state free precession (SSFP) cine images were acquired to cover the entire LV volume. Typical imaging parameters were as follows: slice thickness 6-8 mm (0-2 mm gap); in-plane resolution 1.4 × 1.7 mm; temporal resolution 30-40 ms. One slice was acquired per end expiratory breath hold. Real time cine imaging in the mid short-axis plane was acquired during 10 seconds of free-breathing for visual assessment of early diastolic septal bounce and respirophasic septal shift (typical parameters were as follows: slice thickness 10 mm, in-plane resolution 2.5 × 2.5 mm).
Short axis late gadolinium enhanced (LGE) images were acquired using a 2-dimensional (2D) inversion recovery prepared gradient recalled echo sequence (IR GRE) 10 minutes after the intravenous administration of 0.1-0.2 mmol/kg bodyweight of Gadobutrol (Gadovist, Bayer Healthcare, Berlin, Germany) followed by a flush of 20 mL of saline at the same rate. The entire LV was covered in short-axis orientation from base to apex (8-10 slices), acquiring a single slice per end-expiratory breath-hold with the following typical imaging parameters: slice thickness 6-8 mm; in-plane resolution 1.8 × 1.4 mm; temporal resolution 160–200 ms.
Cardiac MRI Analysis
All cardiac MRI studies were analysed offline by an experienced observer blinded to clinical and patient information. Cross-sectional areas of the suprahepatic IVC and descending aorta were measured by manual contouring on a single axial SSFP image at the level of the esophageal hiatus in end-systole (Figure 1A). Measurements were also repeated in end-diastole at the same slice position for the purpose of comparison between cardiac phases (however, systolic IVC and aortic measurements were used in all other calculations). The ratio of IVC to aortic cross-sectional area was calculated. Cross-sectional areas were indexed to body surface area (BSA).
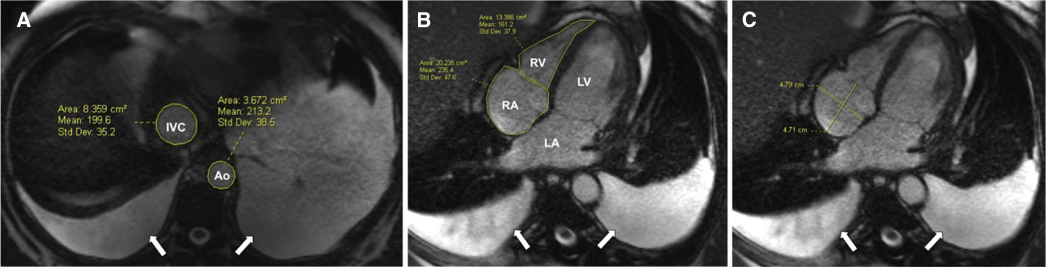
A 44-year old male with history of recurrent pleural and pericardial effusions and constrictive physiology with subsequent symptomatic relief following surgical pericardiectomy. (A) inferior vena cava (IVC) and aortic cross-sectional areas were determined by manual contouring on a single axial steady-state free precession image in end systole at the level of the esophageal hiatus. The IVC area was 8.4 cm2 while the aortic (Ao) area was 3.7 cm with an IVC to aortic area ratio of 2.3. (B) Right atrium (RA) and ventricle (RV) cross-sectional areas were determined by manual contouring and (C) RA dimensions (anterior-posterior and transverse) were measured on a 4-chamber image. Moderate bilateral pleural effusions were noted (arrows). This figure is available in colour online at http://carjonline.org/.
RA and RV areas were determined by manual contouring on a 4-chamber SSFP image at end-diastole (Figure 1B). RA anterior-posterior and transverse dimensions were also measured on the same slice (Figure 1C).
The presence of pericardial effusion was assessed on all available sequences. Maximum pericardial thickness was assessed on axial and short axis SSFP images at end-diastole [18]. Pericardial thickness of >4 mm was considered abnormal thickening, and if present, was scored as circumferential or localized [6],[7] (Figure 2A). The presence of pericardial enhancement was assessed on all available LGE images (Figure 2, B and C). The presence of respirophasic septal shift was evaluated on real time short-axis cine SSFP images [9].
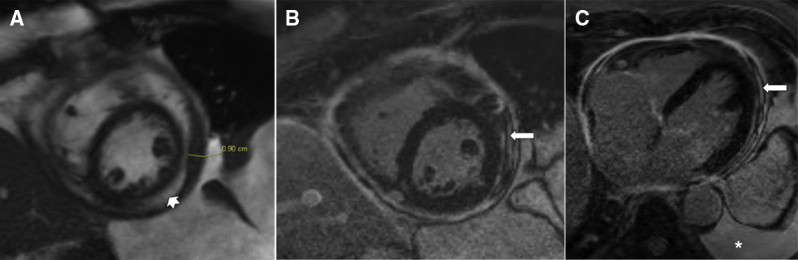
A 69-year old male with history of recurrent pleural effusions and constrictive physiology who subsequently underwent pericardial stripping. (A) Maximum pericardial thickness (9 mm) measured on short-axis steady-state free precession image. (B) Diffuse pericardial enhancement assessed on late gadolinium enhanced images (short axis [B] and axial [C], arrows). Large left pleural effusion (*) and small pericardial effusion (arrowhead) were also noted. The inferior vena cava area was 11.2 cm2 (not shown).
All cardiac MRI studies were reanalyzed for measurements of IVC and aortic cross-sectional areas by the same reader following a minimum 2-month interval, and by a second experienced observer blinded to the result of the initial assessment, for the purpose of assessing intra- and interobserver agreement of measurements.
Statistical Analysis
Statistical analysis was performed using SPSS software version 20 (IBM SPSS, Chicago, IL).
Continuous variables were described using mean ± standard deviation and categorical variables using frequency and percentage. Quantitative data were compared with a 2-sample t test or Mann-Whitney U test and qualitative data with Fisher's exact test. Univariable logistic regression analysis was used to determine odds ratios (ORs) for the association between various cardiac MRI features and the presence of constriction. A multivariable logistic regression model, which included both IVC to aortic area ratio and respirophasic septal shift, was also evaluated. Respirophasic septal shift was included in the model as it has been demonstrated to be one of the most important MRI parameters in establishing the diagnosis of constriction, and may be present even in the absence of increased pericardial thickness [9]. Nested models were used to compare the incremental value of IVC to aortic area ratio to respirophasic septal shift. The likelihood ratio test was used to test for significance. Receiver-operating characteristic (ROC) curves were generated to assess the optimal values of the various cardiac MRI parameters to discriminate those with and without pericardial constriction. Intra- and interobserver agreement was determined using intraclass correlation coefficient (ICC). A P value <.05 was considered statistically significant.
Results
Patients
Thirty-six patients were included; 50% (n = 18) had pericardial constriction and 50% (n = 18) did not (Table 1). Mean age was 53.9 ± 15.3 years, with no significant difference in age between those with and without constriction (P = .695).
Baseline demographics, clinical characteristics, and imaging findings
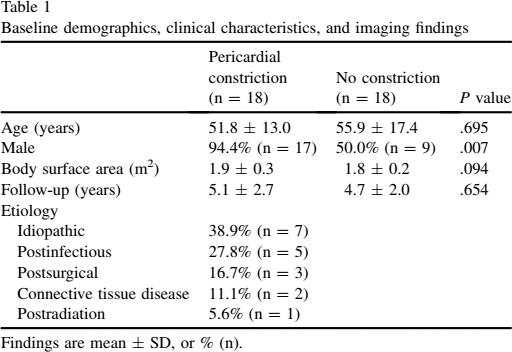
Findings are mean ± SD, or % (n).
Among the 18 patients with pericardial constriction, 10 (56%) had confirmation of the diagnosis by cardiac catheterization and echocardiography, 5 (28%) by cardiac catheterization alone, and 3 (17%) by echocardiography alone. Seventeen patients (94%) underwent surgical pericardiectomy, and in all cases surgical and histopathology findings were consistent with the diagnosis of pericardial constriction. One patient (6%) was booked for pericardiectomy, however, prior to operation he unfortunately decompensated and died prior to surgery.
Among the 18 patients who did not have pericardial constriction, cardiac catheterization was performed in 6 (33%) and TTE was performed in 16 (89%), and in all cases findings were negative for constriction. None of the patients without constriction had subsequent pericardiectomy or required further investigation for cardiac symptoms during the available follow-up period (4.9 ± 2.3 years).
Cardiac MRI Parameters
IVC area, indexed IVC area, IVC to aortic area ratio, RV area, indexed RV area, pericardial thickness, presence of pericardial enhancement, and presence respirophasic septal shift were all significantly different in patients with pericardial constriction compared to those without (Table 2). IVC and aortic measurements presented were obtained in end-systole.
Cardiac MRI findings in those with and without a final diagnosis of constriction
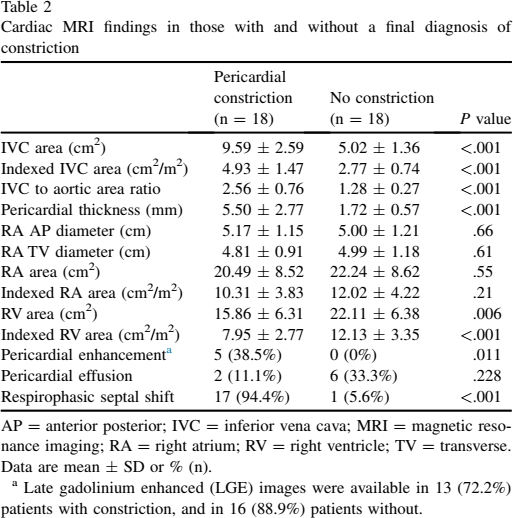
AP = anterior posterior; IVC = inferior vena cava; MRI = magnetic resonance imaging; RA = right atrium; RV = right ventricle; TV = transverse.
Data are mean ± SD or % (n).
Late gadolinium enhanced (LGE) images were available in 13 (72.2%) patients with constriction, and in 16 (88.9%) patients without.
Pericardial thickening (>4 mm) was identified in 77.8% (n = 14) of patients with constriction, and in none of the patients without. Thickening was circumferential in 57.1% (n = 8) and localized in 42.9% (n = 6).
Results of logistic regression analysis are presented in Table 3. IVC to aortic area ratio had the highest OR for the prediction of constriction (1070, 95% CI [8.0, 143 051], P = .005). In a multivariable model, respirophasic septal shift had an odds ratio of 57.8 (95% confidence interval [CI] [1.6-2 117], P = .027) while IVC to aortic area ratio had an odds ratio of 181.8 (95% CI [0.9-36 563], P = .055). In nested models, the predictive power of respirophasic septal shift for pericardial constriction was significantly strengthened by the addition of the IVC to aortic ratio (–2 log-likelihood values were 15.5 and 9.2, respectively, P = .012).
Odds ratios of cardiac MRI features for the prediction of pericardial constriction
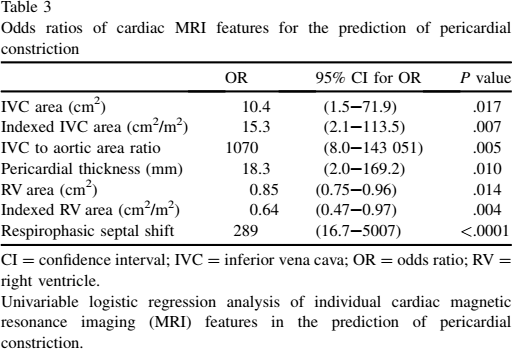
CI = confidence interval; IVC = inferior vena cava; OR = odds ratio; RV = right ventricle.
Univariable logistic regression analysis of individual cardiac magnetic resonance imaging (MRI) features in the prediction of pericardial constriction.
ROC analysis of various cardiac MRI features is presented in Table 4. IVC to aortic area ratio and IVC area had the highest areas under the curve, 0.96 (95% CI [0.91-1.00]) and 0.97 (95% CI [0.92-1.00]), respectively (Figure 3). For the diagnosis of constriction, cutoff values of >1.8 for IVC to aortic area ratio and >7.0 cm2 for IVC area had sensitivities of 89% and 94%, respectively, and specificities of 94% and 89%, respectively.
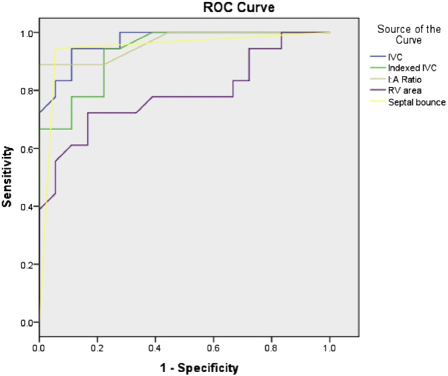
Receiver operating characteristic (ROC) curves for suprahepatic inferior vena cava (IVC) cross-sectional area (blue), IVC cross-sectional area indexed to body surface area (green), IVC to aortic cross-sectional area (I:A) ratio (brown), right ventricular (RV) area (purple), and respirophasic septal shift (yellow). Areas under the curve and 95% confidence intervals are 0.968 [0.92-1.00], 0.932 [0.86-1.00], 0.963 [0.91-1.00], 0.785 [0.63-0.94], and 0.944 [0.86-1.00], respectively. This figure is available in colour online at http://carjonline.org/.
Diagnostic accuracy of cardiac MRI features for pericardial constriction
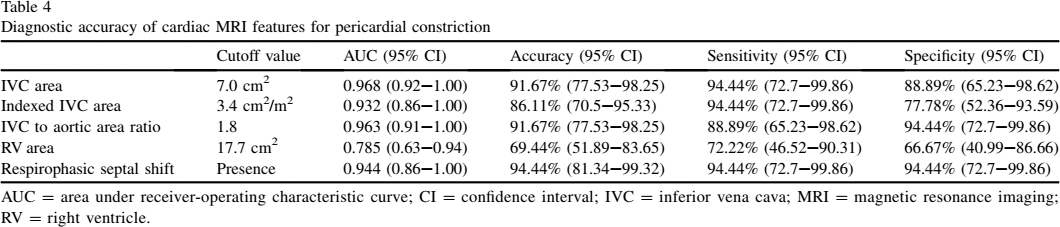
AUC = area under receiver-operating characteristic curve; CI = confidence interval; IVC = inferior vena cava; MRI = magnetic resonance imaging; RV = right ventricle.
When measurements in end-diastole were compared with those in end-systole, there was no significant difference in IVC cross-sectional area (7.27 ± 3.12 cm2 vs. 7.38 ± 3.20 cm2, P = .279). However, IVC to aortic area ratio was significantly higher when calculated from end-diastolic measurements (2.19 ± 1.06 vs. 1.98 ± 0.90, P < .001), driven by a significantly lower aortic cross-sectional area (3.51 ± 0.92 cm2 vs. 3.89 ± 0.96 cm2, P < .001).
Among patients with pericardial constriction, there was no significant difference in IVC area or indexed IVC area between males and females (P = .672 and P = .889, respectively).
High levels of intra- and inter-observer agreement were achieved for IVC area (ICC 0.90, 95% CI [0.81-0.95] and 0.88, 95% CI [0.78-0.94], respectively), aortic area (ICC 0.94, 95% CI [0.88-0.97] and 0.91, 95% CI [0.82-0.95], respectively), and IVC to aortic area ratio (ICC 0.90, 95% CI [0.81-0.95] and 0.89, 95% CI [0.80-0.94], respectively).
Discussion
This study illustrates that in patients referred for cardiac MRI with suspected constriction, measurements of suprahepatic IVC parameters have good discriminative value in identifying patients with pericardial constriction from those without. Among the imaging parameters evaluated, the ratio of systolic IVC to aortic cross-sectional area had the highest OR and area under the ROC curve for the diagnosis of pericardial constriction, and had incremental value when compared to assessment of respirophasic septal shift alone.
Despite advances in imaging techniques, the diagnosis of pericardial constriction remains a clinical challenge. Impaired ventricular filling is also noted in diseases that reduce myocardial compliance, such as restrictive cardiomyopathies, and their clinical presentation may be similar to that of pericardial constriction. Timely differentiation between these 2 entities is imperative, as treatment and prognosis differ markedly [19]. Pericardial constriction is potentially correctable with surgical pericardiectomy, while restrictive cardiomyopathy is treated medically and usually portends a worse prognosis [20]. Although patients with pericardial constriction and restrictive cardiomyopathy may have similar clinical presentations, differentiation between the 2 conditions is usually feasible with advanced imaging techniques [19],[21].
TTE has traditionally been regarded as the clinical standard for the noninvasive evaluation of pericardial constriction. However, evaluation with echocardiography can be limited by poor acoustic windows and may miss the diagnosis of constriction in some patients [2]. In our cohort, constriction was identified on TTE studies in only 73% of patients with that final diagnosis.
Cardiac MRI is increasingly used in the evaluation of patients with suspected constriction. The American College of Cardiology Foundation Appropriateness Criteria Working Group considers evaluation of pericardial constriction to be an appropriate indication for cardiac MRI [22]. Cardiac MRI provides additional information such as the ability to accurately measure thickness of the entire pericardium, evaluation of the extent of pericardial involvement, and assessment of pericardial enhancement with contrast enhanced sequences. In addition, tissue characterization techniques such as late gadolinium enhanced imaging can readily help identify myocardial pathology associated with restrictive cardiomyopathy (eg, cardiac amyloidosis). Therefore the challenge with cardiac MRI is not usually in differentiating restrictive cardiomyopathy from pericardial constriction [19],[21], but to confirm the presence of constriction in patients with moderate pretest likelihood of disease, especially in the absence of increased pericardial thickness. The latter depends on the ability to identify the hemodynamic consequences of constriction, which have been mainly limited to the presence of early diastolic septal bounce and respirophasic septal shift [9],[23],[24]. Although considered to be reliable signs of pericardial constriction, the evaluation of these parameters can be subjective, depends on loading conditions, and requires cine or real time imaging for evaluation, ideally with respiratory maneuvers. Therefore more objective readily obtainable measurements of the hemodynamic changes associated with constriction are still needed.
We confirm the value of previously established MRI parameters including right ventricular area, pericardial thickness, respirophasic septal shift, and pericardial enhancement in differentiating between patients with pericardial constriction from those without. In addition, we demonstrate use of objective and readily obtainable hemodynamic parameters including IVC cross-sectional area and the ratio of IVC to aortic cross-sectional area obtained from cardiac MRI images. Measurements of suprahepatic IVC and aortic cross-sectional areas are easily obtained from cardiac MRI images that are acquired in routine clinical practice, and are reproducible with high interobserver agreement. There was no significant difference in IVC area measured in end-diastole compared with end-systole, suggesting that this measurement may be applied even on non-ECG gated studies.
The results of this study are concordant with previously published cardiac computed tomography measurements, confirming high sensitivity and moderate specificity of IVC area for the diagnosis of pericardial constriction [15]. In this study, the area under the ROC curve was optimal when using a systolic IVC cross-sectional area cutoff of 7.0 cm2 (area under the curve = 0.97) or IVC to aortic area ratio cutoff of 1.8 (area under the curve = 0.96).
Measurements of IVC cross-sectional area may be most useful in the evaluation of patients with suspected pericardial constriction in the absence of other imaging features such as increased pericardial thickness [8]. In our cohort, 20% (n = 4) of subjects with pericardial constriction had normal pericardial thickness (<4 mm). In all 4 cases, the ratio of IVC to aortic cross-sectional area was >1.8 (range 2.2-4.0).
There are several limitations to our study, including the fact that it was retrospective and had a relatively small sample size. The MRI imaging protocol was not prospectively devised and was therefore subject to minor interstudy variability in technique. All patients included in the study had clinically suspected pericardial constriction based on clinical findings and/or history, and therefore the sensitivities and specificities provided in this study are for differentiating patients with constriction from those without in a group with high pretest likelihood of disease. Since sensitivities and specificities were calculated from the same population in which the cut-off values were determined, these estimates are likely optimistic. Dilation of the IVC may be noted in other conditions including restrictive cardiomyopathies and severe tricuspid regurgitation. The diagnostic performance of the proposed measures of IVC cross-sectional area remains to be evaluated in a study comparing the sensitivity and specificity of these measures in differentiating pericardial constriction from restrictive cardiomyopathy.
Conclusion
We demonstrate that measurement of suprahepatic IVC cross-sectional area by manual contouring on cardiac MRI is a useful adjunct in establishing the diagnosis of pericardial constriction. IVC cross-sectional area is sensitive for the diagnosis of constriction and we propose an optimal cut-off value of 7 cm2 for absolute IVC area or 1.8 for the ratio of IVC to aortic cross-sectional areas measured at end-systole. The prognostic significance of these measures remains to be determined in a prospectively enrolled cohort.