
Abstract
Introduction
To establish the diagnostic performance of the parameters obtained from dynamic contrast-enhanced magnetic resonance imaging (DCE-MRI) and diffusion-weighted imaging at 3T in discriminating between non-clinically significant prostate cancers (ncsPCa, Gleason score [GS] < 7) and clinically significant prostate cancers (csPCa, GS ≥ 7) in the peripheral zone.
Materials and Methods
Twenty-six male patients with peripheral zone prostate cancer (PCa) who had undergone 3T multiparametric magnetic resonance imaging (MRI) scan prior to biopsy were included in the study and evaluated retrospectively. The GS was obtained by both standard 12-core transrectal ultrasound guided biopsy and targeted MRI-US fusion biopsy and then confirmed by prostatectomy, if available. For each confirmed tumour focus, DCE-derived quantitative perfusion metrics (Ktrans, Kep, Ve, initial area under the curve [AUC]), the apparent diffusion coefficient (ADC) value, and normalized versions of quantitative metrics were measured and correlated with the GS.
Results
Ktrans had the highest diagnostic accuracy value of 82% among the DCE-MRI parameters (AUC 0.90), and ADC had the strongest diagnostic accuracy value of 87% among the overall parameters (AUC 0.92). The combination of ADC and Ktrans have higher diagnostic performance with the area under the receiver operating characteristic curve being 0.98 (sensitivity 0.94; specificity 0.89; accuracy 0.92) compared to the individual evaluation of each parameter alone. The GS showed strong negative correlations with ADC (r = −0.72) and normalized ADC (r = −0.69) as well as a significant positive correlation with Ktrans (r = 0.69).
Conclusion
The combination of Ktrans and ADC and their normalized versions may help differentiate between ncsPCa from csPCa in the peripheral zone.
Prostate cancer (PCa) is the second leading cause of cancer-related death among Western men [1]. A significant proportion of prostatic carcinomas are non-aggressive, low-grade tumours (Gleason score [GS] ≤6), usually defined as non-clinically significant PCa (ncsPCa). These tumours have a low incidence of progression and have a chance to be cured through increasingly accepted, new conservative treatment approaches which eliminate the serious side effects of radical treatment protocols. Therefore, it is crucial to diagnose tumour aggressiveness or, in other words, to correctly differentiate ncsPCa from clinically significant prostate cancer (csPCa), usually defined as GS ≥ 7, to apply the appropriate treatment modalities and reduce overtreatment or ineffective treatment results [2,3]. The Gleason score, which is typically obtained through invasive methods such as prostate biopsy or pathologic prostatectomy specimens, is today the most accepted and widespread method of determining PCa's aggressiveness and has been adopted as the most important predictor of patient outcomes [4].
To bypass invasive biopsy, researchers have been studying multiparametric magnetic resonance imaging (MRI) sequences, in particular diffusion-weighted imaging (DWI) and dynamic contrast-enhanced magnetic resonance imaging (DCE-MRI), as a noninvasive and easily applicable diagnostic tool with which to determine the aggressiveness of prostate cancer. Although some studies point to significant differences in quantitative values between GS subgroups [5–7], there is no definitive consensus. In DCE metrics, the cut-off values for the volume transfer constant (Ktrans) are highly variable, with large overlaps in DCE metrics [8–11]. Although apparent diffusion coefficient (ADC) can predict the aggressiveness of prostate cancer, the ranges of ADC values have again demonstrated significant overlaps within the same GS groups in some reported studies [7,12]. Differences in methodology and technical factors (using different b values, the type of contrast agent used, coil type, noise, data processing, etc), patient-specific differences (age, cellular density, changes in the water content of prostate tissue), and pathological heterogeneity of malignant prostate lesions have made the widespread clinical use of DCE-MRI and DWI difficult to determine PCa aggressiveness. To avoid these inconsistencies and standardize the quantitative metrics, normalized values (the quantitative parameter ratio between the cancer foci and non-tumoural peripheral zone prostatic tissue) were also evaluated in this study. Several earlier studies demonstrated that normalized ADC (nADC) had a better correlation with GS than mean ADC value [12,13] as well as a favourable impact on diagnostic performance [14].
In this study, our purpose is to investigate whether quantitative perfusion parameters derived from DCE-MRI, ADC values from DWI, and their normalized measurements allow the discrimination of ncsPCa from csPCa in the peripheral zone.
Materials and Methods
Patient Characteristics
The local ethics committee approved this retrospective study without the need for written informed consent. Thirty-three male patients with PCa who underwent multiparametric prostate MRI prior to biopsy between January 2017-May 2018 were identified. All biopsies were performed by the same radiologist, who had 20 years of experience in this field. After a standard 12-core transrectal ultrasound guided (TRUS) biopsy, a MRI-US real-time fusion computerized needle navigation biopsy was performed on 3 instances for each suspicious lesion (confined to suspected lesions, defined as Prostate Imaging Reporting and Data System 3 or above on multiparametric MRI) [2]. Histopathologic specimens were classified with the Gleason scoring system. Lesions with GS of 7 or higher were classified as csPCa, whereas those with GS of 6 or less were classified as ncsPCa (Figure 1) [15]. Prior to biopsy, all of the patients underwent a multiparametric MRI at 3-T, and their prostate-specific antigen levels were recorded. The mean time between the MRI examination and biopsy was 18 days (range 11-33 days). Half of the patients in our study underwent locoregional therapy or conservative treatment without surgery, whereas the other half underwent prostatectomy. Thus, the GS was based on biopsy samples for half of the patients. Following prostatectomy in half of the patients, GSs obtained from biopsy were correlated with the subsequent prostatectomy specimens. No tumour was upgraded or downgraded after prostatectomy. The mean time between the MRI examination and prostatectomy was 31 days (range 7-45 days).

A 61-year-old man with biopsy proven prostate cancer (Gleason score [GS] of 6) in the right peripheral zone. Axial T1-weighted magnetic resonance (MR) image and superimposed color coded Ktrans map (A) in tumoural region. Quantitative values of the perfusion parameters are located in the lower left corner of the figure. Apparent diffusion coefficient (ADC) value (B) is 0.98 × 10⁻³ mm2/s. A 59-year-old man with biopsy and radical prostatectomy proven prostate cancer (GS of 8) in the right peripheral zone. T1-weighted axial MR image and superimposed color coded Ktrans map (C) in tumoural region. Higher Ktrans, Kep, and initial area under the curve values are remarkable. ADC value (D) is 0.57 × 10⁻³ mm2/s.
MRI Acquisition
Multiparametric MRI was performed prior to each biopsy using a 3-T MRI system (Magnetom Verio, Siemens Healthinieers, Erlangen, Germany) with a 16-channel body matrix coil. The MRI protocol included high-resolution T2-weighted turbo spin-echo images in 3 orthogonal planes, axial turbo spin-echo T1-weighted images, axial echo-planar diffusion-weighted images with variable b values (0, 400, 800, and 1400 s/mm2), and axial T1-weighted 3D volumetric interpolated breath-hold examination images for DCE, in accordance with recent guidelines [2]. The DCE parameters were as follows: 3.6 mm slice thickness, no intersection gap, 5.28:1.8 ratio of time of repetition to time of echo, 15° flip angle, 26 × 26 cm field-of-view, and 160 × 160 matrix size. The temporal resolution for each set ranged from 10 s-13 s, and approximately 19-24 series were obtained, which lasted total 4 minutes. A dynamic series was begun with 2 initial non-contrast series, and then a bolus injection of 0.2 mmol/kg Gadoteric acid (Dotarem, Guerbet, France) followed by a 20 mL saline injection were performed with an automatic injector (Spectris Solaris, Medrad) at a rate of 4 mL/s.
Post-processing, image interpretation, and data analysis
The datasets were transferred to a workstation and evaluated by 2 experienced radiologists (by E.C., with more than 5 years of experience in abdominal imaging, and by Y.O., with more than 15 years of experience in abdominal imaging) in consensus with knowledge of the pathology results. The quantitative parameters (Ktrans, Kep, Ve, and initial area under the curve [iAUC] values) were derived with commercial software (Tissue4D, Siemens AG, Erlangen) based on the Tofts model. Three population-averaged arterial input function (AIF; biexponential functions with fast, intermediate, and slow models) are used in Tofts modelling. AIF, which gives the most appropriate signal time curve (intermediate type), was selected for the relevant lesions and was applied to calculate the kinetic parameters [16]. As a result, 4 quantitative parameters were measured for each lesion: Ktrans (the volume transfer constant) represents the contrast agent transference from the blood plasma to the extravascular extracellular space (EES), Kep (the washout coefficient) represents the contrast agent wash-out transference from the EES to the blood plasma, Ve (the EES volume fraction) represents the volume of interstitial space or extravascular extracellular fractional volume, and iAUC shows the area under the kinetic curve. Regions of interest (ROI) were first placed manually in the largest histopathologically confirmed peripheral-zone tumour areas possible with the help of early enhancing areas in DCE-MRI, the approximate localization of both standard 12-core TRUS or MRI-fusion biopsy, reference images (through diffusion restriction on the ADC map or hypointense area relative to the adjacent parenchyma on T2-weighted images), and anatomic landmarks (such as the urethra, prostatic capsule, and ejaculatory ducts) through consensus. Then, ROIs were placed in approximately histopathologically confirmed, normal-appearing, benign peripheral zone areas to obtain normalized values. Normalized quantitative parameters were obtained by dividing the tumoural region values by the peripheral zone values.
ADC maps were constructed from DWI images by using the mono-exponential model on a voxel-wise basis. The ADC values were directly measured on these parametric ADC maps. ROIs were drawn in approximately histopathologically confirmed hypointense areas, which encircled the tumour totally, with the help of described landmarks and the help of other magnetic resonance (MR) images. The level of the ADC map with the largest tumour size was chosen for evaluation. The ROI was drawn, excluding tumour edges, for each lesion. Then, ROIs of the same size were again drawn for histopathologically confirmed, normal-appearing, benign peripheral zone areas to obtain the nADC values (the ADC ratio between the cancer focus and benign non-tumoural region).
Statistical analysis
Statistical analysis was performed using SPSS version 23 (IBM, Armonk, NY, United States). The data were shown as medians with interquartile ranges (IQR). The categorical variables were summarized as proportions. Differences in the median ADC values and the quantitative DCE parameters between GS groups were tested using Mann-Whitney U-tests. Pearson's chi-square test was performed for categorical variables. Spearman's correlation analysis was performed to assess the correlations among ADC values, quantitative perfusion parameters, and additionally GS to reflect the aggressiveness when more than 1 lesion per patient is taken into account.
Receiver operating characteristic (ROC) analysis and areas under the curve (AUCs) were obtained to assess the discrimination ability of each parameter for ncsPCa versus csPCa. The best cut-off point was determined by using the Youden S index. P < .05 was considered statistically significant.
Results
The initial group consisted of 33 patients. Among these patients, 4 cases were excluded for the transition zone location of the lesions, 1 case was excluded for the artefacts present due to a metallic hip implant, and 2 were excluded for haemorrhagic signal intensities due to prior biopsies and treatment for PCa. Finally, the group consisted of 26 patients (median age 68 years; IQR 62–71 years) with overall 38 tumoural foci (20 ncsPCa, Gleason scores [GS] <7; 18 csPCa, GS ≥ 7) in the peripheral zone. None of these 26 patients had previously been treated for prostate cancer. In the csPCa group (18 lesions), 2 had a GS of 3 + 4 (11%), 4 had a GS of 4 + 3 (22%), 8 had a GS of 4 + 4 (44.5%), 3 had a GS of 4 + 5 (17%), and 1 lesion had a GS of 5 + 4 (5.5%). The median prostate-specific antigen levels were 5.83 ng/mL (IQR 5.13–9.26) for the ncsPCa group and 11.25 ng/mL (IQR 7–14.11) for the csPCa group (P < .012). Estimated from both T2-weighted images and ADC maps, the median volumes of lesions were calculated as 0.59 cm3 in the ncsPCa group and 0.75 cm3 in the csPCa group (P > .05). The median values of maximum length of lesions were 12.23 mm (IQR 9.25–17.5) in the ncsPCa and 13.22 mm (IQR 11.75–16.00) in the csPCa group (P > .05). In total, no tumour was upgraded or downgraded after prostatectomy, but in addition, 3 patients (11%) with csPCa had 3 GS of 3 + 3 tumor foci identified on prostatectomy specimens only, and these lesions could not be detected on MR images.
Quantitative DCE-MRI Parameters
Comparisons of the median quantitative values of Ktrans, Kep, and iAUC showed statistically significant differences between the ncsPCa and csPCa groups (P < .05). For these parameters, Ktrans in csPCa (median 0.94 min−1, Inter quartile range [IQR] 0.85-1) was significantly higher than that of ncsPCa (0.54 min−1, 0.46–0.67), Kep in csPCa (1.58 min−1, 1.22–1.97) was significantly higher than that of ncsPCa (0.99 min−1, IQR 0.84–1.37), and the iAUC value in csPCa (43.37 mmol/L/min, 37.41–48.69) was significantly higher than that of ncsPCa (29.61 mmol/L/min, IQR 16.13–36.3). No significant difference was found for Ve value between the csPCa and ncsPCa groups (P > .05). Table 1 summarizes the median values for each group along with IQRs and other statistical parameters.
Descriptive values and diagnostic performance of quantitative dynamic contrast-enhanced MRI and apparent diffusion coefficient parameters

ADC = apparent diffusion coefficient; AUROC = area under the receiver operating characteristics; CI = confidence interval; GS = Gleason score; iAUC = initial area under the curve; IQR = interquartile range; Kep = rate constant; Ktrans = volume transfer constant; NPV = negative predictive value; PPV = positive predictive value; Ve = the extravascular extracellular fractional volume.
P value represents whether there is a significant difference between GS groups. P < .05 is assumed to be statistically significant.
Determined by the Youden index.
The ROC curve analysis revealed that Ktrans had the best discriminating performance between ncsPCa and csPCa for both the semi-quantitative and quantitative parameters (Figure 2). The area under the receiver operating characteristic (AUROC) curves were 0.90 (95% confidence interval [CI]: 0.79–1.00), 0.80 (95% CI: 0.66–0.95), and 0.84 (95% CI: 0.71–0.97) for Ktrans, Kep, and iAUC, respectively. The optimal cut-off values were as follows: Ktrans = 0.68 min−1 (sensitivity, 0.83; specificity, 0.80), Kep = 1.07 min−1 (0.89–0.70), iAUC = 35.04 mmol/L/min (0.83–0.75).
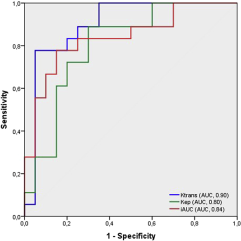
Receiver operating characteristic (ROC) curve analysis of Ktrans, Kep, and initial area under the curve. The area under the ROC (AUROC) curves suggested all three metrics are reasonable predictors in discriminating between non-clinically significant prostate cancers (ncsPCa, Gleason score [GS] < 7) and clinically significant prostate cancers (csPCa, GS ≥ 7).
Apparent diffusion coefficient values
The ADC in csPCa (0.58 × 10⁻³ mm2/s, IQR 0.47–0.72) was significantly lower than that of ncsPCa (0.94 × 10⁻³ mm2/s; IQR 0.88–1.16, P < .05). The best cut-off value was 0.76, with an AUROC curve of 0.92 (95% CI: 0.82-1), sensitivity of 85%, and specificity of 89% (Table 1, Figure 3). The ADC value was the most powerful metric for discrimination of csPCa from ncsPCa among all of the parameters.
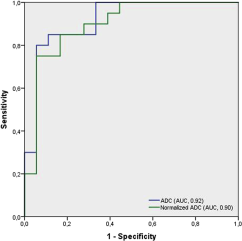
Receiver operating characteristic (ROC) curves and corresponding area under the ROC curves (AUC) of apparent diffusion coefficient (ADC) and normalized ADC (nADC value in discriminating between non-clinically significant prostate cancers (ncsPCa, Gleason score [GS] < 7) and clinically significant prostate cancers (csPCa, GS ≥ 7).
Normalized quantitative parameters
All normalized quantitative DCE parameters except normalized Kep (nKep) showed clinically significant differences between ncsPCa and csPCas (Table 1, Figure 4). The most powerful discriminative parameter among the normalized quantitative DCE parameters was the normalized Ktrans (nKtrans) value (AUC 0.81; P = .001), with a sensitivity of 0.89, a specificity of 0.75, a positive predictive value of 0.75, and a negative predictive value of 0.67. The nADC value was significantly lower in patients with csPCa than in those with ncsPCa (0.29, IQR 0.25–0.38 vs 0.52, IQR 0.41–0.61, P = .001). The AUROC curve was 0.90 (with higher specificity [0.83] and negative predictive value [0.83], as compared to the other normalized parameters), which suggested that the nADC value was the strongest predictor among the normalized parameters for differentiating csPCa from ncsPCa (Figure 3). Best cut-off values were as follows: nKtrans = 5,07, normalized Ve (nVe) = 1.43, normalized iAUC = 3.59, and nADC = 0.39.
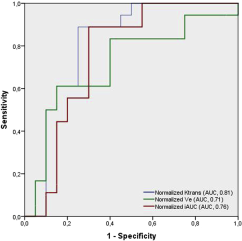
Receiver operating characteristic (ROC) curves and corresponding area under the ROC (AUROC) curves of normalized Ktrans (nKtrans), normalized Ve (nVe) and normalized initial area under the curve that showed statistically significant differences between clinically significant prostate cancer (csPCa, Gleason score [GS] ≥ 7) and non-clinically significant prostate cancers (ncsPCa, GS < 7).
Combination of DWI and DCE Parameters
The combination of Ktrans with ADC value made a statistically significant contribution, as compared to either parameter evaluation alone, in differentiating csPCas (P < .001) (Table 2). The AUROC curve value was 0.98 (95% CI 0.94-1), with sensitivity of 94%, specificity of 90%, positive predictive value of 90%, negative predictive value of 94%, and accuracy of 92% for the combined Ktrans and ADC, which suggested that the combination was reasonable predictor for differentiating csPCa from ncsPCa. Of interest, the combination of nKtrans and nADC had the highest diagnostic accuracy (AUROC curve 0.90; 95% CI, 0.79-1; sensitivity 0.89; specificity 0.90) compared to either normalized parameter alone. Table 2 summarizes the diagnostic statistical significance levels of the combined parameters.
Combination of DCE-MRI and DWI parameters
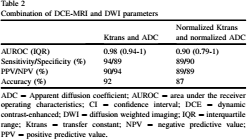
ADC = Apparent diffusion coefficient; AUROC = area under the receiver operating characteristics; CI = confidence interval; DCE = dynamic contrast-enhanced; DWI = diffusion weighted imaging; IQR = interquartile range; Ktrans = transfer constant; NPV = negative predictive value; PPV = positive predictive value.
Linear correlations
GS showed a statistically significant negative correlation with ADC (r = −0.72, P < .001) and nADC (r = −0.69, P < .001) and significant positive correlations with Ktrans (r = 0.69, P < .001), Kep (r = 0.52, P < .001), iAUC (r = 0.59, P < .001), and nKtrans (r = 0.54, P < .001). Ktrans value also showed a significant negative correlation with the ADC (r = −0.52, P = .001), and nKtrans value showed a significant negative correlation with nADC (r = −0.47, P = .003). Among DCE-MRI parameters, Ktrans showed a strong correlation with iAUC (r = 0.91, P < .001). Table 3 summarizes the correlation coefficient values of the parameters.
Correlation between quantitative DCE-MRI and ADC parameters
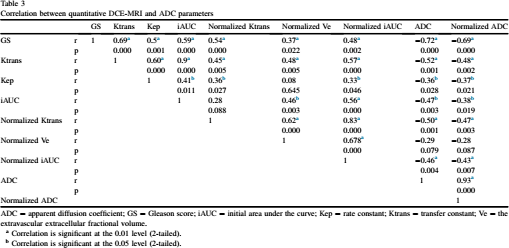
ADC = apparent diffusion coefficient; GS = Gleason score; iAUC = initial area under the curve; Kep = rate constant; Ktrans = transfer constant; Ve = the extravascular extracellular fractional volume.
Correlation is significant at the 0.01 level (2-tailed).
Correlation is significant at the 0.05 level (2-tailed).
Discussion
In this study, besides having the highest correlation with GS (r = 0.69), Ktrans also showed the best diagnostic performance, with an AUROC curve of 0.90 (cut-off value 0.68, sensitivity of 83%, specificity of 80%) in all DCE parameters. Ktrans in csPCa (median 0.94; IQR 0.85-1) was significantly higher than in ncsPCa (median 0.54, IQR 0.46–0.67). Similarly, the Kep and iAUC values in csPCa were significantly higher than those in ncsPCa and showed moderate correlations with GS (r = 0.52 and 0.55, respectively). Increased capillary permeability, microvascular fractional volume, and leaky endothelial neoangiogenesis have been shown to increase Ktrans and Kep values in tumors with higher GS due to their synergistic effect [17,18]. Although this is consistent with some previous studies [7,8,19], there is a wide range of reported findings, especially causing confusion for the use of Ktrans in routine clinical practice [9,10,20] (Table 4). Cho et al [5] studied a similar small group and obtained significant differences for mean values of Ktrans and Kep in differentiating high-grade tumours (GS > 7) from both low- and intermediate-grade tumours (GS ≤ 7), both in the peripheral zone and among central gland lesions, without reporting subgroup numbers. Compared with our study, they reported lower sensitivity values for both parameters (sensitivity/specificity of 0.57/0.82 for Ktrans and 0.71/0.65 for Kep, respectively). Furthermore, among the reported correlation coefficients between GS and quantitative parameters, only Kep was slightly higher, whereas Ktrans and iAUC were significantly lower, in contrast to our results. Chen et al [20] separated the GS subgroups similarly to in our study but reported no significant differences between low- and high-grade tumours in terms of Ktrans, Kep, and Ve values, nor any correlations with GS. The Ktrans for low-grade tumours reported in their protocol was also similar to ours (0.56 ± 0.12), but for high-grade tumours, the Ktrans value (0.60 ± 0.17) was lower than that of the present study. Sanz-Requina et al [11] studied a similar small group and reported no clinically significant differences between GS of 6 and GS of 7 for Ktrans, Kep, or Ve. Similar to the studies described above, Oto et al [10] reported no significant correlation between GS and quantitative perfusion parameters and did not clarify the mean or median values for the subgroups.
Summary of patients cohorts, study design, and interpretation scheme of some studies from literature

AIF = arterial input function; AUC = area under the ROC curve; Kep = rate constant; Ktrans = volume transfer constant, N/A, not applicable; RP = radical prostatectomy; T = tesla; Ve = the extravascular extracellular fractional volume.
Some studies included the lesions in both peripheral zone and central gland. While writing the number of patients and lesions, it was tried to exclude those located in the central gland if possible.
This poor agreement between all of these studies in determining tumour aggressiveness depending on the mean values, correlation coefficients, and cut-off values of the perfusion parameters obtained by DCE-MRI is likely multifactorial (Table 4). Besides the variety in GS distribution and patient population, differences in DCE methodology such as MRI acquisition protocol, temporal resolution, length of acquisition and type of gadolinium contrast agent may be causes of this discrepancy (Table 4). The major components which determine the image quality are length of acquisition and temporal resolution. The length of DCE acquisition should be long enough to allow optimal curve fitting. Duration of acquisition for DCE-MRI was so variable in literature, and most of them had a scan duration of more than 5 minutes [9,10,19,21] which makes the scanning uncomfortable for patients. Hauth et al [7] revealed statistically significant differences for the values of Ktrans and Kep between GS of 6 and GS ≥ 7 lesions with a shorter DCE-MRI acquisition time (4.23 min), similarly with this study. Kep, reverse reflux rate constant between extracellular space and plasma, in other words, the quantitative wash-out metric, was adequate for both studies. When it comes to temporal resolution, authors [2] recommend a temporal resolution of lower than 15 seconds for optimum imaging. By the help of developing the technical properties, temporal resolution has been improving. Shorter temporal resolution may produce more reliable results in assessing the aggressiveness of PCa, because it allows for a more accurate evaluation of the enhancement curve and early enhancement point. Peng et al [19] used a temporal resolution of lower than 6s and similarly with this study, they reported that Ktrans value showed a statistically significant difference between GS 6 and GS ≥ 7 lesions. Our temporal resolution of 10 s was a little bit longer compared to the study of Peng et al [19]. It is known that temporal resolution can be improved at the expense of less spatial resolution and a lower signal-to-noise ratio. In our experience, the balance between temporal resolution and signal-to-noise ratio determines the optimal imaging protocol for DCE-MRI. Currently, with the usage of these parameters within optimum limits, it is hoped that there will be standardization in technical properties of DCE-MRI to implement across all the institutions.
The AIF measurement is another discussion topic in DCE-MRI. Although the individual AIF measurement is known to be ideal and more effective, many software packages do not allow reliable measurement because individual AIF is more affected by T2* effects than generalized AIF due to the decreasing signal intensity at high concentrations of gadolinium. At tissue concentrations, the T2* effect on the T1W signal is minimal, and population-averaged AIF pharmacokinetic model calculations encompasess measurement of low signal intensity due to low contrast media in tissue [22]. On the other hand, the lack of suitable artery in the region of interest or difficulty in detecting it prevents to obtain a reliable individual AIF in each measurement [22]. Therefore, the use of the population-averaged AIF has become more widely accepted in clinical settings and has become the preferred method in recent years [7,9,19,20] (Table 4). It has also been shown that population-averaged AIF can generate reproducible [23] pharmacokinetic estimates, and when compared to individual AIF, similar, reliable values were obtained [24]. Because of these reasons, in the present study, population-averaged AIF was used as an easily applicable and reliable approach to minimize variation and reduce measurement errors.
It is obvious that the wide variety of quantitative parameters obtained from the pharmacokinetic model and the lack of standardization in postprocessing and interpretation methods hinder the generation of cut-off values to be used in routine clinical practice. Obtaining normalized quantitative values by dividing tumoural region values with normal-appearing peripheral region values, a similar approach to the one used for brain perfusion imaging, may be implemented to overcome those difficulties. In the literature, only 1 study [11] reported statistically significant differences between GS 6 and GS 7 groups for normalized versions of Ktrans, upslope, and AUC60, without specifying the mean, median, or cut-off values of the GS subgroups. In the present paper, the diagnostic performance of normalized versions of Ktrans, Ve, and iAUC showed statistically significant differences between the GS groups, but AUROC values were lower than those of absolute values. Depending on the results, we can only say that normalization of Ktrans and iAUC measurements may boost sensitivity only. Normalization of measurements as a potential tool in DCE-MRI needs to be reevaluated with larger cohort studies.
Prior studies have identified the ADC value as an independent predictor of prostate cancer aggressiveness [9,25,26] (Table 5), and as a promising parameter for determining the timing of progression and radical treatment in prostate cancers requiring active surveillance [27]. In accordance with them, regarding the diagnostic performance of the overall DWI and DCE-MRI metrics in discriminating csPCa from ncsPCa, the ADC value showed the best diagnostic performance (cut-off value 0.76, sensitivity of 85%, specificity of 89%, and AUROC curve of 0.92) and the highest correlation (a negative value) with GS (r = −0.721, P < .000). As a result of increased cellularity, the narrowing of intercellular space due to atypia, and increased mitotic activity, diffusion restriction is more prominent in high-grade tumours. Some studies [27] have also shown that the ADC value was an independent predictor of upgrading in follow-up biopsies in ncsPCa patients on active surveillance. Several studies reported lower to moderate correlation coefficients between the ADC value and GS in peripheral-zone cancers [6,10,19]. Only a few studies have revealed substantial overlaps and no significant correlation between the ADC values and GSs [7,10,12] (Table 5). Overall, these discrepancies between the results may have been caused by multifactorial reasons (differences in cohort groups, technical methods, etc). We evaluated nADC values to overcome these difficulties and found that the nADC in csPCa (0.29) was significantly lower than that in ncsPCa (0.52) and that nADC was significantly correlated with the GS. ROC analysis of nADC demonstrated the best diagnostic performance among all of the normalized values: AUROC of 0.90 (95% CI, 0.79-1), sensitivity of 85%, specificity of 83%. To our knowledge, several studies have used nADC to evaluate the aggressiveness of prostate cancer and shown a significant negative correlation with GS [12–14] (Table 5). Some of them have shown that the nADC value could be more deterministic for tumour aggressiveness than the ADC value [12,13]. In this paper, the ADC value had better diagnostic performance than the nADC, which is consistent with Rosenkrantz et al [28]. De Cobelli et al [25] suggested that in patients with high-grade tumors, chronic inflammation and fibrosis are more likely to occur in benign areas of the prostate, thus changing the ADC values used for normalization. These factors can prevent the use of benign prostate tissue as a reference measurement. Larger prospective cohort studies are still needed to confirm the effectiveness of nADC parameter in determining the aggressiveness of prostate cancer.
Summary of patients cohorts, study design, and interpretation scheme of some studies from literature
ADC = apparent diffusion coefficient; nADC = normalized ADC; AUC = area under the receiver operating characteristics; CI = confidence interval; GS = Gleason score; N/A, not applicable; RP = radical prostatectomy; Sn = sensitivity; Sp = specificity; TRUS = transrectal ultrasound guided.
Some studies included the lesions in both peripheral and tranzone and central gland. While writing the number of patients and lesions, it was tried to exclude those located in the central gland if possible.
Another approach to overcome these difficulties and obtain more accurate results might be the application of more advanced DWI techniques, such as diffusion kurtosis imaging and intravoxel incoherent motion imaging. There is a growing interest in the application of these techniques in prostate cancer detection [29–31]. We hope that they will be implemented in the evaluation of cancer aggressiveness and treatment response.
Combining the nADC with the nKtrans and the ADC with Ktrans revealed better diagnostic performance, particularly an increase in negative predictive value (94% for the combination of Ktrans and ADC), when compared to the use of each parameter alone. In these combinations, Ktrans and ADC had the best diagnostic accuracy (92%), with an AUROC curve of 0.98 (0.94-1), a sensitivity of 94%, and a specificity of 89%. Although recent studies have focused on biparametric MRI (T2W MRI + DWI), which excludes DCE-MRI [32], we think that DCE metrics—particularly the Ktrans value, which is a part of routine multiparametric MRI—have the potential to discriminate csPCa from ncsPCa and positively contribute to the diagnostic performance of the evaluation for tumour aggressiveness. Furthermore, combined parameters may help to guide biopsy of more aggressive tumour regions, which will decrease the number of biopsies and associated morbidity, and improve detection and characterization of tumours.
There are some limitations in this present study. First, the number of subjects included and the distribution of GSs in csPCa can be cited as limitations. The distribution of GSs in the csPCa group was not equal. Higher numbers and an adequate distribution of subjects for each GS can help with obtaining more accurate results.
Second, prostatectomy specimens were only present in half of the patients for Gleason grading. Whole-mount prostatectomy evaluation is still the gold standard for determining tumour aggressiveness and there are some doubts about determining tumour grading correctly when using TRUS-guided needle biopsy [33]. On the other hand, some studies have reported significantly high concordance rates between GSs derived from MRI-US fusion biopsy and prostatectomy [34].
Third, ROIs were manually placed on the approximate biopsy locations with the help of DWI, T2W images, and the position of the urethra and other anatomical landmarks, in consensus between 2 radiologists. It is well accepted that correct ROI placement on heterogeneous tumoural areas can be difficult.
Fourth, this study included only peripheral zone lesions. It is well established that central gland MRI perfusion dynamics differ from those of the peripheral zone [35]. Therefore, comprehensive studies are required for validation in central gland lesions.
This preliminary study showed that GS had significant correlations with both the ADC value derived from DWI and the Ktrans value derived from DCE-MRI. The combination of these metrics had the highest diagnostic accuracy results, which shows the potential of assessing the tumour aggressiveness of peripheral zone PCa by means of multiparametric MRI. On the other hand, normalized versions of Ktrans and iAUC can be used as adjunct and complimentary measurements to increase the sensitivity when discriminating between ncsPCa and csPCa by eliminating discrepancies between different DCE-MRI methods. More studies conducted with larger cohorts and equal distribution of GS groups are needed to confirm this technique and determine the optimal cut-off values to use in routine clinical practice.