
Abstract
Affinity card programs have become popular in recent times and account for one fifth of all credit card accounts. There is no research that links affinity card programs to customer profitability. Moreover, little is known about what type of affinity card programs would lead to higher profit. Using a large proprietary dataset we answer the above questions. We also apply propensity score matching, a relatively new technique, to control for selection bias in addressing the above issues. Contrary to previous research and common belief, we show that affinity card customers are no more profitable than non-affinity card holders. We also show that sports-based affinity programs are the least profitable and surprisingly, alumni-based affinity programs also do poorly relative to other types of affinity. On the positive side, affinity card customers are lower risk and help to lower the average risk of the portfolio of customers.
Keywords
Introduction
The growing importance of credit card transactions and the increase in use of affinity cards for acquiring and retaining customers provide us the motivation for a thorough investigation of the impact of affinity programs on customer profitability. By customer profit, we refer to the amount of money that a bank or a credit card issuer gets from a customer and distinguish it from overall bank profit, which is a function of cost structure and management strategy in addition to customer revenue. An affinity credit card is defined as a credit card that is offered by an issuer to the members of an organization such as soccer clubs, political parties, alumni organizations, and charities (Worthington 2001). The key difference between an affinity credit card and a regular credit card is that when a person uses the affinity card, a small payment is made by the card issuer to the affinity partner to reward them for their cooperation in the promotion of a particular bank's credit card. Banks hope to tap into a customer's affinity for an organization to either encourage them to apply for a card or to increase their usage of the card. Prior research using surveys of bank managers suggests a link between affinity programs and increased revenue (Schlegelmilch and Woodruffe 1995), but their effect on customer profit has not been studied. The increase in revenue is mostly attributable to new customers who are acquired using the affinity program.
Firms often use affinity cards to acquire new customers and after building a significant client base, they become attractive to larger banks that could then purchase the smaller firms. Bank of America acquired a portfolio of more than 5,000 affinity credit card relationships and today it is the world's largest issuer of affinity credit cards. While affinity programs may help a firm acquire new customers and thus increase revenue for the bank, the focus in our study is on the difference in customer profit between affinity card customers and non-affinity card customers. In other words, the research question that we seek to address is whether affinity cards generate more profitable customers, after deducting the costs of the affinity payments.
We are also interested in determining how the affinity program affects the different sources of revenue, namely, interest income, interchange income and fees. Interest income refers to the interest on borrowings from unpaid balances or short term loans. Interchange income is the money that a bank charges the retailer for processing the customer transactions. Customers are charged fees for late payments and other risky behaviors. We also study whether an affinity card is associated with a greater frequency of usage, as is commonly believed (Macchiette and Roy 1992).
Another issue of interest is to understand whether certain types of affinity cards are better than others in terms of the above metrics. For instance, is a sports-based affinity card better than a professional organization-based affinity card? There is no research in the literature that links the types of affinity program to customer profitability. Given the large size of the credit card industry ($2.5 trillion in transactions per year as per credit cards.com) and the turmoil in the financial services sector, it is important for managers to understand and manage their affinity programs effectively.
While the question may seem easy to answer if one had the necessary data, there is an econometric issue that merits attention. The typical approach would be to compare the average profits from affinity card customers and those from non-affinity card customers and test whether there is a statistical difference in the mean profit across the two groups. This would provide the correct result if the customers were randomly assigned to each group. However, secondary data obtained from company databases does not guarantee such a random assignment of customers. This suggests that affinity card holders and non-affinity card holders may differ in many characteristics that could potentially explain the difference in profit between the two groups. This problem is known as selection bias and is a well-studied problem in the econometrics literature. Selection bias could be due to two main reasons: first, a firm may select certain customers to offer the affinity card based on criteria such as probability of response and expected profit. Second, certain types of customers may choose to participate in an affinity program based on their own affiliation needs, which could result in self-selection. Both reasons could contribute to differences in customer characteristics between affinity card holders and non-affinity customers.
A possible solution to overcome the selection bias problem is to match a customer with a given set of characteristics (such as age or income) from one group with another similar customer from the second group so that the effect of the chosen characteristics is nullified. If one were to compare the difference in profit between the matched groups then one could attribute the difference, if any, to the affinity program. When there are a large number of such characteristics the simple process of matching of characteristics requires a large sample of observations in each cell. To overcome this problem, we apply a relatively new technique known as propensity score matching, in which an index is created using all the characteristics that could potentially impact the selection bias and profits and then match the customers using this index. This technique has been used in selection models and in matching models (see for example Dehejia and Wahba 2002; Heckman and Navarro 2004; Heckman, Urzua, and Vytlacil 2006; Hirano, Imbens, and Ridder 2003).
Standard selection models can also be used to study the effect of affinity cards on customer profit. In these models, there are two equations — i) a profit equation that is a linear function of affinity and ii) an equation that predicts participation in an affinity program. Thus affinity is treated as an endogenous variable and is modeled using a discrete choice model. Both the profit and the affinity equations are jointly estimated. While often used, the selection model makes an assumption that the relationship between profit and affinity is linear. Moreover the error terms of the two equations are assumed to be bivariate normal. Mithas and Krishnan (2009) show that although the selection model yields better estimates than OLS, the estimates are still significantly different from the experimental estimates and are highly sensitive to alternative specifications of selection function. Therefore, we employ the propensity score matching (PSM) method to understand the causal effect of an affinity program on customer profit and other performance indicators.
We estimate the propensity scores using a rich dataset obtained from a large bank in the US, which is one of the leading companies that issues affinity cards. The data consists of a random sample of 9,000 customers and their transactions over a three year period. Using PSM, we show that customer profitability is not significantly different between affinity card customers and non-affinity card holders, a result which seems to be counter-intuitive. Further, affinity card customers also do not exhibit either a greater number of transactions or larger transaction amounts, as is commonly believed. We also analyze the impact of different types of affinity partners on customer profitability. From this analysis, we conclude that some affinity programs (i.e., affinity with professional or financial organizations and co-branded cards) are better than other types of affinity cards (such as sports-based or university alumni-based) in terms of profit. We find that sports club-based affinity programs have the lowest average profit and lowest average transaction amount among the five types of affinity programs that are studied. Though we expected alumni and sports-based affinities to be strong, we see that such affinities cannot be converted into additional profit or revenue by credit card firms. Interestingly, only the co-branded card customers generate higher average transaction amounts, though this effect is not significant.
Thus our major contribution is to estimate the causal effect of affinity card programs on customer profit. We also present an application of a relatively new method, propensity score matching, that tackles the econometric problems with selection bias in a much simpler way. We also show the importance of controlling for selection bias which can provide erroneous results. We hope our proposed method will help managers in better targeting, acquiring, and retaining profitable customers in the credit card industry. With the availability of vast amounts of data on individual customers, managers are in a position to do a better analysis of customer profit and develop strategies that can attract more profitable customers.
The rest of the paper is organized as follows. In the second section we review the existing literature on affinity credit cards and, following that, in the third section we offer a theoretical framework in which we explore the different ways in which affinity credit cards could affect customer profitability. In the fourth section we describe the propensity score matching methodology to estimate the impact of an affinity card on customer profitability. In the fifth section we introduce the dataset and provide some descriptive statistics of the data and then we discuss the results from PSM. Finally, in the sixth section, we summarize our conclusions with a discussion of the limitations of our study and suggest future research opportunities.
Affinity Credit Card Literature Review
Affinity card programs typically involve three parties — the card issuer (usually a bank), the affinity partner (e.g., a non-profit organization or a department store) and the customer. Early papers on affinity credit cards focus on the sources of income for the card issuer and the mechanisms through which the affinity organization gets a portion of that income (Worthington and Horne 1992, 1995, 1998). They also describe the symbiotic nature of the relationship between the bank and its partner. These studies establish the conceptual framework and some studies do use survey data but they do not examine whether affinity card customers generate higher or lower profit or revenue relative to non-affinity card customers.
A typical affinity program has three features: third party endorsement, shared incentives, and an enhancement package (Macchiette and Roy 1992). The affinity partner's endorsement enhances the likelihood of direct mail being opened and acted upon since it adds to the message credibility and leverages group affiliation. Shared incentive refers to the shared mission of the group members that motivates them to participate in the program. The enhancement package provides members some socially-tailored incentives appealing to their specific needs. The article also provides a taxonomy for classifying various types of affinity programs such as professional-based affinity, corporate-based affinity, socially-based affinity, product/service-centered, customer-driven, celebrity/sponsor-centered and activity or interest-centered. They suggest that some types of affinity programs, especially professional-based affinity programs have stronger affinity than others. A typical credit card affinity program also involves communication (endorsement) from the affinity partner urging its members to apply for the card, and the organization receives a small percentage of the amount spent by members using the card (shared incentive). In some affinity programs (e.g., airlines and store co-branded cards) there may be special rewards and deals offered to customers.
Prior research has shown that many consumers choose the affinity or endorsed card as the one they carry in the “front of purse/wallet” (Worthington 2001). This suggests that the affinity card is likely to be used more often and could generate higher number of transactions or higher transaction amounts. Further, it is possible that affinity card customers may stay longer with the bank due to the ongoing relationship with the affiliate organization and thus have a longer lifetime than other customers. Of course, such an argument holds only for dedicated supporters of the affiliate organization and may not hold for marginal supporters. Thus the effect of affinity cards on the number of transactions and transaction amounts is an interesting empirical issue that needs to be studied.
Using conjoint analysis technique, Jones, Suter, and Koch (2006) assess the importance weights that consumers assign to each attribute of an affinity credit card. They study attributes such as annual fee ($20, $18), annual percentage rate (5.9%, 6.9%), credit card background (athletic department logo, university logo), credit card company (Visa, MasterCard) and beneficiary (local Red Cross, local wildlife preservation, local boys and girls club, university's general scholarship fund). They find that respondents placed the most importance weight on the beneficiary, supporting self-concept aspects of relationship marketing. The financial institution was the least important attribute. The study thus confirms that the attraction of the affinity program to a customer is strongly related to the affiliate organization or cause.
Since there is limited research on affinity programs, we study the literature in related areas to obtain some concepts that can be applied in our context. An affinity program can be considered to be similar to a corporate social responsibility (CSR) program, in which every unit sold triggers a small donation to a cause. Research on CSR shows that consumers respond with more favorable ratings of the firm's product and have a higher likelihood of purchase of such brands (Lichtenstein and Drumwright 2004; Menon and Kahn 2003). Feelings of affinity or identification with the social cause are the main drivers of the choice. If an affinity card is similar to a CSR program, then we can expect such customers to have a higher probability of acquisition and a higher propensity to use the card. Schlegelmilch and Woodruffe (1995) employ concepts from cause-related marketing (Varadarajan and Menon 1988) to explain why affinity programs help in acquiring new customers. Based on interviews with managers, they report that affinity card programs contribute as much as 20% in volume growth (from new customers) in a highly competitive market in the US. They also show that most managers believe that there is a positive relationship between affinity card programs and revenue. However, it is not clear whether affinity is like a “warm glow” that dissipates quickly or is a persistent effect that can be used by the bank to induce profitable actions over an extended period of time. Our research seeks to address this issue.
Affinity card programs may be considered to be similar to loyalty programs (in which points are awarded for each transaction of a customer) since both programs provide customers with an incentive to transact more often. However, a key difference is that loyalty programs reward the customer directly while affinity programs usually reward the affinity partner. The goal of a loyalty program is to establish a higher level of customer retention in profitable segments by providing more satisfaction and value to certain customers (Bolton, Kannan, and Bramlett 2000). Information technology has facilitated the spread of loyalty programs into many industries such as gaming, financial services and retailing (Deighton 2000).
The empirical evidence on the benefits of a loyalty program is mixed. Some authors show that loyalty programs can increase brand loyalty by creating switching costs and can increase operational profit through reduced price competition (Caminal and Matutes 1990; Kim, Shi, and Srinivasan 2001; Klemperer 1987). Drèze and Hoch (1998) find evidence of a sales increase in the product category as well as a rise in store traffic as a result of a store loyalty program. Sharp and Sharp (1997) do not find any significant effect of loyalty programs. In established competitive markets, Dowling and Uncles (1997) claim that a loyalty program is unlikely to alter customer behavior fundamentally. Berman (2006) suggests that saturation in the loyalty program market may make it unattractive to most firms. Members in loyalty programs tend to overlook or discount a negative evaluation of the company vis-à-vis the competition (Bolton, Kannan, and Bramlett 2000). Therefore, the above literature on loyalty programs does not suggest a clear direction for the effect of affinity on profits or other metrics.
We posit that customers may obtain a greater utility from rewarding themselves directly rather than rewarding their affiliate organization. Rewarding oneself is a more efficient mechanism as it dominates rewarding the affinity organization since the customers can, if they so desire, donate the reward back to the affinity organization. So customers who have a high level of affinity should be indifferent between the two mechanisms, while the customers with a lower level of affinity may prefer to obtain a reward for themselves. The latter group of customers may either not use their affinity card as often, or use another card that rewards them directly. This suggests that, all else remaining the same, affinity programs may generate a weaker response from customers than loyalty programs. Therefore, based on the arguments in the loyalty program literature, we expect either positive effects or no significant effects from affinity programs.
We can use theoretical arguments based on the notion of equity transfer from the brand extension literature to justify the positive effects of affinity cards on revenue or profit. Brand extensions transfer positive affect from a successful brand to a new product and lead to transfer of knowledge, positive attitude and higher purchase intention for the new product (Aaker and Keller 1990; Boush and Loken 1991; Ratneshwar and Shocker 1991). These theories are based on the concept of similarity between the original brand and the brand extension. The equity transfer theory as applied to the affinity card context would suggest that a member's positive affect with respect to his organization could be transferred to the credit card issuer based on goal similarity (i.e., shared common interests). Thus one would expect to see a greater number of transactions or higher transaction amounts from affinity card customers.
In summary, the above literature review shows that theories from CSR literature (i.e., social identification theory), loyalty programs literature and brand equity research (i.e., brand equity transfer) can be used to justify a positive effect of an affinity card program on customer usage of the card. The reduced incentive from indirect benefits of an affinity program relative to the direct benefits from loyalty programs suggest a weaker effect than has been observed in other markets. Therefore, one can expect to find either no effect or a positive effect of an affinity program on revenue and profit.
Model Development
In our model, we propose that a customer obtains utility from using an affinity card from two sources: 1) utility from the card and its functionality and 2) utility from the card's relationship to the affiliate organization. We describe these two components in greater detail in the following paragraphs. In Fig. 1 we show that the utility of a credit card comes from the card and from the affinity.
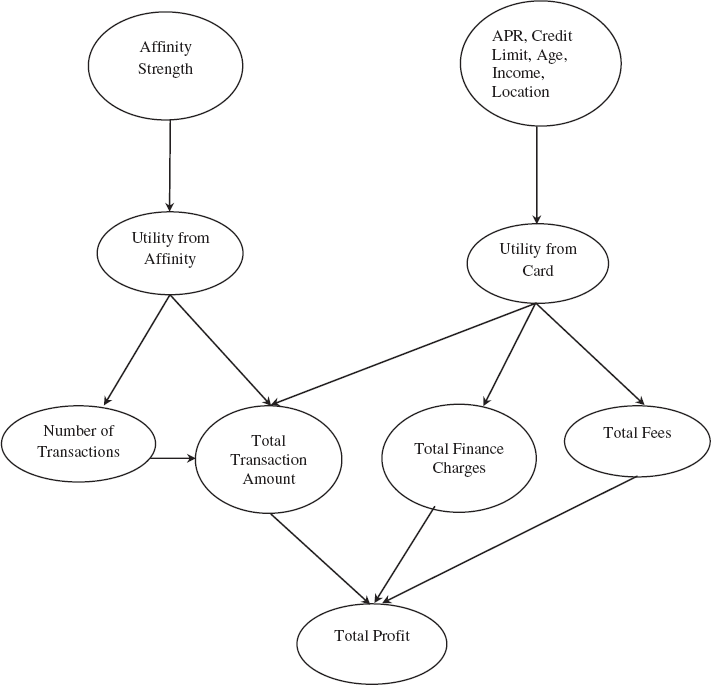
Model of affinity card and customer profit, and other sources of revenue.
Utility from the Card
According to Zywicki (1996), a consumer will obtain utility from the usage of the credit card in multiple ways. The card is a convenient form of payment and is a better alternative than payment by cash or by check. The card is also a source of short term credit for certain customers. A large percentage of credit card users (about 60%–68%) are convenience users who are less likely to carry a credit card balance. For this segment, the annual percentage rate (APR) might be less important in their decision to accept a credit card offer. Instead, they may compare other features such as annual fee, credit limit and cash rebate in their decision to either acquire the card or use the card. On the other hand, the smaller segment that uses the card for borrowing will consider factors such as the credit limit and APR when deciding to get a credit card from a particular issuer. Qi and Yang (2003) show that revolving customers will adopt a card that offers a lower APR even though it may have higher annual fees and no cash rebate. Some customers may also obtain utility from the perceived prestige of owning a particular type of card (e.g. Standard, Gold, or Platinum).
Utility from the card could be reflected in multiple ways. Customers who have a greater need for convenience are more likely to reflect that in greater usage of the card as measured by number of transactions or transaction amounts. On the other hand, customers who intend to use the card for borrowing are more likely to have greater finance charges because they would pay interest on the revolved balances or cash loans. These needy customers may also end up paying higher fees if they make late payments (Fig. 1).
There are many factors that could affect a consumer's utility from the card. Socio-demographic characteristics of the cardholder could affect a customer's need for a credit card. Mathews and Slocum (1969) found that while members of lower classes use credit cards for installment financing, upper class members tend to use credit cards as a convenient method of payment. It is also argued that lower classes are more involved in impulse buying compared to the members of the middle class who prefer to save and defer purchases (Meiden and Davos 1994). The above discussion suggests that customer's household income and education may affect his/her usage of the card. Lower income and younger customers find it harder to obtain short term small loans from banks and so find credit cards to be an attractive option for borrowing (Zywicki 1996). Such customers are likely to be more profitable for the card issuer. Income and past payment behavior (e.g., FICO score) also affect the amount of the credit limit and the APR offered by the issuer to the customer. We expect the initial credit limit and the initial APR to affect customer usage of a credit card. The data does not have information on household income and so we use the customer's occupation as a proxy for income. Additionally, we propose that a customer's location could also affect spending behavior using credit cards since it reflects the differences in cost of living across different regions. Different modes of acquisition (e.g., direct mail, Internet, telesales and direct selling) have been shown to affect customer profit (Steffes, Murthi, and Rao 2011) since firms use the modes to target different types of customers. Customers who have a reward card are less likely to have an affinity card from the same card issuer. As shown in Fig. 1, the behavior of convenience users of credit cards is reflected in the number of transactions and total transaction amount. Customers who use cards for borrowing reflect that behavior in terms of higher finance charges and higher fees.
Utility from Affinity
The utility that a customer obtains from his/her affiliation with an organization will mainly depend on the affinity strength between the customer and the affiliate organization. Affinity strength may be a function of the group identification, which is the idea that customers are willing to identify with an organization that they are affiliated to (Bhattacharya and Sen 2003). According to the social identity theory (Bhattacharya and Sen 2003; Tajfel and Turner 1986), people develop a social identity by identifying with or categorizing themselves in a contextual manner as members of various social categories. This theory suggests that higher affinity strength with an organization could increase the likelihood of usage of the card by customers and therefore could increase the number of transactions on the card. Worthington (2001) states that affinity card customers are more likely to keep the affinity card in the front of their wallet and use it more often.
People also respond to incentives (Landsburg 1993) and since the affinity program links the amount earned by the affinity partner to a customer's transaction amounts, affinity may drive greater usage of the card for transactions. Since customers who are motivated by affinity have no incentives to increase their borrowing using credit cards, they are likely to have lower average short term credit loans or revolving balances. For instance, if an affinity partner gets 0.5% of all amount spent using a given card, customers may be motivated to increase spending on that particular card. However, they have no incentive to increase their revolved balances. In summary, a customer obtains utility from affinity, which can be captured by the number of transactions and the total transaction amount.
Affinity and Profits
Ideally, to measure the value of affinity, one should compare the behavior of a person with an affinity card to that of the same person without the affinity card. However, it is not usually possible to see the same customer in both states. Therefore, researchers resort to testing average differences in behavior between affinity card customers and non-affinity card customers. However, as discussed earlier, these customers need not be similar in their characteristics which could lead to the well-known problem of selection bias. However, if one were to use methods to match customers from the affinity group with similar ones from the non-affinity group and compare the average difference in behavioral outcomes, then one could assess the magnitude of the effect of affinity. Based on social identity theory and the CSR literature, one would expect to see a positive effect of affinity on profits or revenue. If the effect of affinity is not very strong, then one may see a non-significant effect of affinity.
We present descriptive statistics to show that there is potential for selection bias. Specifically, we see that affinity card customers belong to a higher social class relative to non-affinity card customers. Social class is defined in terms of income and education. We do not have income data and so we look at high income occupations such as professionals and preferred professionals. From Table A, we see that affinity card holders have a significantly greater percentage of these two high income groups. They also have a higher percentage of students since many affinity programs are targeted to university students. We also see that the affinity card customers are better customers since they have a lower average charge-off balance and lower delinquency risk. Risk is measured on a 0–10 scale based on the promptness or delay in minimum monthly payment over a 37 month period.
Differences between affinity and non-affinity customers.
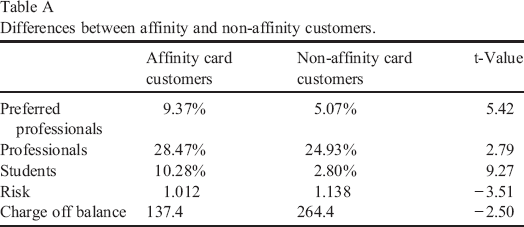
From past research, we know that members of upper social classes tend to use credit cards as a convenient method of payment while lower class members tend to use credit cards for installment financing (Mathews and Slocum 1969). From this, one could deduce that affinity card customers are likely to have lower finance charges and hence lower profits, on average. In credit card markets, risk and profits are positively correlated. That is, the profitable customers are the ones who carry large balances on their cards and these are the ones most likely to default. Therefore, if affinity card customers are lower risk customers, they are also likely to generate lower profit. It is therefore important to control for the effect of social class and risk before attempting to assess the effect of affinity programs.
Fig. 2 summarizes the relationship between affinity and customer profit, based on theoretical arguments. The top arrow indicates arguments from related literature (CSR programs, loyalty programs, brand equity transfer and social identity theory) which suggest either a positive relationship or a non-significant one. The bottom arrow summarizes arguments based on risk, income, preference for self-rewards and incentives from an affinity program, which suggest a negative relationship. Note that when we match customers, we match them based on characteristics at the time of making the decision to acquire an affinity card (that is, at time t = 0). We refrain from using information on transaction behavior after acquiring the card, in the matching process.
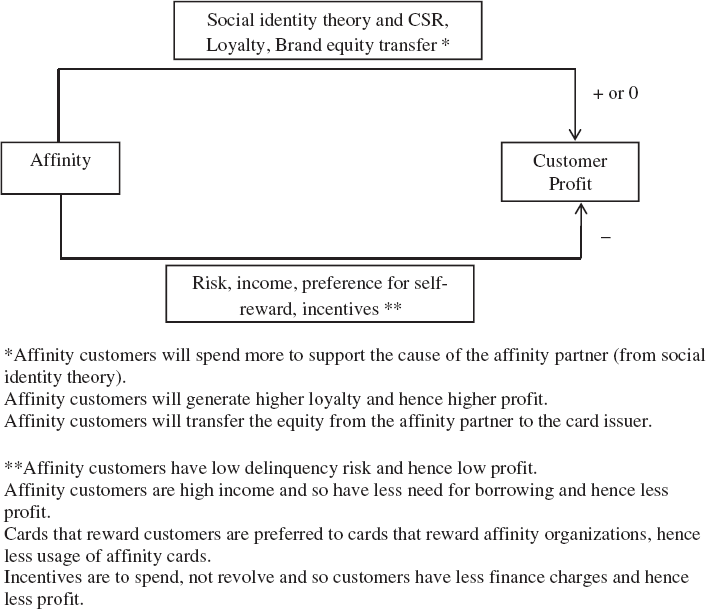
Summary of arguments on the effect of affinity on customer profit.
We note that a credit card company's profit from a customer can come from one of three main sources — interest income (from loans), interchange income (which is a percentage of the transaction amounts), and from fees. When customers carry a balance on the card beyond the grace period or when they take out a cash loan, they incur interest charges which form a major portion of a bank's profit (typically about 70%). Interchange income is the income that a retailer pays the bank for the services of the card issuer and usually ranges from 1.6% to 2% of the transaction amount. Fees are charged by the bank for late payments, for exceeding the limit and other deviant behaviors. Interchange income and fees each generate about 15% of the total profit from customers. The main point to note here is that interest income from borrowers generates most of the customer profit for a credit card issuer. We also note in Fig. 1 that the number of transactions could affect the transaction amount but is unlikely to affect the interest income or the fees.
The next interesting question is whether some types of affinity cards are better than other types of affinity cards even within the same bank. In our data there are five different types of affinity cards — professional, sports, alumni, financial, and co-branded. Professional affinity refers to members of professional/occupation oriented associations such as the American Medical Association. Sports-based affinity and alumni-based affinity cards are self-explanatory. Financial organization-based affinity refers to affinity programs that are run on behalf of smaller banks or lending agencies. Co-branded cards refer to firm or retailer issued cards such as Sears or American Airlines.
Since professional organizations (such as AMA for marketing or ASME for engineers) reflect an individual's professional interests, cards affiliated with these organizations are likely to lead to more affinity which could translate to higher transaction amounts. This is consistent with Macchiette and Roy (1992), who state that members of professional groups may directly benefit from affiliation through networking and professional advancement or recognition and so satisfy the condition for a “true” affinity or the strongest level of affinity. Therefore, compared to other types of affinity cards, these cards should generate higher transaction amounts. They may still not be more profitable than non-affinity cards since there is no incentive to carry balances.
We do not have specific hypotheses with respect to relative performance of the different types of affinity. Therefore, we let the empirical model reveal the relative effectiveness of the different types of affinity cards.
Methodology
We are interested in finding the causal effect of an affinity credit card on customer profitability in a non-experimental setting. We employ a matching method called propensity score matching (PSM) to estimate the causal effects. This method has been used in management by Hitt and Frei (2002) who analyze how online banking affects customer profitability. Bryson (2002) studies the effect of joining a union on employee wages and Mithas and Krishnan (2009) use propensity score matching to study the effect of an MBA degree on the salary of employees in the information technology (IT) area.
The basic problem in identifying a causal effect is that the outcome variable, customer profitability, is observed under either the case where customers participated in an affinity program or the case where customers did not participate in an affinity program but never observed in both cases for a given customer. So one can only estimate the average effect of the treatment. This is easy to do if the customers are randomly assigned to the treatment since the two groups are similar in all other aspects. However, for a non-random sample, one can compute average effect of the treatment on the treated (tATT) conditioned on receiving the treatment.
For the set of customers who would have been eligible to get an affinity card (i.e. D = 1), the difference in profit they would generate if they were given the card vis-à-vis the situation that they were not given the card provides an estimate of tATT, which can be written as:

E(t|D = 1) is the average treatment effect given that a customer is eligible to get an affinity card. Y(1) refers to the dependent variable (say, profit) if the customer has the affinity card and Y(0) refers to it if the customer did not have the affinity card. Note that one never observes E[Y(0)| D = 1]. One only observes E[Y(0)| D = 0] or the average profit for non-affinity card holders (D = 0). The observed difference in average profit can be written as follows.

Therefore, the observed difference in average profit is the true causal difference (tATT) plus selection bias which is the expression that is added to tATT on the right hand side. By matching we are actually trying to make E[Y(0)|D = 0] as similar as possible to E[Y(0)|D = 1] so that the bias becomes almost zero and the treatment effect can be simply stated as the difference between two observed outcomes: E[Y(1)|D = 1] − E[Y(0)|D = 0]. This bias will be zero only if the assignment to the affinity card groups is random. In non-experimental data, that is not the case.
A solution for the above problem is to match a customer of the affinity group with a customer of the non-affinity group such that they are similar to each other on all other characteristics that could potentially affect profit. This matching is achieved by using a propensity score which is a function of all the characteristics, X, that could potentially effect a customer's selection into the affinity card program and the profit (Rosenbaum and Rubin 1983). To obtain a propensity score, one can develop a model of affinity which is a binary logit or a binary probit model. Using the predicted propensity score, one can find matching samples of customers that have similar scores.
Propensity Score
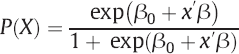
Defining the propensity score as the probability of receiving a treatment, the conditional independence assumption requires the propensity scores to be independent of outcomes. This means that after matching on the propensity score, the profit for affinity groups and non-affinity groups are independent of the assignment of the affinity card. To account for that, the covariates, X, should be selected such that they are unaffected by participation in affinity program, which means they must be fixed over time or measured before participation.
Another requirement besides independence is the common support condition which rules out boundary conditions 0 and 1 for the propensity score. This is required to ensure that customers who have the same X variables have a positive chance of being either in the affinity or in the non-affinity groups (Heckman, LaLonde, and Smith 1999). In this paper, the propensity score (i.e. the probability of participation in the affinity program) is calculated using a logistic regression model. The propensity score, P(X), is defined as
Propensity Score Matching
Caliendo and Kopeinig (2008) state that the four most popular algorithms of PSM are: Nearest Neighbor, Caliper and Radius, Kernel and Local Linear, and Weighting. Nearest Neighbor is the most straight forward matching method. In this method the individual from one non-participant group is chosen as a matching peer for a participant that is closest in terms of propensity score. A disadvantage of the nearest neighbor algorithm is that the risk of bad matches increases if the closest neighbor is far away. Other algorithms were developed to overcome the limitations of the nearest neighbor matching method (see Caliendo and Kopeinig 2008 for a review).
We use four different matching methods to determine the method that provides the best matching. This is determined by testing the difference between affinity groups on each variable that could potentially affect customer profit and participation in the affinity program. Ideally after matching is done, there should be no statistical difference between affinity and non-affinity card groups with respect to any of the covariates in the matching model. We find that nearest neighbor matching provides the best results.
Data Description and Results
The data in this study represents a random sample of 9,000 individual credit card accounts from a leading bank in the US. We observe customers’ transactions over a three year period from July 2000 to August 2003. All customers obtained their accounts in the same month and so both affinity and non-affinity card holders are from the same cohort. The performance metrics of interest are total profit, total finance charge, total transaction amount and total fees paid by the customer in a three year period. The explanatory variables of interest are annual percentage rates (APRs), credit limit, method of acquisition (direct mail, direct selling, telesales, Internet), type of card (standard, gold, platinum, and super premium), occupation and geographical region. Other customer characteristics are age, whether the account has a reward card or not, and number of cards for each account (card count).
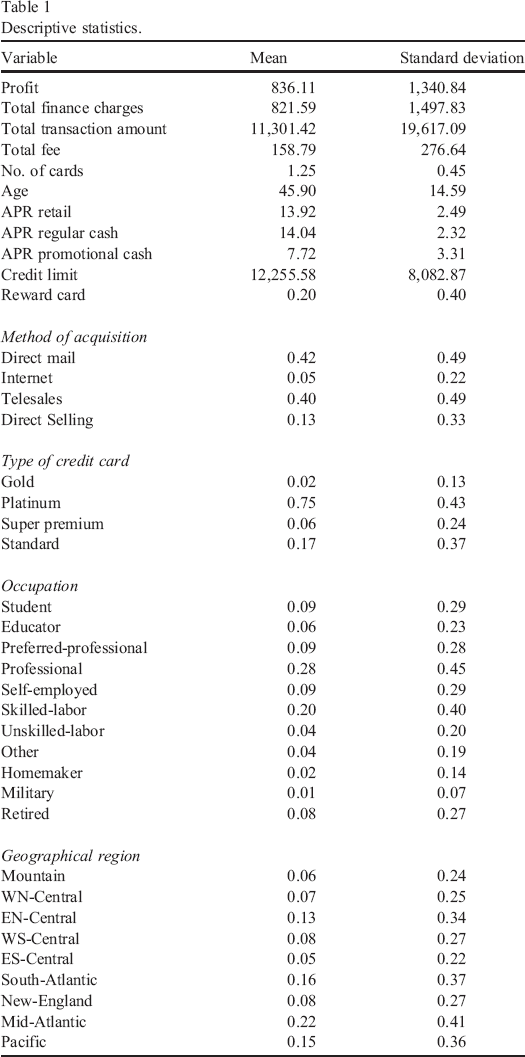
In Table 1 we report the descriptive statistics of the variables. The average profit for each customer is about $836 and the average total finance charge is $821 and so we see that the major part of the total profit comes from finance charges. The average APR for retail transactions is 13.92% and the average APR for regular cash loans is slightly higher. We see that 42% of the customers are acquired through direct mail and 40% through telesales. 75% of all cardholders have a platinum card while 17% have a standard card. We have included dummy variables for geographical region to capture observed heterogeneity due to differences in the cost of living index or regional preferences of customers. According to a study reported on creditcards.com, Miami residents are the biggest over-spenders (based on credit card debt as a percentage of household income), followed by Tampa and Los Angeles. We do not have data on customer income and so we use occupation as a proxy variable for income.
Descriptive statistics.
Our dependent variable of interest is customer profit, which is calculated as follows:
is the profit of customer i over a 37 month period is finance charge paid by customer i at the end of month t is interchange income from customer i at time t (1.6% of transaction amount) is fees paid by customer i at time t is the reward program cost (a percentage of transaction amount) is the affinity program cost (a percentage of the transaction amount) is the acquisition cost (based on mode of acquisition) is the monthly discount rate (assumed 10% per year)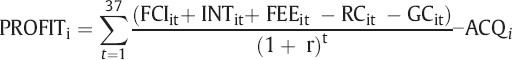
The variables that we use in the propensity score model are given in Table 2a. As stated earlier, the variables should be fixed over time or measured before the participation decision is made (Caliendo and Kopeinig 2008). We use variables that were suggested in past research or are based on economic theory. Affinity cards are offered to customers with a lower credit risk (i.e., high credit score). The bank decides on the initial credit limit and APR based on a customer's credit risk as assessed by the customer's household income and credit score. We use credit limit, three types of APR (APR for retail transactions, APR for cash loans, and APR for promotional cash loans) and type of card (gold, platinum, etc.) to control for the ex-ante credit risk of a customer. We include dummy variables for occupation to reflect the fact that higher income customers are more likely to obtain the affinity card due to their creditworthiness and greater participation in professional or other organizations. There is some empirical evidence of a link between income and affinity cards and between income and the need for credit (Cox and Jappelli 1993; Crook 2001; Duca and Rosenthal 1993). We include mode of acquisition since direct mail and telesales are more convenient for targeting and acquiring customers. Affinity cards are also offered to customers through direct selling at sports and university events. Age has been shown to negatively affect credit card usage by Mathur and Moschis (1994). Finally, regional differences are also captured through dummy variables.
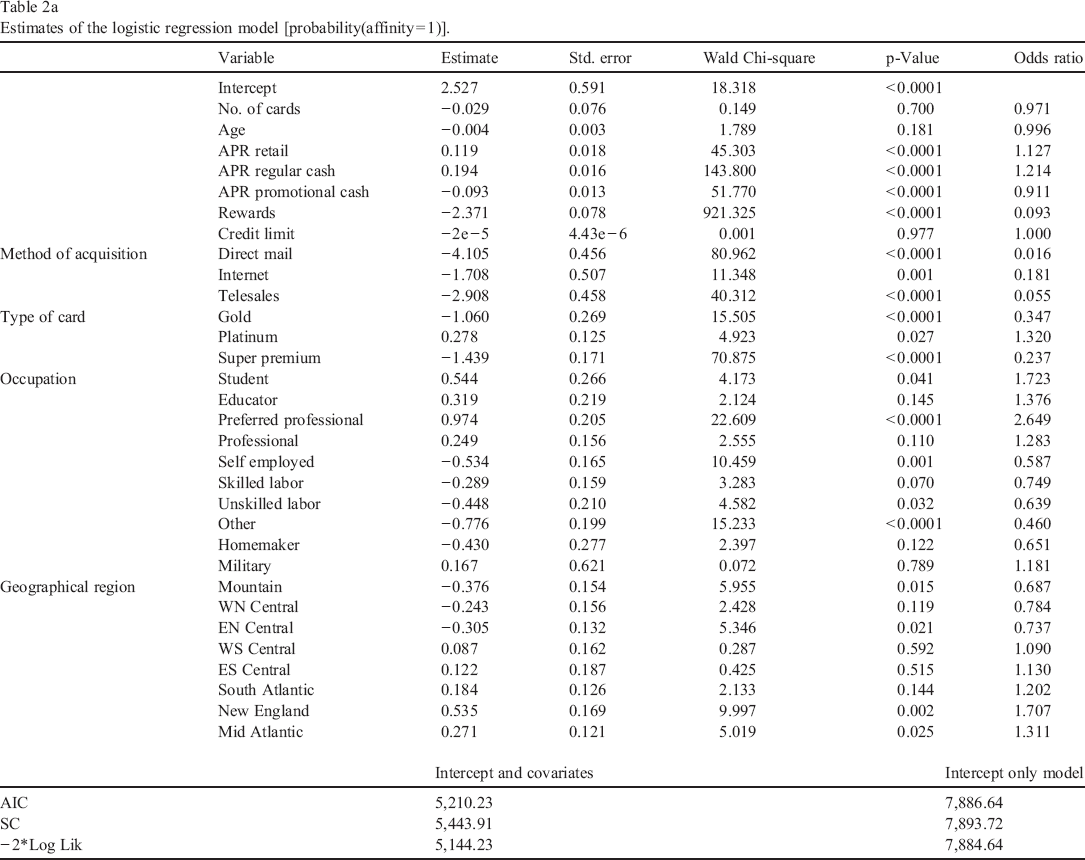
Estimates of the logistic regression model [probability(affinity = 1)].
Results
In Table 2a we report the results of estimation of the logistic regression model for participation in an affinity program. We find that age and card-count do not significantly affect the probability of participation in the affinity program. We see that a high retail APR and cash APR are associated with affinity card customers. Further, affinity card customers are offered a lower promotional cash APR than non-affinity card customers. Customers having a reward card have a lower probability of getting an affinity card from the same bank. Thus, customers appear to choose between either a reward card or an affinity card. We see that credit limit has no significant impact, possibly due to a high correlation with APRs and type of card. The estimates are consistent with observed industry practice.
Direct mail, Internet, and telesales have a negative and significant effect. This suggests that direct selling (the base method of acquisition) appears to be the preferred method for acquiring affinity card customers. In direct selling, the firm opens a booth at public events at sports arenas or professional conferences and solicits applicants for credit cards. The bank attempts to leverage the affinity strength of customers in this manner.
Relative to standard card holders, gold and super-premium card holders have a significant negative effect on the probability of getting an affinity card while platinum cards have a significant positive effect. This suggests that platinum card holders (who are typically higher income and less risky customers) are more likely to get affinity cards.
The coefficients for the different occupations should be interpreted relative to retired customers. We find that students and preferred professionals are more likely to have affinity cards while self-employed people, unskilled labor and skilled labor are less likely to participate in the program. There are some regional differences as well in the propensity to acquire affinity cards. The mountain and central regions in the US have a lower probability of getting affinity cards while New England and Mid-Atlantic regions have a higher probability, as seen by the odds-ratio estimates. The model fit is good as seen in the improvement in the Akaike Information Criterion (AIC) value which improved from 7,886 for the base model (without covariates) to 5,210 (for the model with all the covariates).
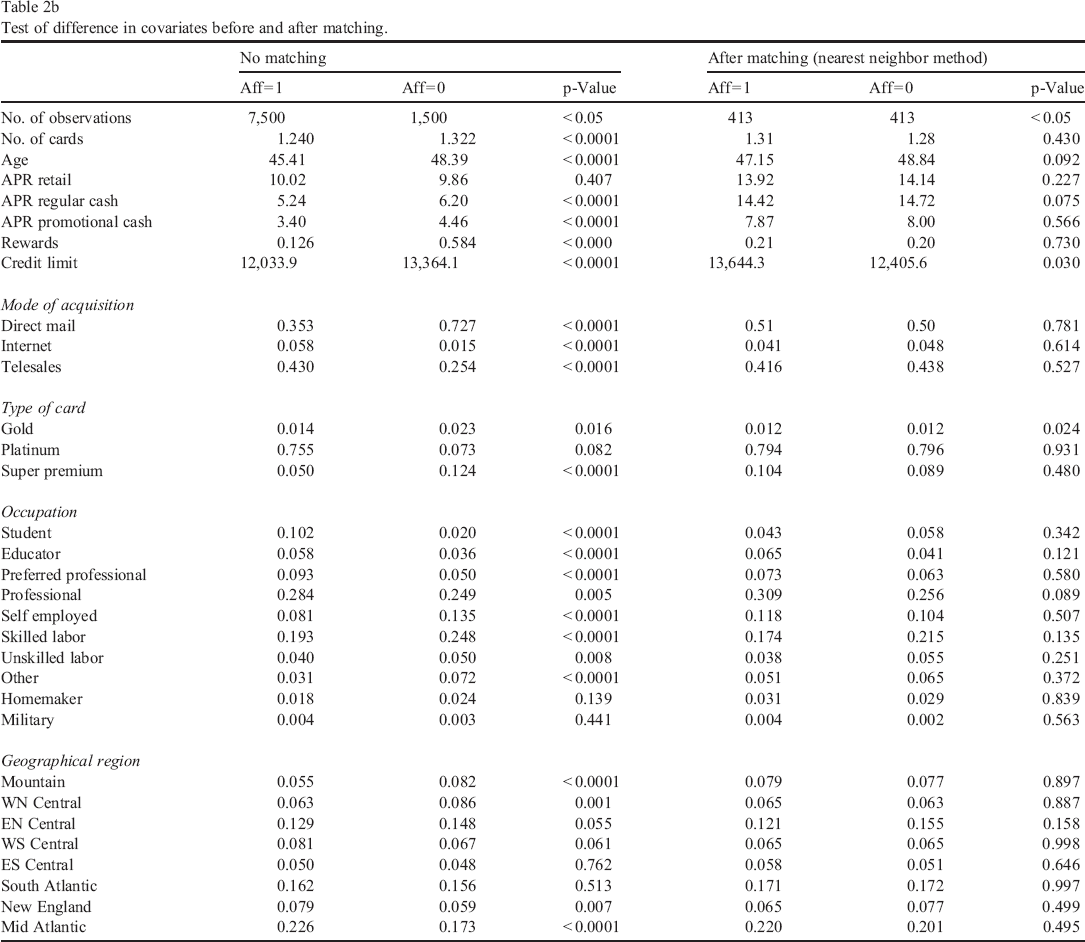
We try several matching methods to obtain matched samples for affinity and non-affinity customer groups. These methods are nearest neighbor, caliper matching, radius matching and weighting. In the literature, there is no consensus on which method is the best. We check for a significant difference in the covariates between the two groups using a t-test. We find that the nearest neighbor method gives the best results, since, after matching, there is no significant difference between the two groups in most of the covariates (Table 2b). There is a significant difference between the two groups in terms of credit limit and gold card, even after matching. This suggests that risk has not been completely accounted for in the matching process. Any difference in the performance metrics (profit, finance charges, transaction amount, and fees) can be attributed to the affinity program, after controlling for risk.
Test of difference in covariates before and after matching.
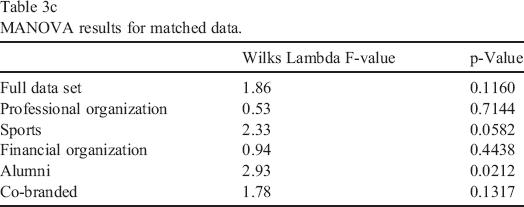
In Table 3a, we compare the difference in performance metrics between the matched groups. Note that the results are for groups matched using the nearest neighbor matching method. The main result is that affinity card customers do not generate any additional profit, finance charges, transaction amount or fees as compared to non-affinity card customers. The t-values for the differences between the two groups with respect to all the measures are all non-significant. Affinity card customers do show a higher average number of transactions, but the difference is not significant. We observe that affinity card customers pay lower finance charges on average, which translates to lower average profit, even though the differences are not statistically significant at the 95% confidence level. This result is in contrast to popularly held managers’ beliefs and past research in other contexts which suggested positive benefits of affinity programs (Macchiette and Roy 1992). In Table 3c, we report the results of the MANOVA test for the joint hypothesis of no affinity effect on any of the performance metrics. We see from the f-value for Wilks lambda, we cannot reject the null hypothesis in the matched dataset. However, there is a significant effect of affinity within the alumni-based affinity group.
Difference in metrics with matching.
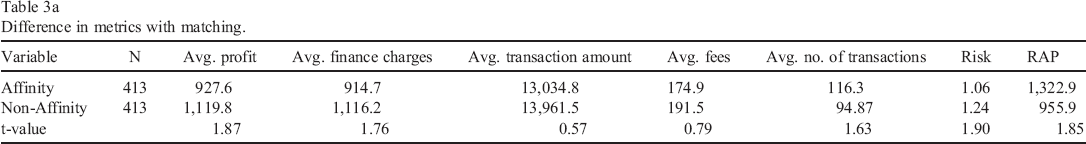
To assess the magnitude of selection bias, we report the differences in performance metrics using the original data (without matching) in Table 3b. From this table we find a significantly lower average profit, finance charges, transaction amount and total fees for the affinity group relative to the non-affinity group. By ignoring selection bias, one can reach erroneous conclusions about the profit implications of affinity cards. Specifically, the estimate of the difference in transaction amount is overstated by about 400%. The difference in total fees is overstated by about 26%. Interestingly, without matching, one might conclude that affinity card customers have a significantly lower number of transactions, when in fact they do not. The literature on customer relationship models (CRM) models has not paid careful attention to the potential selection bias issue. We conclude that in assessing the profitability of the affinity program it is important to properly control for selection bias.
Difference in metrics without matching.
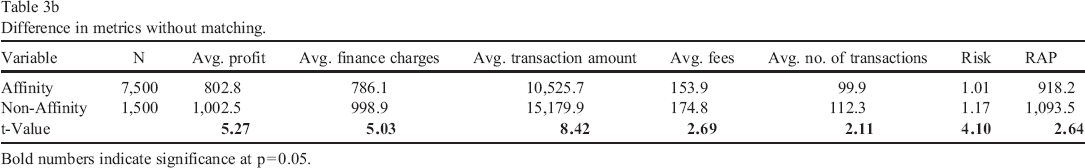
Bold numbers indicate significance at p = 0.05.
MANOVA results for matched data.
To further investigate the impact of the type of affinity program on customer profitability, we also look at the difference in profits between each type of affinity card program and a matched sample of non-affinity card holders. There are five types of affinity programs in our data — professional organization-based, sports-based, financial organization-based, alumni-based and co-branded cards (e.g., department store cards or airlines related cards). The differences in profits and revenues for both matched and non-matched groups are reported in Tables 4a and 4b. Note that matching is done separately for each type of affinity program and so the number of matched observations is different for each type.
Profit difference in different affinity sectors.
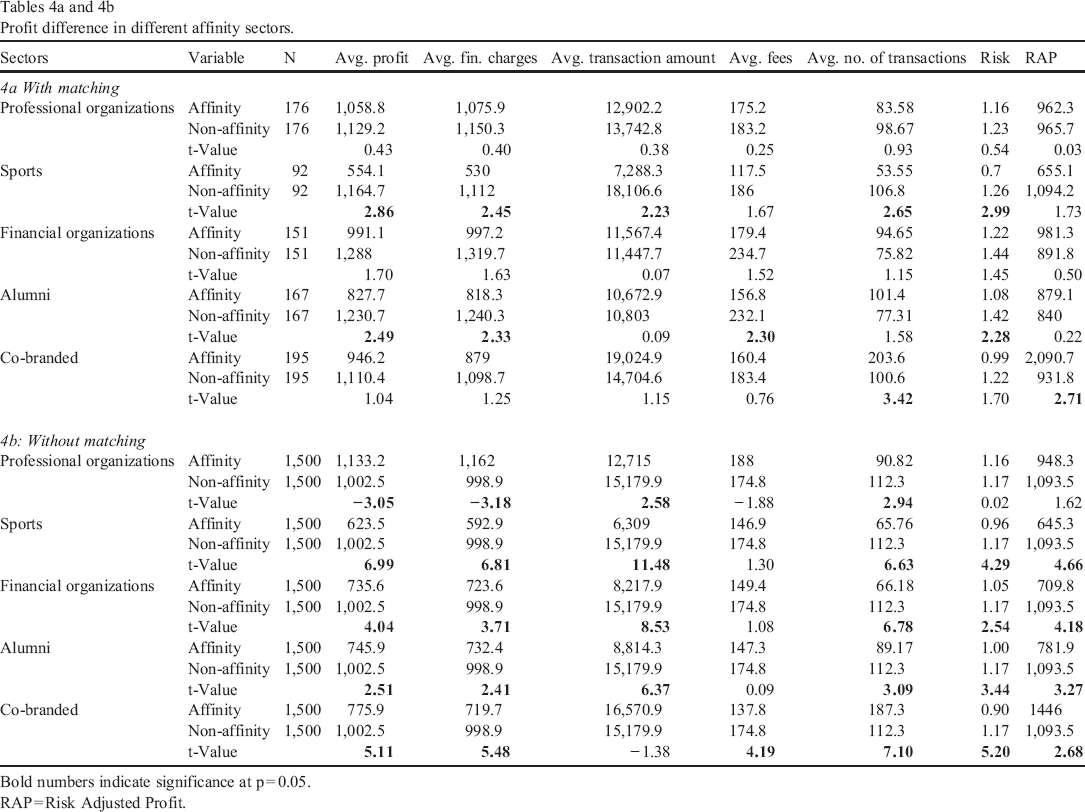
Bold numbers indicate significance at p = 0.05.
RAP = Risk Adjusted Profit.
Based on the results in Table 4a, there is no statistical difference in profit or finance charges between the two groups for professional organizations, financial organizations and co-branded affinity programs. Both sports- and alumni-based affinity groups show significantly lower average profit and lower finance charges relative to the non-affinity group. With respect to average transaction amounts, we see that sports-based affinity has a significantly lower spending compared to the non-affinity group. Alumni-based affinity groups pay significantly lower average fees relative to non-affinity groups. Note that these differences are observed after controlling for the effects of occupation (or income), credit limit (risk), modes of acquisition, type of card and consumer characteristics.
Of the five types of affinity programs, professional organizations have the highest average profit while sports affinity has the lowest average profit. This result is consistent with the prediction in Macchiette and Roy (1992) that professional organization-based affinity is a ‘true’ or strong source of affinity. Arguments in Gruen, Summers, and Acito (2000) also state that paid membership-based organizations offer membership benefits and preferential treatment to their members thus generating a greater sense of social identity which might lead to stronger affinity. The next best affinity programs are financial organization-based or co-branded cards. Co-branded cards have a significantly higher number of transactions and higher average transaction amounts relative to non-affinity card holders (though this effect is not significant).
Based on Macchiette and Roy (1992), product or service-based affinity groups derive affinity from “a mutual appreciation and loyalty to the product, service or brand”. Co-branded cards reflect what cardholders consume and how they perceive themselves. Therefore, they are more likely to use the card. Surprisingly, alumni- and sports-based affinity generate the lowest profits. These results are contrary to the findings in Worthington (2001) that are based on student surveys, which suggest that alumni-based affinity cards would lead to greater usage and hence higher transaction amounts.
An interesting question is why sports- and alumni-based affinity groups do so poorly even after controlling for selection bias. We suggest a couple of reasons. First, we find that a greater percentage of affinity card customers in these two categories are inactive (about 35%) as compared to the other affinity categories or the non-affinity group (about 23%). This suggests that customers may be motivated to apply for the cards due to affinity but may not use them. A possible reason could be that the “warm glow” from affinity that induces customers to apply for the card may not persist over time and may dissipate quite quickly. An alternate explanation is that booths at sports and university events use free gifts such as key chains or umbrellas to entice applicants. Applicants that apply for credit cards to obtain the gifts may not need the credit card and may end up not using them. To rule out the effect, we delete all the inactive customers from both groups and re-estimate our models. The two affinity groups still show lower profits.
Second, affinity customers also have a lower delinquency rate, that is, they are more likely to pay their bills on time. Therefore, they incur lower finance charges, which is a major determinant of customer profit. We do find that sports-based and alumni-based affinity groups have a significantly lower average delinquency risk. We did not use delinquency risk in the matching process, since this metric is obtained after the decision to obtain the credit card is made. To test this explanation, we defined a new metric, risk-adjusted profit (RAP) as follows:

We find that after controlling for delinquency risk, sports- and alumni-based affinity card customers did not have a significant difference in customer profit. These results are reported in Tables 3a and 4a.
A third reason could be that customers do not treat the affinity card as their primary card. Those who use the affinity card as a secondary card do not use it often and hence may generate lower transaction amounts and profits. Finally, as we stated earlier, customers have multiple cards and prefer to use cards that reward them directly to affinity cards, which reward the organizations. We are unable to test these alternate explanations.
From Table 4b, we again see the bias that would result from not matching the two groups on other characteristics. Without a control for selection bias, one would reach substantially different conclusions. For instance, we would conclude that professional organization-based affinity programs would generate significantly higher average profit and the other types of affinity programs would generate lower profits relative to non-affinity card holders. With respect to transaction amounts, it would seem that all types of affinity programs except co-branded cards would generate significantly lower numbers. We have thus demonstrated that without matching there would be potential for serious errors in interpretation.
Conclusion
In this paper we seek to find the causal impact of having an affinity credit card on customer profitability. Though the credit card industry is a large one and about one-fifth of all credit cards issued are affinity cards (marketresearch.com), there is no research that links the affinity program to customer profit. Further, there is no study of the efficacy of the different types of affinity cards in the literature. Using a rich dataset of 9,000 customers whose transactions are observed over a three-year period, we develop a model to address the above issues.
The econometric issues in the estimation of the impact of the affinity program on customer profit have to do with the presence of selection bias. The selection problem is due to the fact that certain types of customers may find it optimal to apply for an affinity card and this leads to self-selection bias. Further, firms often target certain customers to receive the affinity cards, which also could lead to a selection problem. Therefore the simple tools of testing for differences in profit between affinity groups and non-affinity groups using regression methods will provide biased estimates.
Selection models that have been proposed in the econometric textbooks make restricting assumptions of linearity and bivariate normality which cannot be justified in some cases. Therefore, we employ a relatively new method called propensity score matching (PSM) that matches customers from the affinity group with customers from the non-affinity group based on the propensity score. The purpose of the matching is to make the groups similar on all observed characteristics so that the difference in profits, if any, can be attributed to the affinity program. PSM tackles the problems mentioned above in a simple way and does not make assumptions of linearity or normality.
We use different methods of matching in order to find the best matches possible. We find that the nearest neighbor algorithm provides the best match in which the two groups exhibit no statistical difference with respect to all the covariates that could potentially affect customer profit and participation in the affinity program. Once we match the two groups, using a t-test, we find no significant difference in the customer profitability between the two groups. Our result shows that an affinity credit card program has no positive impact on customer profitability. Further, affinity card holders do not even generate additional revenue from finance charges, interchange income (or transaction amount), or total fees, as was expected in prior studies. This suggests that while affinity programs may be a good method of acquiring customers, such customers may not generate additional revenue or profit relative to non-affinity card holders. This does not mean that affinity card customers do not generate positive profits for the bank, only that they do not generate more. In some types of affinity programs (e.g., sports or alumni-based affinity), affinity card customers generate significantly less profit and revenues.
We also examined the impact of different types of affinity programs and their impact on customer profit. From this analysis, we conclude that some affinity programs (i.e., affinity with professional or financial organizations and co-branded cards) are better than other types of affinity cards (such as sports-based or university alumni-based) in terms of profit. We find that sports club-based affinity programs have the lowest average profit and lowest average transaction amount among the five types of affinity programs that are studied. Though we expected alumni and sports-based affinities to be strong, we see that such affinities cannot be converted into additional profit or revenue by the credit card firms. Interestingly, only the co-branded card customers generate higher average transaction amounts, though this effect is not significant.
There are a few limitations of our study. Though propensity score matching is better than no matching, it does not account for unobserved characteristics that could affect customer profit and acquisition of an affinity card. Thus there may still be some bias that is not captured by PSM. Further, our results are correct for the US market but cannot be generalized to other countries. Future work should test the robustness of our results using data from other countries. There are some potential reasons for our results that we could not completely test such as whether the card was a primary card or a secondary card for a given customer. We need additional data to test this conjecture. However, we do present one of the first papers with a new result that the real gain from having affinity card customers is not higher profits or transaction amounts but lower risk.
We also believe that while affinity might be a good method to get customers to apply for the credit card, the affinity effect may not last for a long time. Future work needs to develop a dynamic model to understand how long an affinity lasts and what factors can affect the longevity of the effect. We have modeled the effects of affinity on current customers. If we have the data on customers who were offered the affinity card and those who accepted the card, we could comment on the effect of affinity on the probability of acquiring customers. This would also allow us to test whether there is an adverse selection issue i.e., whether lower profit customers sign up for the affinity card. Despite the limitations, we use the data and PSM to correct a common misconception that affinity card customers will use the card more and generate greater transaction amount than other customers.