
Abstract
One of the defining features of online social networks is that users’ actions are visible to other users. In this paper, we argue that such visibility can have a detrimental effect on users’ willingness to exchange digital gifts. Gift giving is an intimate activity that comes with social risk, and the public nature of online environments can deter interactions that usually occur in smaller, more intimate settings. To study the effects of online visibility on the decision to give, we analyze a unique dataset from a large online social network that offers users the option of buying a digital gifting service. We find that purchase rates of the service increased with the number of ties that users kept on the network, but decreased with the extent to which those ties were connected to each other. We argue that the latter effect is due to the fact that, when a user's ties are connected, any gift sent between the user and one tie is visible to their mutual contacts. We explore how characteristics of users’ networks moderate the effect of online visibility, and argue that firms should take consumer network structure into account when designing digital products and promoting engagement online.
Introduction
In August of 2014, Facebook shut down a service called Gifts, which allowed users to send digital gift cards to one another over its online social network. The move surprised Wall Street investors and online commentators alike, who only two years earlier had heralded the service as a potential threat to the dominance of the popular online retailer Amazon. 2 Because the gift cards that Facebook sold were digital, not physical, users did not need to know a gift receiver's home address to send a gift. Moreover, since the production and distribution of digital goods take little money or time (Lambrecht et al. 2014), Facebook's service was ideal for last minute gifting. So why was it unsuccessful?
Facebook is Shutting Down Gifts to Focus on its Buy Button and Commerce Platform, TechCrunch, July 2014.
One of the defining features of online social networks is that users’ actions are visible to other users (Wang, Yu, and Wei 2012; Yadav et al. 2013). Rhue and Sundararajan (2014) show that such visibility can alter users’ purchasing decisions and, in particular, make them conform to the expectations of others. Of course, gifts are inherently socially visible to the extent that receivers see their gifts. However, in an online social network, there is an additional layer of visibility not often present in the offline world — gifts sent between two users are visible to any mutual contacts they share. The degree to which a gift conforms to the expectations of this audience constitutes what Yadav et al. (2013) call “social risk.” Given that there is already substantial anxiety surrounding the gifting process (Sherry, McGrath, and Levy 1993; Wooten 2000), we argue that such “third-party” visibility increases social risk, which can exacerbate the anxiety and deter users from gifting through online social networks.
If the presence of third-parties can deter gift exchange, then services like Facebook Gifts will be less successful in dense social networks — wherein users’ friends are friends with each other. When users’ friends are friends themselves, gifts sent to one friend will be visible to mutual friends. On the other hand, in networks where users’ friends are not friends, gifts will only be visible to their intended recipients. In fact, in 2008, Facebook introduced a feature called People You May Know, which encouraged users to form connections with friends of their existing friends. 3 While the feature may have increased the number of connections users had on Facebook, it likely also increased the density of these connections. The feature may thus have had the unintended effect of increasing third-party visibility on Facebook, rendering the gifting service unappealing from the moment it launched.
People You May Know, Facebook, May 2008.
To study how online visibility affects digital gifting, we analyze data from a large online social network that sells a service which lets users send electronic greeting cards to one another. We find that purchase rates of the service increased with the number of ties that users kept on the network, but decreased with the density of these ties. The negative effect of density was stronger for users in larger, less intimate, and categorically diverse networks. Moreover, in the time span of our study, the social network introduced its own People You May Know feature, and we show that the feature increased the density of users’ networks. Platforms should thus think strategically about how they motivate connections between their users, as these decisions can have long-term effects on the success of their offerings.
In the next section, we relate online visibility to network theory and motivate our hypotheses about the effects of visibility on digital gifting. In the Empirical Setting section, we introduce our unique empirical setting — an online social network that offers users the option of buying a digital gifting service. We model users’ decisions to purchase this service in the Methodology section, and discuss the estimates of our model in the Results section. In the Discussion section, we show that the platform's connectivity algorithm increased social visibility on the network, and conclude with a discussion of how our theory generalizes to inform firms about engaging with consumers in increasingly public, online environments.
Theoretical Development
The behavior of individuals under surveillance, whether social (like users’ friends on Facebook) or institutional (like Facebook the company or the NSA) is gaining popularity as a topic of scholarly attention. Raynes-Goldie (2010) argues that Facebook users are more concerned about privacy from their connections than from Facebook itself or affiliated businesses. Brandtzæg, Lüders, and Skjetne (2010) find that Facebook users with many friends feel more pressure to conform when posting information on the platform. Indeed, Rhue and Sundararajan (2014) show that users of a social shopping website even alter their buying habits in order to conform to comments they have received about previous purchases.
Social visibility can also have implications for how users interact with each other online. Gross and Acquisti (2005) argue that online social networks breed new forms of intimacy. Lambert (2013) calls the intimacy generated through online social networks as “group intimacy,” and suggests that it may be replacing traditional notions of intimacy — which are more interpersonal in nature. Geser (2008) goes further and argues that intimacy is completely destroyed in most online settings, because individuals are discouraged from revealing information privately to their close social ties. As Gerstein (1978) suggests, it is precisely these private disclosures of information that separate intimate relationships from those more casual in nature.
We follow Wilson, Proudfoot, and Valacich (2014) and others in taking the view that users of online social networks typically consider the privacy of an interaction before choosing to disclose information. Dinev and Hart (2006) refer to the trade-off between the benefits of information disclosure and the costs to privacy as a “privacy calculus.” We apply their framework to the context of gift giving, and show how social network theory can be used to quantify the potential threats to privacy that result from digital gift exchange. We believe that gift exchange is a natural setting to study privacy concerns because, as others have pointed out, gift giving is often the subject of substantial social scrutiny (Sherry 1983; Wooten 2000).
Before developing our hypotheses, we present a conceptual model of our theory in Fig. 1. The main effect we study is that of social visibility on the adoption of a digital gifting service. Social visibility constitutes the potential that gifting between two individuals will be observed by third-parties not directly involved in the exchange. We propose that the effect of social visibility depends on a giver's perceptions of social risk (Wooten 2000; Yadav et al. 2013), and that the magnitude of this risk varies with characteristics of the audience that can observe the interaction. We argue that audience size, type (e.g., personal or business), and categorical (e.g., gender and nationality) diversity moderate the relationship between social visibility and digital gift exchange. We also control for a number of other factors that could affect the decision to purchase a gifting service, such as social influence and various user demographics.
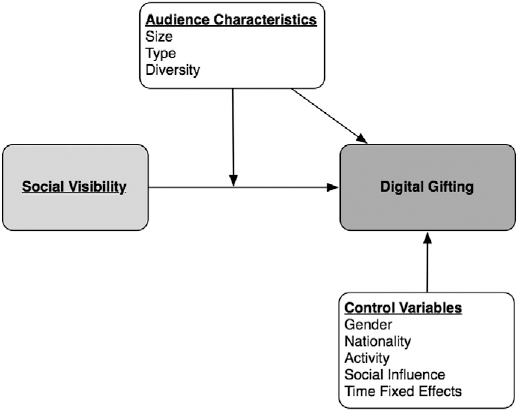
Conceptual model.
Gifting before an Audience
The anticipation that a gift will be ill-received can generate substantial anxiety for a gift giver (Lowrey, Otnes, and Ruth 2004; Sherry, McGrath, and Levy 1993; Wooten 2000). Researchers have identified two primary sources for this anxiety. The first relates to the uncertainty that the giver may have with regard to the recipient's preferences. When givers are unsure about these preferences, they experience higher levels of anxiety in the gift selection process (Moreau, Bonney, and Herd 2011). The second source of anxiety is even more social in nature. Individuals view gifts as tools to manage impression, and givers get anxious when they are concerned about how they will be evaluated by those observing their gifting behavior (Sherry, McGrath, and Levy 1993; Wooten 2000). It is from these sources of anxiety that we construct our hypotheses.
On online social networks, users’ actions and interactions are visible to other users. As a result, users are attuned to the potential for social surveillance — the monitoring of one's behaviors by others (Brandtzæg, Lüders, and Skjetne 2010; Raynes-Goldie 2010). For example, Rhue and Sundararajan (2014) show that users alter their online purchasing behaviors in response to feedback from other users about their previous purchases. Thus, we suggest that users are also aware of the extent to which their digital gift exchanges are socially visible. Moreover, the anxiety surrounding digital gift exchange should be greater when one's gifting behaviors are socially visible to users who are not themselves directly involved in the exchange.
To capture the extent to which a user's gifting behavior will be visible to other users, we make use of a concept from the social networks’ literature known as density. The density of a user's social network captures the extent to which her social ties are themselves also tied. In practice, the concept is sometimes referred to as redundancy by cohesion (Burt 1992) or the clustering coefficient (Watts and Strogatz 1998). When a user's social ties are themselves tied, then any gifts that the user sends to one tie will be visible to their mutual contacts. On the other hand, when a user's ties do not know each other, then gifts will only be visible to their intended recipients. Density thus measures the potential for third-party visibility. For this reason, we propose the following hypothesis:
Hypothesis 1
Network density has a negative effect on the adoption of a digital gifting service.
Audience Characteristics
Diversity
The degree to which social visibility poses a social risk is often a function of observer characteristics (Rogers 2010). This is especially true if a potential interaction contains content that is either controversial or has the potential for misinterpretation (Chen and Berger 2013). Often, the intent of an interaction must be understood within the context of prior interactions or shared cultural understandings. A third-party observer can misinterpret the meaning of an interaction if that observer is not privy to the context — a communication issue that Fleming et al. (1990) call the ‘multiple-audience problem’.
In the context of our study, some users have online social networks that are relatively homogeneous, while others have networks composed of individuals with varying characteristics. We expect that individuals with a homogeneous audience will be more likely to interpret the meaning of a gift in the same way. In contrast, an audience comprised of a diverse set of individuals may interpret the meaning of a gift in different ways. Thus, users with the same level of social visibility will experience more social risk if their audience is diverse on certain observable characteristics. The effect of density should thus vary with the categorical diversity of a user's online social network:
Hypothesis 2
The negative effect of density on the adoption of digital gifts increases with the amount of a) gender, b) cultural and c) tie type diversity in an individual's online social network.
Size
For a given level of density, social visibility should be more salient to users with larger networks than smaller ones. This is due to the fact that large networks contain more individuals that can potentially monitor one's gifting behavior. Moreover, individuals with large social networks will be less likely to have close relationships with all of their social ties, and may find it more difficult to predict the response of every observer of an interaction. Thus, we predict that the negative effect of density will be greater for individuals that keep larger networks.
Hypothesis 3
The negative effect of density on the adoption of digital gifts increases with the size of an individual's online social network.
Intimacy
Individuals also maintain several different social groups. For example, social ties in a business setting may have little overlap with ties in a family or friendship setting. Wooten (2000) proposes a mechanism driving social anxiety based on the lack of parameters established prior to gift exchange. For social groups that consist of more intimate ties, these parameters may be tacitly agreed upon or even openly discussed. On the other hand, for social groups that consist of less intimate ties, the parameters of gift exchange may be less obvious. Indeed, Sherry, McGrath, and Levy (1993) provide empirical evidence to show that individuals are more comfortable exchanging gifts with friends and family than with less intimate connections. We thus expect the following to hold:
Hypothesis 4
Family and friendship ties have a greater positive effect on the adoption of digital gifts than business ties.
Moreover, if individuals are less comfortable giving gifts to less intimate ties, they likely also feel less comfortable giving gifts in the presence of such ties. Individuals may thus feel more scrutiny when exchanging gifts under the surveillance of business (as opposed to personal) ties. Our final hypothesis predicts that the negative effect of density will be stronger in networks comprised of more business ties.
Hypothesis 5
The negative effect of density on the adoption of digital gifts is greater in networks comprised of more business ties.
Empirical Setting
Overview
The company in our study launched its online social network in 2007. The network allowed users to maintain an online profile, connect with other users, and share messages, photos, videos, and other content with their connections. A unique feature of the network is that it required users to specify the types of connections they had with other users. Connections could be specified as family, friend, business, or any combination of these types, and only the types that were mutually agreed upon by both users were associated with a connection on the network. This feature made it easier for users to share content with each group separately. Fig. 2 shows a screenshot of the online social network.
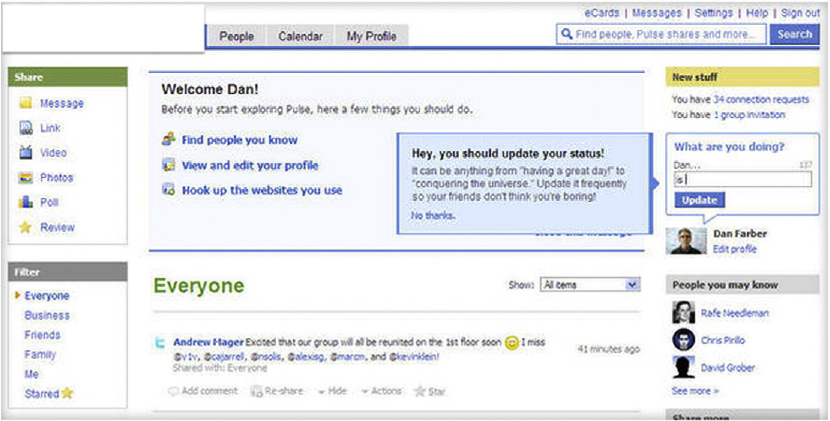
A screenshot of the company's online social network.
Users of the online social network also had the option of buying a service that let them send electronic greetings cards (eCards) to their connections. The service cost users $12.95 for a one-year subscription, and the price did not change during the period under investigation. When a user sent an eCard to another user, it was displayed on the recipient's profile page. The recipient's connections could then see the eCard, as well as who it was from, if they visited the page. Importantly, mutual friends of the sender and recipient were also notified (in their content streams) when an eCard was sent. Thus, even when these mutual connections did not participate in an exchange, they were likely to become aware of it by virtue of the fact that they had ties to both the sender and receiver. Figs. 3 and 4 show samples of the eCards that users could send and a screenshot of how they were displayed on users’ pages, respectively.

A sample of eCards available through the company's digital gift giving service.

An example of an eCard displayed on a recipient's profile page. Senders and recipients had the option of making these cards private, though the default was to make them public.
Data
Social networks are usually bounded artificially. As researchers, we tend to define what constitutes ties between individuals and largely ignore the set of interactions that occur outside of our chosen context. This is often a matter of practical necessity. For example, Nitzan and Libai (2011) study a social network based on the occurrence of millions of phone calls between individuals. In their context, it was not feasible to document the set of face to face interactions that may have occurred in concert with the phone communication. In our study, we avoid this concern by focusing on a digital gifting service that requires both givers and recipients to be users of the online social network. As such, the value of the service can be directly linked to the existence of social ties in the online social network, and not to ties by some other definition.
To estimate the effects of social visibility on digital gift exchange, we relate characteristics of users’ networks to their decisions to purchase the company's eCard service. We construct a set of network measures for these users by analyzing their ties on the online social network. Our data start in 2007, when the company's social network launched, and ends in September of 2009. We sample the network of connections at 12 points in time (i.e., every two months), and only consider users who, at every time point, had at least two ties. This requirement ensures that the network measures are well-defined throughout the timespan of our study.
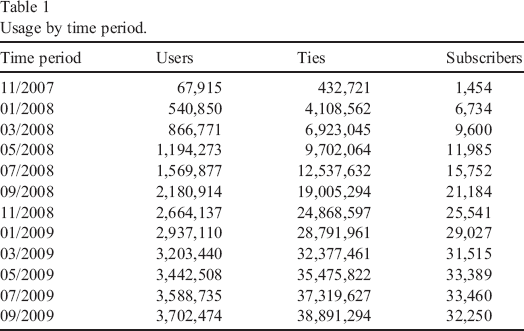
The social network was growing rapidly during the period of our study, and by the end of the two-year window there were 3,702,474 users that met our criteria for inclusion and 38,891,294 ties. To calculate our network measures, we analyzed all available 6,711,964 users and 39,116,763 ties. In the first time period, approximately 2.25% of users had a subscription to the eCard service. That number dropped to 1% by the final time period. Table 1 breaks down the number of users, ties, and subscriptions by time period. Due to the size of our dataset, it was not feasible to estimate the parameters using the entire population of users. We therefore employed a sampling technique, in which we selected approximately 300,000 users at random and only included their records in our estimations. We constructed several such samples to confirm our findings, and the results were qualitatively similar across them.
Usage by time period.
Methodology
Model Specification and Estimation
Marketing scholars regularly use hazard models to examine the duration prior to some consumption event (Landsman and Givon 2010; Nitzan and Libai 2011; Risselada, Verhoef, and Bijmolt 2014). In our context, the event of interest is purchase of the company's eCard service. The hazard specification has several advantages over standard regression models like ordinary least squares and logistic regression. For one, it can handle data that are right-censored, which allows us to include users that did not adopt the eCard service in our sampling window. Another advantage is that hazard models can capture both time-varying and time-constant independent variables. This allows us to include social network measures that changed from period to period, as well as demographic variables (e.g., gender and nationality), which did not. We address left-censoring by using the date a user joined the social network to define the point at which they become at risk of adoption.
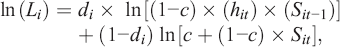
Following Risselada, Verhoef, and Bijmolt (2014); Polo, Sese, and Verhoef (2011) and others, we specify the baseline hazard function using the complementary log–log parametric form. This approach approximates an underlying continuous-time process given data that are grouped into discrete time intervals (e.g., every two months). Following Prins and Verhoef (2007), we also include both a time trend and squared time trend to account for nonlinear time dependencies in the baseline hazard rate. 4 Under this approach, the purchase hazard of user i with individual characteristics xit at time t can be expressed as:
We also estimated models with a non-parametric baseline hazard by including time fixed effects instead of the trend variables, and the results were qualitatively similar.

where β′ captures the effects of the variables in xit on the hazard rate.
Under the standard hazard specification, one assumes that all users will eventually experience the event of interest. In our context, actual purchase rates are quite low, which highlights the possibility that many users were never actually ‘at risk’ of adoption (Polo, Sese, and Verhoef 2011; Schweidel, Fader, and Bradlow 2008). Digital gifting represents an additional layer of technological complexity above and beyond routine use of online social networks, and for technologically complex products there is often a significant group of consumers who will resist adoption (Prins and Verhoef 2007).
To account for the possibility that some users never would have purchased the eCard service (i.e., have zero probability of adoption), we estimate both the adoption probability and adoption timing simultaneously. This approach is often referred to as a ‘split-population’ hazard model (cf. Jenkins 2001; Schmidt and Witte 1989), because it weighs the likelihood of each observation by the probability of belonging to the ‘at risk’ population to begin with. In this way, the actual survival analysis is applied only to the users who are predicted to adopt in the future.
Following the notation in (Jenkins 2001), we define A to be an indicator of whether a user eventually adopts the gifting service. Using this indicator, we can say that prob(A = 1) = 1 − c (the probability of eventually adopting) and prob(A = 0) = c (the probability of never adopting). For users with an adoption in a given time interval, the contribution to the likelihood is (1 − c) * (probability of no adoption to end of the previous time interval) * (probability of the event in the given interval). Censored observations consist of those where A = 0 plus those still at risk but not yet observed to adopt. Thus, the contribution to the likelihood from a censored survival time is c + (1 − c) * (probability of survival to end of the given time interval).
Taken together, we can express the log-likelihood contribution for person i with a survival time of t periods as:
Variables
To define our network measures, we extend notation developed by Shmargad (2014) to accommodate social networks with multiple relation types and time periods. In our setting, users can have three possible tie types: family, friend, and business. We consider family and friend ties as ‘personal’, and denote a social network of type r ∈ {Personal, Business} at time t ∈ {1, …, 12} by G
t
r
(V
t
, E
t
r
). Here, Vt is the set of active users and E
t
r
is the set of type r relations among them at time t. We define the set of user i's type r ties at time t as N
it
r
= {j|j ∈ V
t
and (i, j) ∈ E
t
r
}. We then use N
it
= N
it
Personal
∪ N
it
Business
and E
t
= E
t
Personal
∪ E
t
Business
to capture the set of user i's ties and all of the ties in the network, respectively, at time t. To construct variables based on a user's social ties, we also define the following indicator for any two users i, j ∈ V
t
,
Network Size
In the social networks literature, the degree of a network is simply a count of the number of direct ties, or neighbors, an individual keeps. In most naturally occurring social networks, the number of ties individuals keep is distributed according to a power law (Barabási and Albert 1999; Watts and Koput 2014). To adjust for this skew, we take the natural log of each user's degree. Formally, we define the size of a user's network as CON it = ln(‖N it ‖). We also generate variables that capture the size of each type of network (i.e., personal or business), and denote them by CON it P and CON it B , respectively.
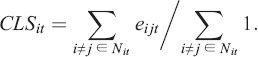
Network Density
We operationalize density using the clustering coefficient, which is the number of existing ties divided by the number of possible ties between the individuals in a user's social network (Watts and Strogatz 1998). The clustering coefficient for user i at time t is thus defined as
Network Diversity
We operationalize three diversity measures based on the composition of an individual's network by gender, nationality, and tie type. Gender is a self-reported measure that takes on a value of 0 for males and 1 for females. We generated nationality indicators using an individual's country of origin, which the company that provided our dataset obtained by geocoding users’ IP addresses. We only use the top 10 countries, by absolute membership, in the diversity score. All other countries were combined and treated as a single country. Tie types were family, friend, or business, as described above. Our measures build on the Herfindahl index (Herfindahl 1950; Gibbs and Martin 1962), and are defined as
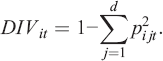
These measures are maximized when the probability of randomly selecting two items of the same type is minimized. For example, an individual would have a high gender diversity score if their network consisted of an equal number of male and female ties. A low diversity score could imply, for example, that an individual's network consists of only male ties were refer to the diversity measures by DIV it G , DIV it C , and DIV it T , to represent gender, cultural, and tie type diversity, respectively.
Control Variables
To account for the possibility of social influence in the adoption process (e.g., Risselada, Verhoef, and Bijmolt 2014), we include a count of the number of individuals in Nit that have already adopted an eCard subscription. Because users send eCards to each other, the existence of prior adopters in a user's social network could indicate additional exposure to the product (i.e., a social influence effect). A user's level of activity on the social network could also influence their purchase decision. We control for this by including a measure of the amount of time since the user last formed a tie on the network. Users that have not recently formed connections may have lost interest in the online social network altogether.
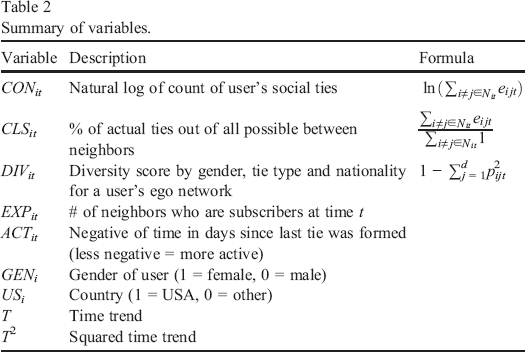
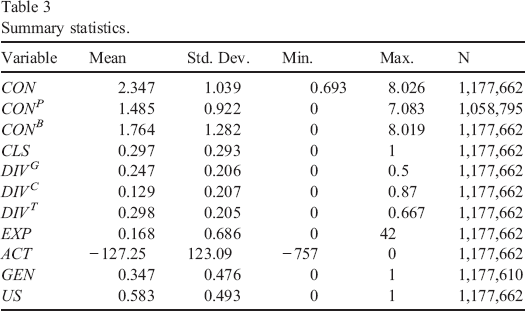
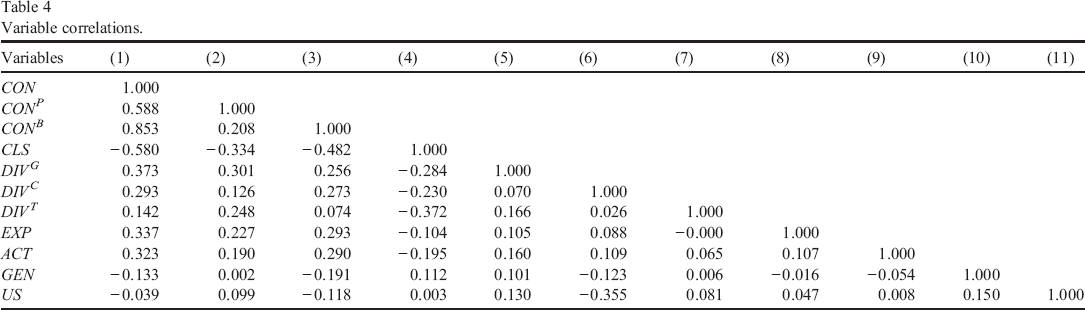
In addition to these exposure and activity effects, purchase could also depend on demographics and cultural characteristics. For example, females are generally expected to play a larger role in gift exchange (Areni, Kiecker, and Palan 1998). To account for this possibility, we include a dummy variable indicating the user's gender, along with variables that capture a user's country of origin. We found no major differences with the inclusion of dummy variables for each of the 229 countries in our sample, and instead use a dummy variable to indicate whether or not users reside in the United States. We summarize our variables and their operationalizations in Table 2. Table 3 provides summary statistics of these variables, and Table 4 shows bivariate correlations between them.
Summary of variables.
Summary statistics.
Variable correlations.
Results
From the nearly seven million users of the online social network, we constructed a random sample of 300,000 users to estimate the parameters our the model. From this sample, 168,801 users had at least two ties, which was required in order to calculate the clustering coefficient for our sample. Across our two year time window, these 168,801 users constitute 1,007,915 observations and 1,593 purchases of the eCard service.
To assess the validity of the split-population formulation, we evaluate the estimates of c (the probability of never adopting) and compare the likelihood ratio to that of the standard discrete-time proportional hazards model, which is nested in the split-population formulation. The estimate of c is positive and statistically different from 0 in all of our specifications. Moreover, the likelihood ratio test is significant (χ2(1) > 80, p < 0.001), indicating that the split-population specification is a better fit than the standard model.
Main Models
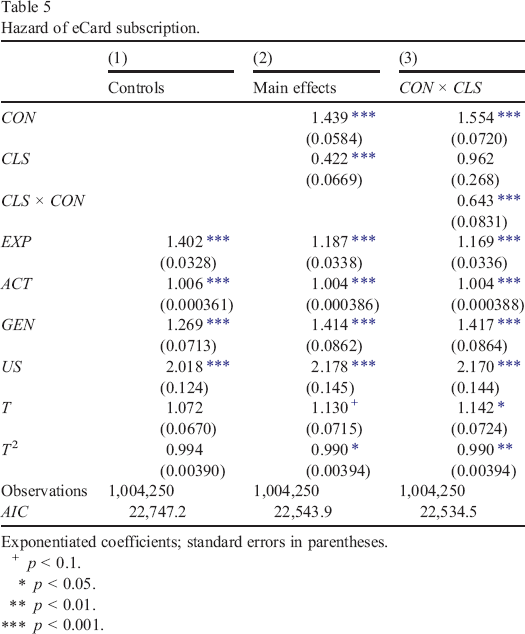
Table 5 presents the estimation results for Model 1 (control variables only), Model 2 (main effects), and Model 3 (interaction of network size and density). All tables display exponentiated coefficient estimates (i.e., hazard ratios) with modified standard errors calculated by multiplying the hazard ratio by the typical standard error (see e.g., Sribney and Wiggins 1999). The direction of the estimates from Model 1 are as expected. The hazard of adoption increases with exposure to prior adopters and higher activity levels, and is higher for females and residents of the US. We see that each adopting neighbor is associated with an increase of 40% in the focal user's hazard of adoption; however this is attenuated to 19% once total network size is accounted for. This value is in line with social influence effects reported in other studies of adoption or defection (e.g., Nitzan and Libai 2011).
Hazard of eCard subscription.
Exponentiated coefficients; standard errors in parentheses.
p < 0.1.
p < 0.05.
p < 0.01.
p < 0.001.
In Model 2, we add our measures of network size and density. This increases the fit of our model substantially, as indicated by the Akaike Information Criterion (AIC). 5 Moreover, the hazard of adoption increases with the number of connections users kept on the network, but decreases with the density of these connections. Social visibility thus decreases the propensity to purchase an eCard subscription, providing support for Hypothesis 1.
We chose the AIC over the Bayesian Information Criterion (BIC) because the BIC imposes a substantial penalty on additional parameters when using a large number of observations N, i.e., BIC = − 2 ln(L) + k ln(N), where k is degrees of freedom.
In Model 3, we introduce an interaction between network size and density, which has a negative and statistically significant effect on the adoption hazard. Marginal increases in density thus have a stronger negative effect on eCard purchase for users with larger networks, providing support for Hypothesis 3. We depict this relationship graphically in Fig. 5. This figure shows that, while the effect of density remains negative for the entire range of network size represented in our data, the effect decreases monotonically with network size and is most negative for users with many connections. We provide additional evidence for the moderating effect of networks’ size in the Robustness section.
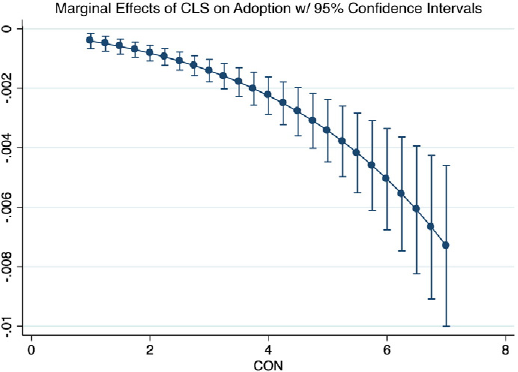
Marginal effects of the clustering coefficient at different levels of connectivity.
This finding also rules out a plausible alternative explanation for our results. Ex ante, it is possible that a negative effect of density could arise in the presence of new users, who were both unaware of the eCard service and who kept networks that were smaller in size. Since smaller networks are denser, on average, this would imply a negative effect of density that is driven by factors other than social visibility. However, since we find that the negative effect of density is most negative for users with large networks, the negative effect of density cannot be fully attributed to new users with small networks.
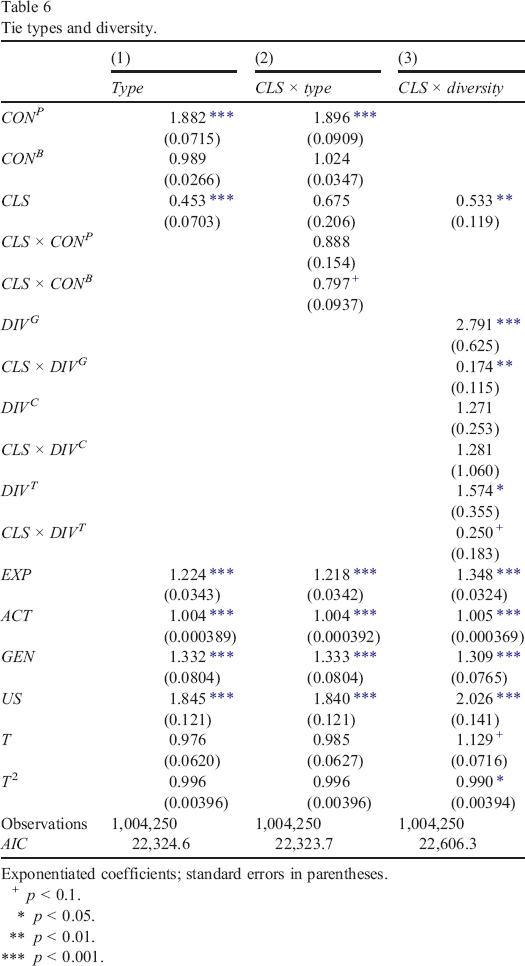
In Table 6, we present our results about the moderating effects of tie type and categorical diversity. Model 1 shows parameter estimates for the effects of the sizes of users’ personal and business networks. For example, the estimate of the coefficient for the variable CONP represents the effect of the size of users’ personal networks. From the estimated parameters, it is clear that the hazard of eCard purchase increases with the size of users’ personal networks, but does not significantly increase with the size of users’ business networks, which provides support for Hypothesis 4.
Tie types and diversity.
Exponentiated coefficients; standard errors in parentheses.
p < 0.1.
p < 0.05.
p < 0.01.
p < 0.001.
In Table 6 Model 2, we add interactions between density and the sizes of users’ personal and business networks. While the negative effect of density does not vary with the size of users’ personal networks, the effect is marginally stronger (i.e., more negative) for networks that contain more business ties. This provides preliminary support for Hypothesis 5, though the interaction is only marginally significant. However, the effect is statistically significant in alternate model specifications and when using larger samples. We discuss this further in the robustness section below.
Table 6 Model 3 displays parameter estimates for the main effects of our three diversity measures, as well as their interactions with network density. The interaction of network density with gender diversity is statistically significant, and the interaction with tie type diversity is marginally significant (p < 0.06). 6 However, the interaction between network density and nationality diversity did not reach significance. The effect of social visibility on eCard purchase is thus moderated by the extent of gender and tie type diversity, providing support for Hypotheses 2a and c.
This interaction is significant by traditional (p < 0.05) standards in larger samples.
Robustness
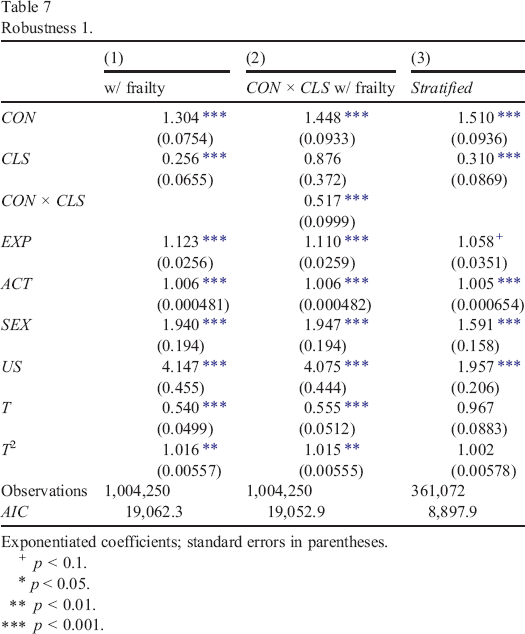
To control for unobserved heterogeneity not captured by the demographic variables, we estimate a parametric hazard model with an additional random intercept, or frailty term (Therneau 2000; Risselada, Verhoef, and Bijmolt 2014). We assume a Weibull distribution for the baseline hazard and a normal distribution for the random effects. Table 7 shows the results of this more robust specification. Model 1 confirms that all of the hypothesized main effects still hold. In fact, the negative effect of density is stronger and the effect of network size is weaker when we account for unobserved heterogeneity. Model 2 shows that the interaction we predicted in Hypothesis 5 also holds under this specification. Though not shown here, we ran all other models using the new specification and the results are qualitatively similar.
Robustness 1.
Exponentiated coefficients; standard errors in parentheses.
p < 0.1.
* p < 0.05.
p < 0.01.
p < 0.001.
Given that we ran our models on a random sample of users and not on the entire population, it is possible that our results could be caused by biases introduced by our sampling method. For example, the number of users increased rapidly during the two years in our study. Thus, a purely random sample of users will draw more heavily from users that joined later. To account for this potential bias, we sampled the data again, but this time sampled twelve 10,000 user random samples that were stratified on when users started using the online social network. We present the results of this analysis in Table 7. Model 3 confirms that the hypothesized effects are in the predicted directions.
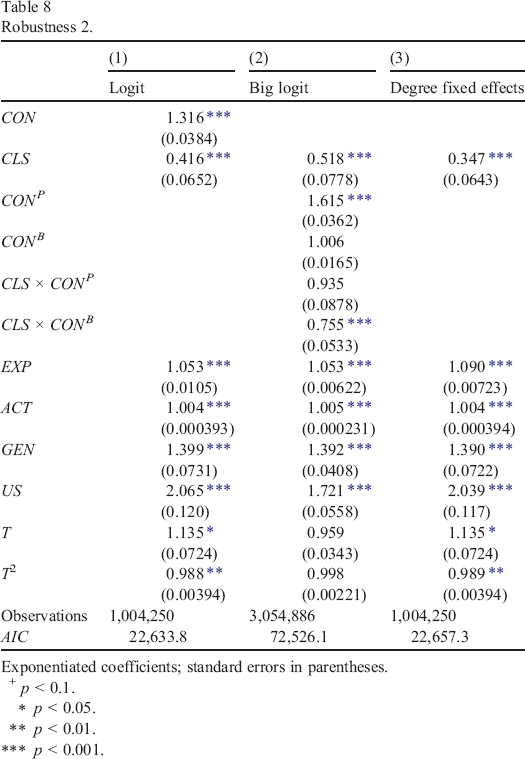
We also ran our models using various alternative specifications. Table 8 Model 1 shows parameter estimates from a logit specification, and the main effects are qualitatively and quantitatively similar. Table 8 Model 2 implements a logit as well, but on a much larger sample and with interactions between network density and the sizes of users’ personal and business networks (as in Table 6 Model 2 above). This specification provides two benefits over the split-population model. First, it is computationally prohibitive to run a split-population model on such a large sample size. Second, we gain confidence that our results are not an artifact of the hazard model specification.
Robustness 2.
Exponentiated coefficients; standard errors in parentheses.
+ p < 0.1.
p < 0.05.
p < 0.01.
p < 0.001.
Table 8 Model 3 displays parameter estimates for network density and the control variables when including fixed effects for network size. All networks of sizes 2 through 20 were assigned an indicator variable, and networks of size 21 and greater were also assigned an indicator. We do not show estimates of the effects of these indicators for brevity. When including fixed effects for network size, the effect of network density remains statistically significant. Given that network size and density are typically negatively correlated, this is an important robustness check. 7
Although not shown here, we performed additional robustness checks by limiting our sample to users with various specific network sizes. For example, the negative effect of density holds even for a sample of users with more than 10 ties.
Finally, we acknowledge that the interpretation of interaction effects in nonlinear models is not straightforward (Hoetker 2007). This occurs because the interaction effect depends on the values of the other covariates included in the model (Ai and Norton 2003), which can lead to situations in which the strength (and even direction) of the reported interaction effect may differ depending on the predicted probability. To account for this possibility, it is a common practice to examine the value of the interaction effect across a range of covariate values — typically at levels that both increase and decrease the predicted probability (Huang and Shields 2000). We performed these checks for all reported interactions and note that our qualitative interpretations remain unaffected.
Discussion
In this paper, we argue that social visibility can influence the decision to exchange gifts through online social networks. To support this argument, we analyze a novel dataset from a large online social network that offers users the option of buying a service that lets them send electronic greeting cards (eCards) to other users. We find that purchase rates of the service increased with the number of ties that users kept, but decreased with their density — the extent to which these ties were tied themselves. We argue that social visibility is more prevalent in dense networks, because gifts sent from a user to one tie can be monitored by any mutual contacts they share. Given the well-documented anxieties surrounding the gifting process, such social surveillance can discourage users from gifting digital goods.
The negative effect of density we uncover is relatively strong compared to the effects of the other variables we study. For example, after controlling for a variety of individual and environmental factors, we find that the hazard of adoption increases by 44% for every 1 point increase in network size. Since we measure network size as the natural log of the number of ties in a user's network, a one point increase is equivalent to a 270% increase in the number of ties. Thus, a 10% increase in the size of an individual's network only increases the hazard of eCard purchase by 1.6%, on average. In contrast, the hazard rate decreases by 5.8% for every additional 10% in the clustering coefficient of an individual's social network. Moreover, we find the effect is even greater for individuals with large, impersonal, or diverse social networks.
The introduction of the company's People You May Know (PYMK) feature in July of 2008 increased users’ clustering coefficients by an average of 50% – from 0.30 to 0.45 – in less than six months (see Fig. 6). Moreover, the effect appears to differ by network type. Whereas the initial increase in density due to PYMK declines over time for users’ friend and family networks, it continues to increase for users’ business networks. The introduction of PYMK thus encouraged sustained growth in the density of users’ business networks. As we show, the negative effect of the clustering coefficient on eCard adoption is highest for users with many business ties. The PYMK feature thus increased the potential for third-party visibility (and hence social risk), which likely contributed to the decline in purchases per user from 2.25% at the start of our timespan to less than 1% by the end.
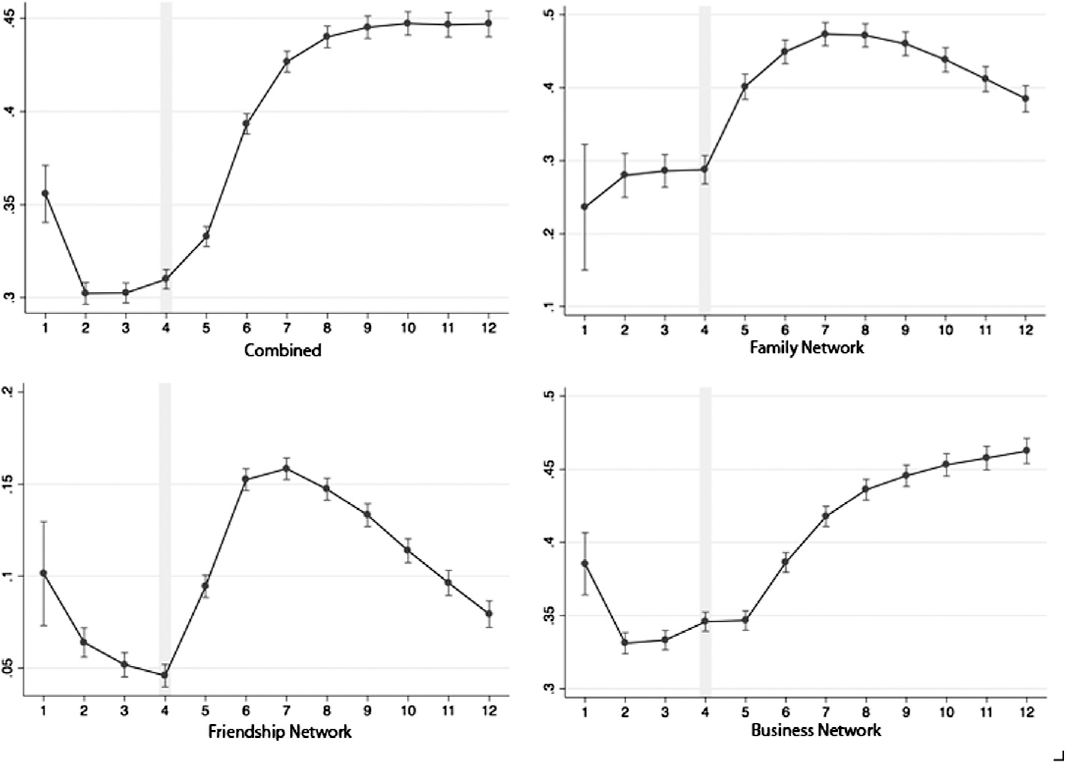
Regression of degree-scaled clustering on time fixed-effects and other endogenous regressors over 24 months with 95% confidence intervals. Vertical gray line indicates change in algorithm driving PYMK function. The y-axis represents the estimated coefficients on the time fixed effects.
Companies like Facebook and OkCupid regularly make feature changes that affect the ways in which their users interact (Kramer, Guillory, and Hancock 2014; Rudder 2014). For example, Facebook introduced its own PYMK feature in 2008. Since that time, Facebook has twice tried and failed to implement a sustainable gifting service for its users (Constine 2014). For services like this to be successful, managers will need to think strategically about the types of social ties they promote. Importantly, companies could also benefit from giving users better control over whether or not their online activity is visible to other users. For example, the company in our study allowed users to send eCards in private, but this was not the default option. By making private gifting the default option, the company may have been able to signal its concerns about social surveillance and potentially alleviate some of their users’ anxieties.
In many cases, managers are provided with incentives to increase the number of connections users form, with the idea that this will increase engagement with their online platform. However, we argue that engagement may depend crucially on the type of connections users make. For example, in our context, high levels of density were associated with lower eCard purchase when users had a large number of business ties, but the effect was lower for networks that consisted of more personal ties. We suggest that this occurs because there is more anxiety associated with giving gifts to impersonal social ties, and also with giving gifts in the presence of such ties. The implication of our findings is that product managers should be wary of strategies that encourage new, density-increasing social ties to relative strangers.
Just as PYMK increases network density by encouraging connections to friends of friends, so do strategies that encourage firms to grow their online following by recruiting friends of existing followers. By increasing the density of a firm's follower network, recruiting friends of followers expands the audience that can view interactions between followers and the firm (see Fig. 7). To the extent possible, requests for engagement (e.g., soliciting comments on a Facebook post) should be done with some knowledge of followers’ social networks. Followers that register high levels of social risk, based on the visibility of their interactions, may limit the scope and honesty of their participation. This, in turn, can reduce the value of these users’ participation, and resources might be better spent by focusing on followers that have fewer such concerns.
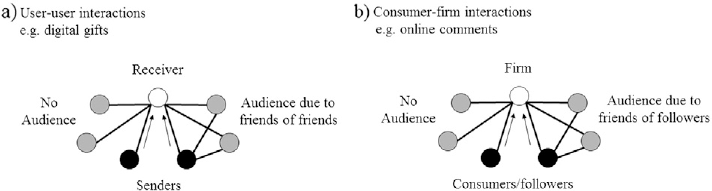
Depiction of audience effects in a) user–user and b) consumer–firm contexts. Promoting connections to friends of friends increases network density and expands the audience that can monitor users’ interactions, as do strategies that encourage firms to recruit friends of existing followers.
More broadly, measuring the success of social media campaigns has also ignited considerable debate (see e.g., Hoffman and Fodor 2010). Part of the issue stems from a lack of understanding about the value of new metrics like Facebook ‘likes’ or Twitter ‘retweets.’ Our theory contributes to this debate by pointing to an important potential moderator of campaign success by these metrics — namely, if targeted individuals feel like their interactions with companies are too visible, they may refrain from liking or retweeting promotions even if they have a generally favorable attitude towards the campaign. Future research should examine these and other effects of social visibility, as well as other mechanisms driving our results. Research identifying the causal link between social visibility and consumer behavior is particularly welcome, as is research demonstrating the link between social visibility and consumer restraint in other contexts — including online interactions between consumers and firms.
Finally, our findings directly relate to the broader issue of practicing intimacy in an increasingly public, online world. Social psychologists argue that individuals require private disclosures of information in order to build meaningful relationships with those around them (Laurenceau, Barrett, and Pietromonaco 1998; Reis and Shaver 1988). The public nature of interactions on Facebook could be one of the reasons why the platform is increasingly associated with loneliness and decreases in well-being (Burke, Marlow, and Lento 2010; Kross et al. 2013). This has also created a void which is quickly being filled by competitors like Snapchat and Sup, which give users more privacy in their interactions. If large online social networks and the services that rely on them are to succeed over the long term, managers need to be more strategic about the types of interactions they promote.