
Abstract
Consumers often share product-related content (e.g., advertising), and highly shared advertising has a huge impact on consumer behavior. Despite its apparent effectiveness, prediction of whether such advertising will be highly shared is a poorly understood area of marketing. Advances in brain imaging techniques may allow researchers to forecast aggregate consumer behavior beyond subjective reports. Using neuroimaging techniques, previous research has established models showing that expectations of self-related outcomes (potential for self-enhancement) and the social impact of sharing (potential for social approval) contribute to the likelihood of users sharing non-commercial static content (i.e., text-based health news). However, whether this finding can be applied to forecasting the virality of dynamic commercial stimuli, which is more relevant to interactive marketing (i.e., video ads), remains unknown. Combining brain imaging techniques, cross-validation methods, and real-world data regarding sharing on social media, the present study investigated whether brain data can be used to forecast the viral marketing success of video ads. We used neuroimaging (functional magnetic resonance imaging: fMRI) to measure neural activity during three sets of theory-driven neural measures implicated in value, self, and social (mentalizing) processes while 40 participants viewed video ads that brands had posted on Facebook. Contrary to previous findings regarding value-related virality in non-commercial static content, our results indicate that social-related neural activity contributes significantly to forecasting the virality of dynamic marketing-related content. The model that included both social-related neural measures and subjective intentions to share forecasted viral marketing success better than the model that included only social-related neural measures. The model that included only subjective intention to share did not forecast viral marketing success. Overall, these findings provide a novel connection between neurophysiological measures and real-world dynamic commercial content. Contrary to previous neuroforecasting findings, social-related but not value-related neural measures can significantly improve our ability to predict market-level sharing of video ads.
Introduction
Information Sharing and Viral Marketing
Information sharing is an essential part of social interactions, and consumers often share product-related information with other consumers (e.g., Babić Rosario, Sotgiu, De Valck, & Bijmolt, 2016; Berger, 2014). This type of sharing influences the reach and impact of information relevant to the advertising that brands create. Viral marketing, also known as word-of-mouth or buzz marketing, is a marketing strategy that causes intentional consumer-to-consumer sharing of information (Kozinets, De Valck, Wojnicki, & Wilner, 2010; Phelps, Lewis, Mobilio, Perry, & Raman, 2004). Viral marketing is generally more effective and less expensive than traditional advertising (Trusov, Bucklin, & Pauwels, 2009) and, additionally, the sharing of information by consumers (i.e., word-of-mouth) positively influences brand attitude (Wu & Wang, 2011) as well as sales (Babić Rosario et al., 2016). Given these positive influences of consumer sharing behaviors, companies have developed an interest in how viral marketing success (i.e., a lot of sharing of content by consumers) can be achieved.
Digitalization of Virality
Viral marketing has been particularly highlighted on digital media, such as social networking sites. For example, on Facebook, which is one of the largest social networking sites, users share billions of pieces of information about products and brands with a wide range of people (Facebook, 2018). Facebook provides companies with the opportunity to reach their target audience by posting advertisements through an individual's account less obtrusively than with traditional media (Boerman, Willemsen, & Van Der Aa, 2017). If a post is shared by Facebook users, it appears in the Facebook newsfeed of their friends as a non-commercial post. As a result, companies have focused their attention on social networking sites (e.g., Facebook), where consumers are spontaneously sharing information, rather than on paid media (e.g., television), where brands advertise themselves. Video ads are regarded as a particularly powerful tool for communicating brand information to consumers via social media, and marketers/advertisers are increasingly investing in video ads on social media (American Marketing Association, 2017; eMarketer, 2017). Consequently, the creation and success of video advertising (i.e., company-generated content) that will be widely shared on Facebook has become an increasingly important metric for marketing.
Which Advertising (or Company-Generated Content) Will Go Viral on Social Media?
Predicting whether an advertisement (or company-generated content) will go viral on digital media is an important issue. Although a growing body of research has demonstrated which type of content will effectively go viral, these studies have primarily relied on self-report measures relating to static stimuli (e.g., news articles) (e.g., Babić Rosario et al., 2016; Berger & Milkman, 2012; Botha & Reyneke, 2013; Lee & Ma, 2012) and dynamic stimuli (e.g., video ads) (e.g., Tellis, MacInnis, Tirunillai, & Zhang, 2019; Quesenberry & Coolsen, 2019). However, people may lack the ability or desire to express their thoughts accurately or to explain their behavior (Dijksterhuis, 2004; Nisbett & Wilson, 1977). Thus, the existing self-report research may be biased by social desirability, memory gaps, and the inability to access unconscious information.
Brain-As-Predictor Approach
The brain-as-predictor approach shows that brain data predict consumer behavior (e.g., Alec et al., 2014; Berkman & Falk, 2013; Berns & Moore, 2012; Dmochowski et al., 2014; Falk, Berkman, & Lieberman, 2012; Genevsky & Knutson, 2015; Kühn, Strelow, & Gallinat, 2016; Knutson & Genevsky, 2018; Smith, Bernheim, Camerer, & Rangel, 2014; Telpaz, Webb, & Levy, 2015; Tong et al., 2020). Specifically, recent advances in neuroscience have shown that brain activity can more accurately forecast aggregate marketing outcomes than traditional measures, including subjective reports (Berkman & Falk, 2013; Knutson & Genevsky, 2018 for reviews). For example, brain data more effectively forecasts music sales (Berns & Moore, 2012), movie sales (Boksem & Smidts, 2015), advertising effectiveness (Falk et al., 2012; Venkatraman et al., 2015), and crowdfunding outcomes (Genevsky, Yoon, & Knutson, 2017) than self-reports. However, it remains unclear whether brain activity can forecast viral marketing success. Thus, using neuroimaging methods, the present study examined whether brain activity or traditional measures would better forecast viral marketing success (i.e., the magnitude of sharing advertising at an aggregate level).
Theoretical Background
Viral Video Ads
Viral video ads are a subset of viral marketing. Viral marketing may be concisely defined as the process of encouraging honest communication among consumer networks (Phelps et al., 2004), though several other definitions have been proposed (see Reichstein & Brusch, 2019). Viral marketing typically begins with marketers creating digital content (e.g., video ads) that is intended to be shared (e.g., Ho & Dempsey, 2010). Viral ads can be defined as (Eckler & Rodgers, 2014). Along with the growth of investment in video ads (eMarketer, 2017), an increasing interest in viral video ads has also emerged among academics and practitioners (e.g., Akpinar & Berger, 2017; Dafonte-Gómez, 2014; Nelson-Field, Riebe, & Newstead, 2013; Tellis, MacInnis, Tirunillai, & Zhang, 2019).
Sharing Motives: Value, Self, and Social
It has been suggested that value, self, and social factors underlie consumer sharing behavior due to the fact that people share information with others because it is valuable for themselves and for others (Scholz et al., 2017). Consumer sharing behavior is motivated by five key factors (Berger, 2014): impression management, emotion regulation, information acquisition, social bonding, and the persuasion of others. Each motive can be conceptualized as valuable because they correspond to holding positive self-images (self) as well as maintaining positive social relations (social) (Scholz et al., 2017). These diverse sharing motivations have been theorized into three components of motivation to share (value, self, and social factors) (Scholz et al., 2017). This classification largely corresponds to other research theorizing that motivation to share includes entertainment, status seeking, and socialization (Lee & Ma, 2012) or self-focus and other-focus (Barasch & Berger, 2014). Similarly, Park, Kee, and Valenzuela (2009) proposed that four primary needs are fulfilled through social media use, including information seeking, socializing, entertainment, and self-status seeking.
In the field of viral video ads, Tellis and colleagues categorize motivation to share into self-serving, social, and altruistic motivations (Tellis et al., 2019). Self-serving motives are motivations for self-enhancement. Sharing content can enhance one's status, reputation, or uniqueness by making one familiar in the marketplace (Lee & Ma, 2012; Lovett et al., 2013). Social motives are connected to one's intention to engage with a community (learn about community interests, socialize with community groups) (Tellis et al., 2019). Altruistic motives are sharing motives based on concern for others, desire to help others, and expression of empathy for others (Tellis et al., 2019). Given that social and altruistic motivations are similar in that both involve social relations with others, these motives may be broadly categorized into a single “social” category (see Alexandrov, Lilly, & Babakus, 2013; Scholz et al., 2017). Together, given previous conceptualizations of motives for sharing (Alexandrov et al., 2013; Lee & Ma, 2012; Scholz et al., 2017; Tellis et al., 2019), this study relies on the three-component model of sharing (social, self, and value) mostly derived from Scholz et al. (2017). Specifically, self-related and social factors influence the value of virality, leading to intention to share (Scholz et al., 2017). (Fig. 2).
Value-Related Processing Affecting Viral Video Ads
Previous research on interactive marketing has shown which factors influence viral video ads. The growing body of literature on interactive marketing has demonstrated that positive attitudes/feelings are a major factor affecting video sharing (e.g., Eckler & Bolls, 2011; Huang, Su, Zhou, & Liu, 2013; Shehu, Bijmolt, & Clement, 2016; Southgate, Westoby, & Page, 2010). For example, Huang et al., have shown that a positive attitude toward viral videos is the main factor affecting video sharing (Huang et al., 2013). Southgate and colleagues suggest that enjoyment and involvement are associated with viral viewings of TV ads (Southgate et al., 2010). Similarly, Eckler and Bolls indicate that positive emotional tone elicits strong intention to share video ads (Eckler & Bolls, 2011). Other research also shows that positive attitude or positive emotional experiences relating to video ads lead to greater intention to share (Shehu et al., 2016) and virality of video ads (Tellis et al., 2019). Together, these findings suggest that value-related processing, such as positive attitude or pleasant feelings, is a key factor influencing viral video ads.
Self-Related Processing Affecting Viral Video Ads
Self-related processing is associated with sharing behavior and it has been suggested that expectations of self-relevant outcomes are a primary driver behind sharing for non-commercial and marketing content (e.g., Alexandrov et al., 2013; Berger & Iyengar, 2013; Chen & Yuan, 2020; De Angelis, Bonezzi, Peluso, Rucker, & Costabile, 2012; Scholz et al., 2017; Tellis et al., 2019). The concept of the self-related processing of sharing encompasses various specific thought processes (Berger, 2014; Scholz et al., 2017). Thoughts about self-relatedness, such as self-presentation and/or self-enhancement, provide motives for sharing, and information that encompasses self-relatedness motives is likely to be highly shared (Berger, 2014; Cappella, Kim, & Albarracín, 2015; Scholz et al., 2017). Additionally, self-relevant information is a frequent conversation topic (Dunbar, Marriott, & Duncan, 1997; Landis & Burtt, 1924), especially on social media (Naaman, Boase, & Lai, 2010).
Self-motives are behind viral video ads. Self-motives are among the key factors influencing digital sharing behavior in marketing contexts (e.g., Alexandrov et al., 2013; Ho & Dempsey, 2010). In the context of viral video marketing, self-motives to share have been examined (Taylor, Strutton, & Thompson, 2012; Nikolinakou & King, 2018). For example, Taylor and colleagues have shown that college students share video ads on social media driven by the motivation of self-enhancement. University students are likely to share video ads that are congruent with their personalities as a means of expressing their identities (Taylor et al., 2012). It has also been shown that viral video ads are motivated by a desire for distinctiveness. Specifically, two dimensions of distinctiveness (status/superiority and uniqueness) are associated with the drive to share viral video ads (Nikolinakou & King, 2018).
Social-Related Processing Affecting Viral Video Ads
Social processing is related to sharing behavior, and studies have shown that expectations of the social outcomes of sharing are also a primary driver behind the sharing of non-commercial and commercial content (e.g., Alexandrov et al., 2013; Lee & Ma, 2012; Scholz et al., 2017; Tellis et al., 2019). Social communications via digital media (e.g., text messages) very often involve phatic expressions and convey that the sender is thinking of the recipient (Rettie, 2009). Thus, socializing and maintaining relationships are among the key factors influencing the use of social media communications (Dunne, Lawlor, & Rowley, 2010; Park et al., 2009). Social bonding and the persuasion of others appear to involve social processing (Scholz et al., 2017). Although social processing is broadly defined, it is associated with a specific social cognition (i.e., mentalizing) that influences sharing behaviors. Mentalizing is defined as thinking about others’ mental states (Frith & Frith, 2006). According to the theoretical framework of mentalizing, people represent others’ mental states in terms of rationality-emotionality, socially aroused-individual focused, and positive–negative valence (Tamir, Thornton, Contreras, & Mitchell, 2016; Thornton & Tamir, 2020). In fact, empirical evidence has shown that mentalizing and social considerations influence sharing behaviors (Baek, Tamir, & Falk, 2019; Dubois, Bonezzi, & De Angelis, 2016; Fu, Wu, & Cho, 2017; Moore & McFerran, 2017). The instruction to consider the mental states of receivers increased the intention to share compared to the instruction to reflect on the contents (Baek et al., 2019).
Previous research on viral video marketing has shown that social-related motives underlie sharing behaviors. Tellis et al. (2019) suggest that two dimensions of social motives, socializing (connecting with others) and altruism (helping others), influence the sharing of viral video ads. According to Tellis and colleagues, social motives include learning/socializing with community members, concern/empathy for others, and/or helping others (Tellis et al., 2019). Empirical and theoretical research has also shown that social-related motives (e.g., affiliation, altruism) influence intention to share and/or sharing behavior across electronic platforms (e.g., Hennig-Thurau, Gwinner, Walsh, & Gremler, 2004; Ho & Dempsey, 2010; Phelps et al., 2004). For example. Phelps et al., (2004) indicated that social motives (to help others, to care about others) are commonly cited by consumers as motivations for sharing ads with others. Overall, these findings suggest that viral video ads also involve social-related motives to share. The theoretical model used in the present research is shown in Fig. 1.
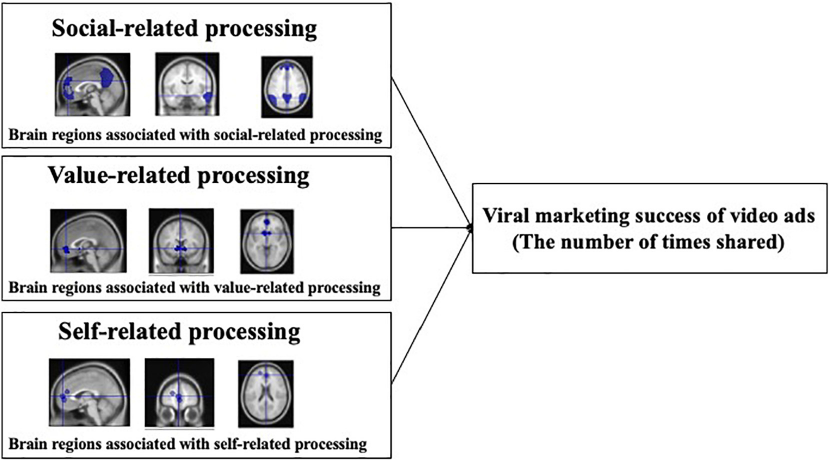
Theoretical model of viral marketing success of video ads on social media. Consumers engage in social-, value-, and self-related processing, which influences video ad sharing behaviors.
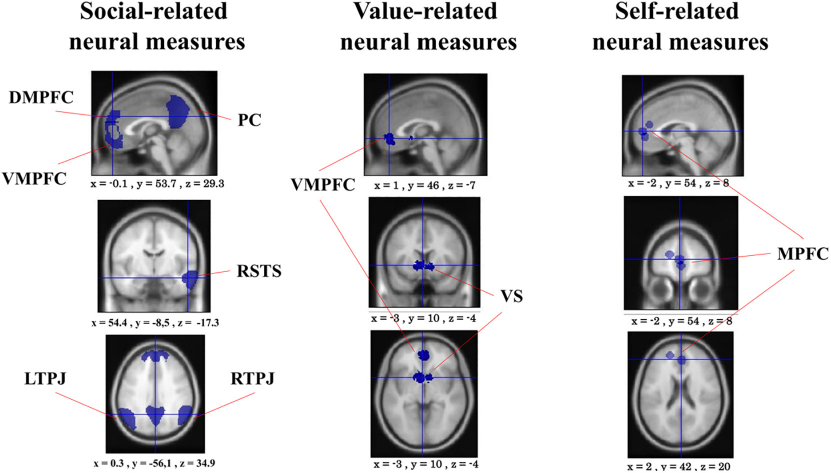
Social-, value-, and self-related brain measures. Abbreviation: DMPFC (dorsomedial prefrontal cortex), VMPFC (ventromedial prefrontal cortex), PC (precuneus), RSTS (right anterior superior temporal sulcus), L/RTPJ (left and right temporo-parietal junction), VS (ventral striatum), MPFC (medial prefrontal cortex).
Contribution of Neuroimaging Techniques in Interactive Marketing
Recent advances in neuroscience, and particularly in functional magnetic resonance imaging (fMRI), have benefited researchers investigating online advertising. Neural data captured by fMRI offer unique advantages for addressing research questions on consumer behaviors, such as: (1) distinguishing between consumer psychological processes and (2) measuring implicit consumer behaviors (e.g., Motoki, Sugiura, & Kawashima, 2019; Plassmann, Venkatraman, Huettel, & Yoon, 2015; Reimann, Schilke, Weber, Neuhaus, & Zaichkowsky, 2011). fMRI can track mental activity reflected in neural responses in real-time consumer decision processes (Plassmann et al., 2015; Reimann et al., 2011). The characteristics of fMRI rely less on self-report and reduce concerns about response biases, such as social desirability, memory distortion, and fabrication (Plassmann et al., 2015; Reimann et al., 2011).
Contribution of Neuroimaging Techniques to Advertising
Neuroimaging techniques are beneficial for interactive marketing research, such as that focusing on viral video marketing. Although traditional (online) advertising research usually relies on self-reports, neuroimaging techniques capture (automatic) processing of advertising in real time (e.g., Casado-Aranda, Sánchez-Fernández, & Montoro-Ríos, 2019 for a review). It has been suggested that online advertising research benefits greatly from neuroscientific findings, and existing theories of online ads are tested by neuroscientific tools to obtain deeper insights into consumers’ minds (Liu-Thompkins, 2019). Neuroscientific techniques may be useful in addressing “why” or “how” a particular video ad triggers virality by revealing neural mechanisms (see Scholz et al. (2017) for an example of health-related news). Thus, neuroimaging techniques may prove useful in investigating consumers’ mental processes during exposure to video ads intended to be shared online.
Previous Research Using Consumer Neuroscience in Interactive Marketing
Using neuroimaging techniques, earlier research in interactive marketing has elucidated the psychological processes of consumers’ online behavior (e.g., Casado-Aranda, Dimoka, & Sánchez-Fernández, 2019; Casado-Aranda, Liébana-Cabanillas, & Sánchez-Fernández, 2018; Casado-Aranda, Sánchez-Fernández, & Montoro-Ríos, 2018; Dimoka, 2010; Hubert, Hubert, Linzmajer, Riedl, & Kenning, 2018; Riedl, Hubert, & Kenning, 2010; Venkatraman, Clithero, Fitzsimons, & Huettel, 2012). For example, Dimoka investigated whether trust and distrust are distinct constructs or a uni-dimensional trust–distrust continuum in the context of eBay seller profiles (Dimoka, 2010). Neuroimaging findings revealed that trust and distrust activate different brain regions, suggesting that they are distinct psychological constructs. Along this line, Casado-Aranda and colleagues investigated neural antecedents of trust and risk in the context of e-payment (Casado-Aranda, Liébana-Cabanillas, & Sánchez-Fernández, 2018). The authors indicated that risky e-payments are associated with brain regions implicated in negative emotional processing, while secure e-payments activate reward-related brain regions. The authors suggested that these neural responses might be automatic. Together, these findings suggest that neural measures have facilitated explorations of the underlying mechanisms of online consumer behavior.
Elucidating Theoretical Models of Viral Video Ads
In our theoretical model, we assumed that social, value, and self-related processing lead to the virality of video ads (Fig. 1). However, self-reports may hinder the differentiation of the relative contributions of each component (social, value, and self) to viral marketing success. Self- and social-related processing are conceptually intertwined (e.g., Brewer, 1991; Scholz et al., 2017; Sugiura, 2013; Sugiura et al., 2012). A concept of “social self” has been suggested, whereby one's sense of self is represented by their inclusion in or exclusion from social groups and practices (Brewer, 1991). In the case of the present research, self-related processing (e.g., self-enhancement) might involve social-related processing (e.g., inference of what others think about self-enhancement). The conceptual intertwining of the two makes it difficult to elucidate the relative importance of the underlying cognitive processes behind sharing video ads.
Neuroimaging tools may be useful in elucidating the underlying cognitive processes behind sharing video ads. As suggested by neuroimaging research on interactive marketing (Casado-Aranda, Dimoka, & Sánchez-Fernández, 2019; Casado-Aranda, Sánchez-Fernández, & Montoro-Ríos, 2018), neuroimaging techniques might reveal (automatic) psychological processes that underlie the motives for sharing. Specifically, it has been proposed that only a subset of the components (in our case, social-, self-, and value-related processing) from consumer behavior (i.e., sharing video ads in our case) generalize to forecast aggregate marketing outcomes (Knutson & Genevsky, 2018). Neuroimaging tools such as fMRI can break down the (automatic) psychological process of sharing video ads into its component processes (i.e., social, self, and value-related processing) and could allow us to discover which of these components best forecast viral marketing success and deepen theoretical understanding of the sharing process of viral video ads.
Neural Underpinnings of Virality: Value, Self, and Social
It has been suggested that the neural underpinnings of sharing consist of regions related to valuation, self-related processing, and social-related processing (Scholz et al., 2017). Additionally, this model of sharing suggests that two types of input, self-related processing and social-related processing, integrate into overall value-related processing.
The value-related brain areas include subregions of the ventromedial prefrontal cortex (VMPFC) and ventral striatum (VS), which compute valuation (e.g., Bartra, McGuire, & Kable, 2013; Clithero & Rangel, 2014; Suzuki, Cross, & O'Doherty, 2017). It has been suggested that media content (e.g., video ads) shares functions as a value-based decision (Scholz, Jovanova, Baek, & Falk, 2019). Activities in the value-related regions (vmPFC and VS) are associated with population levels of sharing health-related news (Scholz et al., 2017).
In operational terms, self-related processing is associated with neural activity that specifically encompasses the medial prefrontal cortex (MPFC) (e.g., Murray, Schaer, & Debbané, 2012; Northoff et al., 2006; Sugiura, 2013; van der Meer, Costafreda, Aleman, & David, 2010). The region is enhanced during the processing of self-relevant thought and shows greater activity when people intend to share information (Baek, Scholz, O'Donnell, & Falk, 2017). The self-related neural measures are associated with population levels of sharing health-related news mediated by activities in the value-related regions (Scholz et al., 2017).
In operational terms, social-related processing (mentalizing) is associated with activity in the dorsal MPFC (DMPFC), bilateral temporoparietal junction (TPJ), posterior cingulate cortex (PCC), vmPFC, and right superior temporal sulcus (STS) (Dufour et al., 2013). Neural activity in the mentalizing system may constitute a range of thought during sharing behavior that is associated with the meaning of the shared information to receivers and the potential social interactions related to sharing (Baek et al., 2017; Scholz et al., 2017). For example, neural activity in the mentalizing system is involved in sharing decisions made by an individual (Baek et al., 2017). Additionally, these regions exhibit greater activation in successful persuaders (Falk et al., 2013) and when incorporating others’ recommendations into one's product evaluation (Cascio, O'Donnell, Bayer, Tinney Jr, & Falk, 2015). Based on this theoretical perspective (Scholz et al., 2017), the present study constructed three neural networks that correspond to value, self, and social to investigate whether activity in these brain regions would be associated with self-related processing, mentalizing, and valuation and effectively forecast viral marketing success. The following hypotheses have been established (Fig. 1).
Novelty of the Present Research Compared to Previous Neuroimaging Studies
Although Scholz et al. (2017) investigated a neural model of virality, some issues remain. Firstly, Scholz et al. (2017) showed that brain data, especially value-related brain measures, explain the virality of non-advertising content (health-related news), and they did not consider marketing-related outcomes. Factors influencing marketing communications (e.g., advertisements) may be different from those influencing non-marketer-generated content (e.g., news articles). The persuasion knowledge theory suggests that consumers’ attitudes depend on who created the content intended to be shared (Friestad & Wright, 1994). Commercial contents (e.g., advertisements) may be treated with more suspicion and be discounted more frequently than non-commercial content (Boerman et al., 2017). For this reason, previous research on the neural underpinnings of non-commercial virality (Scholz et al., 2017) may not generalize to the virality of commercial content such as advertising.
Secondly, Scholz et al. (2017) used static and unimodal stimuli (visual processing of news articles). Although the participants listened to audio files of the articles, processing of the actual stimuli was unimodal (news articles seem not include audio files). Brain regions forecasting aggregate preferences for dynamic and multimodal stimuli (video ads) are reportedly different from those for static and unimodal stimuli (Chan, Smidts, Schoots, Dietvorst, & Boksem, 2019). Thus, whether previous findings regarding the virality of static stimuli (text-based news) can be generalized to the virality of dynamic multimodal stimuli remains unknown.
Finally, previous research also presented models explaining the number of times text-based health news was shared based on neural data (Scholz et al., 2017), but did not demonstrate actual predictions; instead, they only showed correlations. Although neuroimaging studies have claimed to predict aggregate marketing outcomes (e.g., sales; Boksem & Smidts, 2015; Berns & Moore, 2012; Kühn et al., 2016), conclusions have often been based on correlation, which is an inappropriate application of the statistical concept of prediction. Thus, whether brain data can be used to forecast real-world sharing of advertisements that go viral (or which brain regions might be useful for doing so) remains unknown.
The Present Study
Combining brain imaging techniques, cross-validation methods, and real-world data regarding online sharing of advertisements, the present study investigated whether brain data can be used to forecast the viral marketing success of marketing-related outcomes. We emphasize advertisements rather than other types of sharing, such as online health-related news, because marketers/companies have strong desires for consumers to share their advertisements on social media. Moreover, as stimuli, we used video ads, which are characterized by their longer duration and their dynamic and multimodal qualities. Viral marketing success was defined by the number of times brand-generated content was shared on social media. While in a magnetic resonance imaging (MRI) scanner, the participants viewed 40 video ads that brands had actually posted on Facebook. We measured activity in brain areas previously implicated in value-, self-, and social-related processing. We tested for which neural measures (value-, self-, or social-related neural measures) or self-reports successfully predicted the viral marketing success of video ads on social media using actual predictions based on a cross-validation method.
Method
Participants
This study included 42 healthy right-handed Japanese volunteers with no history of neurological or psychiatric illnesses (12 females, mean age: 21.38 years) and was conducted in 2017. Participants were recruited through notices on a university campus and provided written informed consent after receiving an explanation regarding the nature of the experiment. All procedures were conducted according to the Declaration of Helsinki, and the experimental protocol was approved by the ethics committee of Tohoku University School of Medicine. Two participants were excluded from the analyses due to excessive head motion (> 3 mm; n = 1) and lack of a response on subjective rating measures (n = 1).
To ensure that the participants were familiar with Facebook but unfamiliar with the video ads presented during the experiment, they were recruited using the following procedure. First, potential participants were asked whether they had a Facebook account. Second, they were presented with 40 video ads (only cover and title) and asked to indicate whether they had previously viewed any of them. Based on the answers to these questions, 42 participants who had a Facebook account but had never seen any of the 40 video ads to be presented in the scanner were selected for the fMRI experiment.
Video Ads
During the MRI sessions, participants passively viewed 40 official video ads that were actually posted by brands on Facebook (mean duration: 52.43 seconds, standard deviation [SD]: 25.67 seconds) (Fig. 3). The video ads were selected based on the number of shares in each range to reduce the skew of the data. The video ads were all released in 2016, were randomly selected before the experiment started, and were aired in Japanese. The video ads used in this experiment are shown in Appendix B.
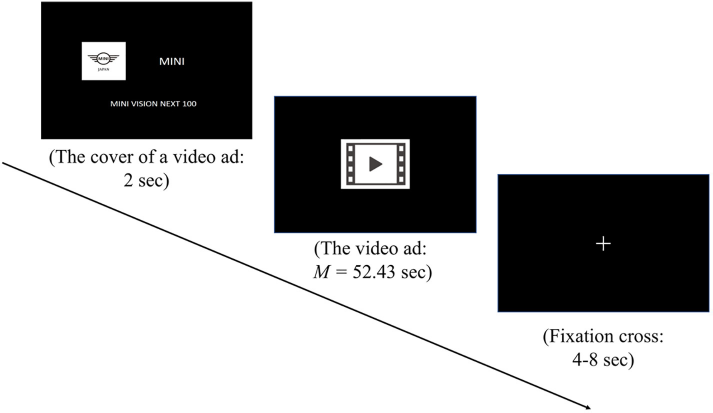
fMRI task structure. The participants were shown the cover of a video ad, and then the video ad followed by a fixation cross. Neural activation relevant to each video ad (while viewing the cover of the video ad and the actual video ad), relative to the implicit baseline (fixation cross) was used for subsequent analyses. The actual video ads are not shown in this figure due to copyright reasons. Please see Appendix A for video ads used in this experiment.
Procedure
Upon arriving at the lab, participants received detailed written and verbal instructions about all experimental tasks. All participants wore fMRI-compatible headphones and were placed inside the scanner to view, passively, the 40 video ads. There was a total of four fMRI runs, with 10 video ads aired during each run (approximately 12 minutes per run). Each trial began with the presentation of the cover of a video ad for 2 seconds followed by the video ad. All video ads were played with sound, and each was followed by a fixation screen for 4–8 seconds. To determine whether each participant had viewed the video ads correctly, they were required to press a button on an MRI-compatible button box when the video cover appeared and after the video ended.
Following the MRI procedure, the participants were taken out of the scanner and escorted to an experimental room. To obtain subjective reports of the intention to share each video ad, the participants were asked to indicate the extent to which they would recommend each movie to their Facebook friends using a 7-point scale (1 = not at all, 7 = very much). The participants also used a 7-point Likert scale to indicate their preference for the video ads, preference for the brands, valence, and arousal. The stimulus presentation and response recording during the experiments were controlled using PsychoPy (Peirce, 2007). The order of the video stimuli was pseudo-randomized across participants, and the manner of stimuli presentation was the same as in the fMRI sessions, except that the subjective reports were obtained. The orders of the sessions and stimuli were pseudo-randomized across participants.
Value, Self, and Social
Three theory-driven neural networks (value, self, and social) were defined based on previous meta-analyses (Scholz et al., 2017). The selection of the meta-analyses was based on Scholz et al. (2017), except for the self-related network.
The value-related neural network was defined by a meta-analysis (Bartra et al., 2013) that identified brain regions implicated in decision- and outcome-related valuations separately. Based on the meta-analysis, Scholz et al. (2017) allocated brain regions associated with decision-related valuation (VS and VMPFC) into their value-related neural networks, as they believe the decision-related process is more important in sharing behavior (Scholz et al., 2017). Following Scholz et al. (2017), we included the brain regions associated with decision-related valuation (VS and VMPFC) as the value-related neural networks (Fig. 9).
The self-related neural network was defined based on a meta-analysis of self-related processing (van der Meer et al., 2010), which is not cited in Scholz et al. (2017). Given that self- and social-related processing are conceptually overlapped (Brewer, 1991), assessment of self-specificity (i.e., the contrast for self- > other-reflection) is essential to identify brain regions associated with self-related processing. Scholz et al. (2017), however, defined the self-related network (mPFC and PCC) as not based on self-specificity (self > control) (Falk et al., 2015). We therefore referred to another meta-analysis (van der Meer et al., 2010) that examined self-specificity. The analysis showed that only MPFC is present in the critical contrast for self-specificity (self- > other-reflection). Thus, we allocated mPFC but not PCC to the self-related neural network.
The social-processing (mentalizing) network was defined based on a large study that used a false-belief localizer task in which participants engaged in mentalizing (Dufour et al., 2013). We created a reduced version of the social-processing network, excluding the voxels in MPFC that overlap with the self-processing neural network (see Appendix for the detailed procedure) because the overlapped MPFC was observed in the contrast for self-specificity (i.e., the contrast for self- > other-reflection) and seems more preferentially associated with self- rather than social-processing (van der Meer et al., 2010). We used this reduced version of the social-related network in all analyses. Finally, the social-processing network includes the right TPJ (RTPJ), left TPJ (LTPJ), PCC, DMPFC, VMPFC, and RSTS.
fMRI Analysis
At the first level, the fMRI data were modeled for each participant using a general linear model implemented in SPM8. Based on a similar procedure previously used to forecast population-level outcomes in the brain, exposure to each video ad was separately modeled. The present models focused on the time of exposure to each video ad with the fixation screen rest periods constituting an implicit baseline. Specifically, using a single boxcar function for each trial (i.e., each of the 40 video ads), we extracted neural activity in each neural network during each trial and compared this activity to the baseline resting state, including fixation periods.
At the second level in SPM8, first-level maps averaged across all participants were combined to form statistical parametric maps of activation relevant to each video ad (the period of the cover of a video ad and the actual video ad), relative to the implicit baseline. The average parameter estimates of activity across all voxels in each neural network (value, self, and social) were extracted for each participant and each video ad using MarsBar (Brett, Anton, Valabregue, & Poline, 2002). For each participant, the parameter estimates were converted to z-scores for each neural network to reduce individual variability of neural responses. Then, the mean activity in each neural network across participants and for each video ad was computed. The group-average activations of the neural network for each video ad were used to forecast the number of times it would be shared at the population level (i.e., viral marketing success).
Combination of Brain Data with the Aggregate Sharing Data
Based on the brain-as-predictor framework, it was tested whether the three neural datasets (value, self, and social) and/or subjective data would forecast viral marketing success. To accomplish this, regression analyses were performed using four models: subjective reports (subjective intention to share), value (brain regions associated with valuation), self (brain regions associated with self-related processing), and social (brain regions associated with mentalizing). The number of times each video ad was shared on Facebook, which was an index of viral marketing success, was used as the dependent variable. The average rating of intention to share each video ad was used as a predictor variable for the subjective model, and the average activation in each neural network (value, self, and social) was used as a predictor variable for the neural model. Then, which combination of measures (e.g., brain regions associated with mentalizing and brain regions associated with self-related processing) would most accurately explain the number of times a video would be shared was investigated. To measure the goodness-of-fit of each model, Akaike information criterion (AIC) was used, as in previous neuroforecasting research (e.g., Genevsky et al., 2017; Genevsky & Knutson, 2015). The correlation coefficients of each neural measure are as follows: value and self-related neural measures (r = 0.896), value and social-related neural measures (r = 0.570), and social and self-related neural measures (r = 0.552).
All analyses were performed using R software (R Core Team, 2014). Additionally, prediction performance was analyzed using leave-one-out cross validation, and the correlation between the predicted and actual number of times a video was shared was calculated. The analyses were conducted using MATLAB (MathWorks) with custom MATLAB scripts. One-tailed tests with a p-value of 0.05 were conducted for all analyses with unidirectional hypotheses (i.e., neural activities and subjective reports would be positively correlated with the number of times a video was shared).
Results
Neural Measures associated with Viral Marketing Success
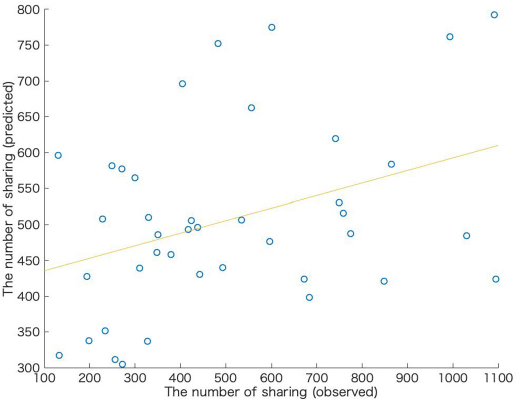
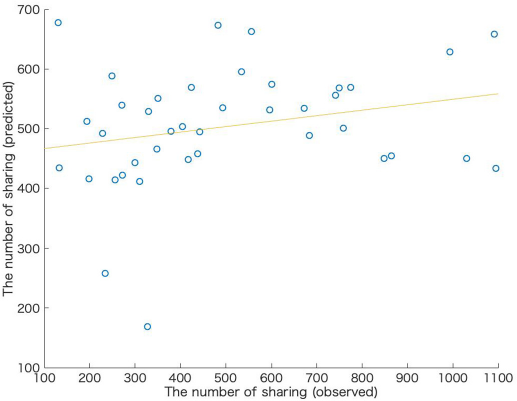
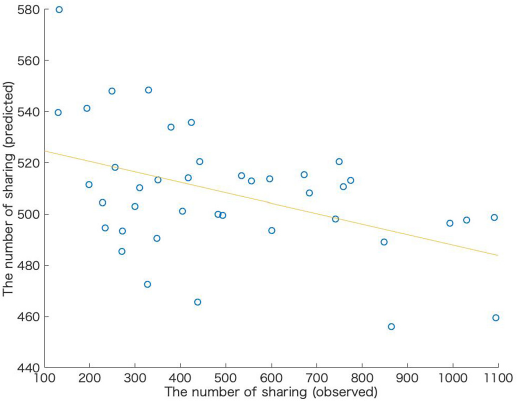
Consistent with previous findings (e.g., Berns & Moore, 2012; Genevsky et al., 2017), the present analyses revealed that the self-reported intention to share was not significantly associated with the actual number of times shared (B = 0.234, SE = 0.157, t38 = 1.480, p = .074, AIC = 116.260). Next, it was examined whether the number of times shared was associated with each of the three neural measures (activities in the social-, self-, and value-related neural measures). Linear regression analyses revealed that only neural activity in the social-related neural measures was positively correlated with the number of times shared (B = 0.368, SE = 0.151, t38 = 2.438, p = .010, AIC = 112.69). On the other hand, activities in the self-and value-related neural measures were not significantly coupled with the number of times shared (self-related neural measures: B = 0.086, SE = 0.160, t38 = 0.533, p = .299, AIC = 118.20; and value-related neural measures: B = 0.149, SE = 0.160, t38 = 0.929, p = .180, AIC = 117.60) (Fig 4).
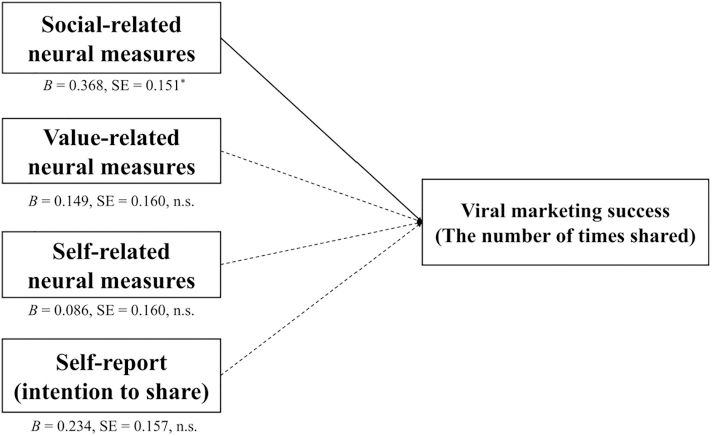
Illustration of the results of regression analyses. Each neural and self-report measure was entered into the predictor variable for the separated regression model.
We also tested for whether confounding factors (brand preference, movie length) were associated with the actual number of times shared. The additional analyses did not reveal that the brand preference was not significantly associated with the actual number of times shared (B = − 0.022, SE = 0.162, t38 = − 0.133, p = .448, AIC = 114.689). In contrast, movie length was significantly associated with the actual number of times shared (B = 0.339, SE = 0.153, t38 = 2.219, p = .163, AIC = 113.628). Thus, we ran an additional multiple regression analysis for the social model including the movie length as a covariate. The results showed that the social-related neural measures were significantly associated with the actual number of times shared after controlling for the movie length (B = 0.302, SE = 0.152, t38 = 1.985, p = .027, AIC = 111.582). The detailed analyses are shown in Appendices C–D.
Having established that the social-related neural measure better explained the number of times a video was shared than the other neural measures, it was explored whether combinations of the self-reports and the three neural measures would more effectively explain the number of times a video was shared. To this end, the AIC values of all possible models including one or some of the four measures (i.e., 2^4 = 16 models) were compared; it was revealed that the model including the self-reported and social-related neural measures provided a better explanation than the other models (AIC = 109.97; Table 1).
Results of regression models predicting the number of times shared.
Note: For each predictor, the table presents standardized coefficients with the standard error in brackets. Prediction accuracy was defined as the cross-validated correlation between the observed and predicted number of times shared. The value is always between + 1 and − 1. If a model makes perfect predictions, prediction accuracy will be 1.0, whereas a model making random predictions will have a prediction accuracy of approximately 0 or negative value.
AIC = Akaike information criterion. MSE = Mean squared error between the cross-validated correlation.
p < .05 (one-tailed),
p < .001 (one-tailed).
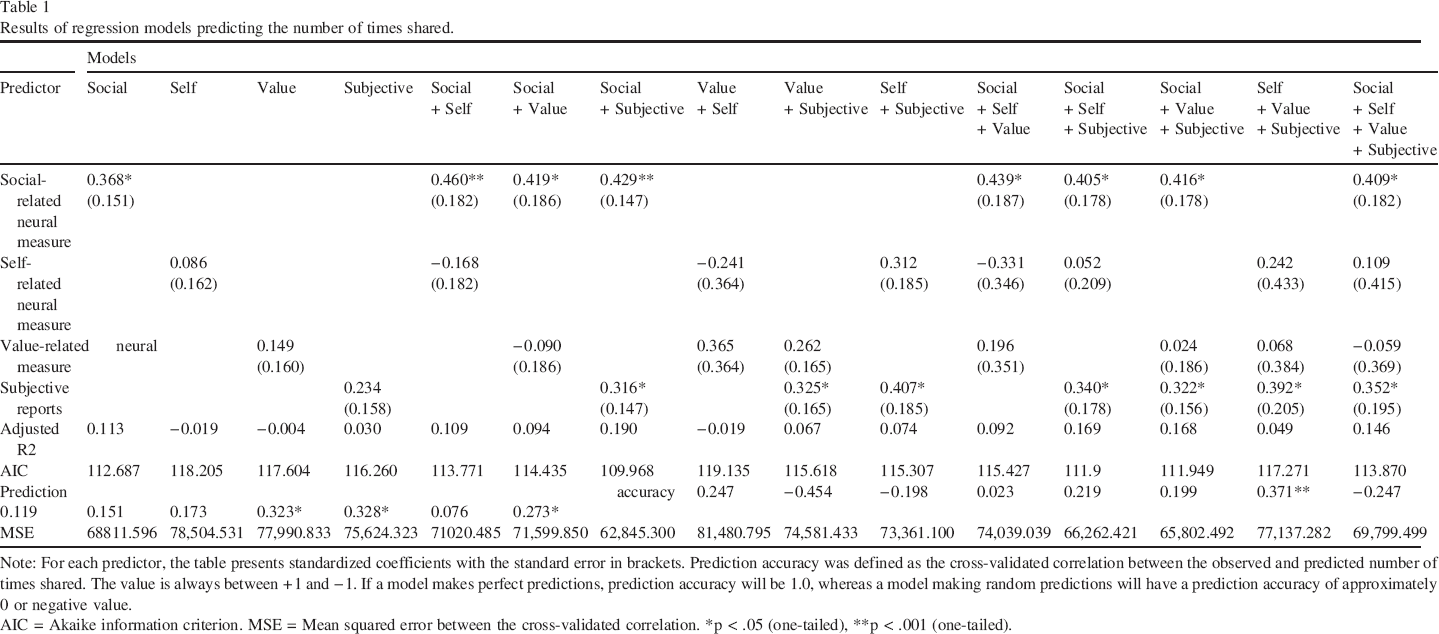
Finally, the prediction accuracy of the best-explained model that included the self-reported and social-related neural measures was quantitatively evaluated. Prediction accuracy was defined as the cross-validated correlation between the predicted and actual numbers of times a video was shared. A combination of the self-reported and social-related neural measures provided the most significant prediction (r = 0.371; p = .009); the prediction accuracy was greater than in any other possible model (Table 1). An illustration of the scatterplot of the main models is shown in Figs. 5–9. Additionally, we compared the prediction accuracy among models using the other prediction measure, mean squared error (MSE), between the cross-validated correlation. The results of the MSE also showed that a combination of the self-reported and social-related neural measures provided minimum MSE among all models (Table 1).
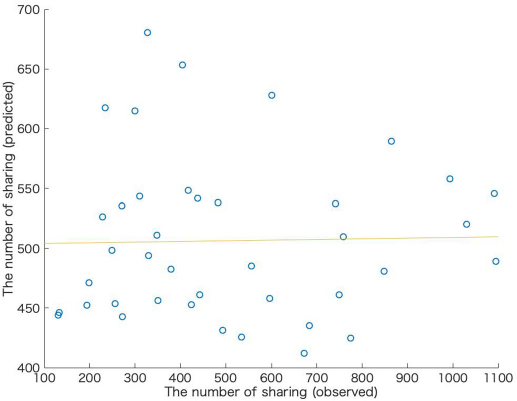
Scatterplot of observed and predicted number of shares from a model including social-related neural measures and subjective reports.
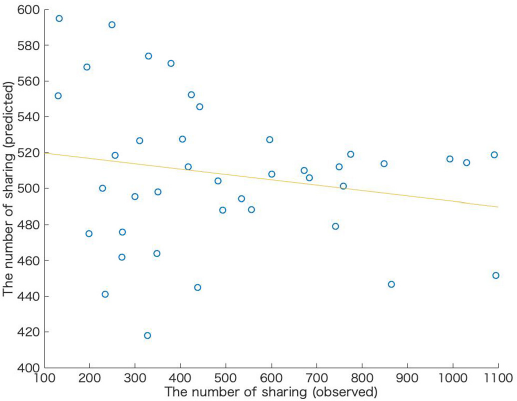
Scatterplot of observed and predicted number of shares from a model of social-related neural measures.
Scatterplot of observed and predicted number of shares from a model of self-related neural measures.
Scatterplot of observed and predicted number of shares from a model of value-related neural measures.
Scatterplot of observed and predicted number of shares from a model of subjective intention to share.
Investigating Accounts for Response Biases
Additionally, we experimentally investigated factors accounting for response biases. Is the number of shares of video ads on which people linger explained by social-related neural measures? Is the number of shares explained greater than that using self-reported measures? To address these questions, we ran two multiple regression analyses with two-tailed tests. We used the actual numbers of times an advertisement was shared as predictors and social-related neural measures (or self-reports), video time length, and their interaction terms as explanatory variables. The results of our multiple regression analyses revealed that the social-related neural measures (B = 0.354, SE = 0.140, t38 = 2.534, p = .016) and video time length (B = 0.338, SE = 0.140, t38 = 2.424, p = .021) were positively correlated with the actual number of times shared. However, their interaction was not significantly associated with the actual number of times shared (B = − 0.310, SE = 0.178, t38 = − 1.738, p = .091). The other multiple regression analysis showed that the self-reports (B = 0.140, SE = 0.173, t38 = 0.807, p = .425), video length (B = 0.265, SE = 0.172, t38 = 1.539, p = .133), and their interaction (B = − 0.212, SE = 0.163, t38 = − 1.304, p = .201) were not associated with the actual number of times shared.
Discussion
Consumers often share dynamic commercial contents (i.e., video ads) with other consumers and buzz advertisements (i.e., those that are highly shared) have a huge impact on consumer behavior. However, it remains unknown whether neural measures forecast viral marketing success and which cognitive processing (social-, self-, and value-related processing) is most relevant to the motivation to share video ads. Of the theory-driven neural measures used in the present study, we established three hypotheses: H1: Activities in the value-related neural regions forecast viral marketing success of video ads; H2: Activities in the self-related neural regions forecast viral marketing success of video ads; H3: Activities in the social-related neural regions forecast viral marketing success of video ads. The results partially support H2. The results show that the social-related neural measure was associated with the number of times a video was shared on Facebook, whereas subjective reports (intention to share) and activity in the brain regions associated with the self and value were not. Additionally, a combination of the social-related neural measure and subjective reports most effectively forecasted viral marketing success. Taken together, these findings provide a novel connection of neurophysiological measures in conjunction with real-world dynamic commercial contents, and facilitate a more profound conceptual understanding of the motives for sharing video ads.
The current findings demonstrate that social-related neural measures forecast the virality of video ads. Previous studies have shown that activities in brain regions related to affect and reward, such as the nucleus accumbens (NAcc), can forecast market-level outcomes for music sales (Berns & Moore, 2012) and the success of microlending campaigns (Genevsky & Knutson, 2015). Additionally, brain regions related to integrative value, such as the VMPFC, can forecast the success of public health campaigns (e.g., Falk et al., 2012). In contrast to previous reports, the present findings revealed that activity in brain regions linked to mentalizing offers unique information capable of improving the forecasts of population-level outcomes, such as the number of times a video is shared on social media. The persuasion knowledge model suggests that consumers activate “persuasion knowledge (e.g., commercial intention)” when they process marketing-related stimuli (Friestad & Wright, 1994). It has been suggested that consumers tend to hold critical and distrusting beliefs regarding commercial posts on Facebook, and in turn, they decrease their intentions to share such content with others (Boerman et al., 2017). Furthermore, the current findings are also consistent with recent research concerning the key drivers of video ads, that is, those that use elements from drama, such as surprise, likable characters, and a plot, are shared more widely (Tellis et al., 2019). The social-related neural measures may reflect these dramatic characteristics, which may help us to infer receivers’ mental states. Hence, when sharing commercial content with others, sharers may need to consider the receivers’ mental states in more detail. Thus, the role of activity in mentalizing-related brain regions may become more relevant when forecasting viral video ads.
This finding indicates that social-related processing seems to be the most important factor in the cognitive process behind video ad sharing. Earlier theorizations of (video) ad-sharing practices have considered social-related processing as one of the important factors (Alexandrov et al., 2013; Barasch & Berger, 2014; Cappella et al., 2015; Lee & Ma, 2012; Park et al., 2009; Scholz et al., 2017; Tellis et al., 2019). However, these theorizations include other components such as both self- or value-related processing or other cognitive processing (e.g., Alexandrov et al., 2013; Barasch & Berger, 2014; Lee & Ma, 2012; Park et al., 2009; Scholz et al., 2017; Tellis et al., 2019). There has been no clear consensus on the primary motivations for the transmission of video ads. We relied on the advantages of neuroimaging methods, such as measuring the automatic processes behind consumer behavior (e.g., Casado-Aranda, Sánchez-Fernández, & Montoro-Ríos, 2019; Plassmann et al., 2015) and attempted to distinguish the potential motives for sharing video ads. Thus, using novel methods, the results refine the conceptual foundations for sharing motives and suggest that social-related processing may be a core process for viral marketing success.
The present findings are consistent with the market-matching account in which the degree to which choice components (e.g., motivation, integration, and affect) can forecast aggregate choice depends on how well the component fits with the market (Knutson & Genevsky, 2018). For example, the choice components for an individual's music preferences include positive affective responses, such as NAcc activity, as well as integrative value responses, such as VMPFC activity (Berns & Moore, 2012). Thus, a subset of the components (i.e., the NAcc) that fit well with the music market and precede integrative value can forecast music sales (Berns & Moore, 2012). In the present study, social- and self-related processing were the components of sharing that preceded integrative value. Social cognition is one of the most relevant components of sharing, and it appears to match well with word-of-mouth acting (Cascio et al., 2015). Taken together, the present findings revealed the choice components of sharing that best forecasted aggregate choice and indicated that social cognition was the most salient feature associated with sharing behavior.
The dynamic and multimodal nature of video ads may explain our findings. Perceiving and interpreting video ads requires sustained attention and the integration of audio and visual inputs. Although our social-related neural measures are known to reflect mentalizing-related processing (Dufour et al., 2013), this neural network also works for multimodal integration and attention-grabbing. For example, the integration of sounds and images in audiovisual stimuli involves brain regions that partially overlap with those used in the social-related neural measures (Beauchamp, Argall, Bodurka, Duyn, & Martin, 2004; Ghazanfar & Schroeder, 2006; Nath & Beauchamp, 2011; Wong & Gallate, 2012). The roles of the regions involved in the social-related neural measures are well documented (Kubit & Jack, 2013; Langner & Eickhoff, 2013). Interestingly, recent research found that the activity of brain regions associated with social-related neural measures (STG and PCC) forecasts out-of-sample preferences for dynamic and multimodal stimuli (movie trailers), whereas activities in regions associated with value- or self-related neural measures (VS and VMPFC) did not (Chan et al., 2019). Together, these findings suggest that aggregate sharing of video ads may be related to sustained attention in integrating multimodal information.
The present findings differ from those of Scholz et al. (2017). Their work demonstrated that value-related neural measures forecast the virality of health-related news articles, while our work shows that social-related neural activity mainly contributes to the virality of video ads. The time lengths of the stimuli differ between this study and Scholz et al. (2017). The video ads used in the present study were longer in duration than the text-based health news articles used by Scholz et al. (2017), and video ads may be more susceptible to response biases. However, this difference in time length may not have contributed to the inconsistent findings, as we found no significant interactions between social-related neural measures and video time length or between self-reports and video length.
Managerial Implications
The present findings provide practical applications for viral marketing success by demonstrating that models that included a combination of social brain activity and subjective reports most effectively forecasted viral marketing success. fMRI has balanced advantages compared to other neuroscience techniques such as electroencephalography (EEG) and magnetoencephalography (MEG) (e.g., Dimoka, 2012; Reimann et al., 2011). Although EEG and MEG require a higher time resolution to capture millisecond temporal activation, they are weak in detecting activation in specific brain locations in comparison with fMRI. fMRI has superior temporal resolution (i.e., time) for dealing with consumer stimuli and precisely enough to localize activated brain areas associated with social-related processing. The applicability of the fMRI method seems difficult for most industries because of the cost. However, marketers invest considerably in video advertising (eMarketer, 2017). Effective prediction of (viral) ads by fMRI may be worth the cost (e.g., Ariely & Berns, 2010; Pozharliev, Verbeke, & Bagozzi, 2017). Companies create prototype advertisements and hold target groups to show the prototypes in an MRI setting (e.g., Ariely & Berns, 2010); additionally, they obtain subjective reports about the intention to share. Prior to the release of an advertisement, a combination of social-related measures and subjective intention to share can be used to forecast whether it constitutes effective advertising that will be frequently shared. Companies choose to advertise based on activity in social brain regions as well as subjective reports about the intention to share before the advertisement is released.
Limitations and Future Directions
The present study has several limitations that should be noted. First, the characteristics of the participants, such as the frequency of Facebook use, might have influenced the present results. For example, individual differences in daily life news experience affect how VMPFC activity tracks population-level sharing (Doré et al., 2019). Frequent news readers show greater activity in the VMPFC across all articles, whereas infrequent readers show high VMPFC activity only for highly shared articles. Although it was determined that all participants in the present study had a Facebook account, the frequency of Facebook activity and/or sharing was not assessed. Future studies should investigate this issue. Second, brain data might be more predictive when using advanced analytical techniques. In the present study, univariate analyses were conducted to measure brain activity, whereas previous studies have demonstrated that multivariate methods are predictive of consumer behavior (e.g., Chan, Boksem, & Smidts, 2018; Chen, Nelson, & Hsu, 2015; Tusche, Bode, & Haynes, 2010). However, to the best of our knowledge, no other studies have used multivariate methods to forecast population-level behaviors even though multivariate techniques may improve the prediction rates of viral marketing success. Third, the participants had to watch the entire video, but this is not necessarily how people interact with video ads on digital platforms.
Additional limitations may include cultural differences. The inconsistency between our results and those of Scholz et al. (2017) may be due to cultural differences. Our study recruited Japanese participants, whereas Scholz et al. (2017) used American participants. Meta-analysis of cultural neuroscience indicates cultural differences in brain activity involved in social cognitive tasks (Han & Ma, 2014). In particular, East Asians show greater activity in the mentalizing-related regions (e.g., TPJ, DMPFC) than do Westerners. Although the current study did not directly compare the neural responses from the two cultures, these differences in activities in the mentalizing-related regions may have contributed to inconsistencies in the findings.
The third limitation is the problem of “reverse inference”. Reverse inference means that a particular mental process is inferred from the activation of a particular brain region (e.g., Casado-Aranda, Dimoka, & Sánchez-Fernández, 2019; Plassmann et al., 2015; Poldrack, 2006). However, this inference is speculative in many cases. This is because one brain region can contribute to many mental functions (Poldrack, 2006). Activation of a certain brain region does not necessarily mean, presumably, that specific mental processes are involved in this region. Although our research uses three brain networks (social, self, value), these three networks might be related to other cognitive functions.
It is still unknown to what extent each neural network reflects each cognitive process (social, self, value). To choose each neural network appropriately, we rely on meta-analysis, which carefully investigates the dominant cognitive process. Thus, we assume that our neural networks mainly reflect each cognitive process. However, it is still possible that each neural network has an unassigned cognitive process. For example, PCC, a brain region in social-related neural networks, may be associated with value- and social-related processing to some degree. It has been suggested that PCC is involved in self-related processing (e.g., Brewer, Garrison, & Whitfield-Gabrieli, 2013) and value-related processing (Clithero & Rangel, 2014). Future research is needed to allocate brain regions more clearly into social-, value-, and self-related processing.
We did not match the age and gender ratio between MRI participants and Facebook users. Although it has been emphasized that recruiting relevant populations is necessary when using neuroscience methods to forecast population-level outcomes (Falk, Morelli, Welborn, Dambacher, & Lieberman, 2013), it is difficult to perfectly control for age and gender ratios between MRI participants and population levels (e.g., Berns & Moore, 2012; Falk et al., 2012; Genevsky et al., 2017; Scholz et al., 2017). Thus, age and gender ratios may influence the results. Additionally, as suggested by previous neuroimaging research (Casado-Aranda, Van der Laan, & Sánchez-Fernández, 2018), some ads contain gender-targeted products. The gender ratio in MRI participants might influence prediction of the sharing of ads associated with gender-targeted products. Further research is required to address these limitations.
In conclusion, the present findings demonstrated that a combination of the social-related neural measure and subjective reports most effectively forecasted the viral marketing success of dynamic commercial content. The results were consistent with the principles of the market-matching account in that social cognition matches well with sharing behaviors. Moreover, aggregate sharing of video ads may be related to the sustained attention required for integrating multimodal information. Taken together, the present findings showed the advantage of neuroimaging techniques for forecasting the word-of-mouth marketing success of video ads.
Footnotes
The authors declare no competing interests.
Acknowledgment
This work was supported by JSPS KAKENHI Grant Number: 17J00389.
Descriptive Summaries of Video Ads
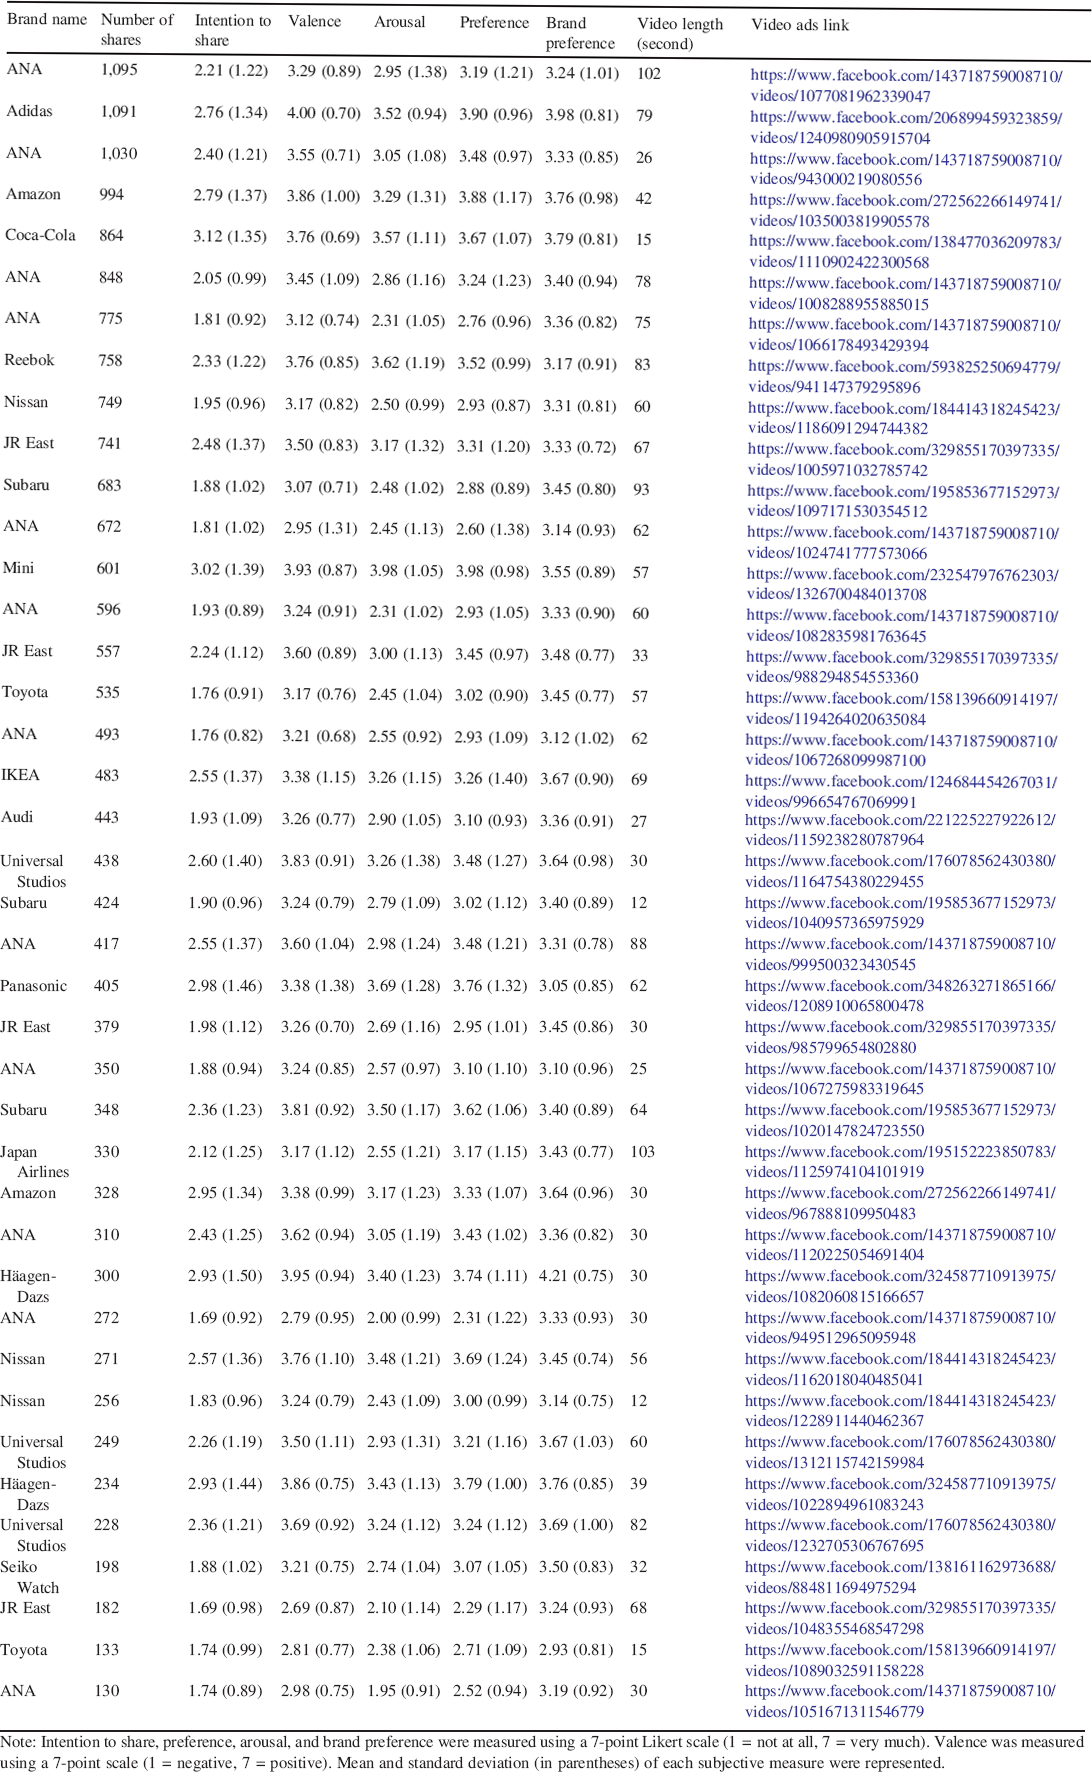
| Brand name | Number of shares | Intention to share | Valence | Arousal | Preference | Brand preference | Video length (second) | Video ads link |
|---|---|---|---|---|---|---|---|---|
| ANA | 1,095 | 2.21 (1.22) | 3.29 (0.89) | 2.95 (1.38) | 3.19 (1.21) | 3.24 (1.01) | 102 | https://www.facebook.com/143718759008710/videos/1077081962339047 |
| Adidas | 1,091 | 2.76 (1.34) | 4.00 (0.70) | 3.52 (0.94) | 3.90 (0.96) | 3.98 (0.81) | 79 | https://www.facebook.com/206899459323859/videos/1240980905915704 |
| ANA | 1,030 | 2.40 (1.21) | 3.55 (0.71) | 3.05 (1.08) | 3.48 (0.97) | 3.33 (0.85) | 26 | https://www.facebook.com/143718759008710/videos/943000219080556 |
| Amazon | 994 | 2.79 (1.37) | 3.86 (1.00) | 3.29 (1.31) | 3.88 (1.17) | 3.76 (0.98) | 42 | https://www.facebook.com/272562266149741/videos/1035003819905578 |
| Coca-Cola | 864 | 3.12 (1.35) | 3.76 (0.69) | 3.57 (1.11) | 3.67 (1.07) | 3.79 (0.81) | 15 | https://www.facebook.com/138477036209783/videos/1110902422300568 |
| ANA | 848 | 2.05 (0.99) | 3.45 (1.09) | 2.86 (1.16) | 3.24 (1.23) | 3.40 (0.94) | 78 | https://www.facebook.com/143718759008710/videos/1008288955885015 |
| ANA | 775 | 1.81 (0.92) | 3.12 (0.74) | 2.31 (1.05) | 2.76 (0.96) | 3.36 (0.82) | 75 | https://www.facebook.com/143718759008710/videos/1066178493429394 |
| Reebok | 758 | 2.33 (1.22) | 3.76 (0.85) | 3.62 (1.19) | 3.52 (0.99) | 3.17 (0.91) | 83 | https://www.facebook.com/593825250694779/videos/941147379295896 |
| Nissan | 749 | 1.95 (0.96) | 3.17 (0.82) | 2.50 (0.99) | 2.93 (0.87) | 3.31 (0.81) | 60 | https://www.facebook.com/184414318245423/videos/1186091294744382 |
| JR East | 741 | 2.48 (1.37) | 3.50 (0.83) | 3.17 (1.32) | 3.31 (1.20) | 3.33 (0.72) | 67 | https://www.facebook.com/329855170397335/videos/1005971032785742 |
| Subaru | 683 | 1.88 (1.02) | 3.07 (0.71) | 2.48 (1.02) | 2.88 (0.89) | 3.45 (0.80) | 93 | https://www.facebook.com/195853677152973/videos/1097171530354512 |
| ANA | 672 | 1.81 (1.02) | 2.95 (1.31) | 2.45 (1.13) | 2.60 (1.38) | 3.14 (0.93) | 62 | https://www.facebook.com/143718759008710/videos/1024741777573066 |
| Mini | 601 | 3.02 (1.39) | 3.93 (0.87) | 3.98 (1.05) | 3.98 (0.98) | 3.55 (0.89) | 57 | https://www.facebook.com/232547976762303/videos/1326700484013708 |
| ANA | 596 | 1.93 (0.89) | 3.24 (0.91) | 2.31 (1.02) | 2.93 (1.05) | 3.33 (0.90) | 60 | https://www.facebook.com/143718759008710/videos/1082835981763645 |
| JR East | 557 | 2.24 (1.12) | 3.60 (0.89) | 3.00 (1.13) | 3.45 (0.97) | 3.48 (0.77) | 33 | https://www.facebook.com/329855170397335/videos/988294854553360 |
| Toyota | 535 | 1.76 (0.91) | 3.17 (0.76) | 2.45 (1.04) | 3.02 (0.90) | 3.45 (0.77) | 57 | https://www.facebook.com/158139660914197/videos/1194264020635084 |
| ANA | 493 | 1.76 (0.82) | 3.21 (0.68) | 2.55 (0.92) | 2.93 (1.09) | 3.12 (1.02) | 62 | https://www.facebook.com/143718759008710/videos/1067268099987100 |
| IKEA | 483 | 2.55 (1.37) | 3.38 (1.15) | 3.26 (1.15) | 3.26 (1.40) | 3.67 (0.90) | 69 | https://www.facebook.com/124684454267031/videos/996654767069991 |
| Audi | 443 | 1.93 (1.09) | 3.26 (0.77) | 2.90 (1.05) | 3.10 (0.93) | 3.36 (0.91) | 27 | https://www.facebook.com/221225227922612/videos/1159238280787964 |
| Universal Studios | 438 | 2.60 (1.40) | 3.83 (0.91) | 3.26 (1.38) | 3.48 (1.27) | 3.64 (0.98) | 30 | https://www.facebook.com/176078562430380/videos/1164754380229455 |
| Subaru | 424 | 1.90 (0.96) | 3.24 (0.79) | 2.79 (1.09) | 3.02 (1.12) | 3.40 (0.89) | 12 | https://www.facebook.com/195853677152973/videos/1040957365975929 |
| ANA | 417 | 2.55 (1.37) | 3.60 (1.04) | 2.98 (1.24) | 3.48 (1.21) | 3.31 (0.78) | 88 | https://www.facebook.com/143718759008710/videos/999500323430545 |
| Panasonic | 405 | 2.98 (1.46) | 3.38 (1.38) | 3.69 (1.28) | 3.76 (1.32) | 3.05 (0.85) | 62 | https://www.facebook.com/348263271865166/videos/1208910065800478 |
| JR East | 379 | 1.98 (1.12) | 3.26 (0.70) | 2.69 (1.16) | 2.95 (1.01) | 3.45 (0.86) | 30 | https://www.facebook.com/329855170397335/videos/985799654802880 |
| ANA | 350 | 1.88 (0.94) | 3.24 (0.85) | 2.57 (0.97) | 3.10 (1.10) | 3.10 (0.96) | 25 | https://www.facebook.com/143718759008710/videos/1067275983319645 |
| Subaru | 348 | 2.36 (1.23) | 3.81 (0.92) | 3.50 (1.17) | 3.62 (1.06) | 3.40 (0.89) | 64 | https://www.facebook.com/195853677152973/videos/1020147824723550 |
| Japan Airlines | 330 | 2.12 (1.25) | 3.17 (1.12) | 2.55 (1.21) | 3.17 (1.15) | 3.43 (0.77) | 103 | https://www.facebook.com/195152223850783/videos/1125974104101919 |
| Amazon | 328 | 2.95 (1.34) | 3.38 (0.99) | 3.17 (1.23) | 3.33 (1.07) | 3.64 (0.96) | 30 | https://www.facebook.com/272562266149741/videos/967888109950483 |
| ANA | 310 | 2.43 (1.25) | 3.62 (0.94) | 3.05 (1.19) | 3.43 (1.02) | 3.36 (0.82) | 30 | https://www.facebook.com/143718759008710/videos/1120225054691404 |
| Häagen-Dazs | 300 | 2.93 (1.50) | 3.95 (0.94) | 3.40 (1.23) | 3.74 (1.11) | 4.21 (0.75) | 30 | https://www.facebook.com/324587710913975/videos/1082060815166657 |
| ANA | 272 | 1.69 (0.92) | 2.79 (0.95) | 2.00 (0.99) | 2.31 (1.22) | 3.33 (0.93) | 30 | https://www.facebook.com/143718759008710/videos/949512965095948 |
| Nissan | 271 | 2.57 (1.36) | 3.76 (1.10) | 3.48 (1.21) | 3.69 (1.24) | 3.45 (0.74) | 56 | https://www.facebook.com/184414318245423/videos/1162018040485041 |
| Nissan | 256 | 1.83 (0.96) | 3.24 (0.79) | 2.43 (1.09) | 3.00 (0.99) | 3.14 (0.75) | 12 | https://www.facebook.com/184414318245423/videos/1228911440462367 |
| Universal Studios | 249 | 2.26 (1.19) | 3.50 (1.11) | 2.93 (1.31) | 3.21 (1.16) | 3.67 (1.03) | 60 | https://www.facebook.com/176078562430380/videos/1312115742159984 |
| Häagen-Dazs | 234 | 2.93 (1.44) | 3.86 (0.75) | 3.43 (1.13) | 3.79 (1.00) | 3.76 (0.85) | 39 | https://www.facebook.com/324587710913975/videos/1022894961083243 |
| Universal Studios | 228 | 2.36 (1.21) | 3.69 (0.92) | 3.24 (1.12) | 3.24 (1.12) | 3.69 (1.00) | 82 | https://www.facebook.com/176078562430380/videos/1232705306767695 |
| Seiko Watch | 198 | 1.88 (1.02) | 3.21 (0.75) | 2.74 (1.04) | 3.07 (1.05) | 3.50 (0.83) | 32 | https://www.facebook.com/138161162973688/videos/884811694975294 |
| JR East | 182 | 1.69 (0.98) | 2.69 (0.87) | 2.10 (1.14) | 2.29 (1.17) | 3.24 (0.93) | 68 | https://www.facebook.com/329855170397335/videos/1048355468547298 |
| Toyota | 133 | 1.74 (0.99) | 2.81 (0.77) | 2.38 (1.06) | 2.71 (1.09) | 2.93 (0.81) | 15 | https://www.facebook.com/158139660914197/videos/1089032591158228 |
| ANA | 130 | 1.74 (0.89) | 2.98 (0.75) | 1.95 (0.91) | 2.52 (0.94) | 3.19 (0.92) | 30 | https://www.facebook.com/143718759008710/videos/1051671311546779 |
Note: Intention to share, preference, arousal, and brand preference were measured using a 7-point Likert scale (1 = not at all, 7 = very much). Valence was measured using a 7-point scale (1 = negative, 7 = positive). Mean and standard deviation (in parentheses) of each subjective measure were represented.
fMRI Methods
Investigating the Effects of Movie Length on Viral Marketing Success
We ran two additional multiple regression analyses: (1) the social model, including movie length as covariate and (2) the social + subjective model, including movie length as covariate. The results of the social model showed that social-related measures were significantly associated with the number of shares after controlling for movie length (B = 0.302, SE = 0.152, t38 = 1.985, p = .027). Additionally, the results of the social + subjective model showed that both social-related measures and self-reported intention to share were significantly associated with the number of shares after controlling for movie length (social-related neural measures: B = 0.364, SE = 0.149, t38 = 2.455, p = .001; self-reported intention to share: B = 0.302, SE = 0.144, t38 = 2.100, p = .021).
We also compared goodness-of-fit and predictive accuracy between the best model (social + subjective) and the models including movie length. Neither of the models that included movie length (e.g., Social + movie length: AIC = 111.582, cross-validated correlations = 0.371, MSE = 69,004.753; Social + subjective + movie length: AIC = 108.960, cross-validated correlations = 0.323, MSE = 63,709.098) exceed the best model (Social + subjective: AIC = 109.968, cross-validated correlations = 0.371, MSE = 62,845.300). That is, the “social + subjective” model provided the better prediction compared with the other models, in terms of AIC, and cross-validated r and MSE. These results suggest that, while the variable length of the video stimuli might have marginal effects, our conclusions remain unchanged after controlling for the potential confounding effects.