
Abstract
OBJECTIVE:
To determine the financial impact of poor customer satisfaction and the value of information gained from using a 1-question customer-satisfaction survey in a medical setting.
STUDY DESIGN AND SETTING:
A single-question customer-satisfaction survey was collected from customers presenting to an academic otolaryngology head and neck surgery outpatient clinic.
RESULTS:
The overall response rate was 25%, overall net promoter score was 67.3%, lowest net promoter score occurred on Wednesday and Friday, overall net potential referrals were 872, and potential lost revenue from dissatisfied customers equaled $2.3 million.
CONCLUSION:
A single-question customer-satisfaction survey may help identify areas of customer dissatisfaction that lead to a significant source of lost revenue.
SIGNIFICANCE:
The competitive forces in today's health care environment require medical practices to address issues related to customer satisfaction.
Today's health care environment continues to evolve as basic business principles are applied to the health care process. Marketing and customer relationship management are just a few of the tools now being applied in the health care setting. For example, patients are no longer thought of strictly as “patients.” Many institutions routinely refer to patients as “customers,” and with this comes a necessary awareness of customer service successes and failures. Otolaryngology is not immune from this trend. As a referral specialty, otolaryngologists must be proactive in attracting customers if they want to continue to grow their clinical and surgical practice.
Measurement of customer satisfaction traditionally has relied on survey tools to assess customers' positive and negative feelings regarding a particular service. Complex multi-question health care survey tools are available (Press Ganey Associates, Inc, South Bend, IN), and consulting firms are available to help assess the customer base. The reality of complex surveys, however, is that they can be hard to administer, the interpretation of results is performed weeks or months from the actual event, and the data can be interpreted in many ways. Research in the service industry suggests that a better measure of satisfaction would be to ask a single question such as, “How likely are you to refer a family member, friend, or neighbor to ‘X’ provider.” 1 It is common knowledge in the business community that it costs less to keep a repeat customer than it does to attract a new customer. 1 Most businesses also know that their happiest customers are more likely to refer new customers. Otolaryngologists cannot take for granted that patients will simply show up at the door. They must be proactive with regard to keeping customers happy, so that customers will continue to refer their family, friends, neighbors, and associates.
A simple way to measure customer satisfaction in a health care practice is to follow the lead set by the business community and ask customers the same single question as the one above. This single question survey has the benefit of low cost of implementation, real-time assessment of customer satisfaction, and is supported by validated research. 1
Here, we present the results of preliminary implementation of a single-question customer-satisfaction survey in an academic otolaryngology-head and neck surgery outpatient clinic setting. Survey results and interpretation are provided to help other medical practices implement a customer-satisfaction measurement process.
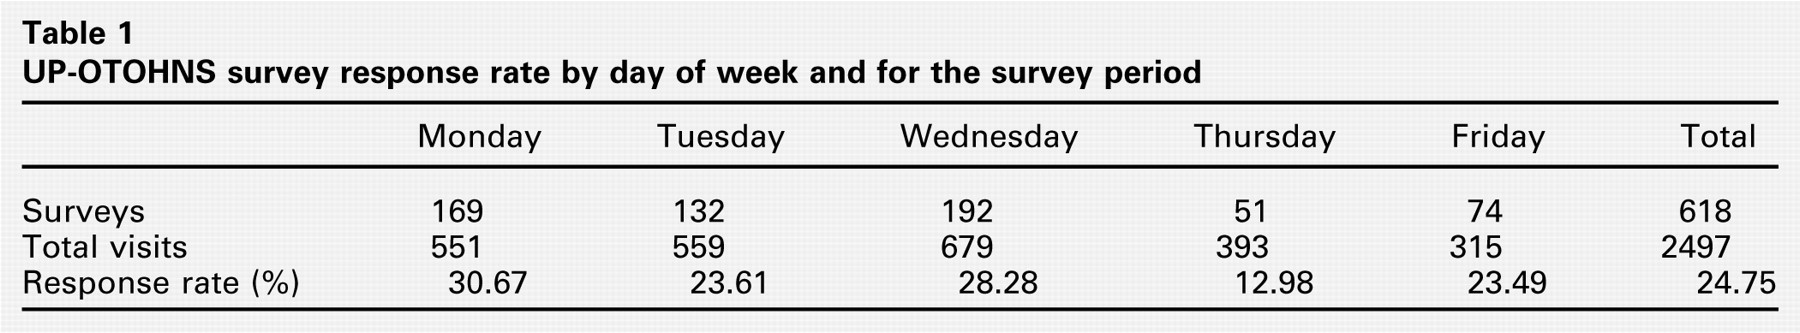
UP-OTOHNS survey response rate by day of week and for the survey period
Materials and Methods
Customers who presented to the University of Missouri/University Physicians Otolaryngology-Head and Neck Surgery (UP-OTOHNS) outpatient clinic between April 1, 2004 and May 31, 2004 were asked to complete a 1-question survey on exiting the clinic after their visit. Customers were asked, “How likely are you to recommend University Physicians Otolaryngology to a family member, friend, or neighbor?” Their willingness to refer was assessed using a 10-point visual scale with the descriptive terms extremely unlikely (1), neutral (5), and extremely likely (10). Survey results were collected in a survey drop box located at the receptionist's desk. Survey responses were anonymous. Customer visits included seeing a physician for evaluation and management of medical problems, audiology visits for assisted listening-device sales and service, and allergy immunotherapy injections.
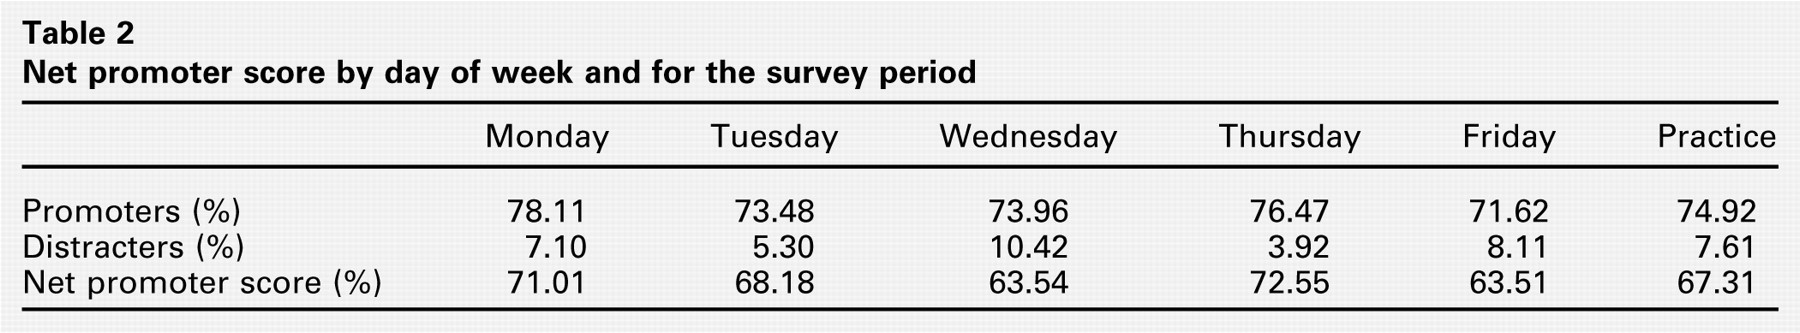
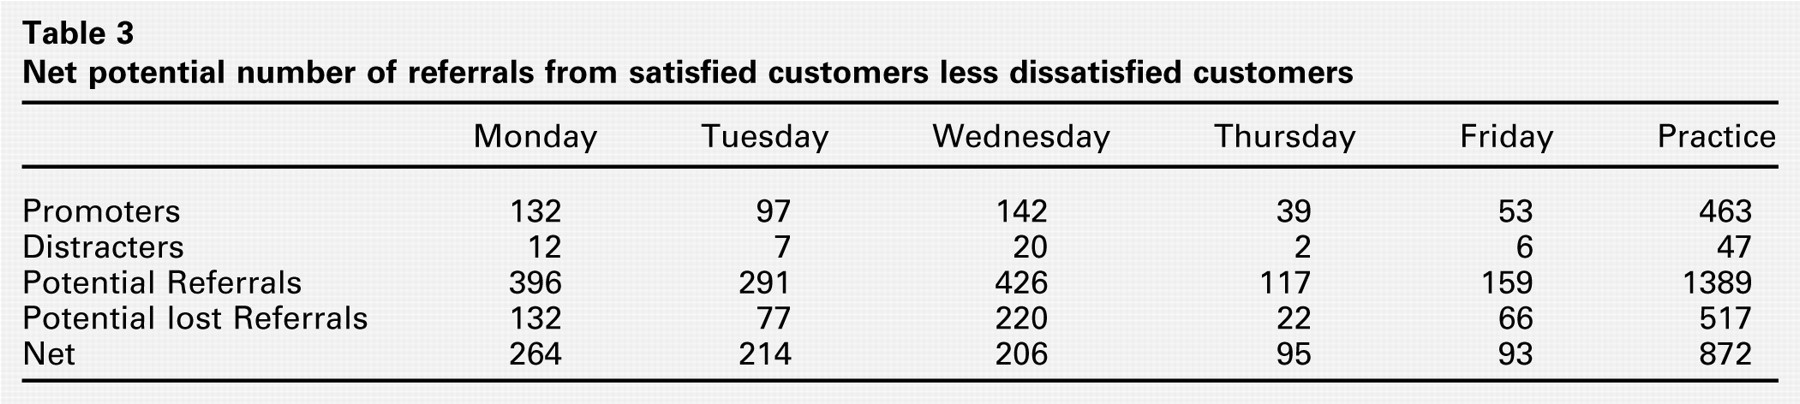
Results were collected based on the day of week, with each day of the week corresponding to a different colored survey form (Monday-yellow, Tuesday-orange, Wednesday-red, Thursday-green, Friday-white). Customer satisfaction was not calculated by individual provider or service provided to avoid potential provider embarrassment. Pooled survey responses by day of week and for the survey period were performed to average the potential impact of poor service provided by the receptionist or nursing staff; these individuals did not vary day to day. A net promoter score was calculated for each day of the week and for the practice as a whole by subtracting the percentage of negative responses (1-6) from the percentage of positive responses (9-10). Net potential referrals was calculated for each day of the week and for the practice as a whole using the assumption that satisfied customers (promoters) are likely to tell 3 customers (potential referrals) and dissatisfied customers (distracters) are likely to tell 11 customers (lost referrals). 2 Survey response rates are shown in Table 1.
Revenue for UP-OTOHNS is generated from 3 sources: physician evaluation and management, audiology diagnostic and rehabilitation services, and a hospital facility charge allowed by Medicare. The potential for lost revenue was calculated by determining the revenue per patient visits (R/V) for audiology, the physician practice, and the hospital facility fee for fiscal year FY2004 (July 1, 2003 through June 30, 2004) and multiplying that figure by the number of potential lost referrals from dissatisfied customers. The number of potential lost referrals was determined by multiplying 11 lost referrals per dissatisfied customer by the percentage of unhappy patients (those scoring 1-6) for the survey period, annualized for the total number of patient visits to UP-OTOHNS.
The University of Missouri Hospitals and Clinics monitors the UP-OTOHNS outpatient practice through a contract with Press Ganey Associates, Inc. Results from the last survey period of February 1, 2004 through March 31, 2004 were available for comparison. The response rate was available for May 2004.
Results
UP-OTOHNS recorded 2497 visits between April 1, 2004 and May 31, 2004 with 620 completed surveys. Two surveys were rejected because more than 1 number was selected on the 10-point scale, leaving a total of 618 surveys. Survey response rates for each day of the week and for the practice are listed in Table 1 The response rate for the Press Ganey survey was calculated for the month of May 2004 at 17%.
Net promoter score and net potential referrals for each day of the week and for the practice as a whole are shown in Tables 2 and 3, respectively.
Net promoter score by day of week and for the survey period
The survey period identified 47 distracters corresponding to 7.6% of the total visits for the survey period that translated into 1329 distracters annualized for FY2004. The total number of potential lost referrals was 14,617 for the practice for FY2004 assuming each unhappy customer tells 11 persons of their experience. R/V for FY2004 was $148.62/visit for audiology and $186.00/visit for the professional fee and hospital facility fee (hospital facility fee is based on the professional component). An average R/V for audiology and the physician fee ($167.31/visit) was used to determine potential lost revenue because the survey did not distinguish satisfaction between audiology visits and physician visits independently. Assuming that one referral is equivalent to at least one visit, then the potential lost revenue from patient dissatisfaction approached $2.3 million.
Net potential number of referrals from satisfied customers less dissatisfied customers
Press Ganey score for UP-OTOHNS for the response item “likelihood of recommending care provider” was 88.9. The mean score for the 3028 sites reported by Press Ganey in this category was 91.0. The mean score for similar academic and non-academic Midwest medical practices (374 sites) was 91.2. Press Ganey results for the response item “likelihood of recommending practice” was 89.2. Mean results for all sites and Midwest medical center subset were 90.7 and 91.4, respectively.
Discussion
Competition for customers in the health care setting is increasing and is likely to become a major factor in the future. Business economics teaches that healthy competition results in process improvement and lower costs, while un-competitive providers are driven out of the market. 3 Choosing a provider would be easy if it were as simple as buying a car, where the customer can take the car for a test drive, but health care is different. Health is subjective and one person's health may not be the same as another's. Objective measures of a physician's results and complications by disease will assist the customer in choosing a provider in the future, but this level of information is currently unavailable. Consumer-to-consumer communication (word of mouth) is currently the best method for assessing provider competence.
Satisfaction surveys are good tools for assessing customer satisfaction, but they have difficult implementation and validation owing to low response rates. The response rate for UP-OTOHNS varied for each day, with 4 of the 5 days collecting 23% or better. This response rate was only slightly better than the estimated rate for the Press Ganey survey. The overall low response rate may represent variation in how likely the patient service representative was at remembering to ask customers to complete the survey. The rate also may represent an inherent flaw with surveys and a general disinterest on the part of the customer to complete the survey.
Both the single-question and the Press Ganey survey results were collected and analyzed retrospectively. The single-question survey, although analyzed at the end of the survey period, gives the physician practice management the ability to analyze data at the end of each month, week, or even day. The results of our preliminary survey immediately showed that our 2 worst days were the days with the most visits (Wednesdays) and Fridays. The only variable that changes across each day of week is the number of visits and the provider(s). Any potential negative effects of nursing, patient service representatives, and audiology are assumed to be equal each day because these team members do not change. Wednesday's low net promoter score could be the result of the high number of visits, leading to increased patient wait time or problems with the provider(s). Friday's results are most likely the result of problems with the provider(s) because this day had the fewest number of visits. The survey cannot give more detail; however, even this little information can be extremely valuable for physician practice leaders in assessing their level of service.
At our practice, if we follow the assumption that dissatisfied customers are likely to tell 11 others about our poor service, then the practice could be missing out on approximately 14,000 referrals per year. This translates to lost revenue of almost $2.3 million. The likelihood of being able to accommodate 14,000 new referrals and seeing a $2.3 million increase in revenue is slim. A 10% to 25% increase in visits is more realistic, but even this would result in a significant improvement in revenue. The net promoter score for the practice (67.5%) tells us that a majority of our customers are very satisfied and likely to refer family or friends. As long as the net promoter score remains positive, then the practice will continue to see more new referrals than it will lose to dissatisfied customers.
Just attracting new patients does not necessarily mean increased profit. What if one of your promoters now becomes a distracter? Not only have you potentially lost new referrals from this customer telling others, but now you have lost these referrals' potential downstream revenue. Attracting new customers does not come without a price. The cost of attracting a new customer is estimated at 5 times the cost of keeping a current customer. 2 Preventing current customers from becoming distracters is just as important as attracting new customers.
The ideal customer satisfaction survey would be a realtime survey giving customers the option of allowing follow-up by the physician or office manager. Not only would the provider be able to determine where the problems lie, but this might also enable them to keep a customer from becoming a distracter.