
Abstract
In 1880, Galton carried out an investigation of imagery in a sample of distinguished men and a sample of nonscientists (adolescent male students). He concluded that scientists were either totally lacking in visual imagery or had “feeble” powers of mental imagery. This finding has been widely accepted in the secondary literature in psychology. A replication of Galton's study with modern scientists and modern university undergraduates found no scientists totally lacking in visual imagery and very few with feeble visual imagery. Examination of Galton's published data shows that his own published data do not support his claims about deficient visual imagery in scientists. The modern data for scientists and nonscientists and the 1880 data for scientists and nonscientists are in agreement in showing that all groups report substantial imagery on recollective memory tasks such as Galton's breakfast questionnaire. We conclude that Galton's conclusions were an example of theory-laden interpretation of data based on the initial responses from several very salient scientists who reported little or no visual imagery on Galton's imagery questionnaire.
Francis Galton was a major intellectual figure in Victorian England (Brookes, 2004; Bulmer, 2003; Forrest, 1974; Gillham, 2001). He made innovative contributions to many fields: geography (explored southwestern Africa), biology (laws of inheritance), forensics (fingerprinting), meteorology (high pressure systems and weather maps), genetics (twin studies and pedigree analysis), individual differences (measures of ability and the bell curve), general psychology (word associations and questionnaires), statistics (correlations and regression), and cognitive psychology (imagery). This article focuses on his contributions in the area of visual imagery.
Galton's Investigation of Visual Imagery with the Breakfast Questionnaire
Galton (1880, 1883) carried out an extremely innovative study of visual imagery. He had a wide range of participants fill out a questionnaire that asked them to recall some specific scene such as the appearance of their breakfast table from their morning's breakfast. He then evaluated the protocols in terms of the vividness of the reported imagery and carried out a number of analyses based on his ranking of the reports in terms of the vividness of the reported imagery. This study was quite original in a variety of different ways. It was one of the very first investigations of individual differences for a psychological process, and it represents one of Galton's first attempts to use ranking procedures to efficiently describe an underlying set of data. Brewer (1986, p. 36) has argued that this investigation can be seen as a study of recollective memory, and thus it is one of the first empirical studies of human memory.
Galton was interested in how various groups differed in their responses to psychological tasks. One group that clearly fascinated him was scientists (Galton, 1874). In describing his work on mental imagery, Galton (1880, 1883) made some very strong claims about imagery in scientists. He stated that he first carried out a pilot study with his “friends in the scientific world” (Galton, 1880, p. 302), and he reported that
to my astonishment, I found that the great majority of the men of science to whom I first applied, protested that mental imagery was unknown to them. …They had no more notion of its true nature than a color-blind man who has not discerned his defect has of the nature of color. (p. 302)
Yet, he stated that when he used his questionnaire on persons from the “general society,” they reported strong visual imagery. He concluded that “scientific men as a class have feeble powers of visual representation. There is no doubt whatever on the latter point, however it may be accounted for” (Galton, 1880, p. 304). Clearly, Galton felt his data on this topic were strong and that he had made an important nonobvious discovery.
The Acceptance of Galton's Claims in the Psychological Literature
Galton's claims that scientists have either no mental imagery or that they have feeble mental imagery have become firmly established in the psychology literature (see Table 1). Galton's conclusions have been accepted by many of the major figures in psychology over the past century: William James (1890), E. B. Titchener (1918), R. S. Woodworth (1938), Charles Osgood (1953), George Miller (1962), Allan Paivio (1971), and Stephen Kosslyn (1980). Galton's conclusions appear in the major handbooks of the past century (James, 1890; Osgood, 1953; Woodworth, 1938; Woodworth & Schlosberg, 1954). They appear in textbooks of cognitive psychology (Kosslyn, 1980; Paivio, 1971; Vinacke, 1952); in books on individual differences (Gardner, 1983); and in the three most recent biographies of Galton (Brookes, 2004; Bulmer, 2003; Gillham, 2001). The claims are accepted by almost all modern histories of psychology that discuss Galton's work on imagery (Fancher, 1996; Forrest, 1995; Goodwin, 1999; Hergenhahn, 2005; Hothersall, 1984; Schultz & Schultz, 2004). From psychology, the information has spread into other fields. Galton's conclusions appear in books in the area of history (Libby, 1917); in the work of individual philosophers such as Bertrand Russell (1919), and in textbooks of philosophy (O'Connor & Carr, 1982). Thus, a reader of the secondary literature would reasonably conclude that scientists are either lacking in visual imagery or are quite deficient in mental imagery. However, it seems to us that there are two other literatures that raise concerns about this widespread agreement about Galton's conclusions.
Citations From the Large Secondary Literature That Accepts Galton's Conclusions That Scientists Are Deficient in Visual Imagery

Note. The authors have identified more than 20 additional references that accept Galton's conclusion. These have been omitted in the interest of saving space.
Romanes was one of Galton's respondents and was ranked by Galton as third from the bottom of his sample in terms of image vividness.
Recollective Memory
In a 1986 chapter on autobiographical memory, Brewer argued (p. 36) that, even though Galton's breakfast questionnaire has traditionally been considered to be a special technique used to study mental imagery, it was better thought of as a technique to study recollective memory that happens to be experienced with strong visual imagery. In a later chapter on recollective memory, Brewer (1996, p. 60) defined recollective memory as “memory for a specific episode from an individual's past. It typically appears to be a ‘reliving’ of the individual's phenomenal experience during that earlier moment. …The information in this form of memory is expressed as a mental image.” Clearly, attempting to recall one's breakfast table for a particular day is an example of recalling a specific episode from one's past and thus seems a classic example of recollective memory.
The reason this reinterpretation of Galton's task raised a red flag for us was evidence that showed that when undergraduates carried out a recollective memory task they reported imagery in essentially every case (Brewer & Pani, 1996). It is, of course, possible that undergraduates show essentially 100% imagery on this task, whereas scientists show little or no imagery, but it seemed unlikely to us. If this were true, it would be one of the most striking cases of differences between scientists and nonscientists ever found, and it would be occurring on a cognitive task (recollective memory) that does not seem to be directly related to carrying out many forms of scientific work.
Self-Reports of Imagery in Scientists
There is a second literature on imagery in scientists that is quite in opposition to Galton's conclusions. A number of writers (e.g., Ferguson, 1977; A. I. Miller, 1984; Shepard, 1978; Tweney, Doherty, & Mynatt, 1981) have argued that mental imagery has played a important role in the thinking of many great scientists. These claims are not based on systematic empirical studies. Instead, the major part of this literature consists of the self-reports of major figures in the history of science describing the role of imagery in their thinking. Although data of this type are not conclusive, the reports are widespread and consistent enough that they serve as a second major difficulty in accepting Galton's conclusions at face value.
For example, in the late 1800s and early 1900s, British physics focused on the development of mechanical model-based theories that made strong demands on visual imagery. J. J. Thomson (1930, pp. 15–16) described this approach as one where “an attempt is made to form an idea of something concrete, a model, for example, which will supply us with a mental picture of what may be taking place in the physical phenomena under consideration.” In attempting to describe what led to the enormous success of Ernest Rutherford and Niels Bohr, the physicist Mark Oliphant observed that “each was able to make vivid visual models of his thought, models which helped the experimenter greatly” (Oliphant, 1985, p. 70). Even after the theories in physics were no longer based on mechanical models, many physicists continued to describe the strong role of imagery in their work. Probably the most famous of all of these autobiographical accounts is the one provided by Albert Einstein. In response to questions about the role of mental imagery in his thinking, Einstein stated,
The words or the language, as they are written or spoken, do not seem to play any role in my mechanism of thought. The psychical entities which seem to serve as elements in thought are certain signs and more or less clear images which can be “voluntarily” reproduced and combined. (Hadamard, 1945, p. 142)
In describing how he solved certain problems in physics, Richard Feynman stated, “Visualization in some form or other is a vital part of my thinking. …It was always with visualization. There was a lot of visualization and a lot of analysis” (Schweber, 1986, p. 504). These image reports are not restricted to physicists. In his account of the discovery of DNA, James Watson wrote that “for over two hours I happily lay awake with pairs of adenine residues whirling in front of my closed eyes” (Watson, 1968, p. 188). Like the Galton literature, this literature on the use of imagery by scientists is widely known and widely cited. However, few scholars have reviewed both literatures (cf. Table 6 for papers that do), and thus the fundamental inconsistency between these two traditions has rarely been pointed out. Given these two potential problems with Galton's conclusion that scientists have feeble powers of mental imagery, we decided to replicate Galton's study with samples of modern scientists and undergraduates in an attempt to resolve the inconsistencies.
Experiment 1
Method
Materials
We developed a questionnaire that used Galton's (1880) exact instructions and contained two of the questions exactly as he asked them (even though we realized our modern participants might be somewhat amused by the idea that we thought mustard and parsley would be a likely part of a breakfast menu!) The instructions stated,
Before addressing yourself to any of the Questions [at the bottom of this page], think of some definite object—suppose it is your breakfast-table as you sat down to it this morning—and consider carefully the picture that rises before your mind's eye.” (Galton, 1880, p. 301)
The two questions (Galton, 1880, p. 302) were:
Illumination-Is the image dim or fairly clear? Is its brightness comparable to that of the actual scene? Coloring-Are the colors of the china, of the toast, bread crust, mustard, meat, parsley, or whatever may have been on the table, quite distinct and natural?” [The data from this scale were very similar to those from the Illumination scale and so are not presented here to conserve space.]
Participants
There were two groups of participants—scientists and college undergraduates. The scientists were from the University of Illinois at Urbana-Champaign. The questionnaire and a cover letter were mailed to 72 male full professors from the Departments of Physics and Chemistry at the University of Illinois. The sample was restricted to men to be comparable to Galton's all-male sample. In Galton's sample of 100 distinguished men, it is difficult to determine who should be classified as a scientist (Burbridge, 1994). By restricting our sample to full professors of chemistry and physics at a major research university, we thought there would be no ambiguity in classifying these respondents as scientists. We received 35 usable replies. The nonscientists were 70 male undergraduates from the University of Illinois who carried out the experiment as part of a course requirement. We restricted our sample to males to make our group of nonscientists comparable to Galton's nonscientist sample of male adolescent schoolboys.
Results
Scoring image vividness
Each response to the illumination question was scored on a 1–5 scale by two raters. The scale was an elaboration of a scale developed by Armstrong (1894). On this scale, 1 = Image comparable to or more vivid than perception, 2 = Image somewhat less clear and/or bright than perception, 3 = Image considerably less clear and/or bright than perception, 4 = Image very weak, and 5 = No image. The detailed scoring criteria are given in the Appendix. Scoring showed strong reliability. For the 105 responses (35 scientists and 70 undergraduates), there were two cases of disagreement. The disagreements were resolved by discussion so that each participant received a single unique score on visual image vividness for the illumination question.
Visual image vividness data
Table 2 gives the percentages of scientists and undergraduates in each vividness category for the illumination question. It is not completely clear how to translate Galton's verbal statement of his conclusions into quantitative terms, but if “mental imagery was unknown to [scientists],” then we would expect all or most of the scientists to fall in Category 5. The data for scientists in Table 2 show that there were no scientists who reported a total absence of imagery (Image Vividness Category 5). If “scientific men as a class have feeble powers of visual representation,” we would expect almost all of the scientists to fall into the bottom two vividness categories, yet only 6% of the scientists showed very weak imagery (Image Vividness Category 4), and none reported a total lack of visual images (Image Vividness Category 5). The Interocular Trauma Test (Edwards, Lindman, & Savage, 1963, p. 217) shows that the data for scientists do not support Galton's conclusions.
Percentages of Modern American Scientists and Modern American Undergraduates in Each of Five Visual Imagery Vividness Categories Based on Responses From Galton's Breakfast Questionnaire
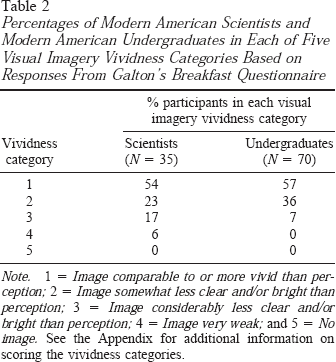
Note. 1 = Image comparable to or more vivid than perception; 2 = Image somewhat less clear and/or bright than perception; 3 = Image considerably less clear and/or bright than perception; 4 = Image very weak; and 5 = No image. See the Appendix for additional information on scoring the vividness categories.
A second way to explore Galton's claims is to compare the data from the scientists with those from the undergraduates. This is a much weaker test of Galton's claims, because in addition to the scientist-nonscientist dimension, the two samples differ along a number of other potentially important dimensions such as age and education. Examination of Table 2 shows that there was a small tendency for the scientists to show less vivid imagery than the undergraduates, χ2(3, N = 105) = 7.49, p = .06. However, note that this comparison is not really a fair test of Galton's very strong conclusions. It does not seem to us that showing a small difference in the frequency distribution between a group of scientists and (undergraduate) nonscientists would reasonably correspond to the strong language Galton used.
Discussion
The data from the present study indicate that 94% of modern scientists showed from moderate to high mental imagery on Galton's breakfast questionnaire. They did, however, show slightly less vivid imagery than a group of university undergraduates. These data are consistent with the data showing that most undergraduates showed imagery during recollective memory tasks (Brewer & Pani, 1996) and are also consistent with the literature showing that many famous scientists have reported the occurrence of strong imagery during scientific thinking (Ferguson, 1977; A. I. Miller, 1984; Shepard, 1978; Tweney et al., 1981). On the other hand, these results are certainly not consistent with Galton's conclusions that scientists show either no imagery or feeble imagery as presented in his 1880 paper and his 1883 book. The inconsistency between our modern data and the conclusions Galton drew from his study suggested a careful examination of the data that Galton used to support his conclusions.
Experiment 2 (Galton, 1880)
Pilot Study
From Galton's reports of his studies of visual imagery (1880, 1883), it appears that he first carried out an informal study of the visual imagery of some of his “friends in the scientific world” (1880, p. 302). He chose to start with scientists because he thought they, as scientists, would provide more accurate accounts than other groups of participants. It appears that it is the results from this group that led him to state,
To my astonishment, I found that the great majority of the men of science to whom I first applied, protested that mental imagery was unknown to them. …They had no more notion of its true nature than a color-blind man who has not discerned his defect has of the nature of color. (Galton, 1880, p. 302)
Method
Participants
Galton then carried out a more systematic study. He sent his breakfast questionnaire to an (unknown) number of individuals and obtained a sample of
100 adult men, of whom 19 are Fellows of the Royal Society, mostly of very high repute, and at least twice, and I think I may say three times, as many more are persons of distinction in various kinds of intellectual work. (Galton, 1880, p. 304)
It is quite likely that the initial sample of Galton's “friends in the scientific world” are included among the sample of 100 distinguished men. Thus, the data from the sample of distinguished men are not independent from the (unknown number of) scientists who “protested that mental imagery was unknown to them” (p. 302). Galton also obtained data from the students at Charterhouse, an English public school (a private school in American usage). He received a total of 172 usable questionnaires from Charterhouse. He broke the data into two subsamples: the Charterhouse A data were from the four higher grades and the Charterhouse B data were from the five lower grades.
Results and Discussion
Distinguished men
Galton ranked the sample of 100 men in terms of their overall reported imagery, and for the illumination question he presented the responses of the top 12, the middle 9, and the bottom 12 individuals of his total sample. In addition, in another place he provided the data for individuals at selected points throughout his distribution (highest person, 94th percentile [“first suboctile”], 88th percentile [“first octile”], 75th percentile [“first quartile”], 50th percentile [“middlemost”], 25th percentile [“last quartile”], 12th percentile [“last octile”], 6th percentile [“last suboctile”], and lowest person). These data are presented in Table 3. (Note that Table 3 also contains equivalent data from Galton's young adolescents and from the two modern samples. These other sets of data are discussed later in this article.) Galton reported his data this way because he argued that it allowed the reader to reconstruct the results of the total sample, and he is correct. In fact, for the purposes of this article, it is quite helpful that standard statistical procedures had not been invented as that allowed us to make direct comparisons with his published data. Typical modern reports of results are so abstracted from the underlying data that if they had been available to Galton we would not be able to make the comparisons that are needed.
Visual Image Vividness Protocols at Selected Percentiles for Galton's 100 Distinguished Men, Modern American Scientists, Galton's Young Adolescents, and Modern American Undergraduates

Note. The samples labeled Galton's young adolescents are from the group he refers to as Charterhouse Boys A. In presenting his data for the last octile of the distinguished men, Galton made a small error and used the protocol from the 10th percentile of his distribution. To make the comparisons in this table as close as possible, we have also displayed our protocols from the 10th percentile.
Distinguished men
Now, what can we learn from the data Galton has given us? From the published reports, we do not know how many of the 100 men in his sample were scientists. However, he does tell us that 19 were Fellows of the Royal Society, and it would seem reasonable to infer that his sample also included some unknown number of scientists who were not Fellows of the Royal Society. So from his published data, we can make a rough guess that perhaps 30 to 40 members of his sample were scientists of one type or another. Burbridge's (1994) analysis of Galton's unpublished records shows that this estimate is roughly correct. Examination of the data in Table 3 for Galton's distinguished men allows us to see if the reports of the distinguished men correspond to Galton's characterization of them. The data in this table and additional data given in Galton (1880) show that no more than the bottom seven reports could be considered to have no imagery. The response of the 8th individual from the bottom (Galton, 1880, p. 306) was “dim, imperfect” (Category 4 on our Image Vividness Scale). Thus, Galton's own presentation of his data from the 100 men shows that we can exclude the widely cited conclusion that “mental imagery was unknown to them” (Galton, 1880, p. 302).
Evaluation of Galton's claim that “scientific men as a class have feeble powers of visual representation” is a little more difficult. However, it would seem to us that this verbal statement of the findings would mean that the data from the sample of scientists (perhaps 30 or 40 out of the total sample) would lead to a very large number of responses in the lower half of the distribution with imagery described as “very dim” or “almost no visual image.” Instead, the individual at the 50th percentile reports his image to be “fairly clear. Brightness probably at least from one-half to two-thirds of the original.” The individual at the 25th percentile reports that his visual image is “dim, certainly not comparable to the actual scene.” It is not clear to us that even the individual at the 10th percentile would properly be described as having “feeble” visual imagery. That individual stated that his visual image was “dim and not comparable in brightness to the real scene.” Therefore, we conclude that Galton's published data are simply not consistent with his published claim that “scientific men as a class have feeble powers of visual representation.”
Young adolescents
Galton also ranked the responses from the Charterhouse samples and presented their responses at the same selected points from the distribution that were described above for the 100 distinguished men. The data for Galton's young adolescents are also given in Table 3.
One of the innovations in Galton's 1880 paper is his method of “intercomparison.” Galton points out that if one has two samples and can rank each sample along the same dimension, then one can compare individuals at equivalent ranks and see if the two distributions differ. We like Galton's method of intercomparison and propose to use it to study his data on visual imagery.
We think the examination of the protocols of the sample of distinguished men has demonstrated that Galton's claims about visual imagery in scientists are not consistent with his own data. However, his Charterhouse sample allows us to compare the sample of distinguished men with this nonscientist adolescent sample. As we noted earlier, this can only be an approximate test as in addition to the scientist-nonscientist dimension the two samples also differ along other potentially important dimensions such as age and education. If the sample of 100 distinguished men contained roughly 30–40 scientists with little or no visual imagery, then a comparison of the data from the total sample of 100 distinguished men with the nonscientist sample (Charterhouse A students) should show a very disproportionate number of individuals with low imagery in the bottom of the distribution of the sample of distinguished men. Thus, in comparing the protocols from the two samples at equivalent ranks, one would predict that, starting somewhere in the lower half of the distribution, the protocols of the sample of distinguished men would contain responses such as “very dim,” “almost no visual image,” or “no power of visualizing,” while at the equivalent ranks, the sample of nonscientist young adolescents would contain responses such as “fairly clear” or “clear, but not as bright as the actual scene.”
The relevant data are displayed in Table 3. The protocol of the individual from the distinguished men at the 50th percentile reports that his visual imagery is “fairly clear. Brightness probably at least from one-half to two-thirds of the original.” The protocol from the young adolescent at the 50th percentile reports, “The image is fairly clear, but its brightness is not comparable to that of the actual scene.” The protocol from the sample of distinguished men at the 25th percentile describes his image as “dim, certainly not comparable to the actual scene.” The protocol from Galton's young adolescent sample at the equivalent rank reports, “The image is fairly clear.” The individual from the 10th percentile of the distinguished sample states that their image is “dim and not comparable in brightness to the real scene.” The individual from the adolescent sample at the 10th percentile reports, “I can call up to my mind the picture of the breakfast table in every detail, but seem to see everything through a darkened pane of glass.”
We think that these comparisons may show a slight tendency for stronger visual imagery in Galton's nonscientist sample. However, we do not think the differences are large enough to be consistent with the hypothesis that there is a large subsample of individuals with little or no visual imagery within the larger sample of distinguished men. Thus, it seems to us that the intercomparison shows that the data from the distinguished men and the young adolescent nonscientists are inconsistent with the hypothesis that “scientific men as a class have feeble powers of visual representation” (Galton, 1880, p. 304).
At this point, the reader may be thinking that perhaps we have been biased in our interpretation of Galton's data. However, we do not think so, as Galton agrees with us! After Galton presented his data for the 100 distinguished men and for the Charterhouse students, he stated “that the A and B boys are alike in mental imagery, and that the adult males are not very dissimilar to them” (the adult males in this case are, in fact, the sample of 100 distinguished men; Galton, 1880, p. 312). Thus, we conclude that Galton's published data have never supported the extremely strong claims he made and that this fact has always been available for very careful readers of Galton's (1880) paper.
Comparison of Galton's Data with the Modern Data
In this section, we use Galton's method of intercomparison to compare the data from Galton's sample of distinguished men, the modern sample of scientists, Galton's sample of young adolescent males (the Charterhouse A sample), and the modern sample of male undergraduates.
To make the comparison, two raters ranked the responses on the illumination question for the sample of modern scientists and for the undergraduate sample. The rankings showed strong reliability. The Spearman rank correlation coefficient between the two raters for the scientist sample was .88; for the undergraduate sample, it was .83. The mean of the two independent rankings was used to produce an overall ranking of the two samples. Then for each sample the responses that corresponded to Galton's first suboctile, first octile, first quartile, middlemost, last quartile, last octile, and last suboctile were selected for comparison with Galton's samples.
Intercomparison Data
The data are presented in Table 3. The major conclusion from an overall examination of the intercomparison data is the remarkable consistency in the vividness of visual imagery on the breakfast questionnaire across time, across countries, across ages, across levels of education, and across scientists and nonscientists.
The data from the modern scientists is quite comparable to that of Galton's sample of distinguished men. The individual from Galton's sample who was at the 50th percentile described the image as “fairly clear. Brightness probably at least from one-half to two-thirds of the original.” The modern scientist at the equivalent point in the distribution reported that the image was “clear, but not as bright as the actual scene.” The individual from Galton's sample of distinguished men at the 25th percentile reported that the image was “dim, certainly not comparable to the actual scene.” The individual at the equivalent rank in the modern sample of scientists reported that the image was “fairly clear, but dimmer and smaller than reality.”
Clearly, the image reports in the middle of the distributions are very comparable. The responses at equivalent points on the distribution are almost paraphrases. At the tail of the distribution on the side of low imagery, there appears to be a slightly larger number of nonimagers in Galton's sample of distinguished men. Note that in Galton's pilot study, he was surprised to find some (number unknown) individuals who reported little or no visual imagery and that those individuals were probably in the larger sample of distinguished men. However, as noted earlier, neither the distribution of responses for modern scientists nor for Galton's distinguished men are consistent with his strong claims.
Examination of the data from Galton's young adolescents and the data from the modern undergraduates suggests that the modern undergraduates reported slightly more vivid images at the high end of the distribution. For example, the individual in Galton's sample of young adolescents at the 75th percentile reported that “the image is fairly clear, but its brightness is dimmer than the actual,” whereas the equivalent individual from the modern undergraduate sample reported that the image was “clear and bright.”
Classification Data
Table 4 presents the same data from all four groups in a more abstracted and quantitative fashion. Two raters categorized each response to the illumination question for Galton's samples (100 distinguished men and Charterhouse A students) and for the modern samples (scientists and undergraduates) at each selected rank on the 1–5 vividness scale. Table 4 shows the mean (across the two raters) vividness scores for each individual response for each of the four samples at selected points along the imagery distribution. These more quantitative data lead to the same conclusion as the qualitative data presented in Table 3. The four samples are very similar in imagery on the breakfast questionnaire task, with a tendency for there to be somewhat lower imagery at the bottom of the distribution for Galton's 100 distinguished men and somewhat higher imagery for the two samples of younger individuals. Given the overall agreement across the data that scientists do not show dramatically different degrees of imagery from nonscientists, we are now faced with the problem of explaining how Galton reached his conclusions.
Mean Rated Vividness of Individual Visual Image Protocols From Galton's Breakfast Questionnaire at Selected Percentiles for Modern American Scientists, Galton's 100 Distinguished Men, Modern American Undergraduates, and Galton's Young Adolescents
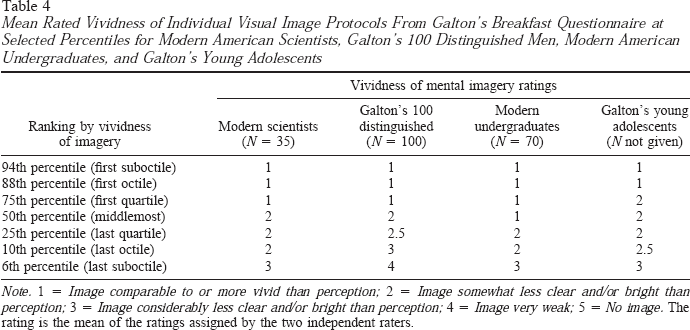
Note. 1 = Image comparable to or more vivid than perception; 2 = Image somewhat less clear and/or bright than perception; 3 = Image considerably less clear and/or bright than perception; 4 = Image very weak; 5 = No image. The rating is the mean of the ratings assigned by the two independent raters.
Galton's Unpublished Data
Burbridge (1994) has examined Galton's raw data, which is preserved in the Manuscripts Room of the Library of University College, London. He also carried out the heroic task of attempting to identify the names of Galton's 100 distinguished men. One might think this would allow us to find out what the responses were for the scientists in Galton's sample. Unfortunately, Burbridge was not able to find a list of those Galton thought were scientists or a tally sheet showing the responses on the imagery questionnaire for scientists versus nonscientists. Burbridge made some assumptions about whom Galton might have considered to be scientists and drew the circumspect conclusion that “from Galton's published account no one would be likely to suppose that his scientific cases were so widely spread across the spectrum” (p. 459).
Another aspect of Galton's data that was not visible in the published studies was the fact that Galton had data from one of the most outstanding scientists of all time—his half-cousin, Charles Darwin. Table 5 gives Darwin's responses to Galton's breakfast questionnaire. The data show clearly that the most outstanding scientist in Galton's sample was not lacking in visual imagery.
Galton's Breakfast Questionnaire With Charles Darwin's Responses, November 14, 1879
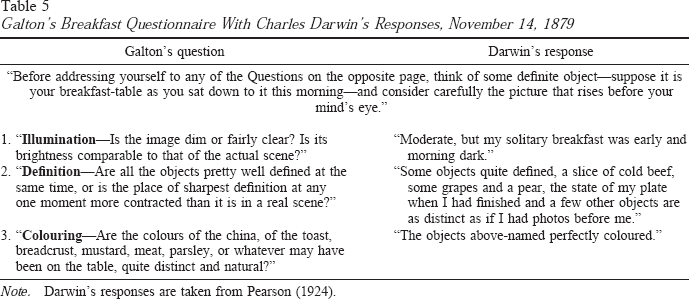
Note. Darwin's responses are taken from Pearson (1924).
General Discussion
Accounting for Galton's Claims
It seems unlikely to us that Galton was being deliberately misleading in his published studies. If so, why would he provide the data in his 1880 article that would allow the reader to see that his claims were not justified by the data? It seems to us that the most likely explanation for Galton's behavior is that this was a classic example of theory-ladenness in science. There is strong evidence that the prior beliefs (theories) of scientists can have an impact on their perception, attention, interpretation, memory, and communication of their work (Brewer & Lambert, 2001; Brewer & Loschky, 2005; Kuhn, 1962; Hanson, 1958; Popper, 1962).
At the time Galton was writing, many authors believed that there was a hierarchy of intellectual abilities. Abstract thought was considered to be superior to concrete imagistic thought. As applied to the then commonly assumed racial-biological hierarchy, White males would be more likely to use abstract thought and women, children, and “inferior” races would be more likely to use imagistic thought. In the present case, scientists would presumably be at the top of the pyramid and be most likely to engage in abstract thought and least likely to use concrete images. Although this sounds consistent with other views Galton held, there simply is no textual evidence to support the hypothesis that Galton applied these ideas of a hierarchy of ability to his scientist data. In fact, in attempting to account for the lack of imagery in scientists Galton did not use a nativist account, but gave an explanation in terms of expertise. He stated that
an over-readiness to perceive clear mental pictures is antagonistic to the acquirement of habits of highly generalized and abstract thought, and that if the faculty of producing them was ever possessed by men who think hard, it is very apt to be lost by disuse. (Galton, 1880, p. 304)
There is a second argument against the view that Galton's interpretation of his data was influenced by his prior beliefs in the hierarchy of abilities. When Galton carried out his initial informal study and discovered that some of his scientist friends claimed they had no mental images, he stated that he was astonished. If he already believed that scientists would have little or no mental imagery, why would he have been astonished by his findings? Thus, we do not think Galton's interpretation of his data was biased by a prior belief in the hierarchy of intellectual abilities.
We think that the best explanation of Galton's behavior is that in his initial informal study he happened to apply his questions to several scientists who reported having little or no imagery. Two likely candidates are the astronomer John Herschel and the biologist George Romanes. Both were outstanding scientists whom Galton knew, and both reported very little imagery on their breakfast questionnaires (Burbridge, 1994). We hypothesize that his initial informants made a very strong impression on his thinking and that this caused the top-down interpretation of his data. In particular, he did not let the more complete data from the larger sample of 100 men change his initial view. Brewer and Lambert (2001) argued that if bottom-up evidence is strong enough, it will frequently override top-down beliefs. In the present case, bottom-up evidence would involve identifying the scientists in Galton's sample of 100 men and comparing their image reports to those of the nonscientists. Burbridge (1994) was not able to find evidence that Galton made this explicit comparison, and we suspect that he never did it. If we are right, then there is a great irony here. Galton was known for quantifying everything from the physical beauty of women to the efficacy of prayer. Yet in this case it appears that he relied on his nonquantitative belief and did not produce the actuarial data (cf. Faust, 1984; Meehl, 1954) he needed to overcome his initial bias. Thus, Galton's strong claims that scientists show little or no visual imagery seem to have been based on a few highly salient individuals, and Galton let this initial finding override the data in his larger sample of 100 distinguished men.
Problems with Secondary Sources
In our examination of the large secondary literature discussing Galton's research on imagery in scientists, we found a small number of sources that suggested that there might be some problem with Galton's conclusion that scientists are deficient in visual imagery. The relevant quotations are given in Table 6. It should be noted that two of the authors appearing in Table 6 also appear in Table 1, where in different publications they appear to have accepted Galton's conclusions. There may be some interesting stories behind these dual appearances.
Citations Suggesting That the Author Is Aware That There May Be a Problem With Galton's Conclusions That Scientists Are Deficient in Visual Imagery
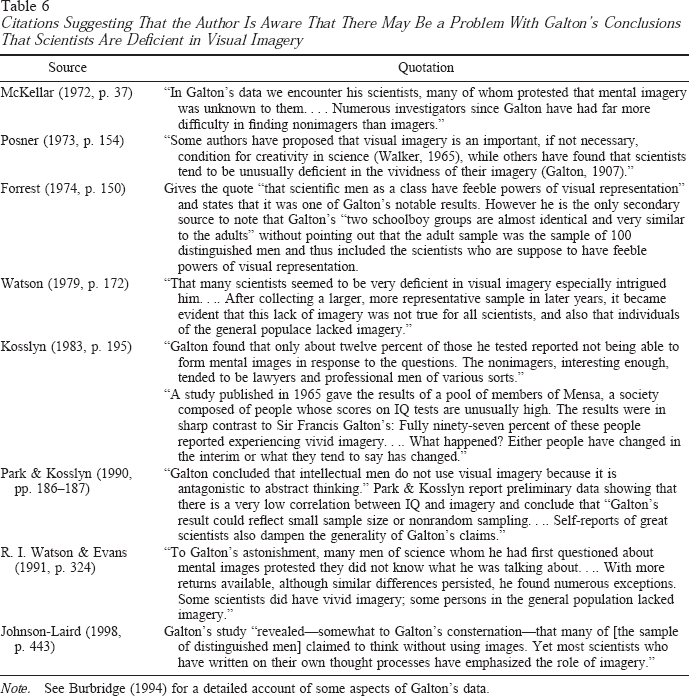
Note. See Burbridge (1994) for a detailed account of some aspects of Galton's data.
Conflicting evidence
Three of these papers (Johnson-Laird, 1998; Park & Kosslyn, 1990; Posner, 1973) have pointed out the conflict between Galton's conclusions and the literature showing that many famous scientists have provided self-reports that show high levels of visual imagery (e.g., Ferguson, 1977; A. I. Miller, 1984; Shepard, 1978; Tweney et al., 1981). McKellar (1972) and Kosslyn (1983) suggested that there are other data that conflict with Galton's conclusions.
Only Kosslyn (1983) and Park and Kosslyn (1990) attempted to provide an explanation for the conflicting data. Kosslyn (1983) suggested that the occurrence of imagery in scientists may have changed over time or that how they chose to report their imagery may have changed over time. Park and Kosslyn (1990) suggested that the differences might be due to nonrandom sampling on Galton's part.
Note that our more radical hypothesis—that Galton's data never supported his strong conclusions—means that we need not postulate any additional factors to account for the discrepancy as, for us, there is no discrepancy. All the evidence- Galton's 1880 data, the self-reports of scientists, and our modern replication of Galton—lead to the same conclusion: Scientists are not deficient in visual imagery.
Evidence for conclusions
It seems to us that the major failure in the large secondary literature is that the authors did not ask the question “Where are the data that back up Galton's extremely strong conclusions?” To us, Galton's claims seem to be a good case for the rule of thumb that extraordinary claims require extraordinary evidence.
Only three of the secondary sources (Forrest, 1974; R. I. Watson, 1979; R. I. Watson & Evans, 1991) hint that Galton's data might not support his claims (see Table 6). R. I. Watson (1979) and R. I. Watson and Evans (1991) suggested that there might be differences between Galton's pilot study and his full study. Forrest (1974) is the only secondary source we have found that notes that Galton stated that his data on imagery from the two groups of adolescent boys (Charterhouse A and B) were “not very dissimilar” to the data from the adult males. Unfortunately, neither Forrest nor Galton go on to point out that the “adult males” are the sample of distinguished men (which includes 30–40 scientists), and neither go on to draw the conclusion that this result is inconsistent with the claim that scientists lack or are very deficient in visual imagery.
It seems likely that most of the secondary sources obtained their accounts from Galton's 1883 book Inquiries Into Human Faculty and Its Development and not from Galton's earlier 1880 paper in Mind. In the 1883 book, Galton gave the data on imagery for the sample of 100 distinguished men for selected portions of the distribution (cf. Table 3 in this article). We have argued that these data alone allow one to reject Galton's strong conclusions. Thus, Galton's book contains evidence that should have led the authors of the secondary sources to reevaluate Galton's claims.
However, Galton did make it harder for someone who only read the 1883 book (and not the 1880 article) to see the problem. Galton did not present the data on imagery for the adolescent males (Charterhouse samples) in the book, so it was not possible for the reader to notice how similar the data were for the distinguished men and the adolescent males. In addition, the book does not contain the crucial sentence in which Galton notes how similar the sample of distinguished men was to the sample of male adolescents. Thus, researchers who read only Galton's 1883 book had less evidence that pointed to the inconsistency between Galton's data and his strong claims. In general, examination of the secondary literature suggests that once a claim such as Galton's becomes common knowledge, it is very hard to remove it (thus suggesting that this article will have a hard time making headway against the “common knowledge” displayed in Table 1).
Conclusions
It now appears that Galton's strong claims were incorrect. It is not the case that most scientists show little or no mental imagery. Galton's own data and our more recent data demonstrate that scientists show strong visual imagery in recollective memory tasks, just as nonscientist undergraduates do. The data do suggest there may be some small differences in vividness of visual imagery between scientists and undergraduates. However, these differences could easily be due to age differences (Galton, 1879, p. 432, suggested that there may be a decline in imagery with age) or to differences in style of reporting internal mental states. It seems to us that future work on these issues should not focus on imagery in recollective memory tasks such as the breakfast questionnaire. It is not obvious that this type of memory plays a special role in the work of scientists. However, we think that there might be interesting differences on various types of spatial reasoning tasks between scientists and nonscientists, and more particularly among different types of scientists (e.g., crystallographers vs. physiologists).
We also think this analysis of the reasons for the discrepancies between Galton's claims and his data provides interesting insights into the power of top-down factors in the work of scientists. We entertained the hypothesis that the discrepancy was due to deep-seated beliefs about a hierarchy of intellectual abilities. However, we discarded that hypothesis as Galton gave a non-nativist account of his findings and was surprised by his initial finding that a few scientists reported that they had little or no mental imagery.
We conclude that Galton's top-down interpretation of his findings was not driven by deep-seated theoretical beliefs but merely by the occurrence of a few unusual individuals in his pilot sample. If our interpretation is correct, it certainly highlights the powerful role of even relatively routine top-down beliefs in the way that scientists carry out their work (cf. Brewer & Lambert, 2001).