
Abstract
Homocysteine (Hcy) is a risk factor for vascular dysfunction. High levels of Hcy may result in vascular injury accelerating atherosclerosis leading to ischemia. After ischemia, endothelial progenitor cells (EPCs) migrate from bone marrow to repair damaged sites either through direct incorporation of EPCs or by repopulating mature endothelial cells. This study looks into the relationship between increased Hcy in patients with cerebrovascular disease (CVD) and EPCs. Some patients with hyperhomocysteinemia were treated with B vitamins to evaluate if the treatment reverses the elevated Hcy and its impact on their EPC levels. EPCs were treated with Hcy to determine the in vitro effects of Hcy. Our clinical findings show that elevated Hcy levels have an inverse relationship with EPC levels and B vitamin intervention can reverse this effect. Our in vitro work shows that Hcy-mediated EPC toxicity is due to apoptosis involving caspase-8, cytochrome c release, and caspase-3 activation. Vitamin B6, and B9 significantly impair Hcy-mediated EPC caspase-3 activation in vitro. Our clinical and in vitro data together indicate that increased Hcy results in a decrease in EPC numbers. This decrease in EPC by Hcy may be occurring through increased apoptosis and B vitamins (B6, B9) intervention can attenuate such effects.
Introduction
A direct relationship exits between an increasing concentration of homocysteine and the risk of cardiac disease, stroke, and venous thrombosis (Haynes, 2002; Hackam and Anand, 2003; Kaplan, 2003; Perna et al, 2003). In older populations, modest increases in homocysteine level have been associated with an increased risk of cardiovascular disease (Haynes, 2002; Wald et al, 2002; Hackam and Anand, 2003; Kaplan, 2003). However, the mechanism for the vascular injury is not yet fully understood but is likely multifactorial (Wald et al, 2002; Hackam and Anand, 2003; Perna et al, 2003; Refsum et al, 2004). Possible mechanisms include stimulation of free radical formation (Kanani et al, 1999; Weiss et al, 2003), nitric oxide-mediated endothelial dysfunction (Stamler et al, 1993), platelet activation (Fryer et al, 1993), hypercoagulability (Harpel et al, 1992), vascular smooth muscle proliferation (Southern et al, 1998), and dysfunction of flow-mediated brachial artery reactivity (Kanani et al, 1999). It is known that endothelial dysfunction predisposes a patient to atherosclerosis, vasoconstriction, and thrombosis (Probstfield et al, 1993). For example, forearm endothelial dysfunction is associated with an increased risk of cardiovascular events. Coronary endothelial dysfunction also predicts cerebrovascular events, demonstrating the systemic nature of the atherosclerotic process (Targonski et al, 2003). Normally there is a strong inverse correlation between the number of endothelial progenitor cells (EPCs) and Framingham coronary risk score (FCRS), where higher EPC numbers are correlated with improved endothelial function (Hill et al, 2003).
EPCs originate in the bone marrow and are precursors to mature endothelial cells with distinct characteristics, and have the ability to be mobilized in response to vascular trauma or tissue ischemia (Verma and Anderson, 2002). A recent report suggests that the source of endothelial cells in vasculogenesis in tumor cells may be periendothelial in origin instead of bone marrow (Purhonen et al, 2008). However, there are several reports that indicate bone marrow origins of EPC in ischemiainduced vasculogenesis (Asahara et al, 1999a, b), and this process is promoted by cytokine and vascular endothelial growth factors released at the site of injury (Asahara et al, 1999a; Gill et al, 2001). These cells subsequently migrate to the site of injury and differentiate into mature endothelial cells, promoting reendothelialization and neovascularization. The incorporation of EPCs has been showed at sites of carotid artery endothelial injury that was surgically induced as well as after cerebral (Hess et al, 2002), myocardial (Verma and Anderson, 2002), and limb ischemia (Werner et al, 2003).
Indirectly, both homocysteine and EPC levels appear to be predictive of vascular risk, albeit with opposite response. However, to date there is no direct comparative study performed between these two variables at the clinical level. In the present study, we examined whether increasing concentration of serum homocysteine can be correlated to reduction in EPCs. Furthermore, we studied the cause for the inverse relationship between Hcy and EPCs and found that apoptotic pathways are involved in homocysteine-mediated death of EPCs. We also examined if the homocysteine-mediated apoptosis of EPCs can be prevented by B vitamins.
Materials and methods
Ethics
This study was approved by the Research Ethics Review Board of the University of Alberta. Informed consent was obtained in writing from all the subjects.
Subjects
Three sets of subjects were recruited representing a spectrum of cerebrovascular risk: (1) subjects with acute ischemic stroke admitted to the inpatient neurology ward; (2) subjects with stable ischemic stroke (more than 1 month after event); (3) healthy controls with no history of stroke or cardiovascular disease.
Homocysteine Measurement
Homocysteine was measured in blood samples from patients after at least 12 h of fasting, using direct chemiluminescent immunoassay method as described elsewhere (Rasmussen and Moller, 2000). In patients with acute stroke, it was measured within the initial 24 h of presentation and in all stable patients at 30 days or longer after the vascular event.
Cell Culture
EPCs were isolated and cultured according to methods described and published earlier (Rasmussen and Moller, 2000; Hill et al, 2003). In brief, mononuclear cells (MNCs) were collected from peripheral blood using Ficoll (Sigma, St Louis, MO, USA) density gradient at room temperature (RT). MNCs in a buffy coat layer were collected, washed 2 × with phosphate-buffered saline (PBS) followed by Medium 199 (Invitrogen, Carlsbad, CA, USA). The M199 is supplemented with 20% fetal bovine serum, 100 U/mL Penicillin G (Sigma) and streptomycin sulfate (Sigma). EPCs were cultured M199 at 37°C with 5% CO2. Preplating was performed in a six-well (5 × 10⁶ per well) human fibronectin-coated plate (Becton Dickinson, Franklin Lakes, NJ, USA). Final plating was performed in 24-well (1 × 10⁶ per well) fibronectin-coated plate/cover slip. Medium was changed every third day and colonies were counted on the seventh day of final plating. EPC colonies were counted manually in each well of an individual sample. An EPC colony consists of a central cluster of rounded cells with surrounding radiating thin, flat cells. To avoid bias, colonies were counted by two different observers who were unaware of patient's clinical profile. The isolated EPCs were then cultured on serum-free medium for 24 h before treatment with homocysteine.
EPC Characterization by FACS
EPCs were analyzed by flow cytometry using 100 mLof mononuclear cell suspension. Direct immunofluorescent staining of the cells was performed using CD34-Allophycocyanin (20 μL; Jackson Laboratories, Bar Harbor, ME, USA) and CD31-Phycoerythrin (20 μL; Serotec, Raleigh, NC, USA) antibodies. Immunofluorescence was measured immediately after the completion of staining and the data were analyzed using CellQuest software (Becton Dickinson). CD34+-CD31+ cell counts were obtained from each sample after the measurement of 10,000 events in the lymphocyte gate. The cytometer was calibrated and the lymphocyte gate was setup using unstained mononuclear cells.
Caspase Assay
Activated caspases (−3, −8) were detected by caspase staining kits (BioVision, Exton, PA, USA). This assay uses a caspase inhibitor of respective caspases conjugated to sulfur rhodamine/fluorescein as the fluorescent marker and observed under microscope. Treated and untreated EPCs (1 × 10⁶ per well) were cultured in 24-well plate on fibronectin-coated cover slips. After 24 h incubation EPCs were washed with PBS and then 1 μL dye-conjugated caspase inhibitor diluted in 500 μL M199 was added to each well. After 1 h incubation at 37°C with 5% CO2 cells were washed 3 × with supplied wash buffer (500 μL). Numbers of cells with activated caspases were visualized under fluorescence microscope and counted (number per field). Data were presented as mean number of caspasepositive cells.
Cytochrome c Detection
Cytochrome c was detected by the immunostaining method. EPCs were cultured on fibronectin-coated cover slip for 7 days. EPCs were washed once with PBS and fixed with methanol at −20°C for 5 mins. Then the cells were washed 2 × with PBS before permeabilization with PBST (0.5% Triton X-100) for 10 mins at RT followed by a wash with PBST (0.1% Triton X-100). EPCs were treated with anticytochrome c antibodies (Neomarkers, Fremont, CA, USA) for 1 h (1:500). After 1 h incubation, the cells were washed 3 × with PBS and incubated with antimouse Ig's-fluorescein (fluorescein isothiocyanate, FITC) antibody (Biosource, Carlsbad, CA, USA), 1:200 for 1h. The cells were washed again with PBS and fixed with mounting medium. The cells were visualized using the fluorescence microscope at × 1000 magnification with FITC filter.
Inhibitor Study
The cells were treated for 24 h with Z-IETD-FMK (10 μmol/L), a caspase-8 inhibitor, or Z-VAD-FMK (10 μol/L), global caspase inhibitor, in the incubation media, before the caspase assay described earlier. This was performed to determine the role of specific caspases in the induction of apoptosis by homocysteine.
Quantitative Assay
Microscopic images were converted into quantitative data by dividing a cover slip into four quadrants. Two fields were selected from each quadrant plus two fields from the center, totaling 10 fields. Microscopic images were captured by a charged coupled device (CCD) camera (Qimaging, Pleasanton, CA, USA) and analyzed by Openlab 4.0.1 software (Improvision, Waltham, MA, USA). Positive cells were counted for each field.
Statistical Analysis
Descriptive statistics are expressed as means±s.d. and median range for continuous variables and as percentages for categorical variables. Univariate analysis was performed by using analysis of variance (ANOVA), Kruskal—Wallis H- and Pearson's χ2-test where appropriate. Spearman's ρ-test was used to examine the relationship between EPC levels and fasting homocysteine levels and FCRS. Wilcoxon's signed rank test was used to compare the homocysteine level and EPC colony counts between baseline and 12 weeks. General linear model (GLM) procedure was used to relate age, sex, cigarette smoking, hypertension, diabetes, total cholesterol levels, creatinine level, C-reactive protein, 3-hydroxy-3-methylglutaryl-CoA (HMG-CoA)-reductase inhibitor use, FCRS, and type of subject (healthy controls, stable, and acute) to EPC levels. All variables with (P < 0.2) were entered into a stepwise multiple linear regression model using GLM procedure to identify independent predictors of EPC levels with age and sex forced into the model. Another model was repeated with all risk factors forced into the model to see if the relationship with homocysteine was reduced. For in vitro studies statistical analyses was performed using one-way ANOVA followed by Student—Newman—Keuls method. Results were considered significant if two sided P-value was < 0.05.
Results
Human EPC Characterization
EPCs were characterized by the formation of colonyforming units after 7 days of incubation. FACS was performed using CD34 and CD31 antibodies (Lapergue et al, 2007). Here it is important to emphasize that the identification of EPCs are still controversial. Several markers have been used for EPC characterization (Vasa et al, 2001; Ghani et al, 2005), however for our study we have followed the method described by Hill et al (2003) therefore, CD34 and CD31 double-positive cells were considered as EPC for this study.
Homocysteine is Inversely Correlated with EPCs in Patients with Hyperhomocysteinemia
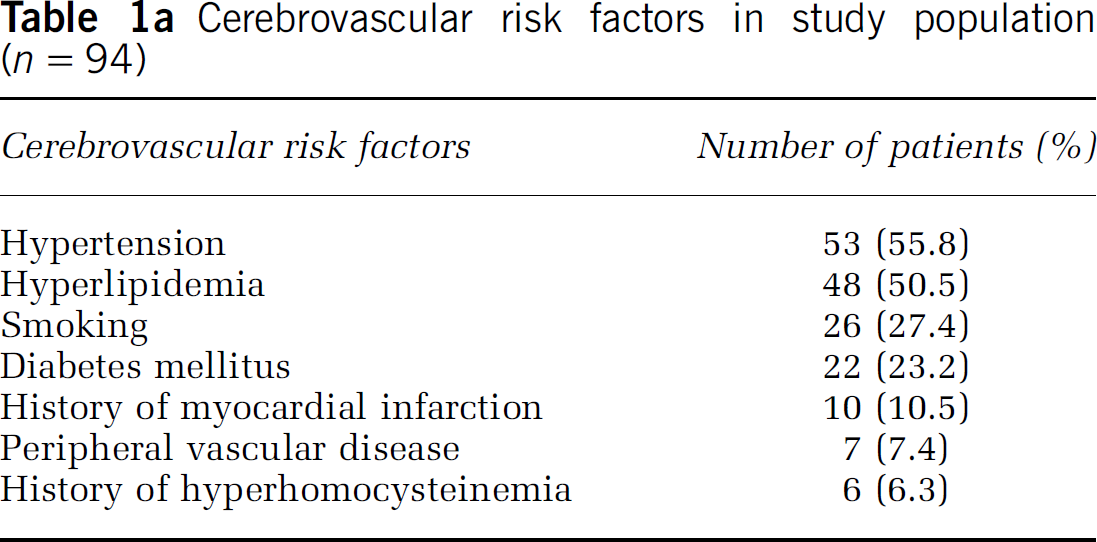
There were a total of 94 subjects comprising 60 men (63%) and 34 women (37%). The mean age was 63.5 years (s.d.±12.86). Seventy-seven of the subjects had a history of cerebrovascular disease. Prevalence of cardiovascular risk factors for the sample is provided in Table 1a. Twenty-nine subjects (30.5%) were on HMG-CoA-reductase inhibitor treatment, all of whom were in the group with stable cerebrovascular disease.
Cerebrovascular risk factors in study population (n = 94)
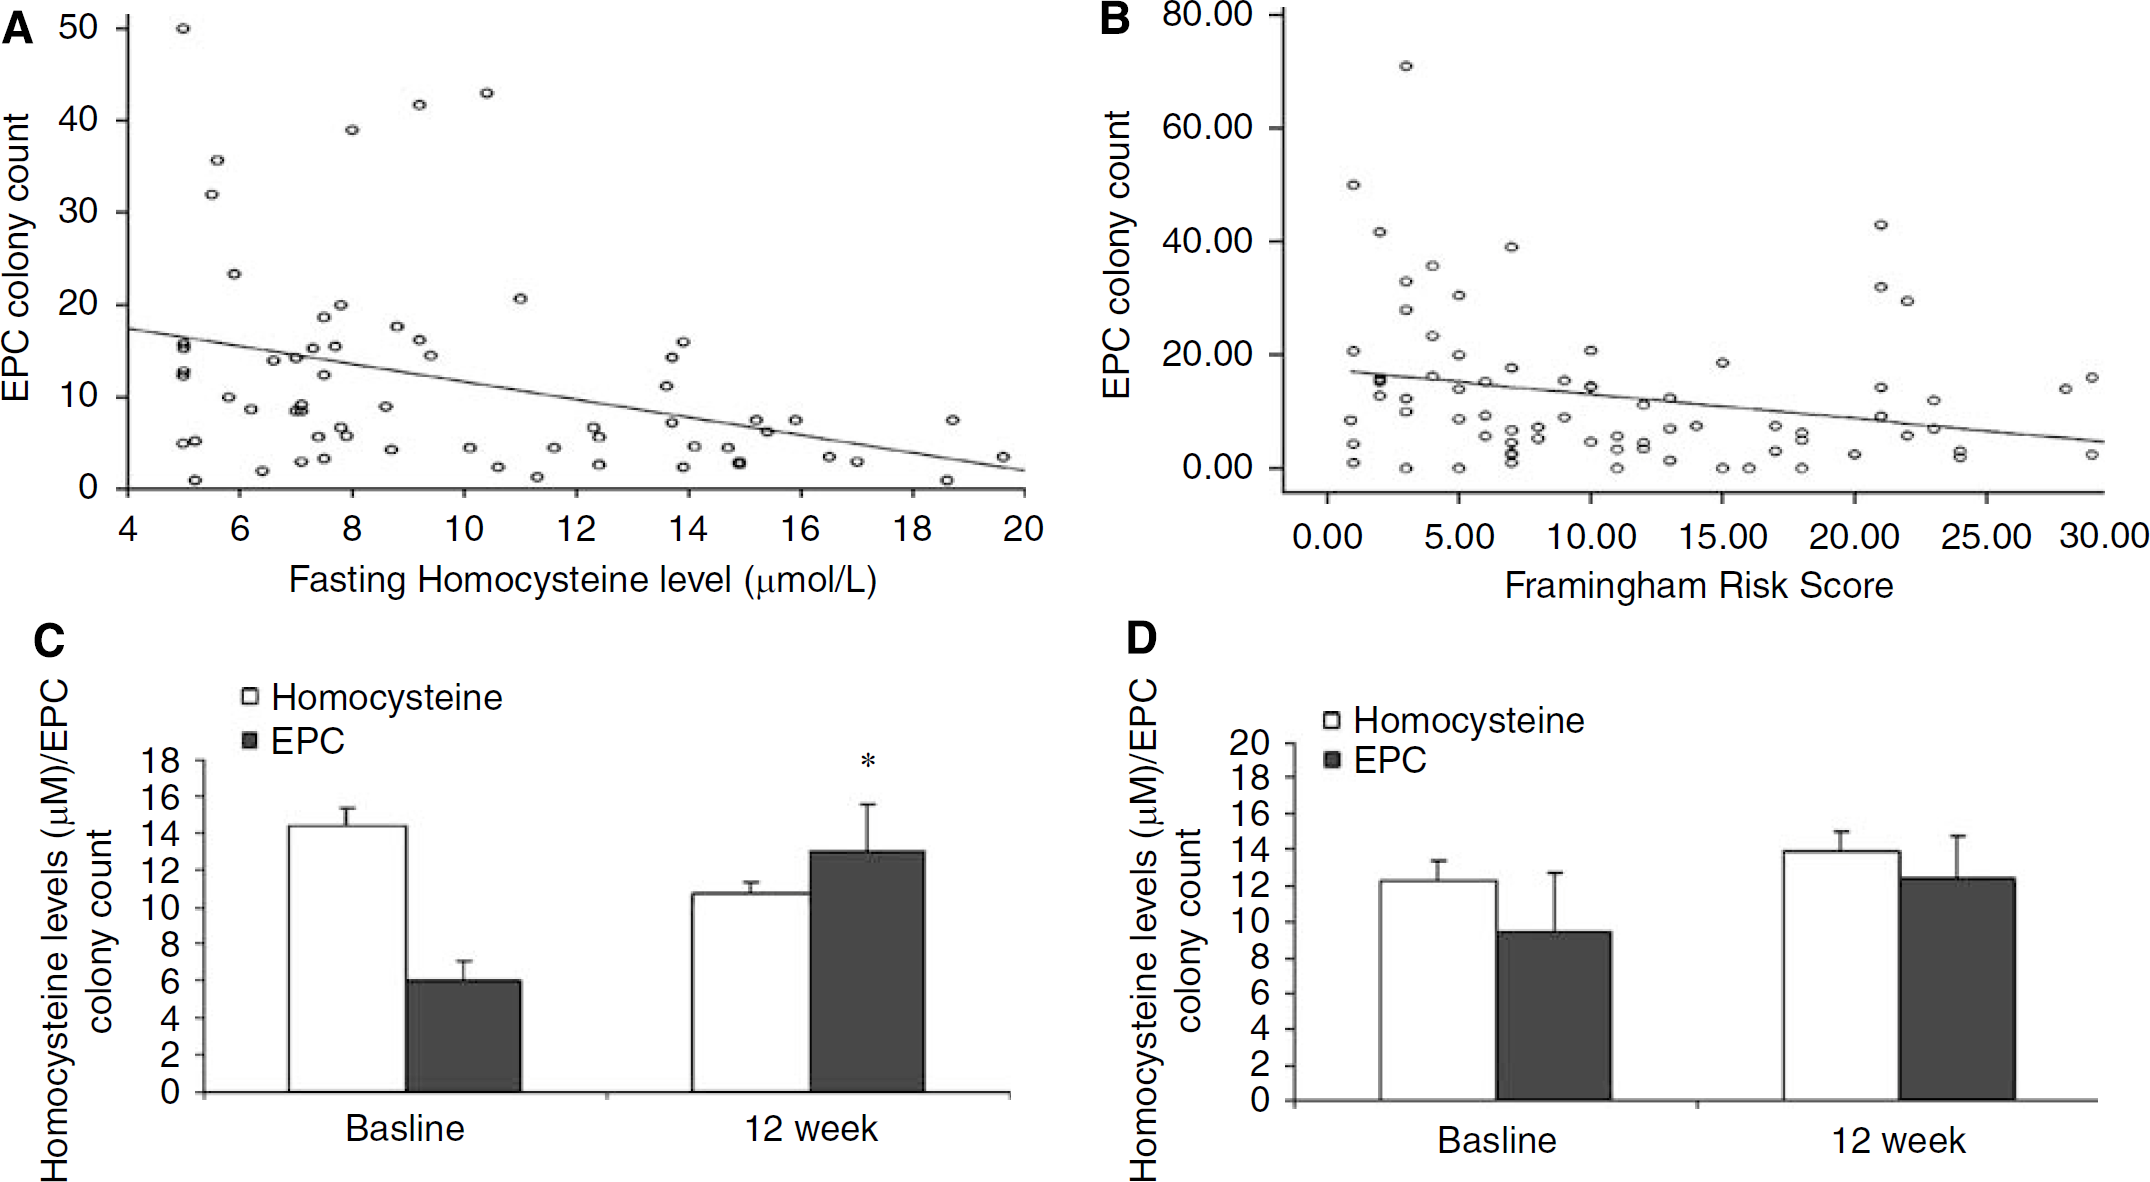
Among the patients studied there was an inverse relationship between EPC colony counts and fasting homocysteine (ρ = −0.415; P < 0.001; Figure 1A). Similarly, an inverse correlation between EPC colony counts and FCRS was also found (ρ = −0.347; P = 0.002; Figure 1B). The median EPC colony count in the study was 7.55 (range 0 to 71). Group correlated colony counts differed significantly (P = 0.001) among acute stroke (median 4.75; range 0 to 33), stable patients with cerebrovascular disease (median 7.28; range 0 to 43), and healthy controls (median 15.53; range 4.3 to 71). There was no difference in the distribution of age (P = 0.272) and sex (P = 0.365) among acute stroke subjects (age: 65.77±16.27 years; M/F 21.7%/14.3%), stable subjects (age: 63.84±12.54 years; M/F 63.3%/60.0%), and healthy controls (age: 60.27±9.86 years; M/F 15.0%/25.7%). However, univariate regression showed that history of hypertension, subject type (acute versus healthy controls, stable versus healthy controls), serum high-density lipoprotein (HDL) levels, fasting homocysteine, and FCRS are significant predictors of EPC colony counts (Table 1b). HMG-CoA-reductase inhibitor (statin) use was not a significant predictor of EPC colony levels (P = 0.528). The stepwise multiple regression model showed that fasting homocysteine and subject type (stable or acute versus healthy control) are important predictors of EPC levels (R2 = 31.8%). Fasting homocysteine alone explained 9.4% of variance (Table 1c). Multiple regression analysis showed that for every 10 μmol/L increase in fasting homocysteine, EPC colony counts decreased on the average by 7.4 colonies. The second multiple linear regression model showed that fasting homocysteine levels were inversely related to EPC colony counts even after adjusting for all available variables including age, sex, subject type, history of hypertension, history of diabetes, total cholesterol level, HDL, and FCRS (R2 = 38.6%).
Clinical data of the patients recovering from stroke. (
Univariate regression analyses of various risk factors and colony counts
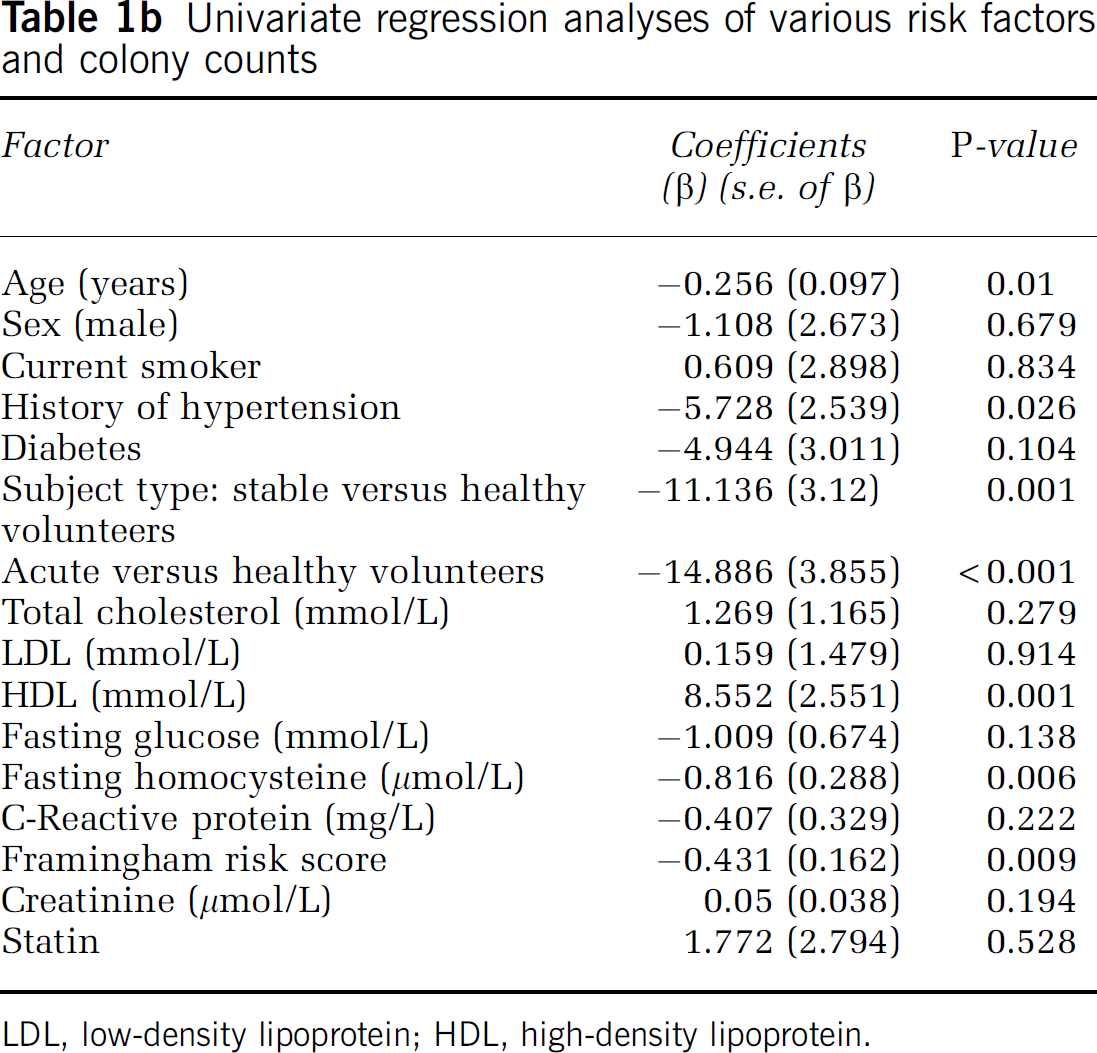
LDL, low-density lipoprotein; HDL, high-density lipoprotein.
Predictors of colony counts form multiple regression analyses
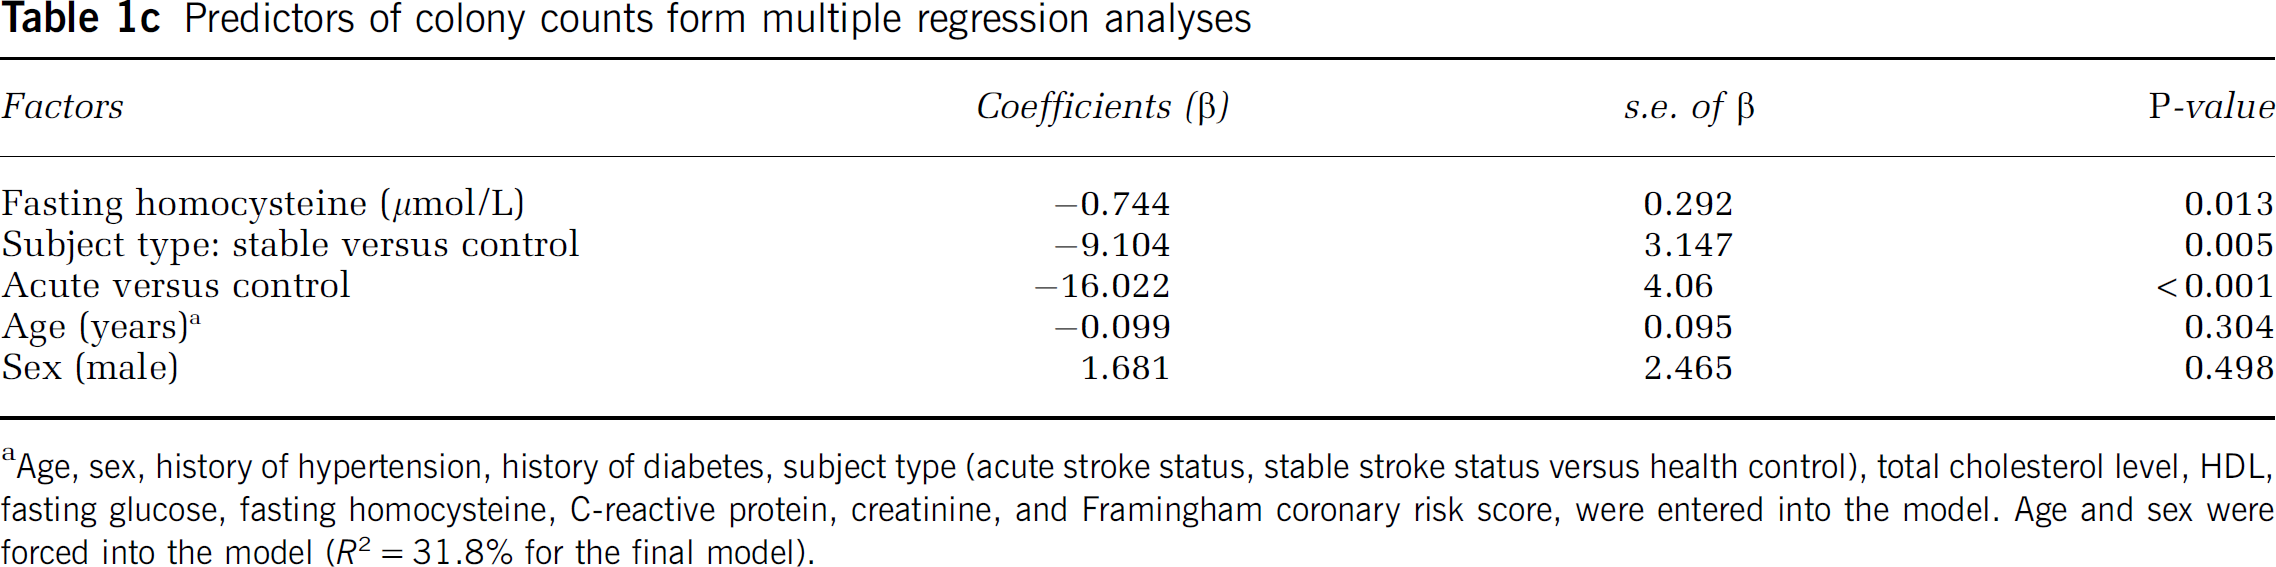
Age, sex, history of hypertension, history of diabetes, subject type (acute stroke status, stable stroke status versus health control), total cholesterol level, HDL, fasting glucose, fasting homocysteine, C-reactive protein, creatinine, and Framingham coronary risk score, were entered into the model. Age and sex were forced into the model (R2 = 31.8% for the final model).
There were 12 patients with homocysteine levels above 10 μg/L (74 μmol/L) who were treated with B vitamins. In six patients the treatment resulted in a decrease in homocysteine by 4 μmol/L or more. In the remainder, there was no decrease in the homocysteine levels with the treatment. Successful treatment resulted in a significant increase in EPC colony counts from 5.56±2.9 to 15.54±8.98 (P = 0.028; Figure 1C). This increase was not evident in the groups where the treatment with B vitamins did not lead to a decrease in homocysteine levels (Figure 1D).
Homocysteine Induces Activation of Caspases 8 and 3 and Release of Cytochrome c in EPCs
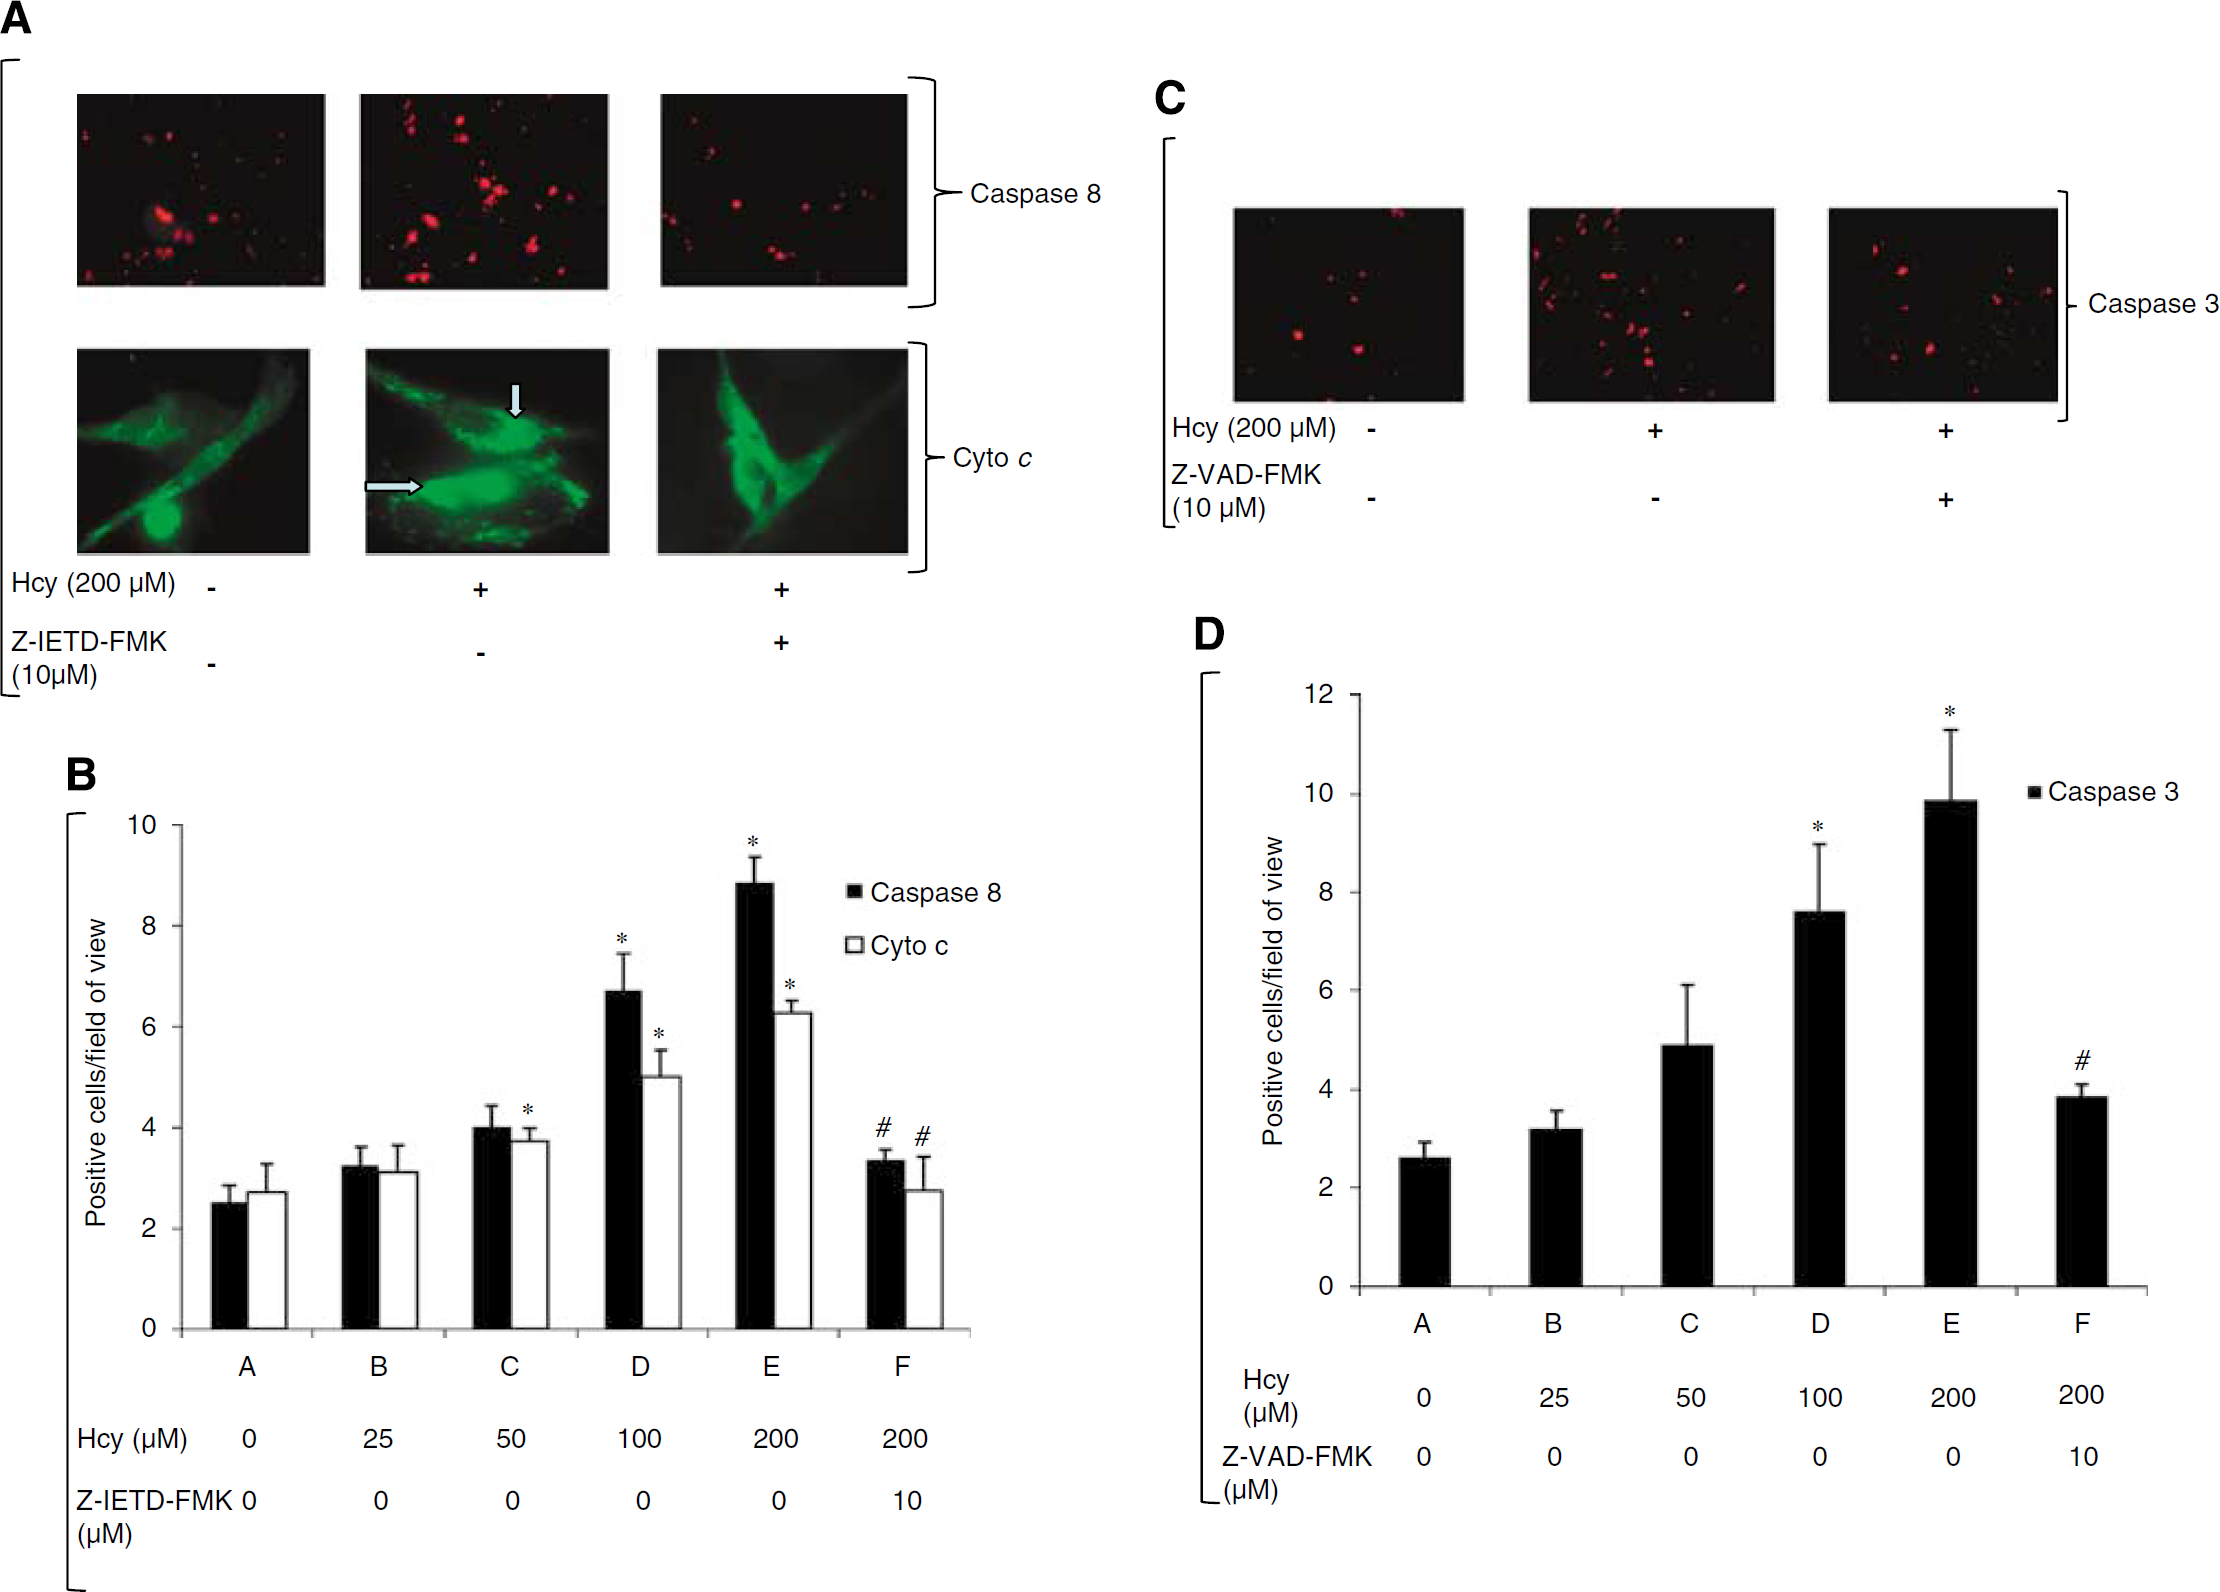
To determine the effects of homocysteine on EPCs we looked at the apoptosis in the EPC. We saw that homocysteine is able to induce apoptosis in the EPC after 24 h treatment at 200 μmol/L (Figure 2). Furthermore, at the intracellular level our in vitro study showed that homocysteine induces caspase-8 activation 3.5-fold in EPCs in a dose-dependent manner (Figure 3B) with maximal activation at 200 μmol/L homocysteine (control versus 200 μmol/L: 2.50±0.78 versus 8.86±1.11 P < 0.001). Caspase-8 was significantly activated even at 100 %mUmol/L homocysteine (6.72±1.65, P < 0.001; Figure 3B). A significant decrease in apoptotic cells was observed when EPCs were treated with Z-IETD-FMK, a caspase-8 inhibitor, compared with homocysteine alone (200 μmol/L homocysteine and caspase-8 inhibitor, 10 μmol/L Z-IETD-FMK (2.74±1.36) versus 200 μmol/L homocysteine (6.72±0.51) P < 0.001; Figures 3A and 3B). To ascertain the involvement of cytochrome c in homocysteine-induced apoptosis we measured cytochrome c released in untreated and Z-IETD-FMK-treated EPC cells. These were displayed as punctate cytoplasmic staining (Figure 3A), indicative of retention of cytochrome c in mitochondria; compared with diffuse and strong cytoplasmic staining observed in apoptotic EPCs. In the untreated control, cytochrome c release was 2.72±1.12 (empirical unit), which increased significantly in dose-dependent manner with homocysteine with maximal release at 200 μmol/L homocysteine (6.72±0.51, P = 0.001; Figure 3B).
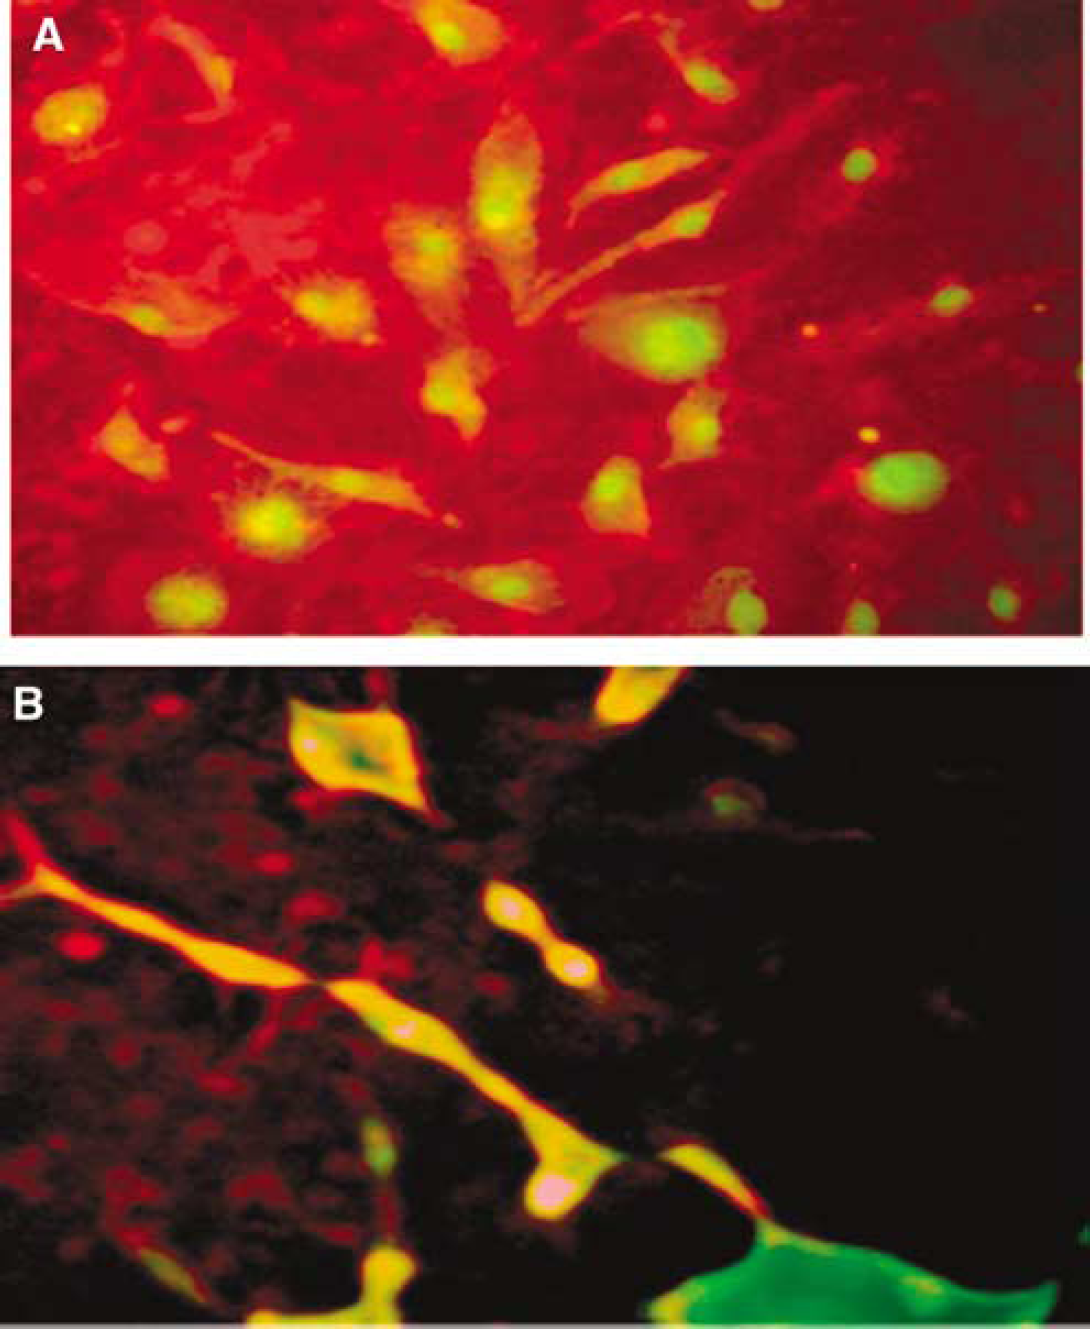
Induction of apoptosis in EPC by Homocysteine. (
(
Subsequently, we measured caspase-3 expression in EPCs after homocysteine treatment of EPCs, in vitro (Figure 3C). Caspase-3 is critical for the induction of apoptosis and is generally used to measure apoptosis in cells. We found that homocysteine treatment increased the caspase-3 in a dose-dependent manner (Figure 3D) where it increased 2.5-fold at 100 μmol/L homocysteine (7.60±3.34, P = 0.009) and roughly 4-fold at 200 μmol/L homocysteine (9.85±3.56, P < 0.001), compared with control (2.62±0.75). However, treatment with Z-VAD-FMK (10 μmol/L), global caspase inhibitor, decreased caspase-3 activation when compared with homocysteine alone (9.85±3.56, P < 0.001) versus Z-VAD-FMK (3.84±0.67).
Vitamin B6 and B9 Impairs Caspase-3 Activation in Homocysteine-Induced EPC Apoptosis
Similar to the result shown above homocysteine (200 μmol/L)-treated EPCs show a significant increase in the number of caspase-3-positive cells compared with control EPCs (control versus 200 μmol/L Hcy: 3.30±0.78 versus 9.48±1.64, P < 0.001; Figures 4A and 4B). However, when EPCs were treated with homocysteine along with 400 ng/mL vitamin B6 they showed significant attenuation of caspase-3 activation compared with homocysteine-only-treated EPCs (B6 versus Hcy: 3.75±1.10 versus 9.48±1.64, P < 0.001). Treatment with vitamin B9 (150 ng/mL) showed similar diminished homocysteine-mediated caspase-3 activation (200 μmol/L Hcy versus 200 μmol/L Hcy + 150 ng/mL vitamin B9: 8.67±1.34 versus 4.03±1.19, P < 0.001; Figures 4A and 4B). A significant difference was also observed in caspase-3 activation between inhibitor treated (Z-VAD-FMK, 10 and 200 μmol/L homocysteine, 3.50±0.39) and only homocysteine-treated EPCs (8.67±1.34, P μ 0.001).
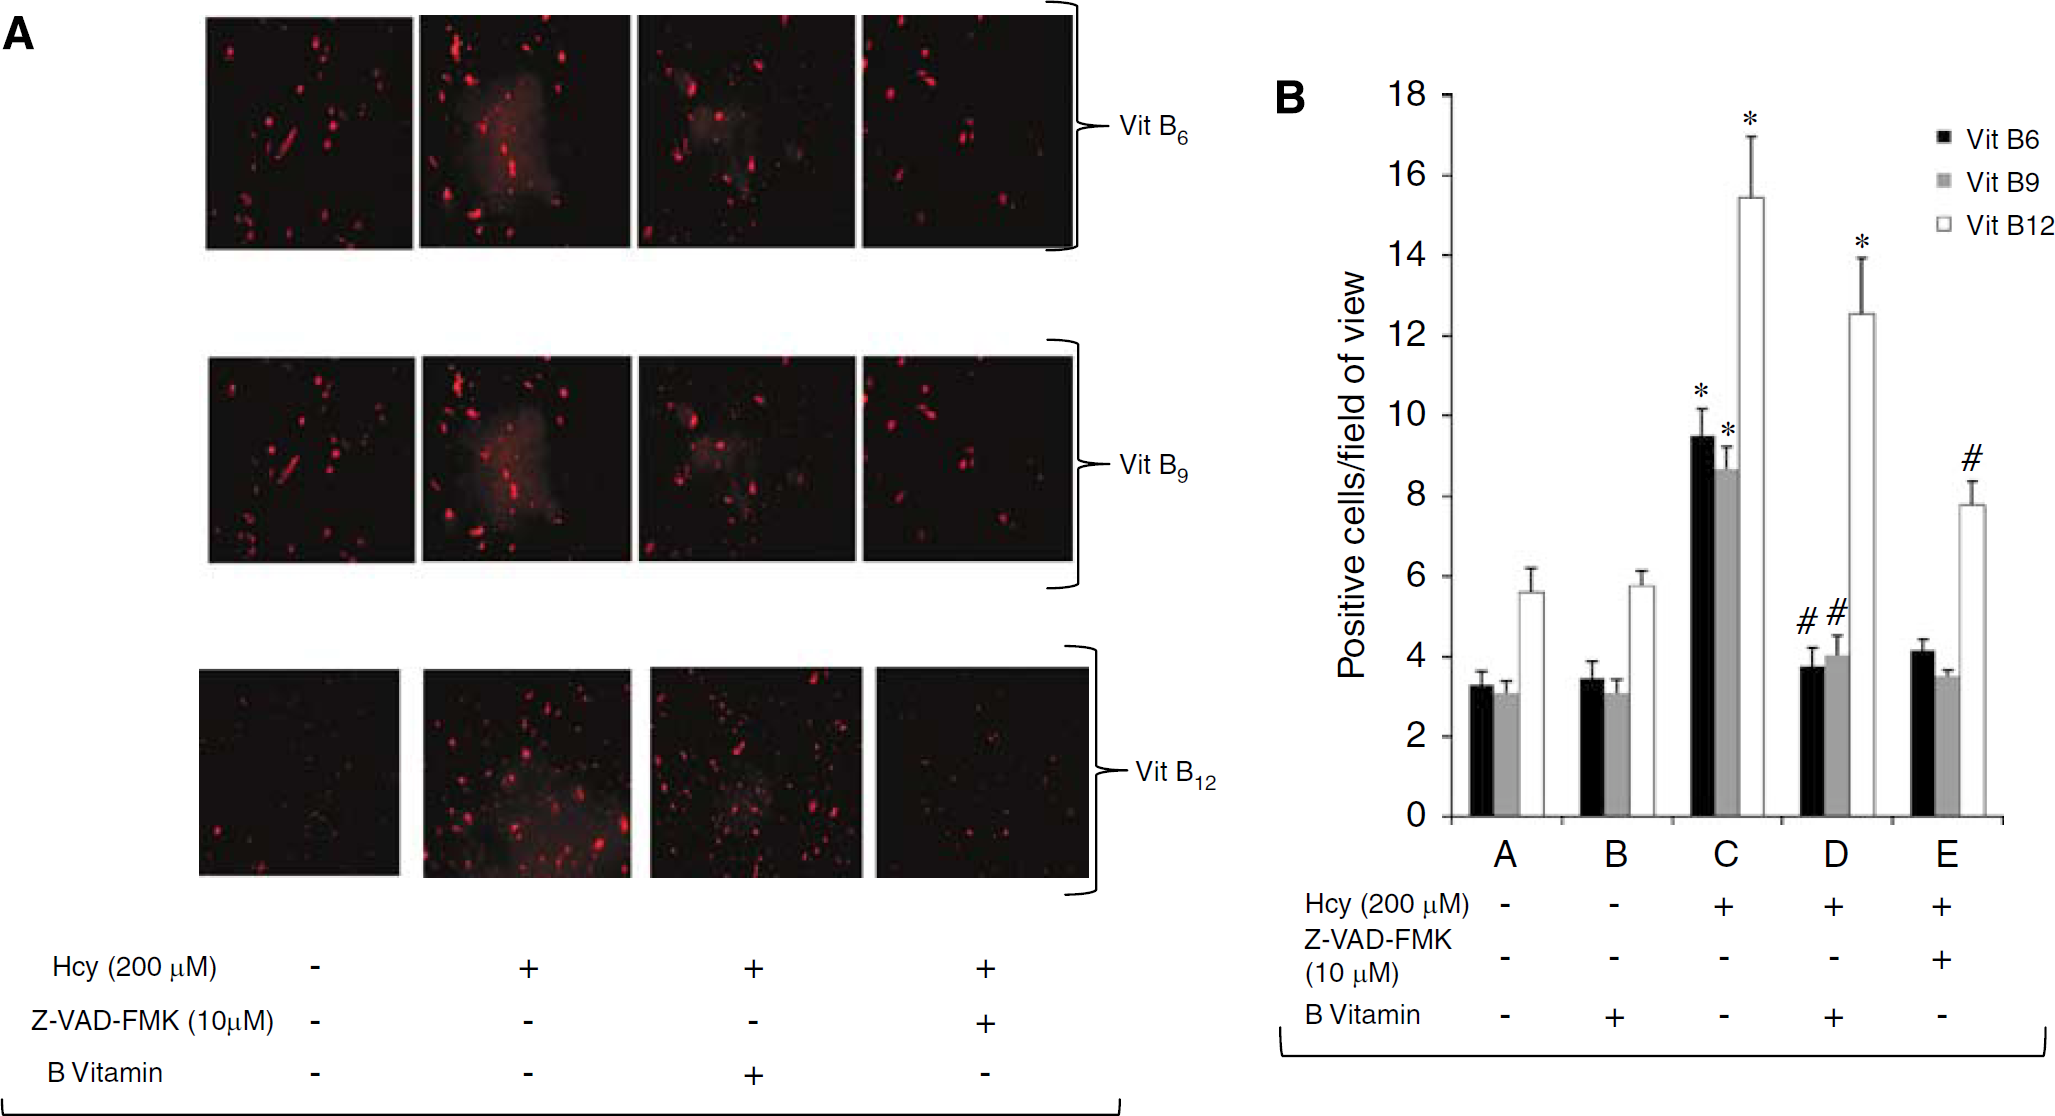
Effect of vitamin B on homocysteine-induced activation of caspase-3 in EPCs. (
Interestingly, vitamin B12 treatment (8 ng/mL) did not affect homocysteine-mediated increase in caspase-3 activation compared with the just homocysteine-treated group (12.55±3.41 versus 15.45±3.71, P = 0.053; Figures 4A and 4B). Vitamin B12 treatment, by itself, did not show any significant caspase-3 activation as compared with control (5.77±0.93, P = 0.917).
Discussion
Homocysteine is a sulfur-containing amino acid, synthesized during metabolism of methionine. It decomposes either by remethylation to methionine or trans-sulfonation to cystathionine (Rasmussen and Moller, 2000). Cystathionine-β-synthase (CBS, cofactor B6), a rate-limiting enzyme in the trans-sulfonation of homocysteine to cysteine, has been reported to be involved in severe hyperhomocysteinemia (Stampfer and Malinow, 1995). Insufficient dietary supply of any of the cofactors involved in methionine and homocysteine metabolism can result in hyperhomocysteinemia (Dawson et al, 2004). Generally, hyperhomocysteinemia is classified as moderate (15 to 30 μmol/L), intermediate (30 to 100 μmol/L), and severe (>100 μmol/L) (Kang et al, 1992; Welch and Loscalzo, 1998). Moderate hyperhomocysteinemia is observed in 5% to 7% of general population (McCully, 1996). Heterozygosity can cause the hereditary hyperhomocysteinemia which is milder and more common than homozygosity (Kang et al, 1993). Vitamin B deficiency is perhaps the most common cause of an increase in homocysteine levels, because vitamin B6 is cofactor for CBS activity (Selhub et al, 1993). Other conditions that may increase homocysteine levels include smoking, medication use, renal failure, and a number of other systemic diseases (Refsum et al, 2004).
The effects of homocysteine on endothelium function have been studied extensively (McCully, 1996; Chen et al, 2004; Noor et al, 2007). In vitrostudies have shown that homocysteine treatment results in increased expression of tissue factor which stimulates coagulation (Fryer et al, 1993), platelet-mediated generation of thromboxane-A2, it may also increase neutrophil adhesion to endothelial cells, leading to migration of neutrophils across the vessel wall with subsequent endothelial cell damage and detachment (Dudman et al, 1999). EPCs are reported to be involved in endothelial repair after injury (Asahara and Isner, 2002; Asahara, 2003). Reduced EPC numbers may result in impaired endothelial repair mechanism predisposing vascular system to atherosclerosis and thrombus formation. In the present study, we found that there is a significant reduction in the number of EPC colonies in individuals with high plasma homocysteine levels (stroke patients) (Table 1b), where univariate regression analyses show that the coefficient of β-value is −0.816 (s.e. 0.288) with a P-value of 0.006. For the first time, this study shows a direct correlation between homocysteine and EPC colony counts in stroke patients (Figure 1A). A similar relationship between the EPC number and FCRS was also observed in the patients (Figure 1B; Table 1b), indicating a probable role of homocysteine in affecting the integrity of the vascular system and its reiationship to EPCs. Interestingiy, we also found that successful reduction of homocysteine levels by vitamin B treatment resulted in a significant increase in EPC colony counts (Figure 1C). However, the increase in the EPC level in response to vitamin B treatment was limited to patients whose homocysteine level decreased by a minimum of 4 μmol/L (Figure 1D). The number of patients in this study is small, however, and a larger study is required to confirm these findings.
Having seen a correlation between hyperhomocysteinemia and EPC level, we wanted to determine the direct effect of homocysteine on EPCs. Homocysteine has been reported to decrease EPC numbers in cell culture (Chen et al, 2004). However, there are no reports on the underlying mechanism of homocysteine-induced cytotoxicity in EPCs. We have reported earlier that that homocysteine induces the apoptotic pathway in EPCs (Noor et al, 2007). At the intracellular level we found the caspase-8 pathway was most affected by homocysteine treatment of EPCs and there was 3.5-foid increase in caspase-8 with 200 μmol/L homocysteine. Caspase-8 belongs to family of cysteine proteases and is involved in apoptosis. It is activated either by the prototypic CD95 (Fas) apoptosis pathway (Nagata and Golstein, 1995) or by the tumor necrosis factor related apoptosis inducing ligand (TRAIL)-R1 pathway (Wiley et al, 1995) leading to an increased release of cytochrome c from mitochondria. Hence, to determine further downstream regulation we looked at cytochrome c release. We found that homocysteine indeed induced the release of cytochrome c from mitochondria into cytosol (Figures 3A and 3B). Cytochrome c which is released from mitochondria into cytoplasm upon activation (Yang et al, 1997) binds with procaspase-9 and Apaf-1 to form the apoptosome leading to activation of caspase-3, the ‘execution caspase’. Furthermore, we found that activation of caspase-8 and cytochrome c release was significantly reduced by Z-IETD-FMK, a caspase-8 inhibitor, indicating the involvement of caspase-8 and cytochrome c in homocysteine-induced apoptosis (Figures 3A and 3B). Further downstream, caspase-3 was activated 2.5-fold with homocysteine, indicating the progression of apoptotic signal to the stage where EPCs are committed to apoptosis (Figures 3C and 3D). Our study clearly indicates that induction of apoptosis may be an important mechanism by which an increased homocysteine level may lead to decrease levels of circulating EPCs. This observation matches with the clinical data that were seen earlier in Figure 1A, where we saw decrease in EPC colonies in patients who had higher homocysteine level.
In our clinical study we also found that B vitamin treatment reduced the homocysteine level in some patients. Interestingly, there was a concomitant increase in the EPC colonies in those patients (Figure 1D). Therefore, to ascertain the role of therapeutic effects of vitamin B treatment, we examined the effects of vitamins B6, B9, and B12 on homocysteine-induced apoptosis, in vitro. We followed the regulation of caspase-3 to determine the effects of B vitamins, because caspase-3 is the ‘execution caspase’ and its activation is required to proceed with apoptosis (Mazumder et al, 2008). Our results show that vitamins B6 and B9 successfully reduced the homocysteine-induced apoptosis in EPCs (Figure 4). This action of vitamins B6 and B9 was at the similar level as the global caspase inhibitor, Z-VAD-FMK (Figure 4). However, we do not know if the reduction of apoptosis by vitamins B6 and B9 and Z-VAD-FMK is mediated through same pathway as the inhibitor. Vitamin B12, however, failed to produce a similar beneficial effect (Figure 4). The doses of vitamins used in the study were comparable to the recommended pharmacologic dose. One of the reasons for the beneficial effect of vitamins B6 and B9 may be through activation of the CBS enzyme (not measured), which in turn might be decreasing homocysteine levels (Dawson et al, 2004), thereby reducing apoptosis in EPCs. However, the exact mechanism that is involved in the protective role of vitamins B6 and B9 is still to be determined and further investigations in the mechanistic role of vitamin treatment could lead to significant treatment outcomes in terms of stroke and cardiovascular disease.
Together, our data show that increasing concentrations of serum homocysteine are associated with decreasing levels of circulating EPCs and that the homocysteine-induced EPC reduction may be due to apoptosis through caspase-8-mediated release of cytochrome c and eventual activation of caspase-3. Moreover, vitamin B6 and B9 intervention can impair homocysteine-induced EPC apoptosis leading to increased increments of EPC populations. In closing, we would like to emphasize that the exact characterization of EPCs still remains unresolved (Yoder et al, 2007) further a recent publication even questions the role of EPC in vascular diseases (Purhonen et al, 2008). In our study we considered CD31/CD34-positive cells as EPCs. This is similar to what has been published by several other researchers (Hill et al, 2003; Doyle et al, 2006). We however, believe that the characterization and role of EPCs required further research.
Footnotes
Acknowledgements
The authors are grateful to Abdul Salam for statistical analyses. The study was funded by Heart and Stroke Foundation of Canada.