
Abstract
The Committee on Hearing and Equilibrium of the American Academy of Otolaryngology-Head and Neck Surgery proposed guidelines to provide more uniformity in reporting hearing results after middle ear surgery. One of the proposals was to include the hearing thresholds at 0.5, 1, 2, and 3 kHz in a 4-frequency pure-tone average (PTA) and to use postoperative bone-conduction (BC) levels rather than preoperative BC levels in describing postoperative air-bone gaps (ABGs). The hearing results of 451 stapes operations were evaluated to analyze to what extent the choice of different audiologic criteria affects success rates. It appeared that choice of PTA significantly affects postoperative gain in air-conduction thresholds and ABG levels. If one takes the improvements in speech-reception thresholds as the gold standard, the gain in air-conduction correlates best with a gain in speech-reception threshold if a higher frequency, such as 3 or 4 kHz, is included in a 4-frequency PTA. Also, choice of preoperative or postoperative BC in computing postoperative ABGs had a significant effect on the mean postoperative ABG levels, showing more favorable results with the use of preoperative BC thresholds. (Otolaryngol Head Neck Surg 2001; 124:76–83.)
In the last 4 decades, the surgical treatment for hearing losses caused by otosclerosis has evolved extensively, and it has, according to many prominent otologists, obtained a position as the treatment of first choice. The surgical techniques have been refined, and still new developments are going on, especially in the field of stapes replacement prostheses. In this respect it is necessary that uniformity exists in reporting hearing results after stapes surgery for a fair comparison between several surgical techniques or between various patient populations.
During review of the literature on stapes surgery, it appears that a great variation exists in the audiologic parameters and criteria used to establish success rates. Often the consequences of using different audiologic criteria on hearing outcome are underestimated, and therefore it is difficult to make an accurate comparison of results reported in the literature. Furthermore, it appears that the results from speech audiometry are seldom taken into consideration, whereas one of the most important goals of stapes surgery is improvement of speech-reception thresholds (SRTs). Several efforts have been made in the past to advance more uniformity in reporting hearing results. In many proposals for guidelines, the pure-tone average (PTA) at 0.5, 1, and 2 kHz was the most important because these frequencies are involved in speech reception. However, in 1995, the Committee on Hearing and Equilibrium of the American Academy of Otolaryngology—Head and Neck Surgery (AAO-HNS) 1 proposed guidelines in which the Committee recommended the use of a mean of thresholds at frequencies 0.5, 1, 2, and 3 kHz to form a 4-frequency PTA in reporting results from stapes surgery or ossiculoplasty. Berliner et al 2 showed that including a higher frequency, such as 3 or 4 kHz, in a 4-frequency PTA had a substantial influence on the success rate in stapes surgery. Another guideline from the Committee was to use postoperative bone-conduction (BC) rather than preoperative BC in computing postoperative airbone gap (ABG). With respect to this point, Berliner et al found that the use of postoperative BC instead of preoperative BC in computing ABG after surgery had an unfavorable influence on success rates.
The purpose of this study was to get a better understanding as to what extent the use of different audiologic criteria affects success rates after stapes surgery in our material, in which hearing results of 451 stapes operations were analyzed. Our study focuses on the following questions. Does choice of frequencies in accounting PTAs influence reported success rates? How do these results relate to results from speech audiometry? To what extent is ABG reduction affected by the use of postoperative instead of preoperative BC thresholds? To what degree is success rate affected by the choice of success criteria?
METHODS AND MATERIAL
Data were retrieved from every consecutive patient who underwent stapes surgery for otosclerosis during an 11-year period from January 1987 to December 1997. During this period, 473 stapes operations were performed by the second author. Of the total amount of patients, we had to exclude 22 (4.7%) cases from analysis; in 18 cases data were incomplete, in 3 cases the audiologist had indicated that the test was not reliable, and in 1 case there was a dead ear caused by an infection 2 weeks postoperatively. The remaining 451 cases that were considered for analysis concerned 397 patients. In 40 patients the operation was performed on both sides at separate surgical settings. There were 61 patients who underwent revision surgery; 10 patients had their initial surgery performed by the second author, and 51 patients were referred from other physicians. Of the revision patients who had their primary operation performed by the second author, there was 1 patient who needed a second revision operation, and in another patient it was necessary to do a third revision. In the group of 51 cases with primary surgery performed by another surgeon, there were 3 patients who already had one revision operation, 4 patients who had a revision operation twice, and 1 patient who had a revision operation for the third time before surgery in our clinic. The intraoperative findings revealed during revision, as well as the postoperative hearing results, are described in another study (unpublished data).
The patient group consisted of 246 women and 128 men, with a mean age of 39.9 years (range, 12-74 years) at the time of their operation in our hospital. The distribution between left and right ears was approximately even.
In the majority of patients, a small fenestra stapedotomy was performed (98.4%), and in only a few cases was a stapedectomy technique used (1.6%). A variety of stapes replacement prostheses was implanted. The most frequently used prostheses were the Causse Teflon piston (63%), the gold K-piston (19%), and the Cawthorne Teflon piston (12%). Several other prostheses were used in a minority of the patients. Although the diversity of prostheses is an influential factor in hearing outcome, we did not subdivide the population on the basis of implanted prostheses because this study concerns only the relative differences in methods of reporting results.
In our clinic the air-conduction (AC) thresholds are routinely measured at the octave intervals from 0.125 to 8 kHz and the BC thresholds at the octave intervals from 0.25 to 4 kHz with adequate masking. For most subjects who were considered for analysis, both AC and BC thresholds at the abovementioned frequency ranges were available before and after surgery. However, in some subjects the hearing loss was very severe, resulting in hearing thresholds that were beyond the maximum output of the audiometer. In these cases the pure-tone thresholds at certain frequencies were impossible to determine, and this is marked in the audiogram with an arrow pointing down. It is important to consider these limitations of the capacity of the audiometer because data of preoperatively or postoperatively unmeasurable hearing thresholds could wrongly be excluded from analysis. Severe postoperative hearing loss as a consequence of an unfavorable operation would then not be taken into account. Conversely, ears with unmeasurable hearing thresholds before operation as a consequence of severe hearing loss but with measurable hearing thresholds after operation could also be rejected. To avoid this problem, in these cases thresholds were assumed to be just beyond the audiometer limitations. If AC or BC was not measurable at a certain frequency, a value of 10 dB above the limit for that frequency was given.
The AC and BC thresholds at 3 kHz are not routinely measured in the Dutch audiological centers. To obtain values for the 4-frequency PTA at 0.5, 1, 2, and 3 kHz, a fictive hearing level at 3 kHz was interpolated by taking the average of the thresholds measured at 2 and 4 kHz.
In 93.8% (n = 423) of the cases, speech audiometry was available before and after surgery. For each subject, complete speech audiometry was carried out at different levels with lists of phonetically balanced consonant-vowel-consonant (CVC) words. 3 From these tests, the preoperative and postoperative SRTs could be derived. All audiograms were performed by classified personnel according to the ISO-389 (1975) standard. The mean time of audiometric testing after surgery was 2.1 months (range, 0.6-12.1 months; SD, 2.4). Ninety-four percent of the subjects had postoperative audiometric testing within 3 months.
All data were entered into a computer database and analyzed with a spreadsheet program. In analyzing our data, the postoperative results are presented by using 4 different PTA combinations at 0.5, 1, and 2 kHz; 0.5, 1, 2, and 3 kHz; 0.5, 1, 2, and 4 kHz; and 1, 2, and 4 kHz. The last-named frequency combination was also analyzed because it has been suggested to be a sensitive measure of overclosure or cochlear damage to hearing. 1 ABG closure data are reported by using postoperative, as well as preoperative BC thresholds for the 4 different PTA combinations in computing postoperative ABG. For speech audiometry, data are presented with regard to improvements in SRTs.
Audiometric data in this study did not show a normal distribution established with normality tests. Therefore nonparametric statistical analyses were performed (GraphPad Prism). The Wilcoxon signed-rank test was used for paired data, whereas the Spearman test was used for correlation analysis. Our criterion for statistical significance was set at P values of less than 0.05 (2-tailed).
RESULTS
Table 1 shows data with regard to mean preoperative and postoperative AC and BC levels (with SDs). A statistically significant improvement in AC is reached for every frequency, except at 8 kHz. Postoperatively, there
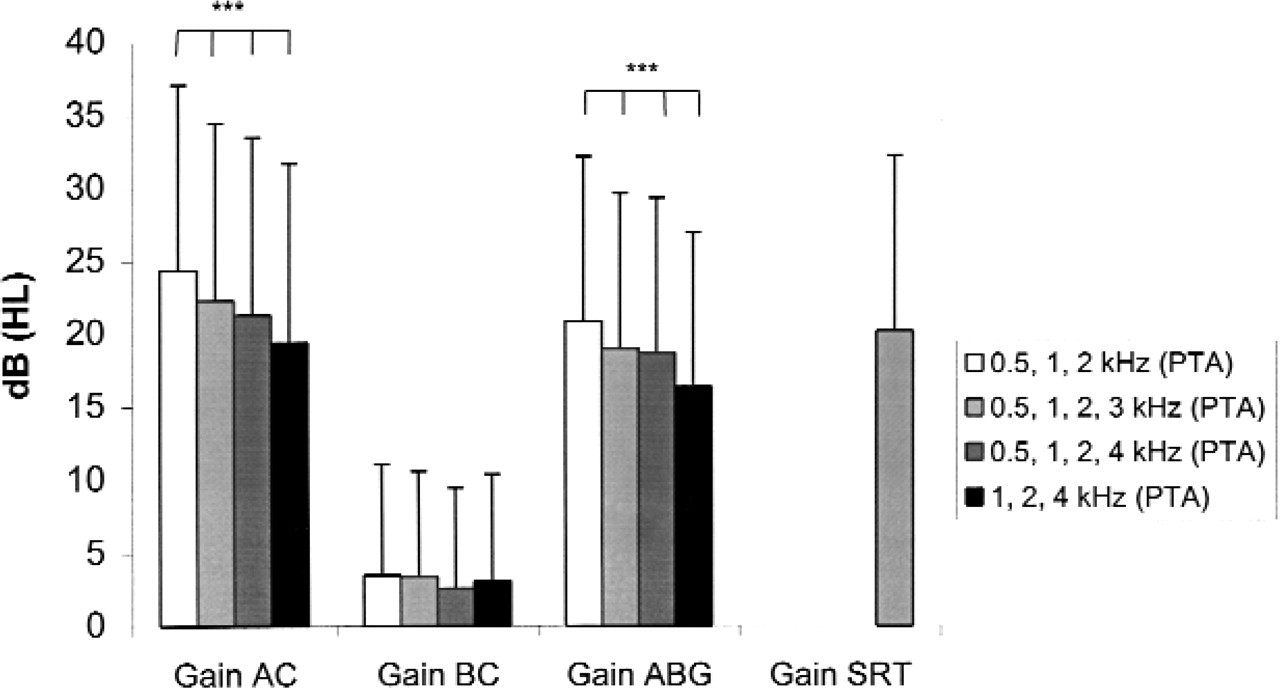
Mean gains in AC, BC, and ABG are shown for 4 different PTA combinations. Values for ABG improvement were based on preoperative ABG minus postoperative ABG computed with postoperative BC. For comparison, the mean gain in SRT is given as the gold standard. ∗Brackets indicate that for AC and ABG, all PTA combinations yield significantly different results (Wilcoxon signed-rank test, P < 0.001).
Preoperative and postoperative AC and BC thresholds
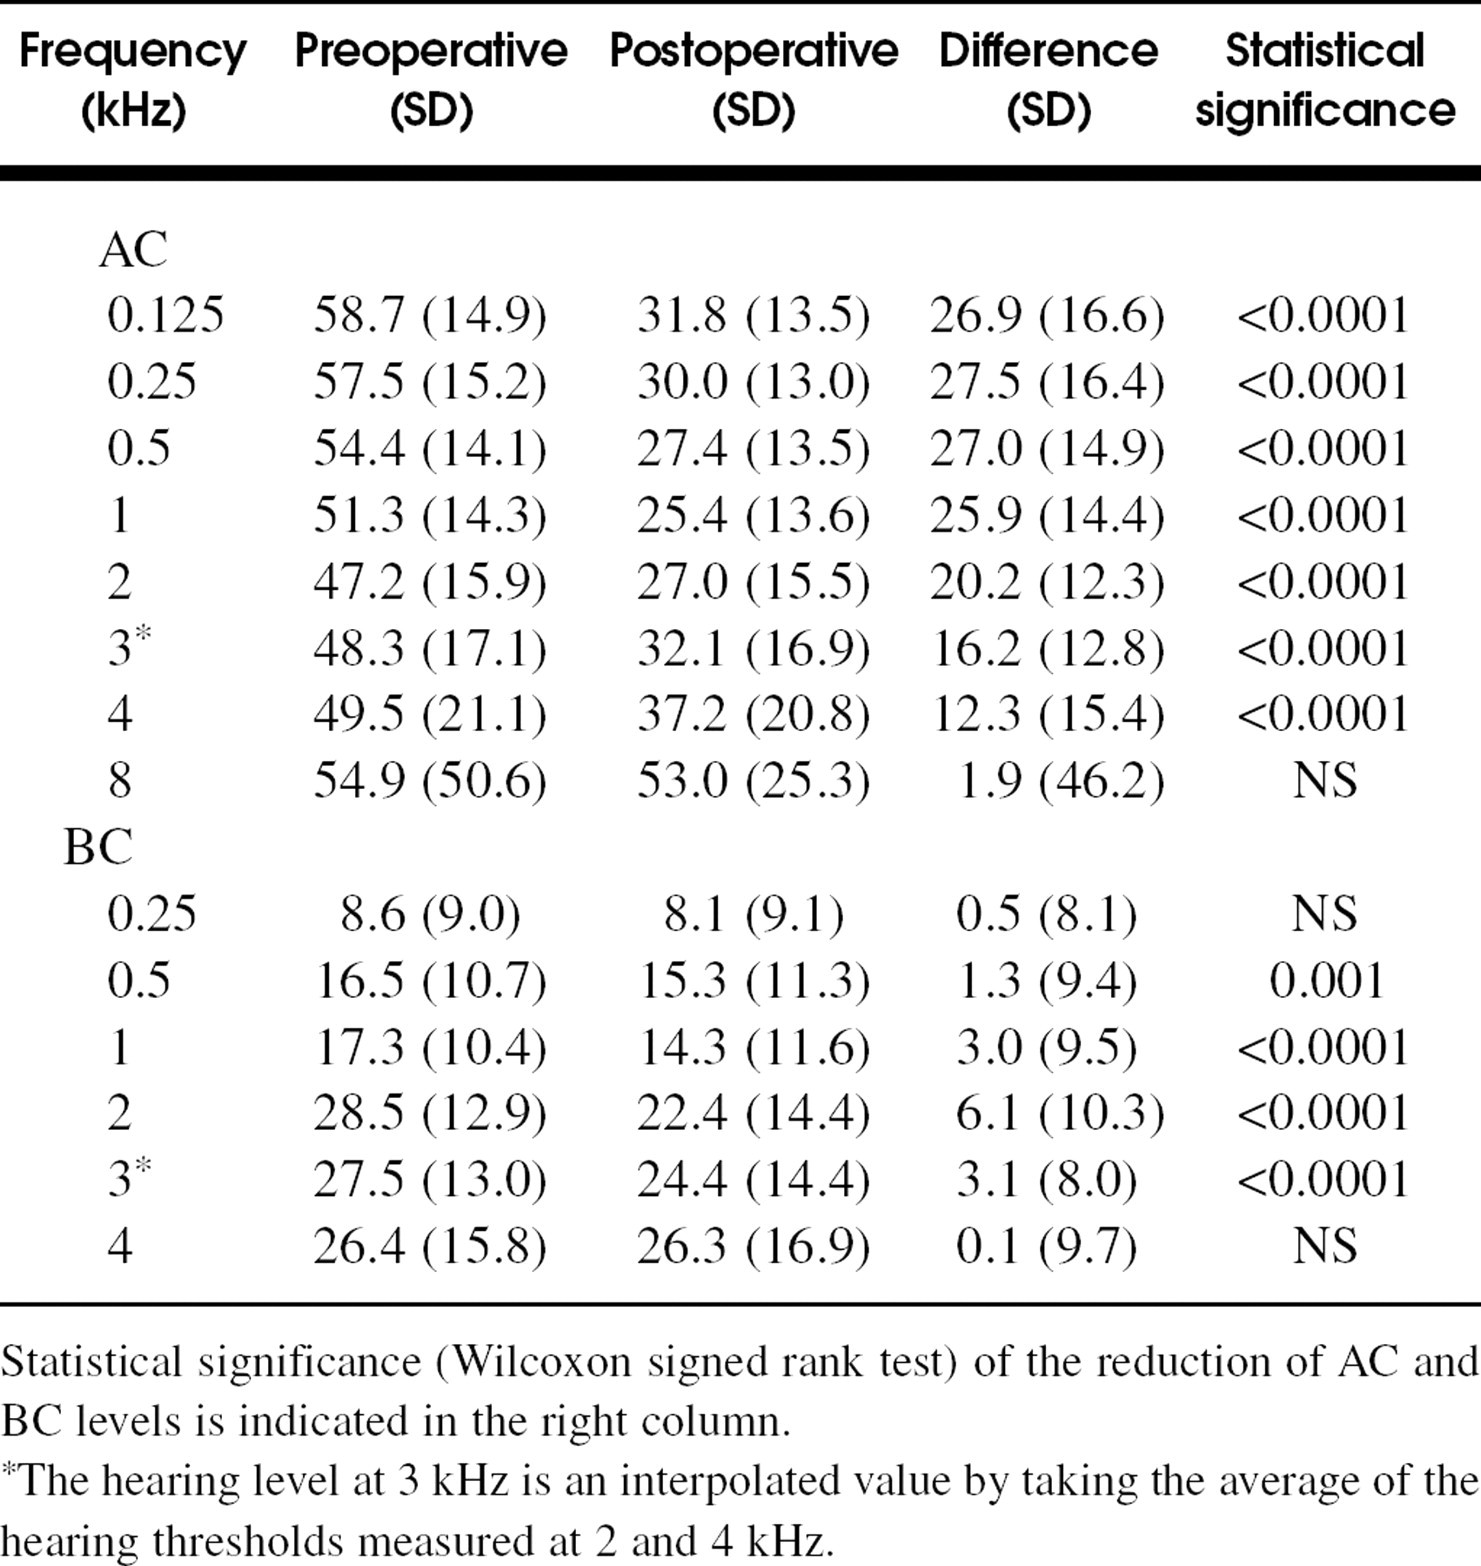
Statistical significance (Wilcoxon signed rank test) of the reduction of AC and BC levels is indicated in the right column.
The hearing level at 3 kHz is an interpolated value by taking the average of the hearing thresholds measured at 2 and 4 kHz.
was an improvement in the mean BC levels at all frequencies. The most obvious improvement was achieved at 2 kHz, which was 6.1 dB. The differences between preoperative and postoperative BC thresholds were statistically significant for the individual frequencies at 0.5, 1, and 2 kHz. At 4 kHz, there is only a small improvement, and it was not statistically significant.
Influence of choice of frequencies in computing PTA
Fig. 1 shows the gain in AC, BC, and ABG for the 4 PTA combinations. For reasons of comparison, the mean gain in SRT has also been reported. Choice of frequencies in computing PTA has a relatively small influence on improvement in BC. However, PTA frequency combination does have a significant (P < 0.001) influence on improvements in AC and ABG. The differences between the traditional 3-frequency (0.5, 1, and 2 kHz) and high-frequency (1, 2, and 4 kHz) PTAs were the largest, being 4.9 dB and 4.5 dB for the gains in AC and ABG, respectively. The high-frequency PTA combination gives an overall smaller gain in AC and ABG. The gain in AC for the frequency combination 0.5, 1, 2, and 4 kHz is 21.2 dB (SD, 12.2) and corresponds best with the gain in SRT, which is 20.2 dB (SD, 12.1).
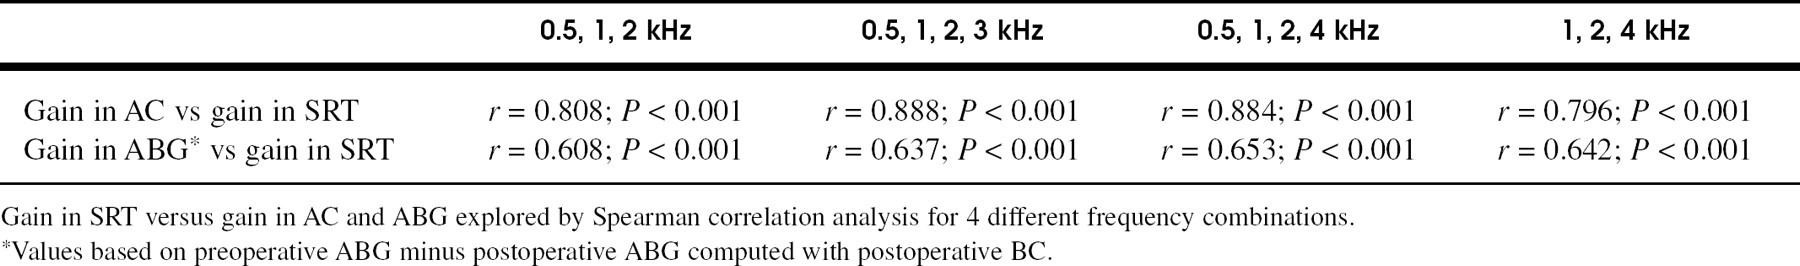
Choice of PTA frequency combination has some influence on the preoperative ABG (Fig. 2). Postoperatively, it has little influence on the remaining ABG computed either with preoperative or postoperative BC. These differences are not statistically significant. In addition, Fig. 3 shows that the PTA frequency combination has also little influence on the percentage ABG closures of 10 dB or less and higher categories when using either postoperative or preoperative BC. The relations between postoperative improvement in SRT at one side and improvements in AC and ABG for the 4 different PTA combinations at the other side were explored by Spearman correlation analysis (Table 2). As expected, a larger correlation exists between gain in AC and gain in SRT in
Preoperative mean ABG (preop ABG) and postoperative mean ABG (postop ABG) are shown for 4 different PTA combinations. Postoperative BC (postop BC) values and preoperative BC (preop BC) values are used in accounting postoperative ABG. Correlation analysis with gain in speech reception as the gold standard Gain in SRT versus gain in AC and ABG explored by Spearman correlation analysis for 4 different frequency combinations. Values based on preoperative ABG minus postoperative ABG computed with postoperative BC.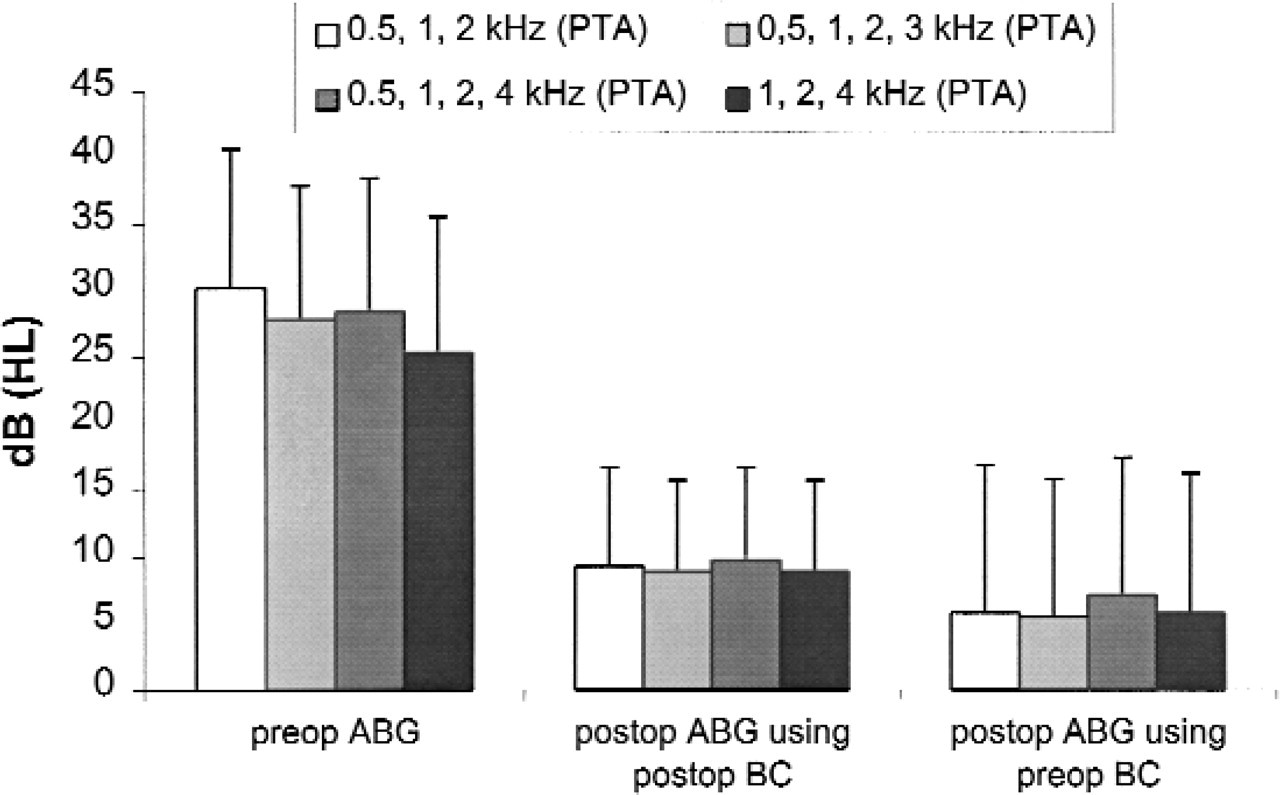
Influence of choice of preoperative or postoperative BC in computing postoperative ABG
Fig. 2 shows that the overall results with regard to postoperative ABG are more favorable with preoperative BC. The differences are 3.5, 3.4, 2.5, and 3.0 dB for the PTA combinations at 0.5, 1, and 2 kHz; 0.5, 1, 2, and 3 kHz; 0.5, 1, 2, and 4 kHz; and 1, 2, and 4 kHz, respectively. These differences are statistically significant (P < 0.001) for all 4 PTA combinations.
Using preoperative BC also gives more favorable results with regard to percentage ABG closures of 10 dB or less (Fig. 3). In this respect the largest differences are 6.6%, 4.9%, and 3.4% for the PTA combinations at 0.5, 1, and 2 kHz; 0.5, 1, 2, and 3 kHz; and 1, 2, and 4 kHz, respectively, but only 1.5% for the PTA combination at 0.5, 1, 2, and 4 kHz. Using preoperative or postoperative BC does not substantially affect the results on percentage ABG closures for the higher categories.
Influence of choice of success criteria
Fig. 4 shows the success rates according to different success criteria. The percentages of AC thresholds and the percentages of ABG closures within several levels are calculated for the 4 different PTA combinations. Postoperative ABG has been computed with postoperative BC. Also, the percentages of ears with SRTs within several levels are presented. The curve from AC thresholds for the traditional 3-frequency PTA at 0.5, 1, and 2 kHz corresponds best with the curve from SRTs. Fig. 4 clearly shows the effect of the choice of PTA on success rate with regard to percentages of ears with AC levels within different categories. If normal hearing, defined as an AC threshold of 20 dB or less, is taken as a measure of success, the success rate will be approximately 8% higher for the traditional 3-frequency PTA at 0.5, 1, and 2 kHz than for the 4-frequency PTA at 0.5, 1, 2, and 4 kHz. This difference will be even more (∼10%) if one defines success as socially acceptable hearing with an AC level of 30 dB or less.
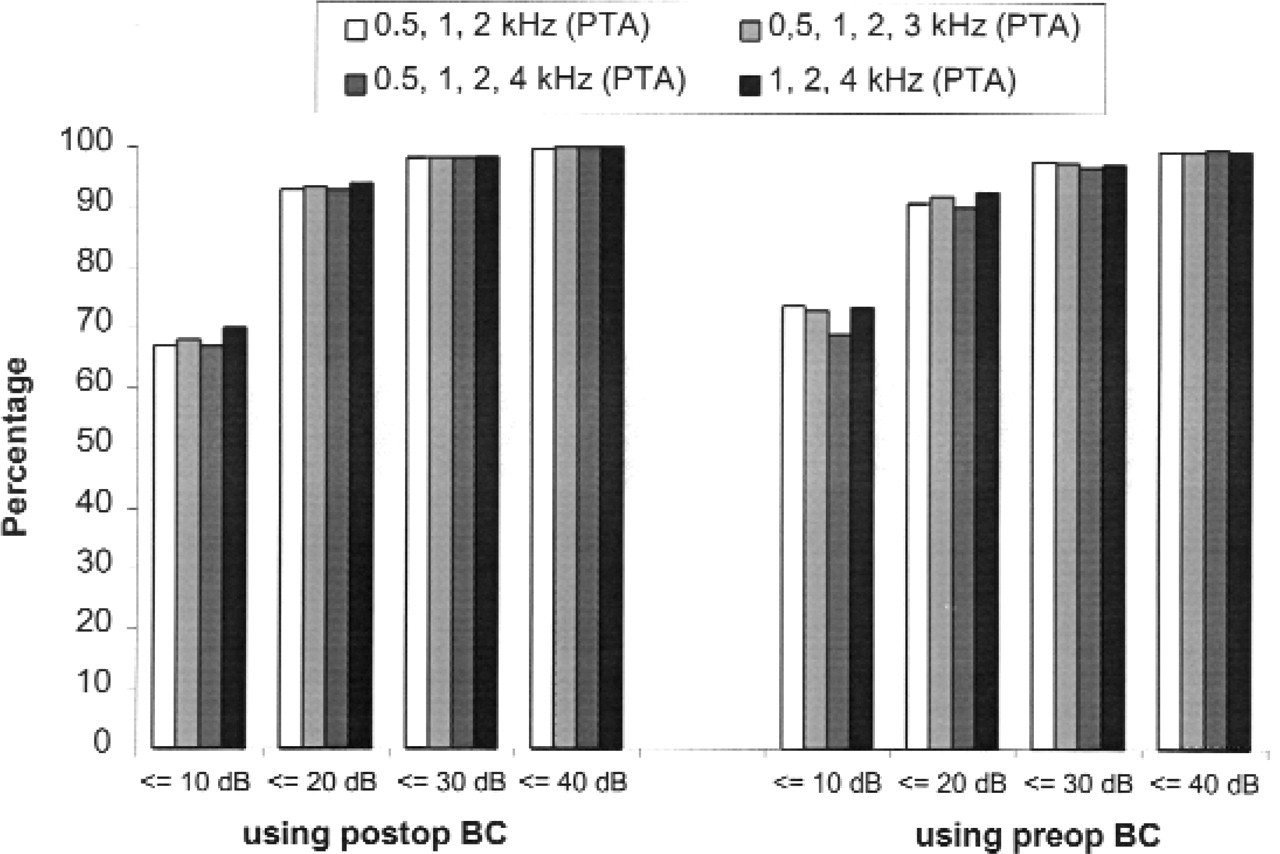
Cumulative percentage of postoperative ABG for 4 different PTA combinations. Postoperative BC (postop BC) values and preoperative BC (preop BC) values are used in accounting postoperative ABG.
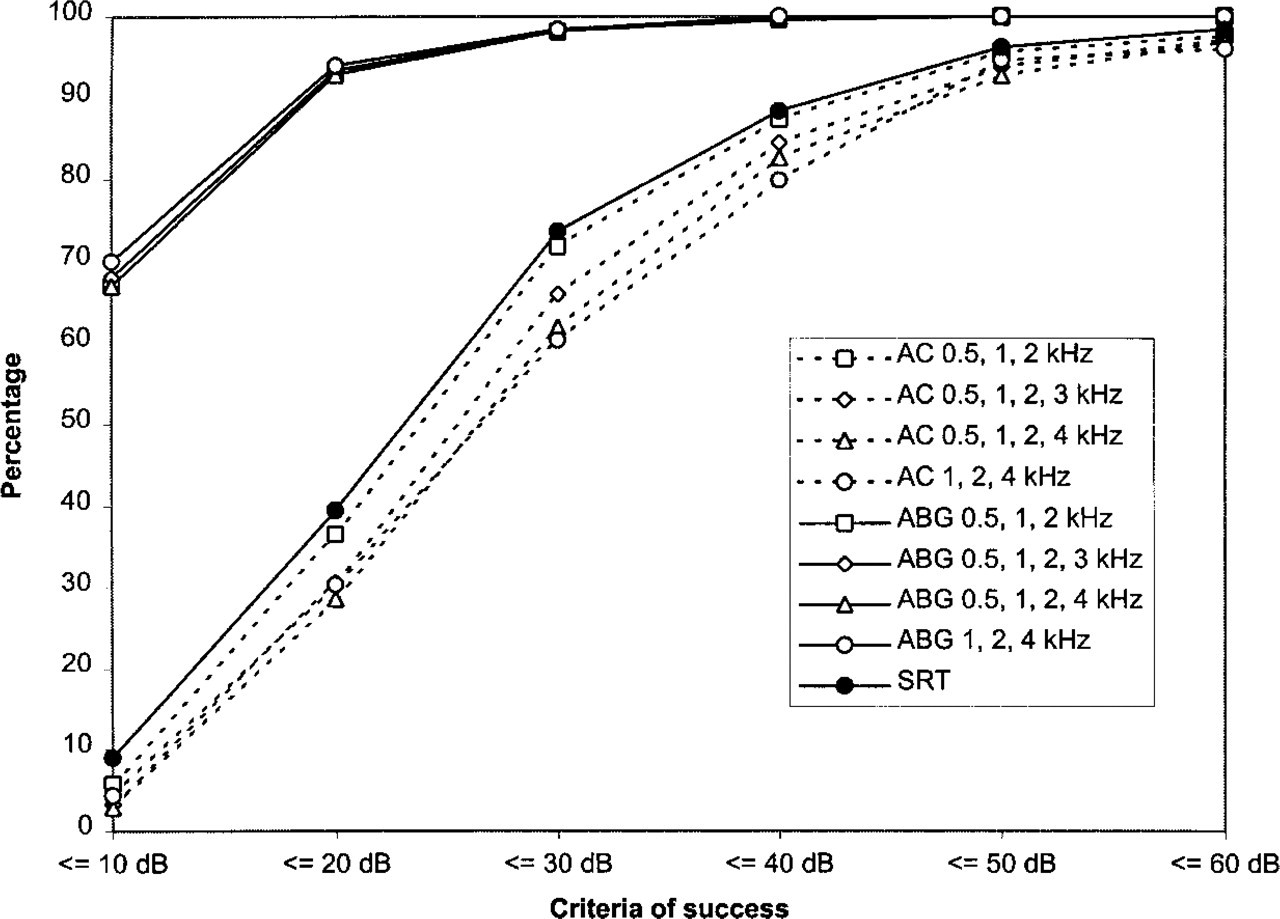
Success rates are shown for AC thresholds and ABG values within several categories for 4 different PTA combinations. Postoperative ABG was computed with postoperative BC. In addition, success rates are shown for SRT levels within several categories.
The most important differences are between the percentages of ABG closures and AC or SRT levels within certain criteria. A much higher success rate (∼30%) will be achieved if one considers the percentage of ears with ABG closure of 10 dB or less as a criterion for success instead of the percentage of normal hearing ears with AC or SRT levels of 20 dB or less. However, less-striking differences will be obtained if one compares ABG closure of 10 dB or less with AC or SRT levels of 30 dB or less as criteria for socially acceptable hearing.
DISCUSSION
In the evolution of surgical treatment of hearing loss caused by otosclerosis, initially the frequencies 0.5, 1, and 2 kHz were considered for accounting PTAs in evaluation of hearing results because they were mostly involved with conversational speech reception. 4 During development of speech audiometry, it appeared that the traditional 3-frequency PTA (the so-called Fletcherian index) for AC thresholds correlated well with SRTs. Later, after introduction of the stapedectomy technique by Shea, 5 the hearing thresholds at 0.5, 1, and 2 kHz remained the most important in evaluation of hearing results. Hearing levels at the same frequencies were also recommended in the guidelines of reporting hearing results after surgery of chronic ear infections by the Committee on Conservation of Hearing of the American Academy of Ophthalmology and Otolaryngology in 1965. 6 More recently, the abovementioned frequencies were recommended according to the guidelines drafted by the Committee on Nomenclature of the Japan Society of Clinical Otology. 7 To stress the importance of the hearing threshold at 1 kHz in SRT, this Committee recommended additionally a “dividing by four method” in which the hearing threshold at 1 kHz is counted twice.
In 1995, new guidelines were proposed by the Committee on Hearing and Equilibrium of the AAO-HNS 1 to report hearing data in a simple and uniform way after tympanoplasty and stapes surgery. One of the guidelines was to include the hearing threshold at 3 kHz in a 4-frequency PTA. Another guideline was to use AC and BC thresholds of the same postoperative audiogram rather than using postoperative AC and preoperative BC levels in computing postoperative ABG. Goldenberg and Berliner 4 found, in their material, that when a higher frequency (3 or 4 kHz) was used in a 4-frequency PTA, it did not have a significant influence on success rate after tympanoplasty surgery in comparison with the traditional 3-frequency PTA. A year later, Berliner et al 2 showed that including the hearing thresholds at 3 or 4 kHz in a 4-frequency PTA had a significant effect on the success rate after stapes surgery.
Our results confirm the findings of Berliner et al 2 that choice of PTA does affect the percentage of normal hearing ears with AC levels of 20 dB or less; in this study the differences were 6.0% and 8.0% in the advantage of the traditional 3-frequency PTA at 0.5, 1, and 2 kHz in comparison with the 4-frequency PTAs at 0.5, 1, 2, and 3 kHz and 0.5, 1, 2, and 4 kHz, respectively. Choice of PTA had little effect on postoperative ABG levels (Fig. 2), which is also in agreement with the findings of Berliner et al. 2 Furthermore, it appeared that it also had little effect on the percentage of ears with ABG closure of 10 dB or less or higher categories (Fig. 3 and Fig. 4).
The most important goal of stapes surgery is improvement of hearing and consequently improvement of the ability for reception of conversational speech. In this perspective we also analyzed the improvements in SRTs and used it as the gold standard for comparison with gains in AC and ABG for the 4 different PTAs examined (Fig. 1). It was shown that the mean postoperative gain in SRT corresponds best, on average, with the mean gain in AC for the two 4-frequency PTA combinations (Table 2). To our surprise, it appeared that after comparison between the percentages of ears with an SRT within a certain level (eg, 20 or 30 dB) and the percentages of ears with an AC threshold within a certain level, these success percentages are best in agreement with the traditional PTA combination at 0.5, 1, and 2 kHz (Fig. 4). This may be caused by the fact that SRTs have been measured in quiet without background noise. For speech reception in noise, the higher frequencies have been shown to be more important.
It is a logical matter that many studies relate surgical success to the improvement of ABG because it is supposed that gap reduction represents repair of the conductive system of the middle ear, which shows the technical success of surgery. In establishing postoperative ABG, studies 8,9 often use the method by taking the differences between postoperative AC and preoperative BC levels, whereas more recently published studies 10 use the method in which the differences between postoperative AC and BC thresholds are taken into account. In some studies 11,12 it is not possible to trace which method has been used. Occasionally, postoperative ABG is computed by taking the best BC level. 13,14
Initially, the first mentioned method, which makes use of preoperative BC levels, was used more often in the literature, and an ABG closure within 10 dB was considered as a technical success. This method of computing postoperative ABG was also recommended by the Committee on Nomenclature in Chronic Ear Disease and the Otosclerosis Study Group 14 in 1971. It is, however, well known that BC thresholds can substantially improve after surgery, as already described after fenestration surgery by Carhart 15 in 1950; this is known as the Carhart effect. Postoperatively, the inertial component of bone-conducted sound transmission is restored, and therefore postoperative BC thresholds may correspond better with the true function of the cochlea. This supports the use of postoperative BC thresholds for computing postoperative ABGs. Harder et al 16 found in his study that the gap between postoperative AC and preoperative BC was dependent on the level of preoperative BC thresholds, but the gap to postoperative BC seemed to be independent of the preoperative BC threshold level. Furthermore, he found that gaps to postoperative BC showed less variation than the gaps to preoperative BC, and it was stated that postoperative BC thresholds may serve as a more stable and natural reference when calculating postoperative ABG.
In our study choice of preoperative or postoperative BC most obviously affected the mean postoperative ABG levels for all 4 PTAs, with larger improvements relative to preoperative BC (Fig. 2). It also had an effect on the percentage of ABG closure of 10 dB or less, with the largest difference for the PTA combination 0.5, 1, and 2 kHz, which was 6.6% more favorable when using preoperative BC. The use of preoperative or postoperative BC did not have a substantial influence on the percentage of ABG closure of 20 dB or less or higher levels for all 4 PTAs (Fig. 3). Berliner et al 2 did not find large differences in percentages of ABG closures of 10 dB or less and several higher levels by using preoperative or postoperative BC in computing postoperative ABG.
During review of the literature, it appears that several criteria are used to establish success. Studies that report results with regard to improvement of AC thresholds often take the traditional speech frequencies (PTA of 0.5, 1, and 2 kHz) into account, 17,18 although sometimes the gain for individual frequencies are reported as well. 18,19 Less often, results with regard to improvement of AC thresholds are reported with 4-frequency PTAs, as recommended by the AAO-HNS. 1 Sometimes authors 2,4 relate surgical success with the percentage of ears with AC thresholds within a certain level, such as 20 or 30 dB. Only a few studies 11,18 have analyzed speech audiograms and report results with regard to improvement in SRTs. Because a variety of success criteria are being used in the literature, it is difficult to compare studies with regard to hearing improvement after surgery. In our material it makes, as expected, a big difference when taking the percentages of ears with ABG closure within a certain level as a measure of success or when taking the percentages of ears with an AC threshold within a certain level. If one takes the percentage of ears in which normal hearing was obtained after surgery, defined as an AC threshold of 20 dB or less, as a measure of success, there will be a difference of approximately 35% from the percentage of ears with an ABG closure of 10 dB or less postoperatively. The difference will be less when success is defined as the percentage of ears with socially acceptable hearing (AC threshold, ≤30 dB). The effects of choice of PTA on the extent of this difference has been clearly illustrated in this study (Fig. 4).
Although it was not strictly necessary for this study to subdivide the cases of primary surgery from those of revision surgery, it is well known from the literature that revision surgery yields less-favorable results with regard to hearing improvement, as is the case in this study. The success rate, defined as an ABG closure of 10 dB or less (postoperative ABG computed with postoperative BC for the 4-frequency PTA at 0.5, 1, 2, and 4 kHz) was 71% for the primary cases, whereas it was 58% for the revision group.
CONCLUSIONS
The aim of this study was to establish to what extent choice of different audiologic criteria affects success rates after stapes surgery. This study provides the following answers to the questions mentioned in the introduction:
Choice of PTA significantly affects postoperative gain in AC thresholds and ABG levels (Fig. 2). However, it has little influence on the remaining postoperative ABG and on the percentage of ears with ABG closures of 10 dB or less or higher categories.
If the improvement in SRT is regarded as the gold standard, the gain in AC does correlate best with the gain in SRT if a higher frequency, such as 3 or 4 kHz, is included in a 4-frequency PTA.
Choice of preoperative or postoperative BC in computing postoperative ABG had a significant effect on the mean postoperative ABG levels, showing more favorable results when preoperative BC thresholds were used. In our results, using preoperative BC levels also gives more favorable results with regard to ABG closure of 10 dB or less, with the largest difference (6.6%) for the PTA combination at 0.5, 1, and 2 kHz. It has less effect on the percentage of ears with an ABG closure to higher categories.
Success rate is mainly dependent on definition and criteria as a measure of success (Fig. 4). In this perspective the percentage of ears with socially adequate hearing, defined as an AC threshold of 30 dB or less, does compare best with the percentage of ears with ABG closure of 10 dB or less. In our opinion the achievement of socially adequate hearing is a more realistic measure of success than the achievement of normal hearing, defined as an AC level of 20 dB or less.
On the basis of our results, we agree with the conclusions of Berliner et al 2 and the AAO-HNS recommendations 1 to use AC and BC levels from the same audiogram in computing ABG. Because in many audiology departments in Europe a frequency of 3 kHz is not routinely measured, a 4-frequency PTA will be an average at 0.5, 1, 2, and 4 kHz in most situations and is preferred for reporting results after stapes surgery with regard to mean values of audiologic parameters.