
Abstract
A high oxygen content can lead to metallurgical defects such as holes and microcracks in the products of selective laser melting (SLM) that significantly reduce the density and mechanical properties of a denture. In this study, a batch of a Co–Cr alloy powder was subjected to forced oxidation. SLM was used to prepare specimens from the powder before and after the treatment for the performance tests. The results showed that Co–Cr alloy powders with oxygen contents 184 and 616 ppm could both achieve good shaping of the specimens under identical SLM conditions. There was no significant difference between the specimens in terms of fuselage morphology, microstructure, density, tensile strength, yield strength and hardness. However, the elongation of the alloy synthesised using the higher oxygen content powder was significantly lowered, but still higher than that required by the ASTM F75 Casting Standard of the United States.
Keywords
Introduction
The alloys based on Co–Cr are extensively used in orthopaedic reconstructive surgeries for their high strengths and wear properties [1,2]. However, the manufacturing process requires the technical expertise and experience of a doctor due to the complexity of oral medicine and the individual differences between patients. Traditional manufacturing methods for dental restorations, such as precision casting and CNC machining, have the disadvantages of long process cycles, low yields, complicated procedures and high costs [3]. Selective laser melting (SLM) has therefore quickly shot into prominence recently in the field of personalised medicine with its ‘free manufacturing’ of personalised products [4,5]. Many scholars have studied the rapid manufacturing of Co–Cr alloy dental restorations with SLM [6–10], but few have investigated the actual properties of the Co–Cr alloy powders.
In SLM, the forming process involves the re-melting and solidification of a metal powder. High oxygen contents in the powder or processing environment may cause unique metallurgical defects such as porosity, inclusions and micro-cracks that can seriously impact the density and mechanical properties of the workpiece. Therefore, the control of the oxygen content of the Co–Cr alloy powder has a significant influence on the microstructures and properties of the parts formed using SLM in controlled processing environments.
Generally, the oxygen content in a Co–Cr alloy should be below 500 ppm. Some systems though require that this content be below 300 ppm (corresponding to a mass percentage of oxygen less than 0.03%) in the metal. This study focuses on the influence of the change in oxygen content of a dental Co–Cr alloy powder on the microstructure and properties of a denture formed by SLM. The results provide a technical reference for the preparation of dental restorations from Co–Cr alloy powders using SLM.
Materials and methods
Our experiments involved the use of spherical Co–Cr alloy powders prepared by inert gas atomisation and having particle sizes ranging from 15 to 53 μm (Figure 1). Table 1 shows the chemical composition of the powder employed in this study. The oxygen content was 184 ppm. The powder was subjected to forced oxidation to obtain a sample with a different oxygen content. We used the standard JB / T 7901-2001 as the reference. The test solution comprised 10 wt-% oxalic acid. The powder was uniformly tiled in an airtight container for corrosion tests at room temperature and then washed with water for 1 h in vacuum, followed by cooling in a furnace. The Co–Cr alloy powder was subjected to surface passivation by etching. As the test time increased, the passivation film gradually became denser; in other words, the oxygen content in the powder gradually increased. Due to the compactness of the oxide film, the contact area between the metal and test solution was greatly reduced; the reaction rate also decreased rapidly to become negligible. Therefore, the oxygen content does not increase above a certain level. After several verifications, the batch oxygen limit of the powder is 600∼640 ppm, while the average oxygen content measured after the powder mixture is 616 ppm. The carbon content of the Co–Cr alloy powder is only 70 ppm, which is tested by a CS600 carbon–sulphur analyzer (carbon accuracy of 0.0006∼6.00%) made by United States LECO Company. Therefore, the effect of the additional oxygen on the formation of carbides was not considered in this study. Specimens were prepared from the Co–Cr alloy powder by SLM before and after oxygenation, and have been numbered #1 and #2, respectively, to facilitate a comparative study. The specimens were subjected to grinding, polishing and alcohol cleaning before use in the experiments.
Morphology and particle size distribution of the 10–53 μm Co–Cr alloy powder. Chemical composition of the Co–Cr alloy powder.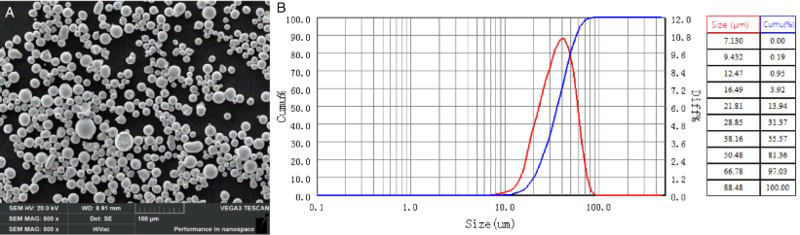

The SLM equipment used for the experiment was an FS 271M, procured from FARSOON High-Technology Co. Ltd in Changsha. First, the specimens were tested through three-dimensional modelling using the CAD software: two specimens were used for microstructural observations (10 mm × 10 mm × 7 mm) and three for the standard tensile tests. The data model was fed into the CAD software and processed for SLM-based forming. The selected process parameters included a laser power of 240 W, scanning speed 1000 mm s−1, scanning distance 0.1 mm and processing layer thickness 0.03 mm. A multilayer and multichannel Z-direction growth orientation was adopted, with stainless steel as a substrate and nitrogen the protection gas. The SLM samples #1 and #2 were soaked in hydrochloric acid for 8 h after grinding and polishing. The corrosion of specimens was studied based on Reference [11] and the microstructure observed using Zeiss metallographic and JSM-6380LA scanning electron microscopes. Phase analysis was performed using a RIGAKU Ultima IV X-ray diffractometer.
The densities of the specimens were measured on the basis of the drainage method in accordance with Archimedes principle using a Sartorius densitometer. The relative density was determined from the ratio of the measured density to the theoretical density of the Co–Cr alloy. The standard tensile specimens were polished by abrasive paper of 200, 800, 1500 meshes, respectively. An Instron 3369 electronic universal testing machine was used to measure the tensile strength (σ), yield strength (σ0.2) and elongation (δ) of the specimens at room temperature with a tensile speed of 1 mm min−1. After the tensile tests, the tensile fracture morphology was observed using scanning electron microscopy. The hardness values of the Co–Cr alloy specimens were measured in the X, Y and Z directions using a Wilson RB2000 Rockwell Hardness Tester. The test load was 1471 N, with a loading time of 10 s. At least five test points were taken for each specimen and the results with larger deviations were removed to calculate the mean values.
Microstructure
Figure 2 shows the microstructure of the XY surface and Z profile of the Co–Cr alloy specimens in Groups #1 and #2; note that only one group is displayed due to there being no significant difference in morphology between the two groups. There is a dense connection between the melting channels and layers, along with a good forming effect. Figure 2(a) shows that the boundaries of the melting channels are approximately parallel, with no obvious defects such as cracks or porosity. The separation between the adjacent melting channels is approximately 100 μm, corresponding to the scan spacing of the SLM-based moulding process. Figure 2(b) shows that the melting channels on the Z profile are semi-arc shaped, which is determined by the superposition of the growth mode of the multilayer and the multichannel Z-direction during the SLM process. However, the scanning path between the layers changed at a specific angle during the forming process, leading to declining uniformity in the semi-arc melting channels on the Z profile.
Microstructure of the (a) XY surface and (b) Z profile of the Co–Cr alloy.
Figure 3 shows a SEM image of the microstructure of the alloy melting channels in Groups #1 and #2; note again that only one group is displayed due to there being no significant difference in microstructure between the two groups. Figure 3(b) represents the enlarged structure of the area in the black box shown in Figure 3(a). It indicates that there are mainly cellular and elongated columnar crystals in the melting channels. The crystals partly run through adjacent two-layer melting channels. During the process of SLM, the time of action of the laser on the powder is short as the Co–Cr alloy undergoes the metallurgical processes of rapid melting and solidification [12]. Small and uniform cellular crystals are formed. However, layer-by-layer changes to the laser scanning path result in complex and changeable heat-transfer processes. The solidified metal is heated and re-melted. Uneven dissipation of heat and the preferred growth of crystals lead to many columnar crystals with multi-directional growth.
Microstructure (SEM) revealing the Co–Cr alloy melting path.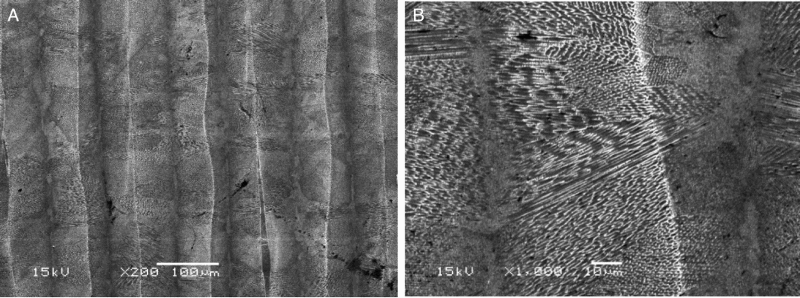
Figure 4 shows the X-ray diffraction pattern of the Co–Cr alloy in Groups #1 and #2. There are two allotropes, γ and ε, of the Co-based alloy. The phase transition from ε to γ occurs above 430°C, whereas that from γ to ε occurs below 390°C. This transition occurs via a non-diffusion martensitic transformation mechanism [13]. Alloying elements such as W, Cr and Mo change the stability of the isomers; thus, the actual phase transition temperature of the Co–Cr alloy is considerably different from that of monoplasmatic Co [14]. During the cooling process, the chemical driving force and speed of the γ to ε transition is low. Therefore, the matrix is essentially composed of γ-Co at room temperature [15]. Meanwhile, the formed area is continuously subjected to heat conduction, which facilitates the appearance of the ε-Co phase [16]. Based on Figure 4, the crystal structures are observed to be virtually identical for the two groups of the Co–Cr alloy, and mainly include the γ (fcc structure) and ε (hcp) phases. The crystal structure also contains a small amount of carbides and oxides of Co, Cr, Mo and W. The oxygen content is slightly higher in the alloy of Group #2. Oxygen mainly accumulates at the melting channel boundary to form a white border that becomes pits after corrosion [16,17].
X-ray diffraction pattern of the #1 and #2 Co–Cr alloys.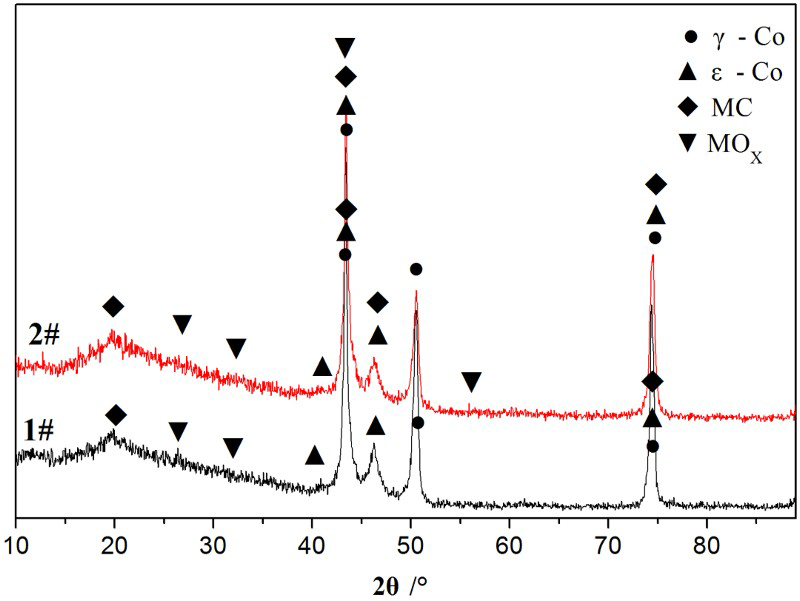
However, SEM and XRD analyses of the two Co–Cr alloys did not reveal the distribution of excess oxygen in the #2 alloy. Based on the experimental results of the two alloys and references [18] and [19], under conditions of complicated heat conduction, the excess oxygen may be distributed throughout the crystal by the fine chromium oxide or interstitial solid solution, thereby affecting the mechanical properties of the workpiece.
Figure 5 shows the density values for the alloys of Groups #1 and #2, with the mean being 8.69 and 8.68 g cm−3, respectively. The corresponding standard deviation values are 0.0115 and 0.0209. From Equation (1) [20], the theoretical density of the alloy was calculated to be 8.8084 g cm−3. Thus, the density of the alloys satisfies the pharmaceutical industry standard YY0621-2008, which states that the alloy density should not deviate more than 0.5 g cm−3 from the theoretical density. Calculating the ratio of the actual to theoretical densities, the relative densities of the alloys of the two groups are obtained as 98.68% and 98.56%, respectively. The density of the #2 alloy is 0.12% lower than that of the #1 alloy. Therefore, the higher oxygen content has no significant effect on the SLM forming performance in terms of relative density. The high density suggests that the material can have good mechanical properties, as has been reported in the section on mechanical performance.
Density plots of the #1 and #2 Co–Cr alloys.
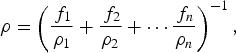
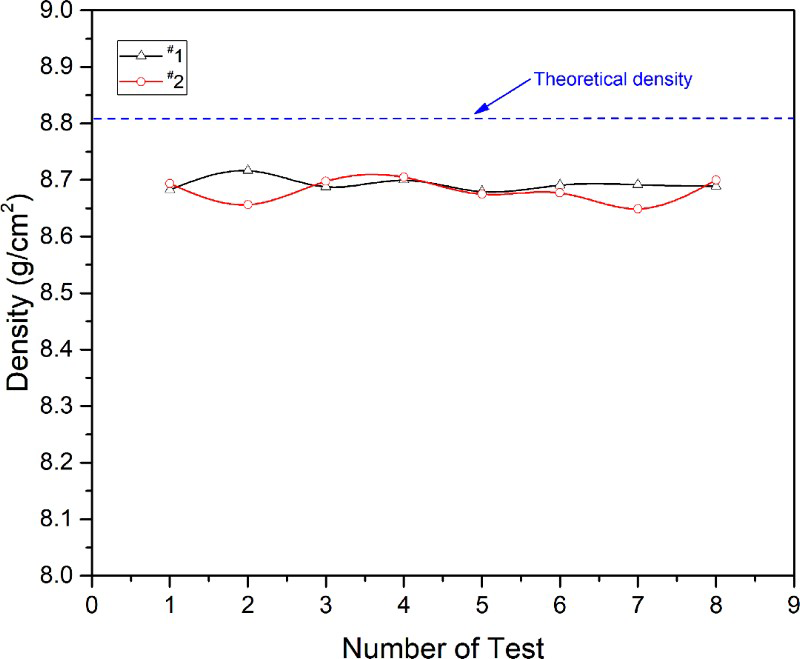
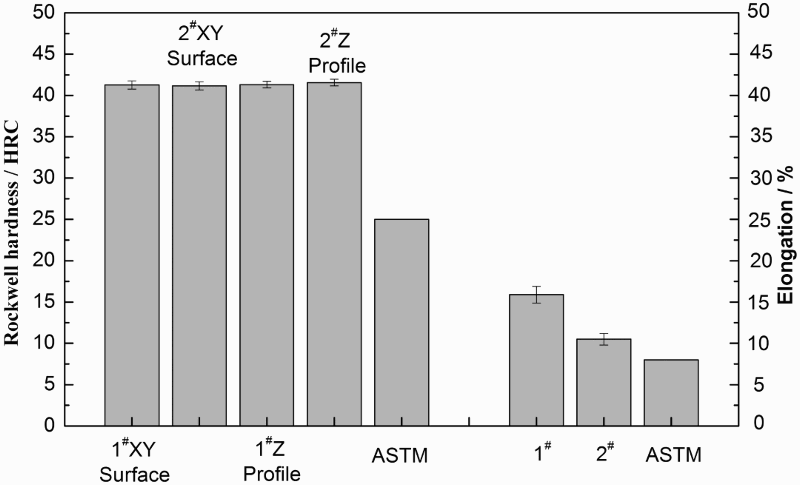
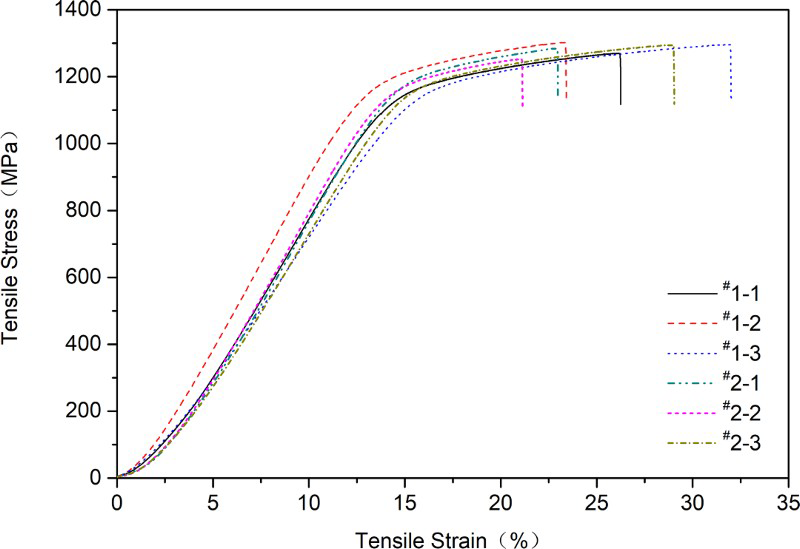
Figure 6 shows a comparison of the tensile and yield strengths for the Co–Cr alloy SLM specimens of the two groups and a traditional casting and milling specimen. Figure 7 shows the results for Rockwell hardness and elongation for the #1 and #2 alloys and comparing them with ASTM F75. Figure 8 displays the stress–strain curves of the #1 and #2 alloys. The three figures together reveal that the tensile and yield strengths of the Co–Cr alloys of the two groups are 1285 ± 15 vs. 1273 ± 20 MPa (#1) and 1165 ± 5 vs. 1190 ± 15 MPa (#2), respectively. It can be observed that while the tensile strength was virtually unchanged, the yield strength of the #2 alloy slightly increased. This is related to either the pinning effect of oxygen or the blocking effect of fine chromia on dislocations of the interstitial atoms. The pinning of dislocations by Cottrell atmosphere or second-phase particles will be overcome by increasing external load. This results in an increase in the yield strength. But due to a limited solubility of interstitial atoms and a small amount of second-phase particles, the strengthening effect is not significant [21]. There is no significant difference in Rockwell hardness between the Group #1 and #2 alloys on the XY surface and Z profile. The mean hardness values are 41.33 and 41.37 HRC, respectively, indicating an insignificant difference. However, the tensile strength, yield strength and hardness of the Group #1 and #2 alloys are significantly higher than those of the traditional cast and milled Co–Cr alloy or ASTM standard.
Comparison of the tensile and yield strengths of #1, #2 and the traditional cast and milled Co–Cr alloys. Comparison of the tensile and yield strengths of #1, #2 and ASTM Co–Cr alloys. Stress–strain curves of the #1 and #2 Co–Cr alloys.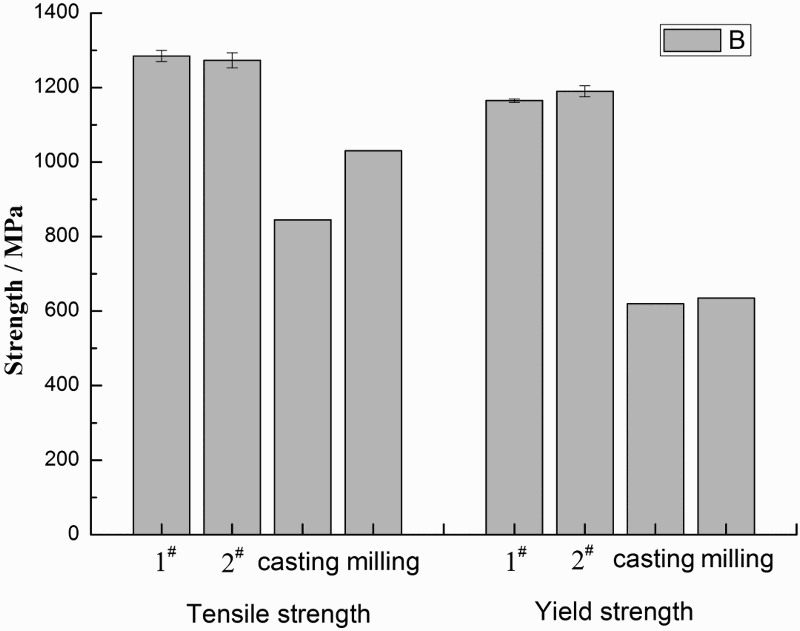
On one hand, the rapid solidification of the metal during SLM forming generates strengthening effects attributable to the refined crystalline structure; on the other hand, the martensitic phase transformation leads to the existence of more lattice defects and microscopic segregations [17], thus enhancing the strength and hardness of the alloys.
Figure 7 shows that the elongation rates of the Group #1 and #2 alloys are 15.88 ± 2.0% and 10.5 ± 1.5%, respectively. In Group #2, the high oxygen content in the alloys significantly reduces their elongations. The reasons are described as follows: A small amount of oxide particles that accumulate in the crystal boundary form a continuous or discontinuous reticular structure that creates a stress concentration in that region when subjected to an external force. This region acts as a weak interface in the alloy; fracture and crack propagation channels can potentially originate from this region of the alloy, leading to poor plasticity and persistence [22]. On the other hand, excess interstitial atoms or fine chromium oxide distributed in an intragranular fashion during grain deformation impede dislocation movement, and plastic deformation cannot easily occur. All these phenomena together result in an increased tendency of the alloy to yield in a brittle manner [23].
Figure 9 shows the fracture morphology of the Co–Cr alloy SLM specimens of Groups #1 and #2. The tensile fracture of the #1 alloy has many cleavage surfaces and tear edges, without any obvious dimples; it is indicative of a type of quasi-cleavage fracture. In addition, river-like fringes can be seen in each transgranular fracture grain, and these cleavage surface ladders can determine the location of the crack source along the fracture direction. The #2 alloy also revealed a type of quasi-cleavage fracture. There are obvious cleavage steps, river patterns and morphological features corresponding to the ductile torn edges [24]. The high oxygen content of the #2 alloy results in grain boundary defects. The intragranular defects impede dislocation movement, cause their entanglement and concentrate the stress, which ultimately results in cracks. Once these cracks form, they extend to a larger area, showing characteristics of partial cleavage [23] and leading to lower fracture elongations at the macro level. Although the elongation rate of the #2 Co–Cr alloy is low, it is still obviously higher than that of the ASTM F75 medical standard, which states that the elongation of dental restoration materials should not be less than 8% [25]. Therefore, the #2 Co–Cr alloy can be used in manufacturing personalised dental restoration products using SLM.
Tensile fracture morphology of the (a) #1 and (b) #2 Co–Cr alloys.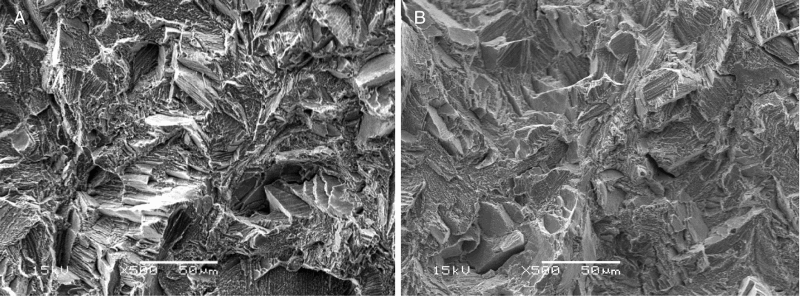
Oxygen content is an important indicator in the three-dimensional printing of Co–Cr alloy powders and has a significant influence on the relative densities and mechanical properties of worked products. In this study, the oxygen content in the Co–Cr alloy was pre-arranged to exceed 500 ppm, the general requirement of the industry. Under identical SLM forming conditions, the properties of the #2 Co–Cr alloy with an oxygen content of 616 ppm was compared to those of the #1 Co–Cr alloy having an oxygen content of 184 ppm. There was no significant difference in the formation of the melting channel, microstructure morphology or crystal types of the SLM specimens. No significant difference was observed in the relative density, tensile strength and Rockwell hardness; the yield strength slightly increased. The elongation was significantly reduced, but still met the requirements of the ASTM F75 medical standard. The Co–Cr alloy with a high oxygen content could also be used for clinical applications. Therefore, these alloy powders with high oxygen contents have a medical value that improves their economic benefits.
The results of this research provide support for using SLM to manufacture dental restoration products based on the Co–Cr alloy with a high oxygen content. However, after the denture, dental crown or fixed bridgework has been implanted in the mouth, the product will experience a complex physical and chemical environment over a long time period. As a result, the creep properties and fatigue behaviour of the material need to be further studied in order to provide an adequate technical reference for clinical applications.
Footnotes
Disclosure statement
No potential conflict of interest was reported by the authors.
Notes on contributors
Songhao Hu, Assistant Engineer, Henan Huanghe Whirlwind Co., Ltd., Xuchang, People's Republic of China.