
Abstract
A novel 15Cr13MoY alloy steel powder used for direct laser deposition was produced using the vacuum induction gas atomisation (VIGA) method. The characteristics and laser printability of the 15Cr13MoY alloy steel powder were studied. The flowability of the spherical powder was 18.98 s/50 g−1, and apparent density was 4.75 g cm−3. The fabricated 15Cr13MoY alloy steel samples composed of ferrite and bainite were prepared by DLD. The phases primarily consisted of a Fe–Cr–Mn solid solution M7C3, M23C6 and Y2O3. At the optimum laser power of 2200W, the average microhardness of 15Cr13MoY alloy steel sample was 350 HV, the tensile strength was 897 MPa, the yield strength was 704 MPa, the average elongation was 14.5%, and the product of strength and plasticity was 13.0 GPa%. The 15Cr13MoY alloy steel powder produced usingthe VIGA method had good powder characteristics and printability for fabricating the components produced by DLD.
Keywords
Introduction
As a kind of laser additive manufacturing (LAM) technology, direct laser deposition (DLD) has been widely used in aerospace, automobile, biomedicine, metal components and mould fabrication applications [1,2]. This technology has outstanding technological advantages in the high-efficiency, high-precision manufacturing and remanufacturing of large-sized or complex-shaped components [3,4]. DLD technology has the advantages of simple operation, high efficiency and flexibility, and is suitable for manufacturing components of large size and complex structures [5]. As one of the new manufacturing technology developed vigorously, DLD technology has a broader application prospects for components fabrication and finished products design. As shown in Figure 1, typical key parts such as rolls, brake discs and shafts have the characteristics of hard surface and ductile core. That is, the surface working layer of the part satisfies the hardness of 700–900 HV, the tensile strength reaches 1100 MPa or more, the core hardness reaches 300–400 HV, and the average elongation needs to reach 10%. The application of these parts requires the support of alloy steel materials with strong toughness[6]. At present, the more mature steel materials for DLD research are mainly low-carbon steel such as 12CrNi2[7], 24CrNiMo[8], and 316[9]. New alloy steel powders capable of satisfying the DLD method for manufacturing the above core components need further studies. DLD technology has unique advantages in the manufacture of large-sized and complex structural components, such as rolling mill components, brake discs, and shaft parts, however, the limitations of materials and the lack of alloy powders hinder its further development [10–12]. In particular, the lack of dedicated high-performance alloy steel powder has greatly restricted the industrial development of DLD technology. In the DLD process, the interaction between laser and alloy powder is complex, and the characteristics of the alloy powder directly affect the formability and microstructure of the formed sample [13].
Schematic cross-section of a shaft with a hard surface and a core tough feature.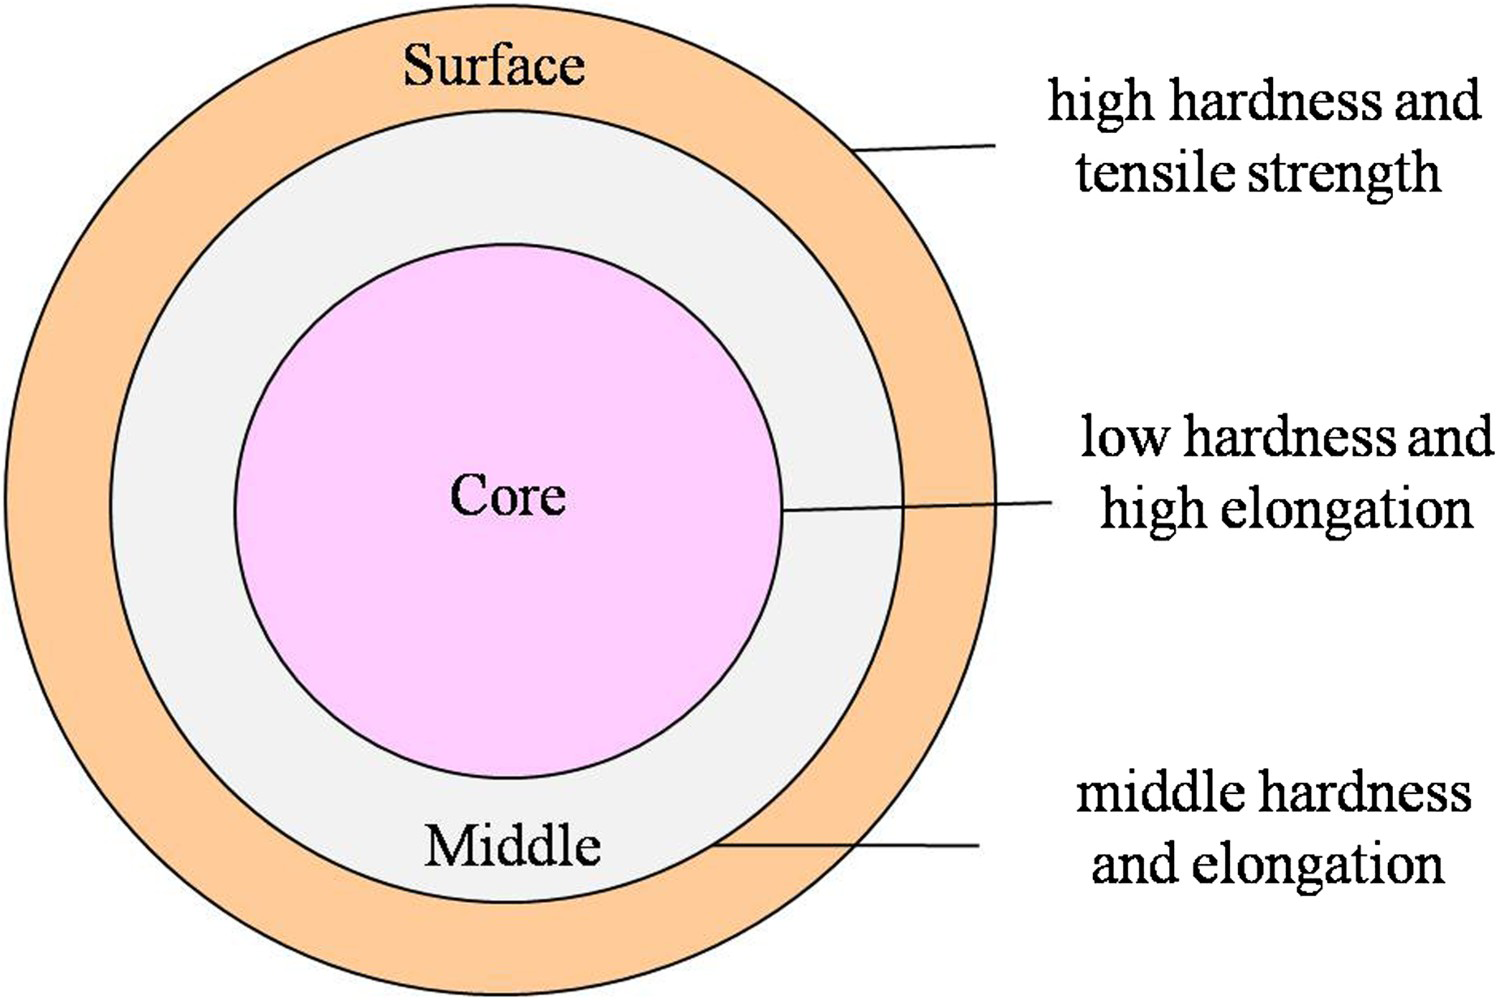
Until now, the widely used alloy steel powder is mainly made using gas-atomisation technology, which can meet the requirements of powder metallurgy and thermal spraying [14,15]. However, the characteristics of alloy steel powder used for DLD forming, including powder morphology, particle size distribution, apparent density, flowability, hollow sphere rate, etc. need to be strictly required to ensure the quality and the performance of fabricating components [16,17]. Hausnerova B et al. stated that the alloy powder with better powder characteristics was beneficial to the mechanical properties of the DLD forming material [18]. Ding P used Al0.5CoCrCuFeNi, Al0.5CoCrCuFeNiSi1.2 and Al0.5CoCrCuFeNiSi2.0 high-entropy alloy powders produced by gas atomisation to meet the requirements of LAM technology [19]. Yang M. found that powder particles with large particle size showed eutectic microstructures, meanwhil, the nucleation supercooling degree was increased when the particle size was less than 38 μm and eutectic microstructure transformed into dendritic microstructure in powder particles [20].
In this paper, spherical 15Cr13MoY alloy steel powder suitable for DLD technology was produced using vacuum induction gas atomisation (VIGA) method. The morphology, particle size distribution, flowability, apparent density, hollow ball rate, and printability of the atomised powder were studied. As a new type of Cr–Mo alloy steel, 15Cr13MoY has the characteristics of low carbon content and high Cr content. It is expected to obtain 15Cr13MoY alloy steel samples with good DLD formability and good toughness, which can be used as the core material of the rolls, brake discs and shaft parts to meet the assembly requirements. This study provides references for the preparation and printability of high-performance alloy steel powder for DLD technology.
Raw materials and pre-treatment
Chemical compositions of the raw material and powder (Wt-%).
Chemical compositions of the raw material and powder (Wt-%).
The cleaned alloy steel ingot was placed in the crucible. When the vacuum of the melting chamber, atomisation chamber and powder collecting device were below 2.0 × 10⁻² Pa, argon gas was charged then as a shielding gas. The purity of argon gas used in the experiments was ≥99.99%. The temperature of the alloy steel ingot was monitored in real time; meanwhil, the vacuum melting power was increased slowly. After the alloy ingot was completely melted, we continued heating to keep the molten steel in the superheat of 100–150°C for 5 min, after which the catheter and atomising gas valve were simultaneously opened for the atomisation of the molten steel. The total pressure of the argon gas valve was 12 MPa. Then the 15Cr13MoY alloy steel powder was collected by a two-stage cyclone collector. After the powder cooled sufficiently, the powder was put into the vacuum box for vacuum encapsulation.
DLD process
Q235 steel was used as the substrate material with a size of 100 mm × 100 mm × 10 mm. The surface of Q235 steel was polished and then cleaned with ethanol. The 15Cr13MoY powder with the range of 54–180 μm was selected as depositing power in DLD technology processing with FL-Dlight02-3000W semiconductor laser. The DLD process was shown in Figure 2(a). The sizes of the as-deposited 15Cr13MoY alloy samples were about 60 mm × 30 mm × 10 mm. We adopted the control variable method to prepare 15Cr13MoY alloy steel samples under different laser power conditions, the process parameters were listed in Table 2. The optimal process parameters were selected by comparing the microstructure and properties of these samples. In addition, further analysis and exploration were carried out on the samples prepared under the optimal parameters.
(a) Schematic diagram of the DLD 15Cr13MoY alloy steel process, (b) the tensile test samples and geometry of DLD processed samples for tensile test. Process parameters of laser direct deposition.
The 15Cr13MoY alloy steel powder prepared using the VIGA method was graded with a screening device. The oxygen content was analysed by a TCH-600 nitrogen oxygen analyser and hydrogen gas analyser. The content of carbon was determined by a CS-8820 high-frequency infrared carbon and sulphur measuring instrument. The content of alloying elements was determined by an 8300DV inductively coupled plasma optical emission spectrometer. The particle size distribution was measured by a Horiba A-920 laser particle size analyser. The flowability and apparent density of the atomised powder were measured using a HYL-102 Hall flowmeter according to the ASTM B213-13 standard [21] and ASTM B212-13 standard [22]. The surface morphology of the powder and the microstructure of the deposited sample were characterised by a Shimadzu-SSX-550 scanning electron microscope (SEM). The section morphology of the powder and deposited sample were observed by OLMPUS-GX71 metallographic microscope, and the phase compositions of the powder and deposited sample were analysed by a SmartLab-9000 X-ray diffractometer (XRD). A TECNAIG220 transmission electron microscope (TEM) was used to observe the morphology and microstructure of the deposited sample. Microhardness of the deposited sample was measured using a WILSON-WOLPER-450SVD microhardness tester with load of 2 N for 10 s. The geometry of DLD processed samples for tensile testing is drawn in Figure 2(b). The tensile test was conducted using an AG-X100kN electronic universal material tester at room temperature with velocity of 5 mm min−1.
Experimental results and discussion
Characteristics of 15Cr13MoY alloy powder
. Powder morphology
Figure 3 shows the SEM images of the 15Cr13MoY alloy powder produced usingthe VIGA method at different magnifications, which helps to clearly observe the morphology and distribution of the atomised powder. It could be seen that the particle size distribution of these spherical powder particles of different sizes was beneficial for the powder flow and enabled uniform build rates and enhanced adhesion between the single layers during the DLD process [23]. The process of atomising liquid metal into powder could be described as: the molten metal liquid rod began to film first and the surface tension of argon started to undulate as the metal was melting, and necking occurred, when the liquid film was completely cracked, metal droplets were formed. Finally, the droplet was solidified and finally became a powder particle [24]. As shown in Figure 3(c), only a small number of powder particles were poorly formed, satellites and adhesions due to the inevitable differences in the size of metal droplets during atomisation process. The cooling rate of the larger metal droplets was slower, causing them to collide and adhered with other powder particles or droplets during the solidification, which resulted in the formation of the satellite and the adherent powder particles, as shown in Figure 3(c). The pits on the surface of the powder were mainly formed by collision of powder particles under high pressure at the initial stage of atomisation.
SEM images of the atomised powder produced by VIGA. (a) × 200, (b) × 500, (c) × 1000, (d) × 1500.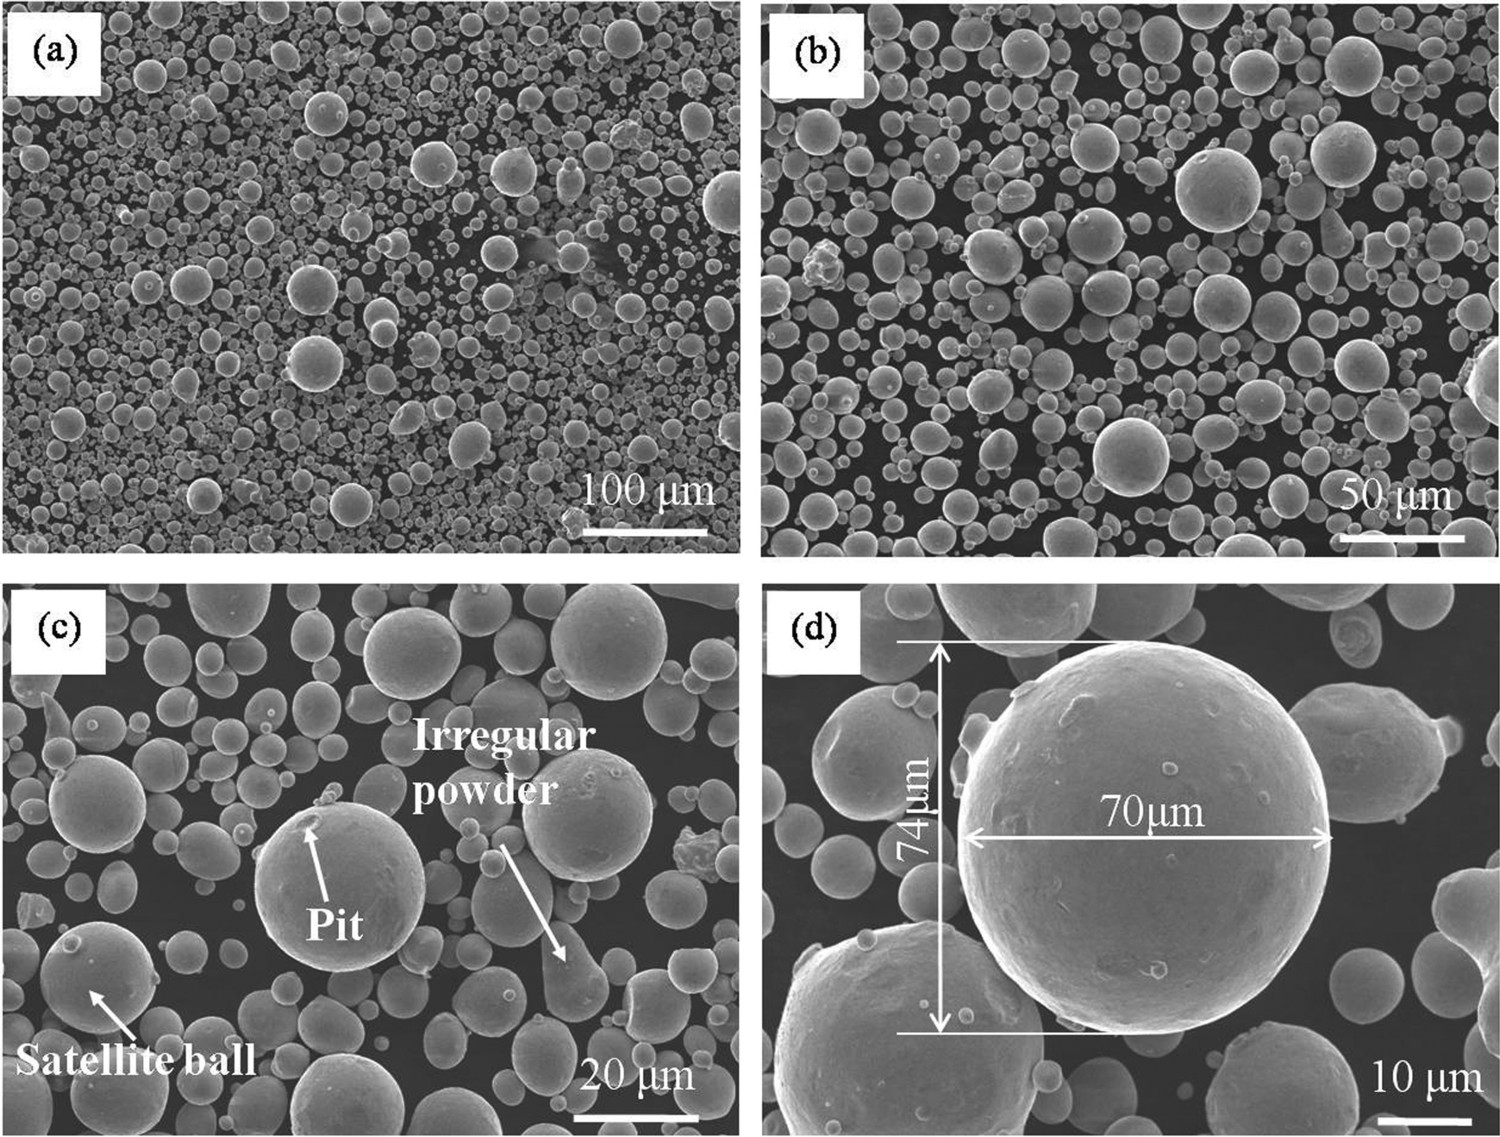
The surface morphologies of metal particle can significantly influence the fusion behaviour and metallurgy bonding between neighbouring particles. The irregular morphologies of droplets would directly hinder the remelting during deposition manufacturing, leading to the formations of hole-defects in the printed samples [25–27]. The sphericity rate of the powder can be obtained by measuring and statistically calculating the particle size of the powder. The long axis and the short axis length of the powder particle were measured, and the particle having a ratio of ≤1.2 could be regarded as a spherical shape. The ratio of the length to the minor axis of the powder particle as shown in Figure 3(d) was 1.05, which indicates a spherical particle. The sizes of 50 powder particles were randomly measured and calculated. The proportion of spherical particles in these particles was counted, and the sphericity rate of the 15Cr13MoY powder was 98%.
Figure 4 depicts the surface morphology and EDS results of the atomised powder particle. In the process of powder vaporisation, the low-temperature argon caused the droplet to disperse rapidly and begin to solidify. The surface cooling speed of the powder was very fast that the grains formed during solidification could not grow afterwards line, thereby effectively inhibiting dendrite segregation, as shown in Figure 4(a). From the results of composition analysis in Figure 4(b), the composition of the atomised powder particles conform to the nominal composition of the raw metal, which is also consistent with the test results in Table 1.
SEM image and EDS results of the atomised powder particle.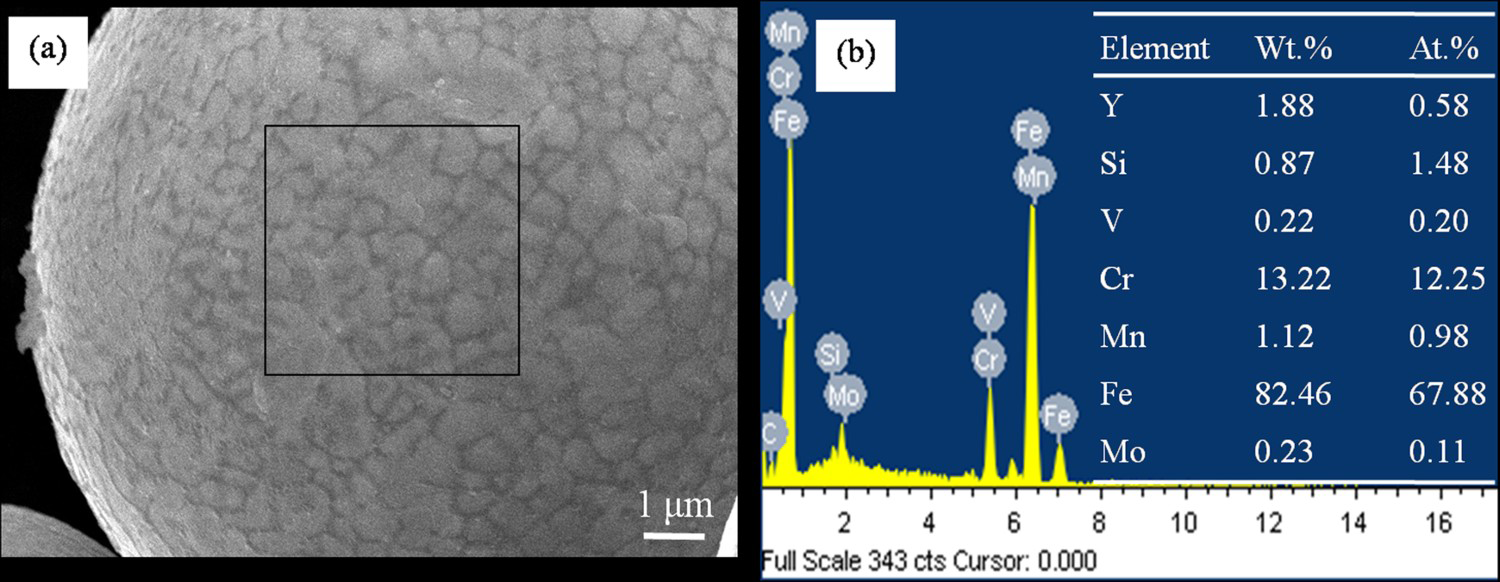
Figure 5 is a metallographic section of 15Cr13MoY alloy powder. The powder was embedded cold and polished using the metallographic preparation method. The hollow sphere rate was calculated via the statistical approach. By observing the hollow spheres in Figure 5(a), the hollow spheres rate was less than 2%. Most of the sections of the powder particles are full and round in regular form while some large-sized powder particles deformed or fell off during the grinding process. The reason for the formation of the hollow sphere is various, Some researchers[28–30] attributed the pore formation to gas entrapment. Under the action of high-pressure argon flow energy, part of the gas is trapped inside the metal droplets during the secondary crushing, thereby forming hollow spherical particles. Chen et al.‘s [31] experimental results show that the argon content of the gas atomised, plasma rotating electrode processed and plasma atomised powders below 150 μm is 0.77 ± 0.06, 0.16 ± 0.06 and 0.70 ± 0.06 μg g−1, while its porosity is 0.20 ± 0.01%, 0.08 ± 0.01% and 0.12 ± 0.01%, respectively. And both argon content and porosity within powders increase with the increase of particle size for each type of powders. The hollow sphere rate of the 15Cr13MoY powder in this experiment was less than 2%, and the effects on the DLD samples were small. Besides the factor of secondary crushing in the process of spraying, gas entrapment between the droplet/droplet interfaces and/or droplet/substrate interfaces was another potential factor. The ambient gas might also be entrapped into particles to form some micro holes when the particles met with other particles or solid surfaces [32].
Metallographic images of the atomised powder. (a) Hollow ball powder, (b) cross-sectional.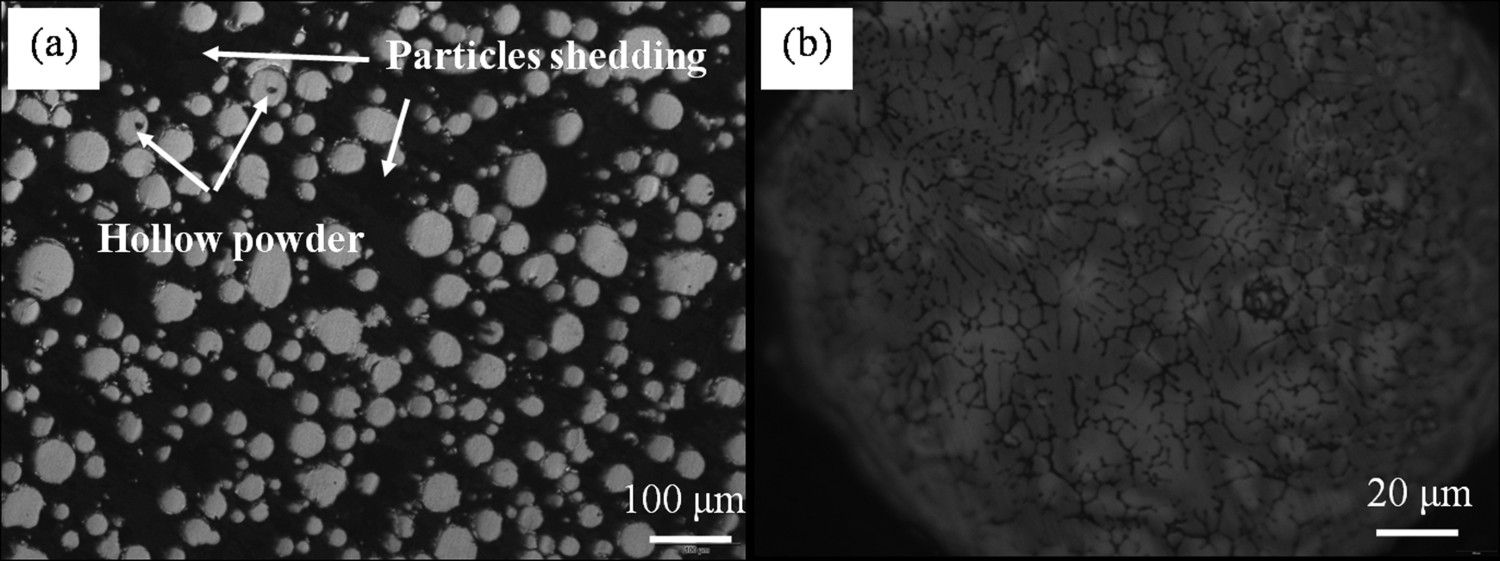
In terms of laser manufacturing and remanufacturing technology, the presence of hollow spheres in the powder tends to form porosity defects in the forming process, so the lower hollow sphericity rate of powder is the basic requirement to ensure high quality and high-performance parts. Unlike the cell crystals exhibited by the small particle size powder, the cooling rate in the large size powder particles was low, which led to accelerated growth of the crystal. As shown in Figure 5(b), the cell crystal front was convex toward the liquid phase and the short secondary dendrites were formed due to the composition undercooling. In addition, the cellular crystals front was more convex toward the liquid phase and the short secondary branches were formed due to the supercooling of the components, thereby forming cell dendrites [33].
Figure 6 shows that the phases of the 15Cr13MoY alloy steel powder were mainly α-Fe, M7C3 M23C6 and Y. The molten alloy droplet was rapidly cooled and solidified into powder particles under the action of low-temperature argon, and finally α-Fe phase was obtained, however, some large particles could not completely cool to room temperature when they were rapidly solidified, so there would be a small amount of carbides. In the process of DLD, the presence of these carbides in the powder would facilitate the formation of carbides in the forming samples and strengthen the material. Y element in the powder could significantly improve the toughness of the deposited material [34].
XRD pattern of the atomised powder.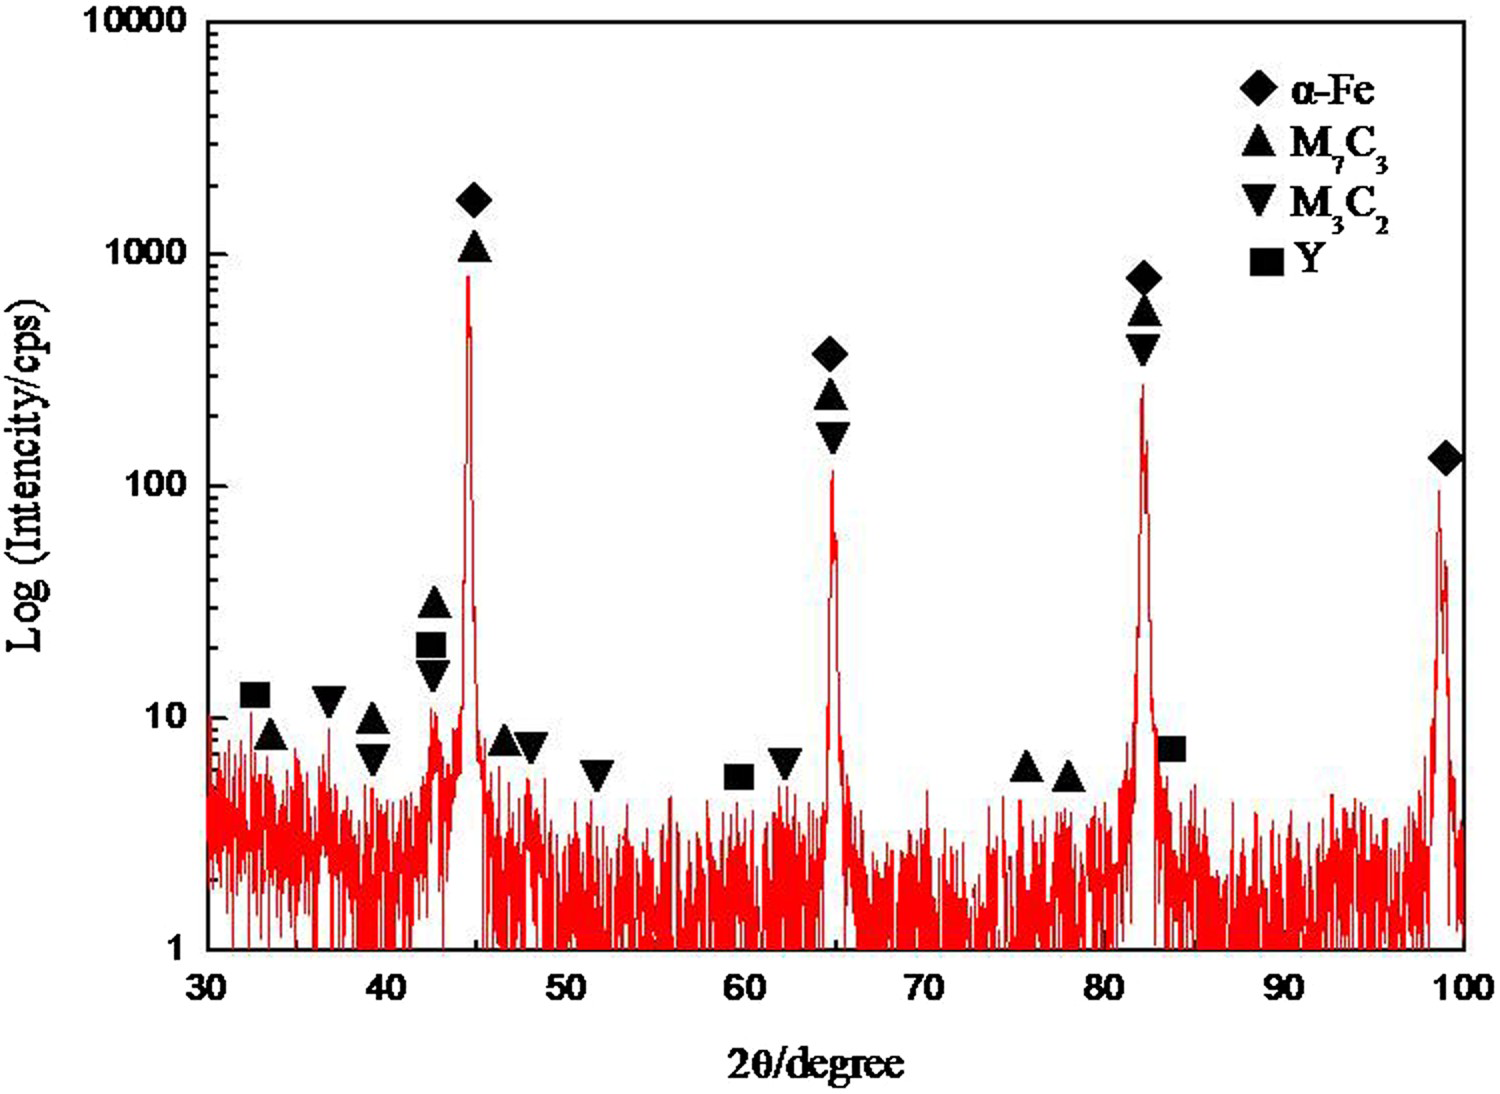
The particle size distribution curve and the cumulative mass distribution of the atomised are shown in Figure 7. The particle size of atomised powder are less than 180 μm and the mean particle size D50 is 76 μm, which meet most requirements of DLD technology for powder particle size. The narrow particle size distribution facilitated the flowability of the atomised powder and ensured the internal microstructure composition uniformity of the laser deposited samples. The effect of dendrite segregation on laser deposition samples in large particle size particles could also be reduced simultaneously.
15Cr13MoY powder particle size distribution.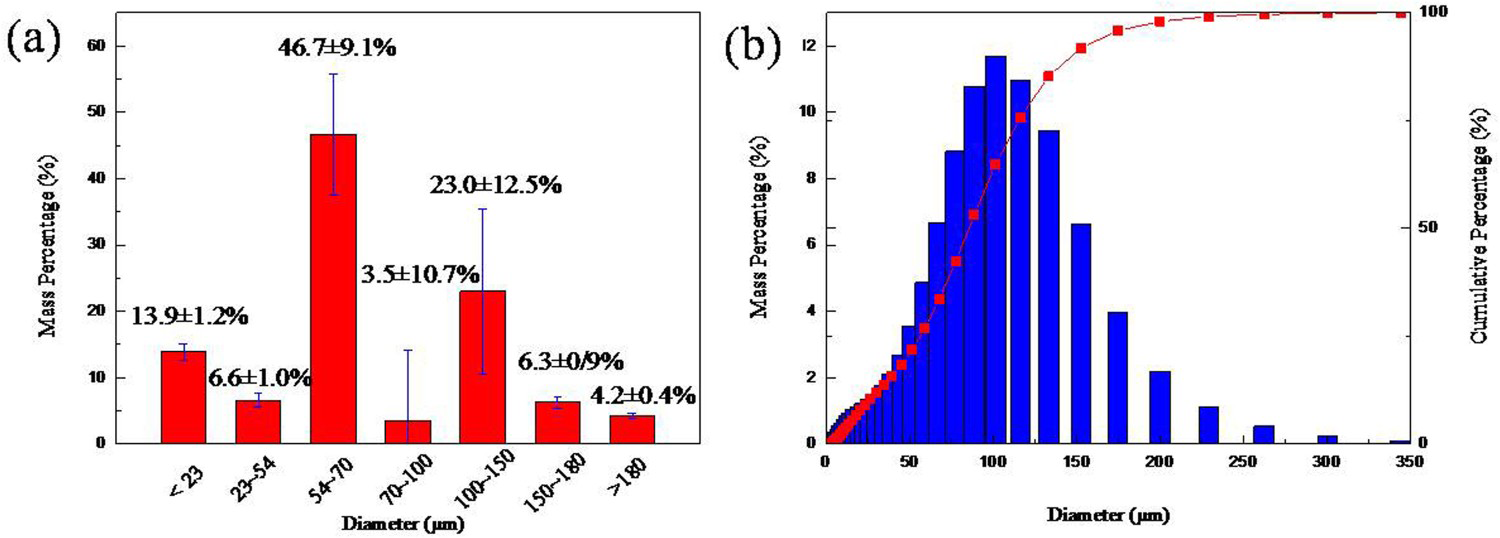
Flowability and apparent density of 15Cr13MoY alloy steel powder.

Microstructure
The phase analysis results of 15Cr13MoY alloy steel by DLD in Figure 8 were Fe–Cr–Mn solid solution, M7C3, M23C6 and Y2O3. Under rapid solidification condition, part of the Cr element was dissolved in the α-Fe to form a solid solution. The remaining Cr element formed M7C3 and M23C6 in the C-rich region which increased the strength of the material as a second-phase particle. Y2O3 was formed by Y in the powder and O in the air during the deposition, which could be dispersed and distributed in the structure to serve as a toughening effect.
XRD pattern of the deposited 15Cr13MoY alloy steel.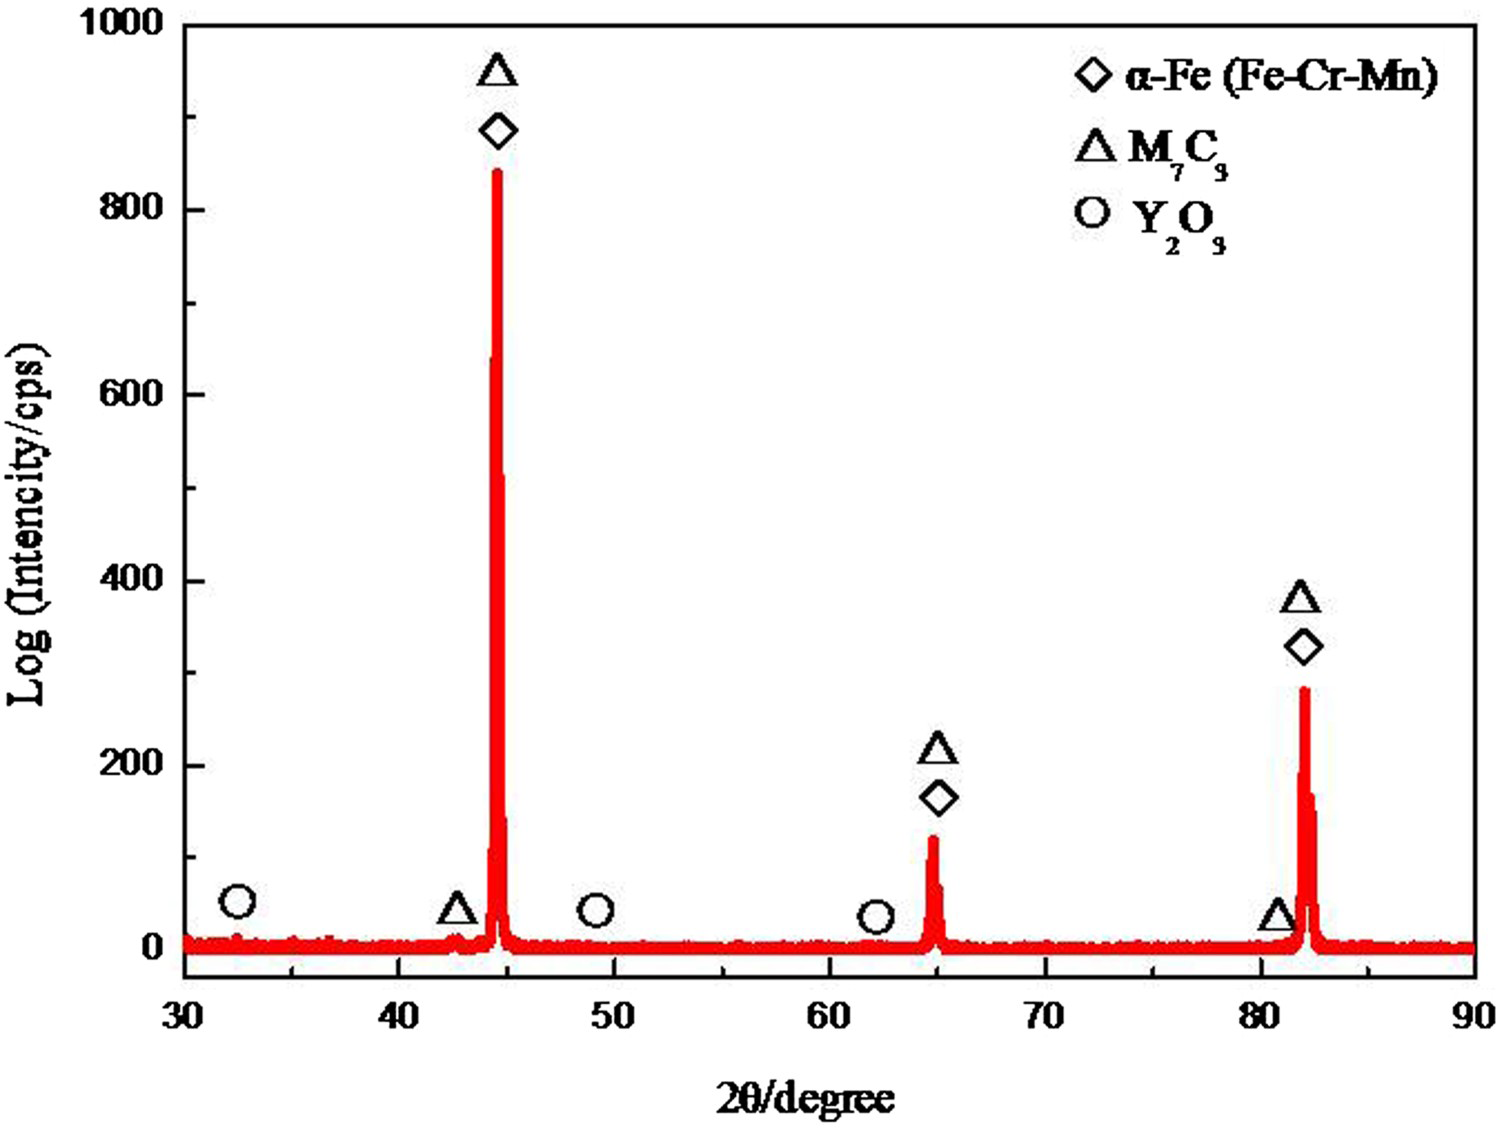
Figure 9 is a metallographic cross-section of DLD 15Cr13MoY alloy steel sample prepared under different laser power. It can be seen from Figure 9(a–c) that 15Cr13MoY powders had good formability under different laser powers. No deformation or cracking occurred during the deposition process and no defects such as inclusions and pores were found. It can be seen from Figure 9(d–f) that 15Cr13MoY alloy steel mainly consisted of bainite and ferrite. Austenite was transformed into bainite and ferrite during solidification [35]. In the dual-phase microstructure, a combination of high strength and excellent ductility can be achieved in the bainite/ferrite composite microstructure, in which the ferrite has a high ductility as a soft phase. The balance between the strength and ductility of the sample depends on the rate and distribution of ferrite and bainite [36]. It was once reported by Guan et al. that bainite described as the second hard phase distributed densely and dispersedly in the soft ferrite matrix, hence effectively blocked the fatigue cracks propagation [37]. The bainite content of the samples prepared by different powers was calculated by Image-J software. As the laser power increased, the proportions of bainite were 59.5, 80.5, and 84.4%, respectively. Under the influence of thermal accumulation effect, the increase of laser power led to a decrease in cooling rate. The sample was in the bainite transformation temperature zone for a long time, and the austenite was liable to transform into bainite. Therefore, the content of bainite increased with the increase of laser power.
Cross-sectional metallographic of DLD 15Cr13MoY alloy steel samples with different power. (a) and (d) 2100 W, (b) and (e) 2200 W, (c) and (f) 2300 W.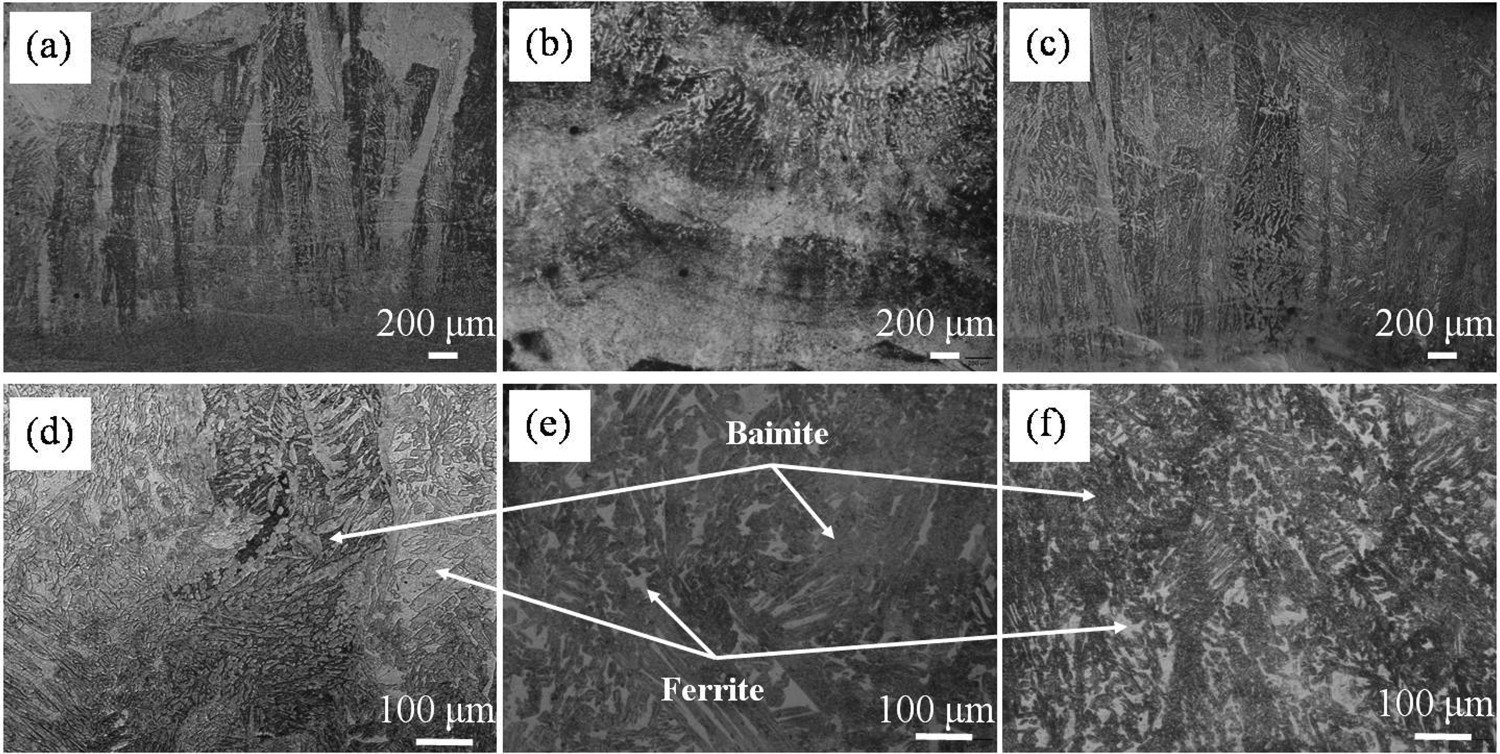
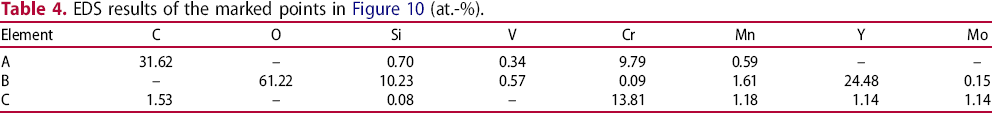
Figure 10 shows the microstructure of DLD 15Cr13MoY alloy steel samples manufactured under different laser power. It is consistent with the observations in Figure 9: as the laser power increased from 2100 to 2200 W, the cooling rate of the deposited layer decreased, and the bainite transformation temperature range increased as the cooling time increased, which promoted the growth of bainite. When the laser power is further increased from 2200 to 2300 W, unlike the lath structure existed inside the bainite in Figure 10(b), the bainite structure in Figure 10(c) was composed of lamellar bainite. This is because the cooling rate and the degree of supercooling ΔT decreased as the laser power increased, and the lamellar bainite transformation temperature was higher than the lath bainite, so the lath bainite transformed to the lamellar bainite. Lath bainite has higher microhardness than lamellar bainite[7]. In Figure 10(b), Y2O3 particles having a size of about 1 μm were dispersedly distributed on bainite and ferrite, and the irregularly shaped particulate matter marked with A was verified to be M7C3 according to the EDS analysis result of Table 4. The dispersion distribution of carbides and Y2O3 enabled the material to have a good strength and toughness match.
SEM images of DLD 15Cr13MoY alloy steel samples with different power. (a) 2100 W, (b) 2200 W, (c) 2300 W. EDS results of the marked points in Figure 10 (at.-%).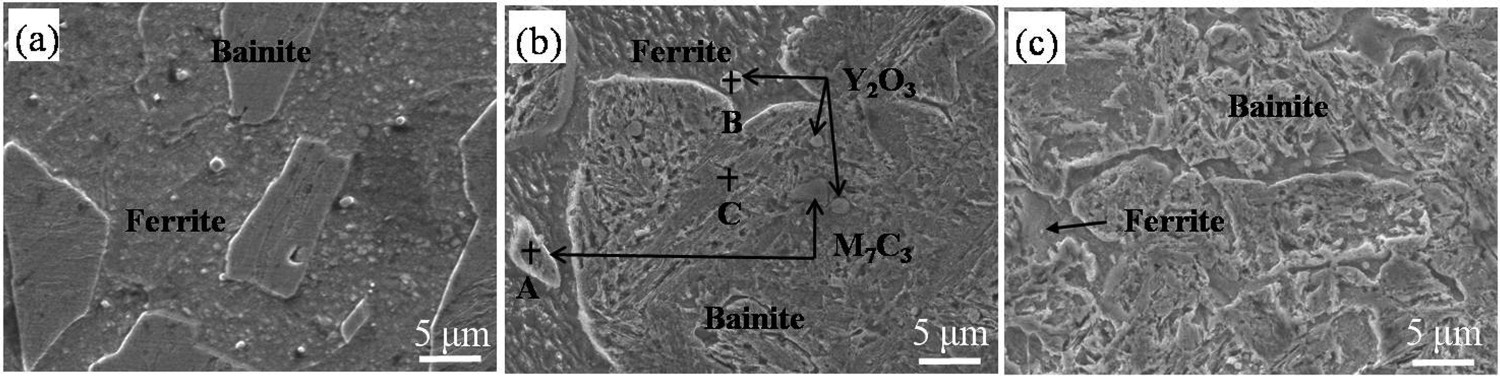
In order to further confirm the internal structure of the deposit sample, TEM observation was performed on the microstructure of the sample prepared with a laser power of 2200 W. As shown in Figure 11(a), there were a large number of entangled dislocations inside the bainite sub-slabs, and they were stopped at the slab boundaries, which played a reinforcement role in avoiding the crack sources formation caused by dislocations. There were many grey particles distributed on the bainite sub-slabs. It can be seen from the enlarged Figure 11(b) that these particles had a size of about 50 nm. Consistently, the diffraction specimens were identified as M23C6 type carbides, some of which were distributed at the boundary, which could hinder the expansion of dislocations. 15Cr13MoY alloy steel has the characteristics of low C content and high Cr content, and it is easy to form Cr23C6 and Cr7C3 with complex lattice [38]. M23C6 had a complicated lattice structure and poor stability, and would change to more stable M7C3 type carbide instead. Table 5 lists the EDS results for labelling particles in Figure 11, and it could be determined that M represents Cr, Fe. Some M7C3 with sizes of 200–300 nm which can be observed in Figure 11(c) and Figure 11(d) were larger in size and tended to fall off. Compared with M23C6, these M7C3 carbides were more prone to cause fractures and defects.
TEM images of DLD 15Cr13MoY alloy steel sample with laser power of 2200W. (a) bainite sub-slabs, (b) M23C6, (c) M7C3, (d) Y2O3. EDS results of the marked points in Figure 11 (at.-%).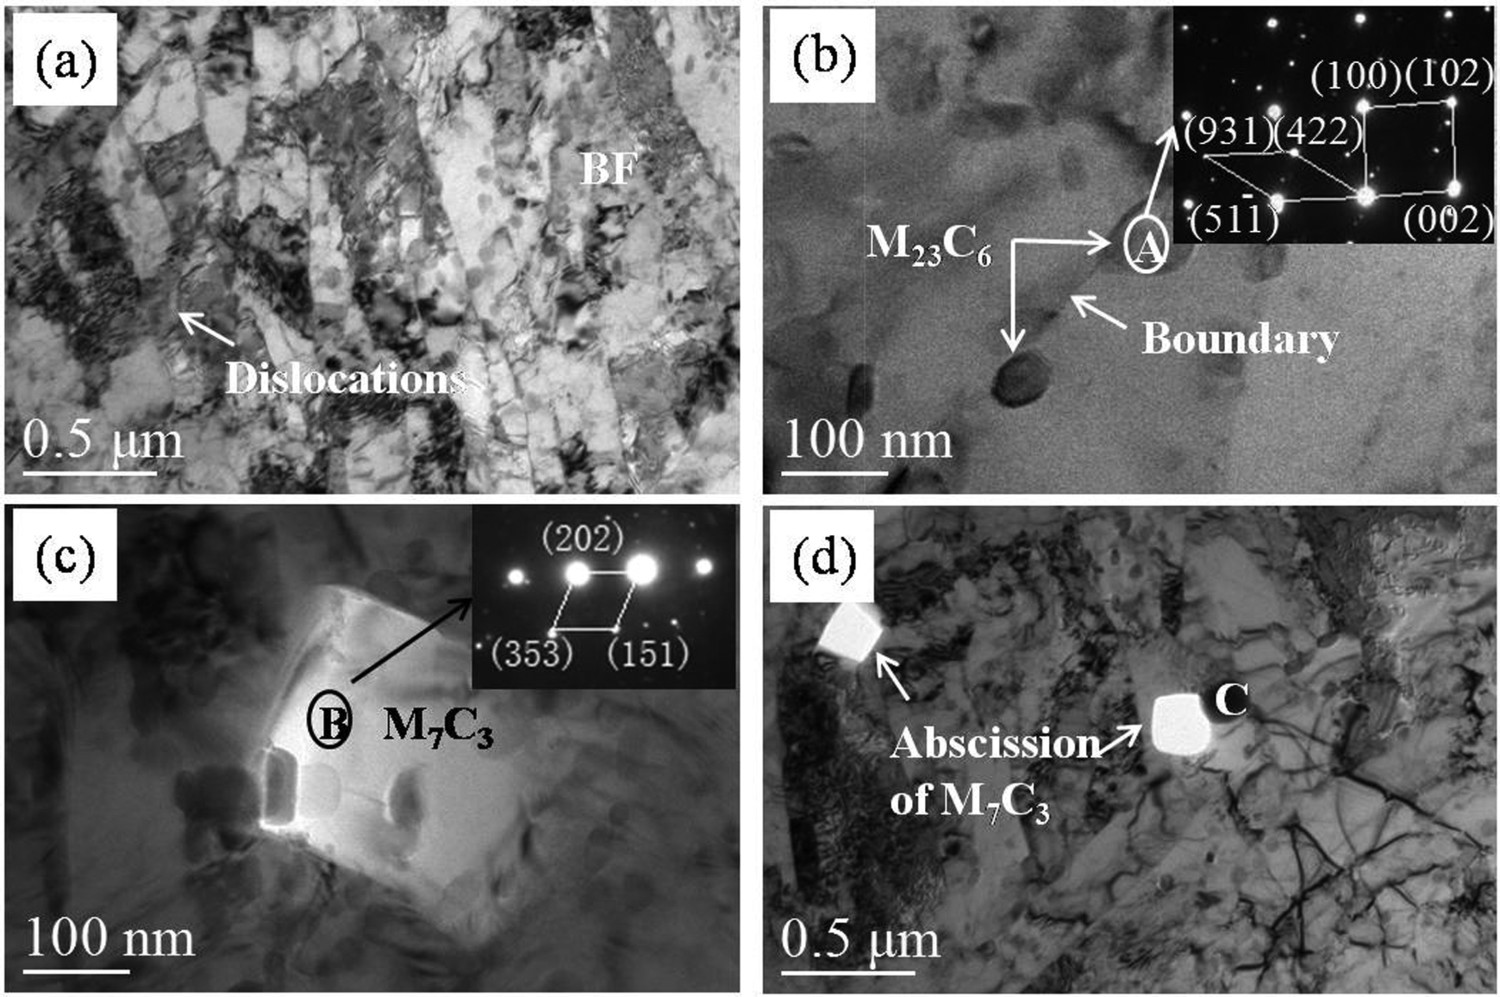
As shown in Figure 12, the microhardness results show that as the laser power increased, the hardness increased first and then decreased. This is closely related to its microstructure. Combined with the results of Figure 9, the increase of laser power augmented the bainite content from 59.5 to 80.5%, which was a critical factor leading to an increase in average microhardness from 304 to 350 HV. When the laser power was further increased to 2300 W, lath bainite was transformed into lamellar bainite. At this time, although the bainite content was up to 84.4%, the average microhardness was reduced to 344 HV. The bainite–ferrite composite microstructure gave the 15Cr6Ni2Y alloy steel samples a good resistance to deformation. In addition, the dispersion of carbides and Y2O3 shown in Figure 8 was advantageous for the sample to maintain good toughness while having certain hardness.
Microhardness curves of DLD 15Cr13MoY alloy steel samples with different laser power.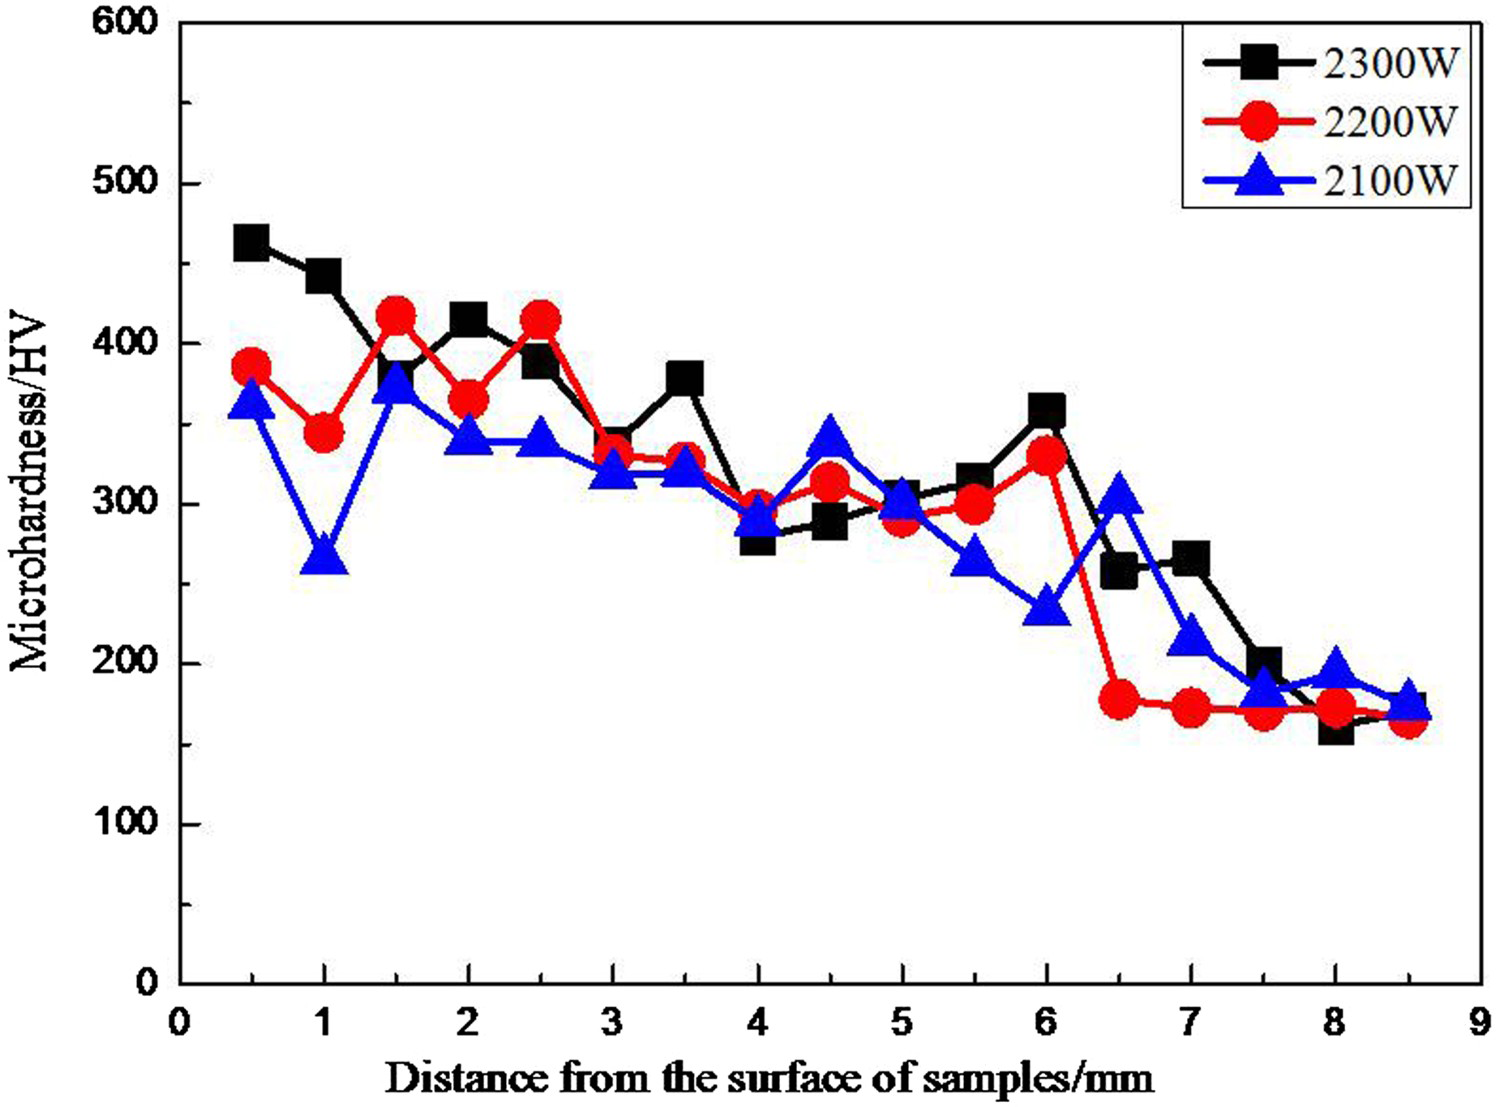
Figure 13 shows the stress – strain curves of DLD 15Cr13MoY alloy steel samples under different laser power. As the laser power increased, the tensile strength and yield strength of the deposited samples increased, and accordingly, the average elongation decreased. In comparison, the 15Cr13MoY sample had the best toughness matching relationship when the laser power was 2200 W. The tensile strength was 897 MPa, the yield strength was 704 MPa, the average elongation was 14.5%, and the product of strength and plasticity was 13.0 GPa%. Compared to the research results of Zhang K [39] et al. about AISI 316L stainless steel and Guo P [40] et al. about 316 stainless steel, this material combines strength and toughness and exhibits good strength and toughness matching.
Stress–strain curves of DLD 15Cr13MoY alloy steel samples with different laser power.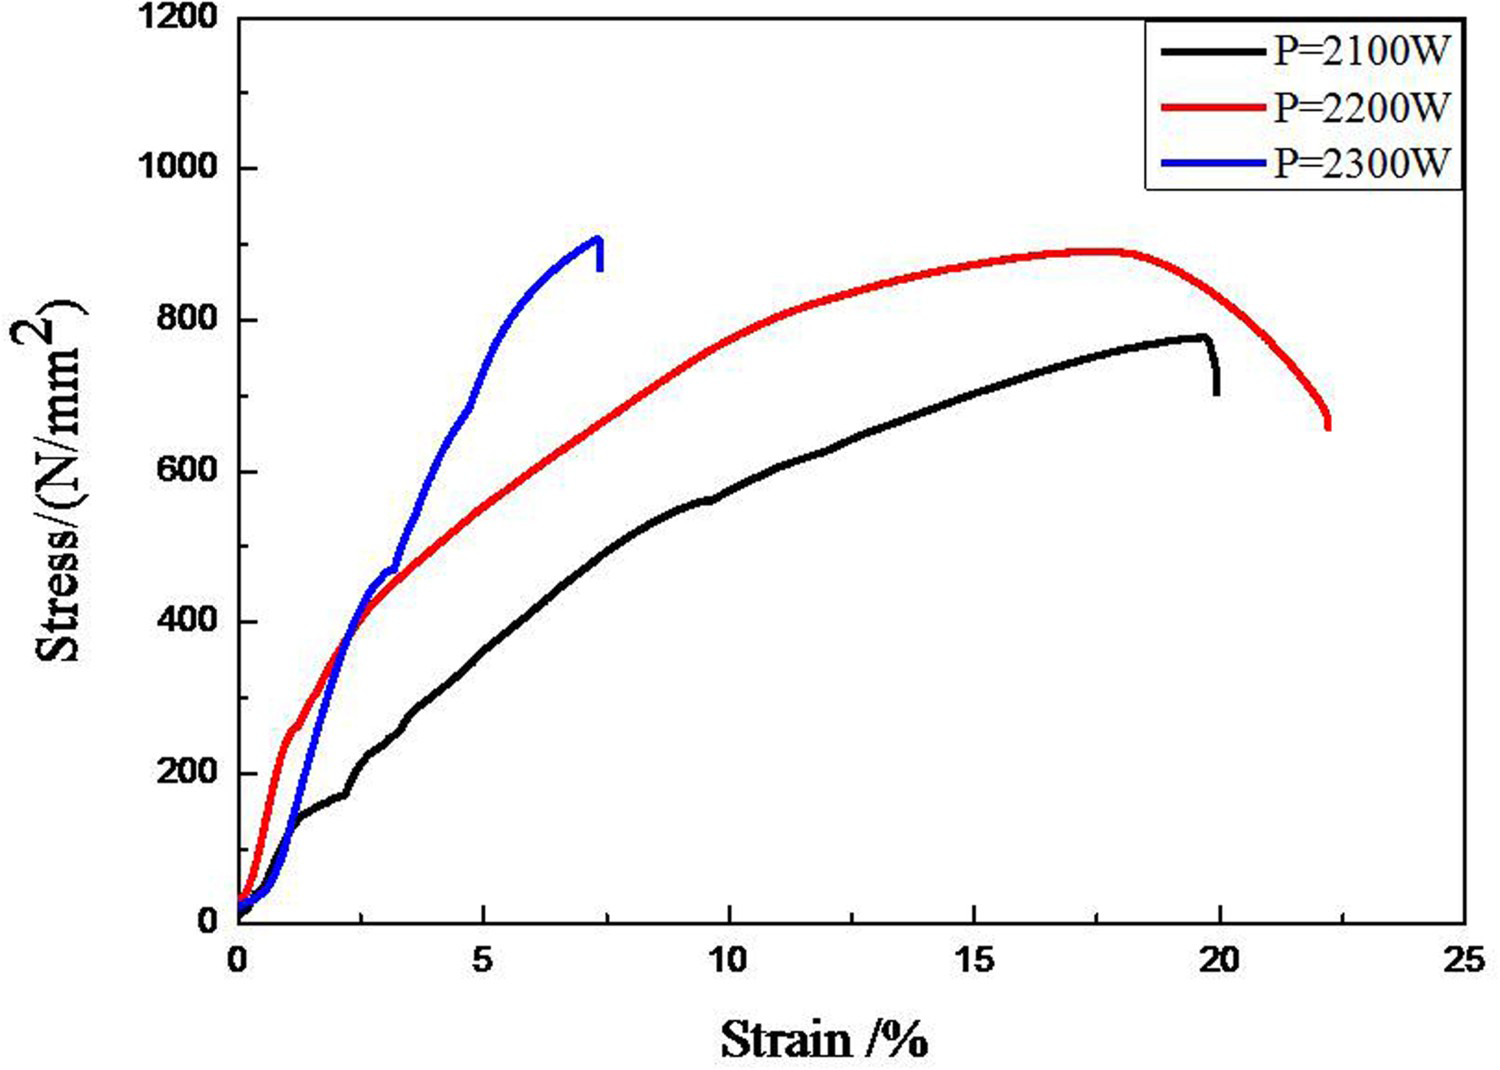
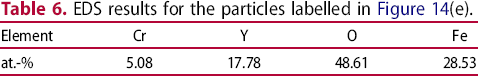
Figure 14 shows the fracture morphologies of the deposited samples. From the fractographic features in Figure 14(a–c), the phenomenon of necking was most obvious when the laser power was 2200 W. As can be seen from Figures 14(d,e), there were a large number of fine and uniform dimples and some tiny tearing edges on the fracture surface, which fully demonstrated that the fracture mechanism was ductile fracture. The river pattern and cleavage plane in Figure 14(f) indicates that it was a brittle fracture due to the difference in microstructure caused by the difference in laser power, which was consistent with the observation of the microscopic morphology of the sample. According to the analysis results of Table 6, the particle labelled in Figure 14(e) was Y2O3. Owing to the presence of Y2O3 particles in the microstructure, the resistance of the material to deformation and dislocation movement could be improved, and the cracks had to bypass Y2O3 when the sample was deformed and cracked, the Y2O3 particles in Figure 12(e) were formed and existed in the dimple after fracture.
Tensile fraction morphology of DLD 15Cr13MoY alloy steel samples with different power. (a) and (d) 2100 W, (b) and (e) 2200 W, (c) and (f) 2300 W. EDS results for the particles labelled in Figure 14(e).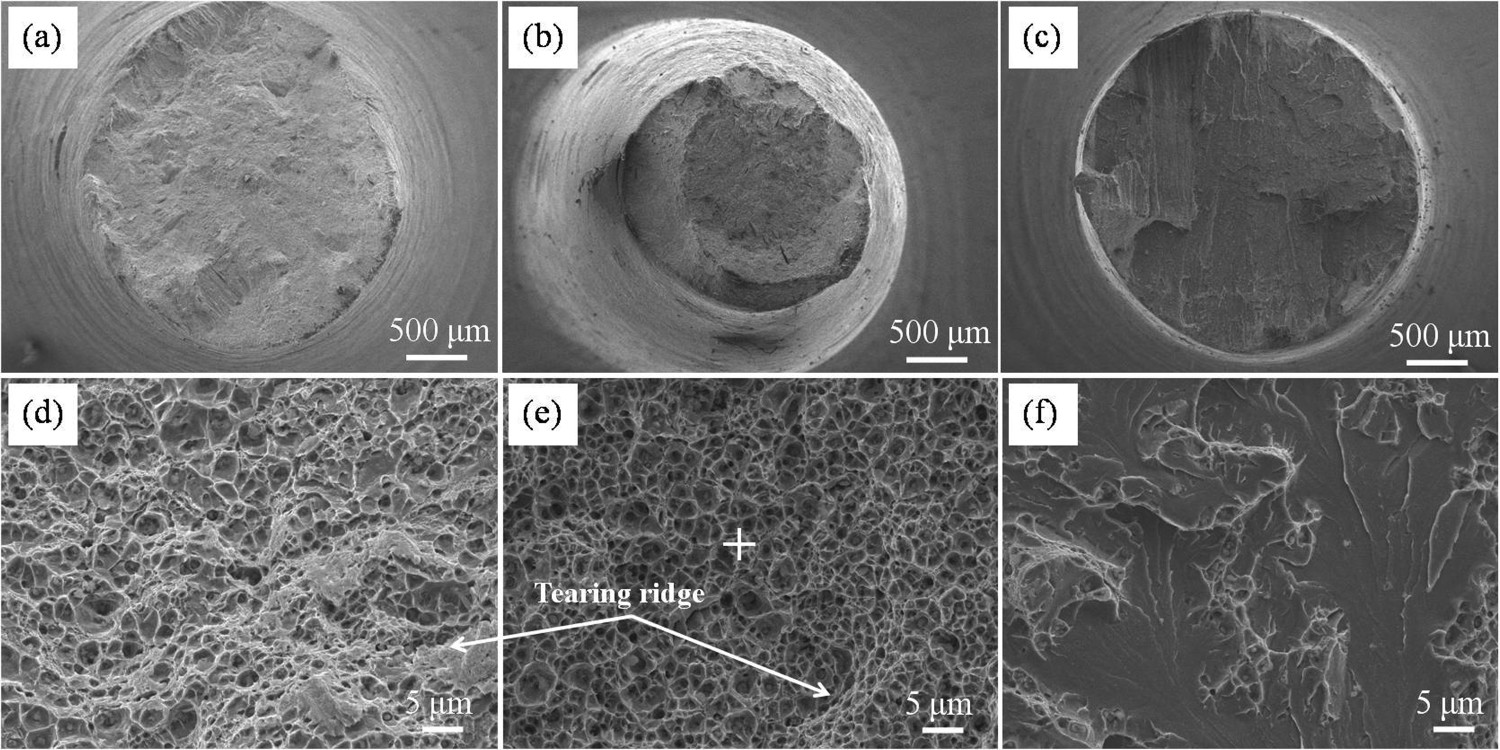
A novel 15Cr13MoY alloy steel powder used for DLD was produced using the VIGA method. The elements contents (wt-%) of the powder was C: 0.16%, Cr: 13.0%, Si: 0.58%, Mn: 1.03%, Mo: 0.48%, V: 0.61%, Y: 1.95%, O: 0.022% and the balance was Fe. Atomised alloy steel powder had favourable laser printability. 15Cr13MoY alloy steel sample prepared by DLD consisted of a Fe–Cr–Mn solid solution, M7C3, M23C6 and Y2O3. Carbides and rare earth oxides were dispersed in ferrite and bainite structure, which enhanced and toughened the material. At the optimum laser power of 2200 W, the favourable mechanical properties of combined strength and toughness of fabricated 15Cr13MoY alloy steel exhibit good strength and toughness matching. The average hardness was 350 HV, tensile strength was 897 MPa, yield strength was 704 MPa, average elongation was 14.5%, meanwhile, the product of strength and plasticity was 13.0 GPa%. This 15Cr13MoY alloy steel powder and the deposited material have application value in the field of laser manufacturing and remanufacturing.
Footnotes
Disclosure statement
No potential conflict of interest was reported by the authors.
Notes on contributors