
Abstract
Copper as a material with a high electrical and thermal conductivity awakes large interest for many applications in industry, e.g. thermal management of electronic components. Powder-based manufacturing techniques (e.g. Selective Laser Melting, Binder Jetting, Fused Filament Fabrication and Metal Injection Molding) enable the complex shaping of metals. Especially the methods without melting processes like Binder Jetting, Fused Filament Fabrication and Metal Injection Molding have a great potential for complex Cu structures. These techniques built up a powder-based green body and require a subsequent sintering step to reach a high density with maximum properties. This work reports the development of the heat conductivity during pressure-less sintering of Cu powder green bodies. The experimental results are compared to analytical models and a numerical simulation and show the limits of the reachable heat conductivity depending on the remaining porosity and the impurity concentration.
Introduction
Additive manufacturing (AM) processes are of great interest for manufacturing complex metallic components due to the high degree of design freedom and the high flexibility of the manufacturing processes [1,2]. AM offers promising opportunities for complex metallic components in several industrial fields like aerospace, automotive or medical industry [3–5]. Cu as a material with outstanding conductivity properties plays an important role in electronic devices. It is used for the production of high-performance cooling devices in electronics with flow-optimised complex cooling structures to increase the driving range of electric vehicles [6] and is therefore particularly of interest for AM.
AM methods like Selective Laser Melting (SLM), Binder Jetting (BJ) and Fused Filament Fabrication (FFF), but also the already established Metal Injection Molding (MIM), are powder-based manufacturing methods. SLM as the most established AM technique requires strong laser settings in the case of copper due to its high heat conductivity and high reflectivity [7]. Therefore, with the widely spread infrared laser beam (wavelength about 1000 nm), no sufficient quality can be reached and the promising short-wave laser (e.g. green laser, wavelength about 500 nm) is still under development and commercially not yet available [8–10]. Alternatively, the usage of Cu-based alloys simplifies the SLM processes, however at the cost of a reduced heat conductivity [11,12]. Sintering-based methods like BJ, FFF and MIM do not struggle with high beam requirements and show a great potential for the manufacturing of complex Cu structures because of the beam-less manufacturing of green bodies and a separate thermal post-treatment for densification. Furthermore, the green body fabrication at a constant and low temperature prevents a thermally induced strain caused by the large thermal gradient during the local melting, which is one of the disadvantages of beam-based techniques. In the case of sintering-based techniques, the thermal post-treatment is crucial for the achievement of good physical properties. The reduction of the free surface as the driving force for the sintering process triggers the densification, i.e. shrinkage by removing porosity. However, the elimination of pores is a complex mechanism and reaching full density is often not achieved during pressure-less sintering. Thus, sintering-based manufacturing techniques have to deal with a remaining porosity, which has an influence on the physical properties like strength, electrical and heat conductivity. For example, the first published results of Cu parts produced with BJ technique performed by Bai [13] show a maximum sintering density of 85.5%. Therefore, the great potential of sintering-based AM methods is accompanied by limited physical properties due to remaining porosity and impurities and is one of the main challenges in research of these techniques.
The present work investigates the influence of porosity and impurities on the heat conductivity of pressure-less sintered Cu powder green bodies. Existing analytical are models adapted to the experimental results to show the theoretical limit of the heat conductivity by full elimination of the porosity with a given powder contamination of impurities and foreign particles. These results are adaptable to all powder- and sintering-based fabrication techniques, dealing with remaining porosity, to evaluate the maximum reachable heat conductivity.
Materials and methods
Materials
All samples described in this work were prepared using commercially available Cu powder that is used for processes like MIM, BJ and FFF. The used gas atomised powder classified as oxygen-free high conducting (OFHC) copper and has a spherical morphology (d90 = 21.1 µm, d50 = 11.7 µm, d10 = 5.7 µm). Figure 1 shows the measured particles size distribution (see Figure 1(a)) and the morphology of the used Cu powder (see Figure 1(b)). A low-molecular oxygenated carboxylic acid was used as a dispersant for the preparation of Cu powder suspensions (see [14]).
Powder characteristics of the gas atomised Cu powder used for the green body manufacturing in this work. (a) The measured particles size distribution with a d90 of 21.1 µm. (b) The spherical powder morphology by SEM investigation.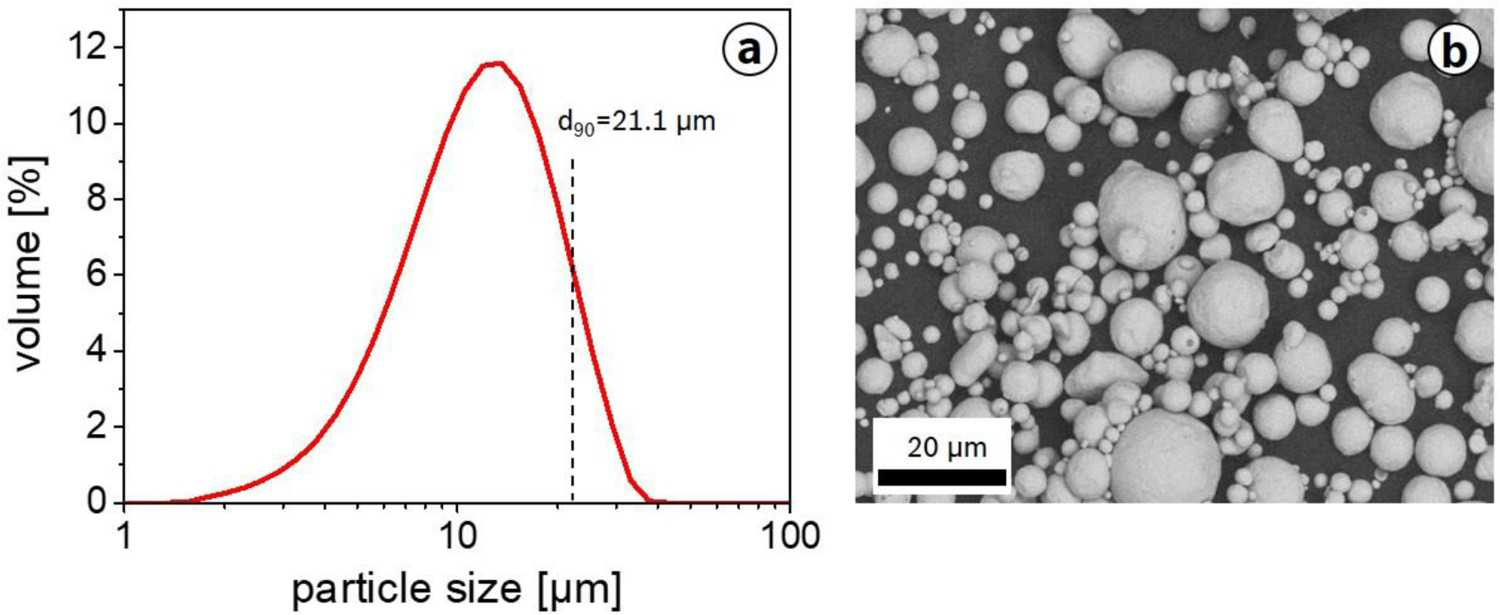
To gain experimental data concerning density and heat conductivity of sintered Cu powder green bodies that are transferable to all sintering-based manufacturing techniques, a suspension-based green body fabrication route with a low organic content was chosen. For more details on the suspension route with the control mechanisms of the green density and the influence of the green density on the sintering density, the reader is referred to [14]. After the homogenisation of the Cu powder suspension consisting of 56 vol.-% powder, water as the suspension medium and a slight amount of dispersant, the suspension was filled into silicon moulds and dried afterwards in air at 80 °C (LQT 6050, Heraeus, Germany). After demoulding of the dry green body, the green density was determined by the geometric dimensions of the cylindrical sample. For the sintering experiments, green bodies with densities in the range of 65–73% were used.
Manufacturing of Cu powder green bodies
The pressure-less sintering process of the Cu powder green bodies were carried out in a sintering furnace (FSW 230/400-1500-Mo/BL/PS, FCT Anlagenbau GmbH, Germany) with controllable gas flows of N2, H2 and Ar. In this work, all samples were sintered in reducing H2 atmosphere at ambient pressure and in a temperature range between 500 and 1075 °C. To gain a full sintering curve of Cu and to investigate intermediate sintering states, the sintering process is interrupted at different sintering times by retracting the sample holder from the hot zone. With this procedure, high cooling rates of nearly 100 K/min within the first minutes of cooling were reached. Thus, the current sintering progress was stopped and the partially sintered samples were characterised. High sintering densities were achieved by conventional sintering for several hours at a maximum temperature of 1075 °C. An improved two-step sintering process [14] with temperature plateaus at 900 and 1075 °C were used to reach maximum sintering densities up to 98.8%. By using conventional metallographic preparation techniques, the pore size, the pore size distribution, the pore–grain boundary interaction and the grain size were measured.
Experimental determination of porosity, heat conductivity and elemental impurities
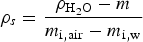
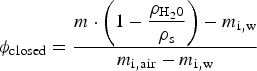
All sintering density values were determined by Archimedes’ principle (LA310S, Sartorius AG, Germany) and previous water infiltration in a vacuum (LYOVAC GT 2, Leybold-Heraeus, Germany). In the case of open porosity, the sintering density
 was calculated by measuring the green body mass before
 and after water infiltration in air
 as well as the mass of the infiltrated green body in water

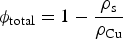
The ratio of the total
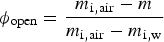
 , open
 and closed porosity
 is calculated by the following equations and by taking the theoretical density of Cu
 (8.92 g/cm³) into account
For cooling applications, a maximum heat flow between the heat source and the heat sink is aspired. To achieve this, materials with a high heat conductivity are required. The temperature-dependent heat conductivity
 is a material constant and is described by the following equation
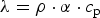
The heat conductivity is a product of the thermal diffusivity
 and the heat capacity
 . Both values are experimentally accessible. For the measurement of the thermal diffusivity, the laser flash method was used, where a defined light pulse of a flash lamp hits one of the planar surfaces of the sample and induces an energy pulse into the sample. At the other side of a sample, a detector measures the postponed temperature signal, which depends on the thickness of the sample
 and the thermal diffusivity

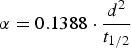
With t1/2 being the time to reach the half of the maximum temperature. For the laser flash measurement, cylindrical samples with a diameter of 25.4 mm and a thickness of 4 mm were used. For a sufficient coupling of the energy pulse, the polished sample surfaces were coated with a black carbon spray. All measurements were carried out at 25 °C. In this work, all experimental values of the heat conductivity are calculated by Equation (6) with experimentally determined densities by Archimedes’ method and experimentally measured values of the thermal diffusivity by the described laser flash method. For the heat capacity of copper at 25 °C, a value of 0.3840 kJ/(kgK) was used, which was measured by differential calorimetry and is in good agreement with literature values. For the elemental analysis of metals, the inductively coupled plasma emission spectroscopy (ICP-AES) was used (iCAP 6300 ICP Spectrometer, Thermo Scientific, USA) after the samples were mechanically crushed and dissolved by acid. The resolution limit of the used technique is 5 mg/kg and the relative measuring error is about ±5%. The results were evaluated by the software Qtegra.
The oxygen concentration in the sintered sample and in the powder was determined by the carrier gas hot extraction method (ONH 836, Leco, USA).
Analytical and numerical approach
The influence of the porosity in functional materials was theoretically and empirically investigated and is published for many materials [15–17]. Besides numerical simulations based on finite element methods, several analytic models were developed to describe the influence of second phases, like pores or precipitations, on physical properties like the electric conductivity of a material. First models published by Maxwell reach back to the nineteenth century. In his fundamental work ‘A treatise on electricity and magnetism’ [17] published in 1873, he described the influence of small spheres with a different resistivity than the matrix material on the total resistivity. In the literature, this model was adapted to several other physical properties. By replacing the resistivity by the heat conductivity, the following equation is reached
 being the heat conductivity of the matrix material,
 the heat conductivity of the second phase and
 the ratio of the second phase.
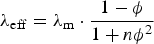
 is the resulting effective heat conductivity of the heterogeneous material. Aivazov and Domashnev [15] investigated the electrical and heat conductivity of hot-pressed TiNi0.9 depending on the porosity. They describe the effective heat conductivity by the following empirically derived equation
The experimental data can be fitted empirically by the factor
 , which Aivazov et al. found to be
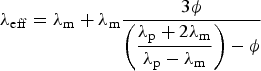
 for TiNi0.9. Mayr et al. [16] developed a model for the heat conductivity of porous materials considering the pore morphology. The authors added a geometry factor
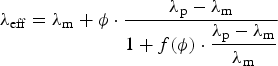
 to include second phase geometry characteristics. According to Mayr et al., the effective heat conductivity depending on the total porosity, the pore geometry and the conductivities of the pores and the matrix is described by the following equation
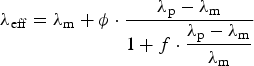
Figure 2 shows the plots of the analytic models of Aivazov, Mayr and Maxwell and the results of the heat conductivity simulations that are described below. In this graph, Maxwell's model shows the strongest influence of the porosity on the effective heat conductivity. At a total porosity of 30%, the heat conductivity is reduced to 25% of the conductivity of the fully dense matrix. Transferring Maxwell's model to Cu, a heat conductivity of about 100 W/mK at a porosity of 30% can be expected. Mayr's model that considers the shape of the pores shows the smallest influence of the porosity in the case of a geometry factor of f = 0, which corresponds to spherical pores. According to this model, a porosity of 30% causes a reduction of heat conductivity of about 120 W/mK to an effective conductivity of 280 W/mK, which is 70% of the theoretical value of Cu. With increasing geometry factor, the dependence on the porosity is also increasing, which shows the dashed curve in Figure 2 with
Influence of the porosity on the effective heat conductivity of a porous matrix material, calculated by various analytic models and a numeric simulation. . The model of Aivazov is located in between the two other models and is characterised by a relatively small negative slope in the area of a low porosity like the upper limit of Mayr's model with the minimum geometry factor of
 . However, with increasing porosity, the heat conductivity predicted by Aivazov's model decreases much faster and runs parallel to Mayr's model with
 .
.
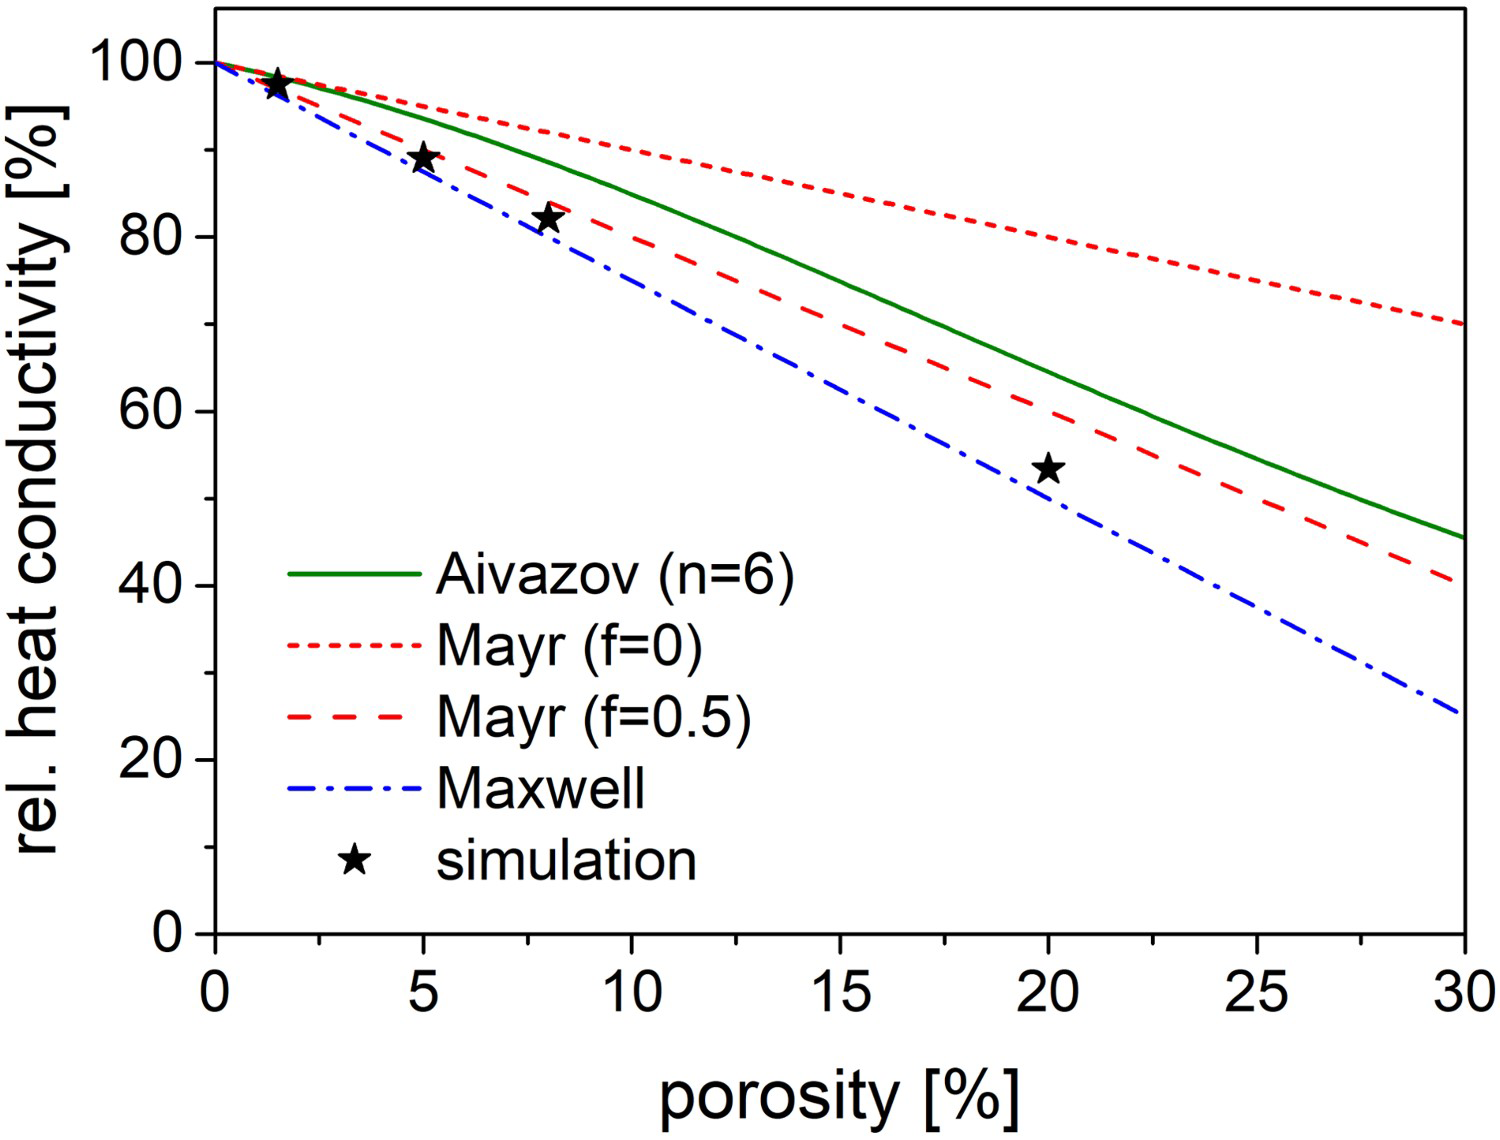
To investigate realistic microstructures, numerical simulations with the simulation tool GeoDict (Math2Market GmbH, Germany) were performed. GeoDict solves the stationary heat equation with periodic boundary conditions. Hereby, the investigated volume is segmented in small solid cubes (voxels) with given isotropic physical properties like, for example, the heat conductivity. Jumps of the coefficients in the heat equation describe the interfaces between two voxels with different properties [18]. The GrainGeo module is used to create realistic microstructures and the ConductoDict module to calculate the effective isotropic heat conductivity. Figure 3 displays microstructures created by GeoDict. A cubic box volume with the dimension of 30 × 30 × 30 µm³ is randomly filled with solid spherical particles with a diameter in the range of 2–20 µm, based on the used particle size distribution. The whole volume is segmented in cubes (voxels) with an edge length of 0.1 µm. The simulated sintering process of the randomly packed spheres with an initial packing density of 70% is interrupted at different densities and the effective heat conductivity is calculated. For the heat conductivity of the pores, a value of 0.260 W/mK was assumed, which corresponds to the conductivity of air. Figure 2 shows the simulated effective heat conductivities of porous Cu. All simulation results are very close to the values predicted by Maxwell's model, but for all investigated porosities slightly above. For porosities smaller than 5%, the simulated heat conductivity is very close to all values predicted by the analytical models.
Artificially created microstructures (box size 30 × 30 × 30 µm³) of sintering Cu particles with an initial packing density of 70% (see picture on the left) by the simulation tool GeoDict. The spheres are particles with properties of Cu material that sinter to a dense matrix.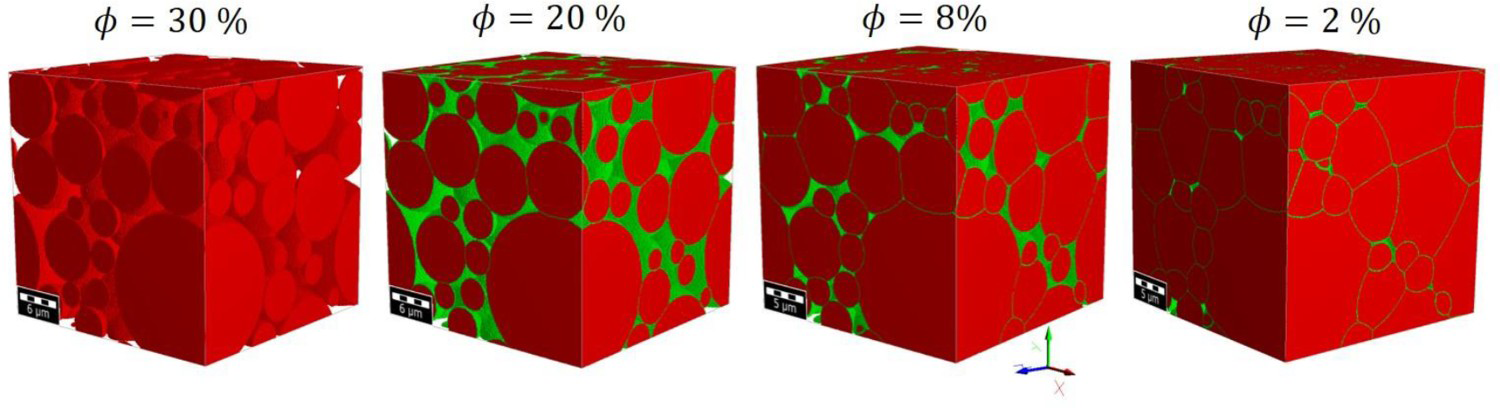
The influence of the pore size on the effective heat conductivity was also investigated with the simulation tool GeoDict. Spherical pores with a defined diameter in the range between 3 and 11 µm were randomly distributed in a box of 30 × 30 × 30 µm³ with cubic voxel sizes of 0.1 µm of a constant porosity of 5%. For each pore size, three microstructures were created and the effective heat conductivity was calculated. Figure 4 shows exemplarily three different microstructures with unimodal pores randomly packed in a matrix of Cu (invisible). Each microstructure has a total porosity of 5%, but the number of pores (a) per volume differs depending on the pore size (d).
Microstructures used for a simulation study to investigate the influence of the pore size on the effective heat conductivity of a metallic matrix at a constant porosity of 5%. The spheres represent the pores with diameter d in a metallic homogeneous matrix (invisible). The amount of spheres a is the result of the constant total porosity and the diameter of the spheres. The pores are randomly distributed without percolation.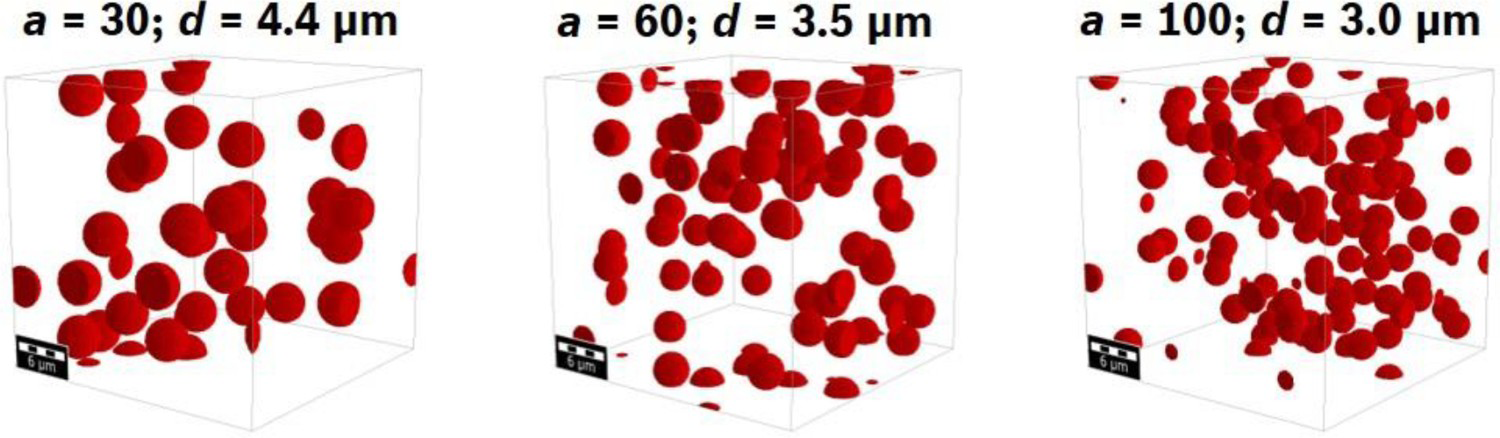
Figure 5 shows the simulation results of the influence of the pore size on the effective heat conductivity at a constant porosity of 5%. The error bars correspond to the standard deviation of the simulations of the three created microstructures with a spatially random pore distribution at a constant porosity and pore size. All conductivity values of the microstructures with pore sizes between 3 and 11 µm are within 92.3 and 93.5% of the matrix conductivity. Nevertheless, a slight trend to higher conductivities with increasing pore size is noticeable.
The influence of the pore size on the effective heat conductivity simulated by GeoDict. For the simulation, artificially constructed microstructures with a unimodal distribution of the pore size and a fixed total porosity of 5% are used.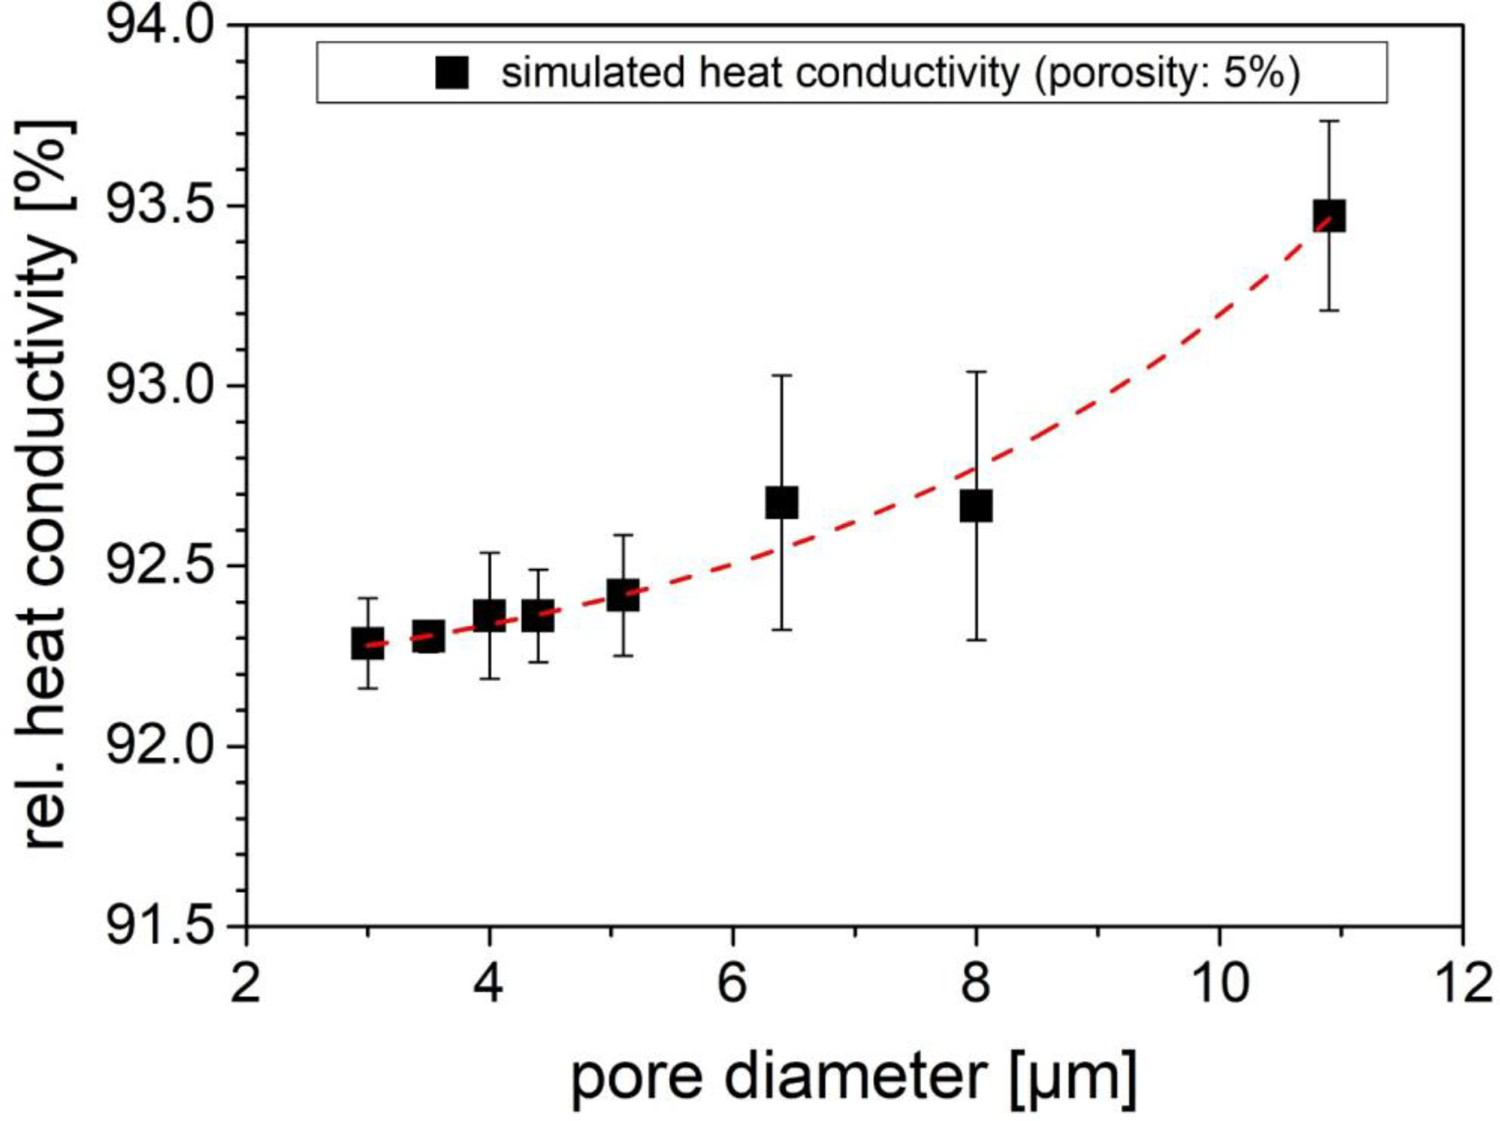
In summary, all models including the simulation show the same trend and predict a nearly linear dependence of the heat conductivity on the porosity. The slope of the curves vary from model to model and can be mostly adapted by a simple factor, like
 in the case of Aivazov's model, or
 as parameter considering the aspect ratio of the pores in Mayr's model. The analytic and simulative results are compared to experimental results in the following.
Microstructure development during sintering
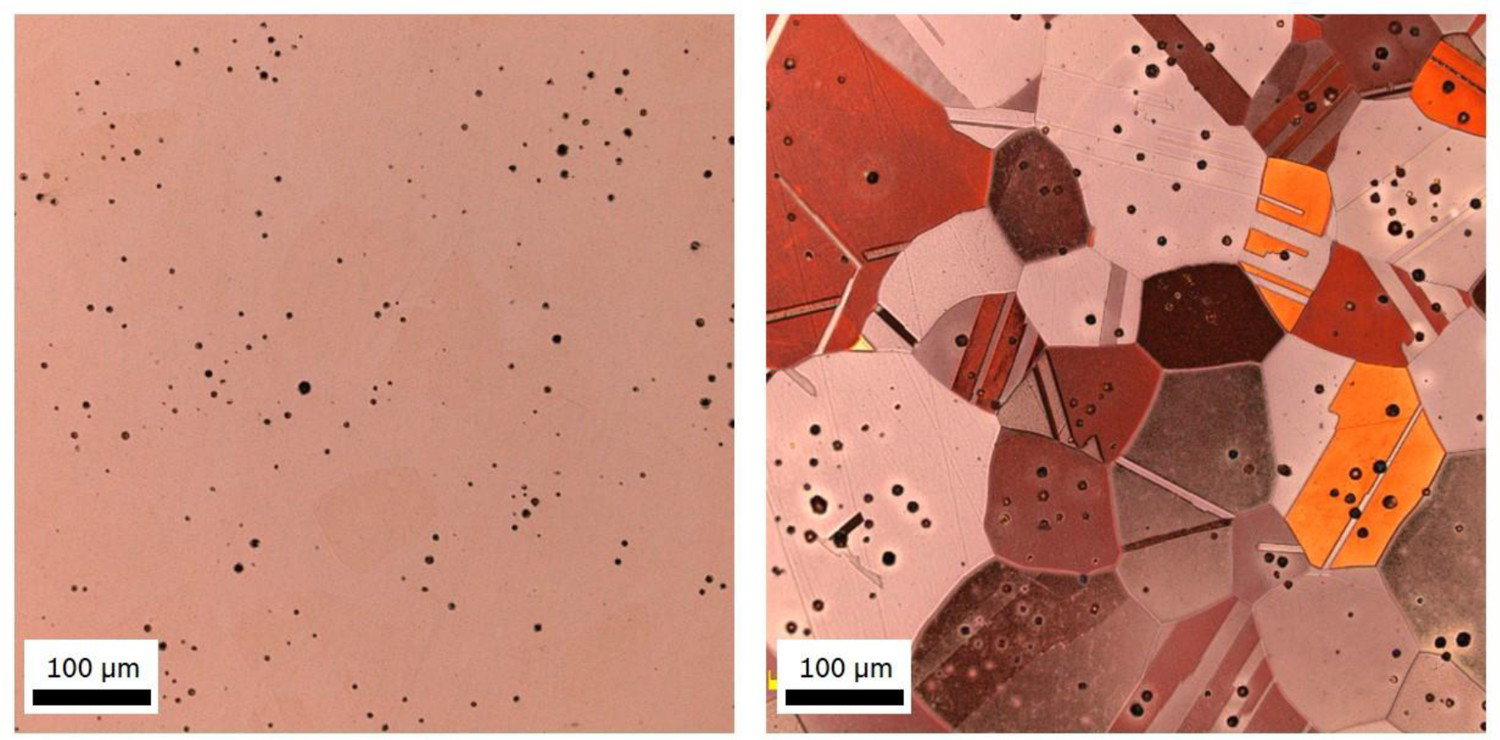
To study the sintering process of Cu powder, several sintering runs were carried out. Figure 6 shows the sintering curve of sintered Cu powder green bodies with an initial green density of 70%. The full sintering profile is characterised by heating and cooling rates of 5 K/min, a maximum temperature of 1075 °C and a holding time of 3 h. Excluding the last data point at the end of the sintering curve, which corresponds to the sample passed through the full sintering process, all samples are gained by interruption of the sintering process by rapid cooling. Each data point is gained by the average of three analysed samples. The densification starts after exceeding 700 °C (140 min) and the densification rate during heating reaches a maximum between 900 and 1000 °C. After sintering for 3 h at the maximum temperature, a final density of 98.0% was reached. Even after sintering for a longer time, no full densification could be reached. A typical microstructure of Cu, sintered for 6 h at 1075 °C, is displayed in Figure 7. The sample has a density of 97.5% and a mean grain diameter of 130 µm (determined according to ISO 43:2012). The lower density of this sample compared to samples from Figure 6 (sintered for 3 h) can be explained by the lower initial green density. Remarkable are the large grains, which are more than 10 times larger than the initial particles size and indicate a strong grain growth during the sintering process. Most of the remaining pores are located in the middle of the grains and only a negligible amount of pores is directly in contact with grain boundaries. Therefore, the distances between the pores as vacancy sources and the grain boundaries, which act as vacancy sinks, are large. This phenomenon is well discussed in the literature concerning sintering processes of metals and ceramics [19–21].
Sintering curve of Cu powder green bodies with initial green density of 70%, sintered at 1075 °C for 3 h in an H2 atmosphere. The dashed curve presents the temperature profile with a heating and cooling rate of 5 K/min. Representing micrographs during the sintering process are displayed in circles. Micrographs of Cu, sintered for 6 h at 1075 °C in H2 with a remaining porosity of 2.5%. The picture on the right-hand side shows a colour etched microstructure (Klemm solution) of a different region of the same sample.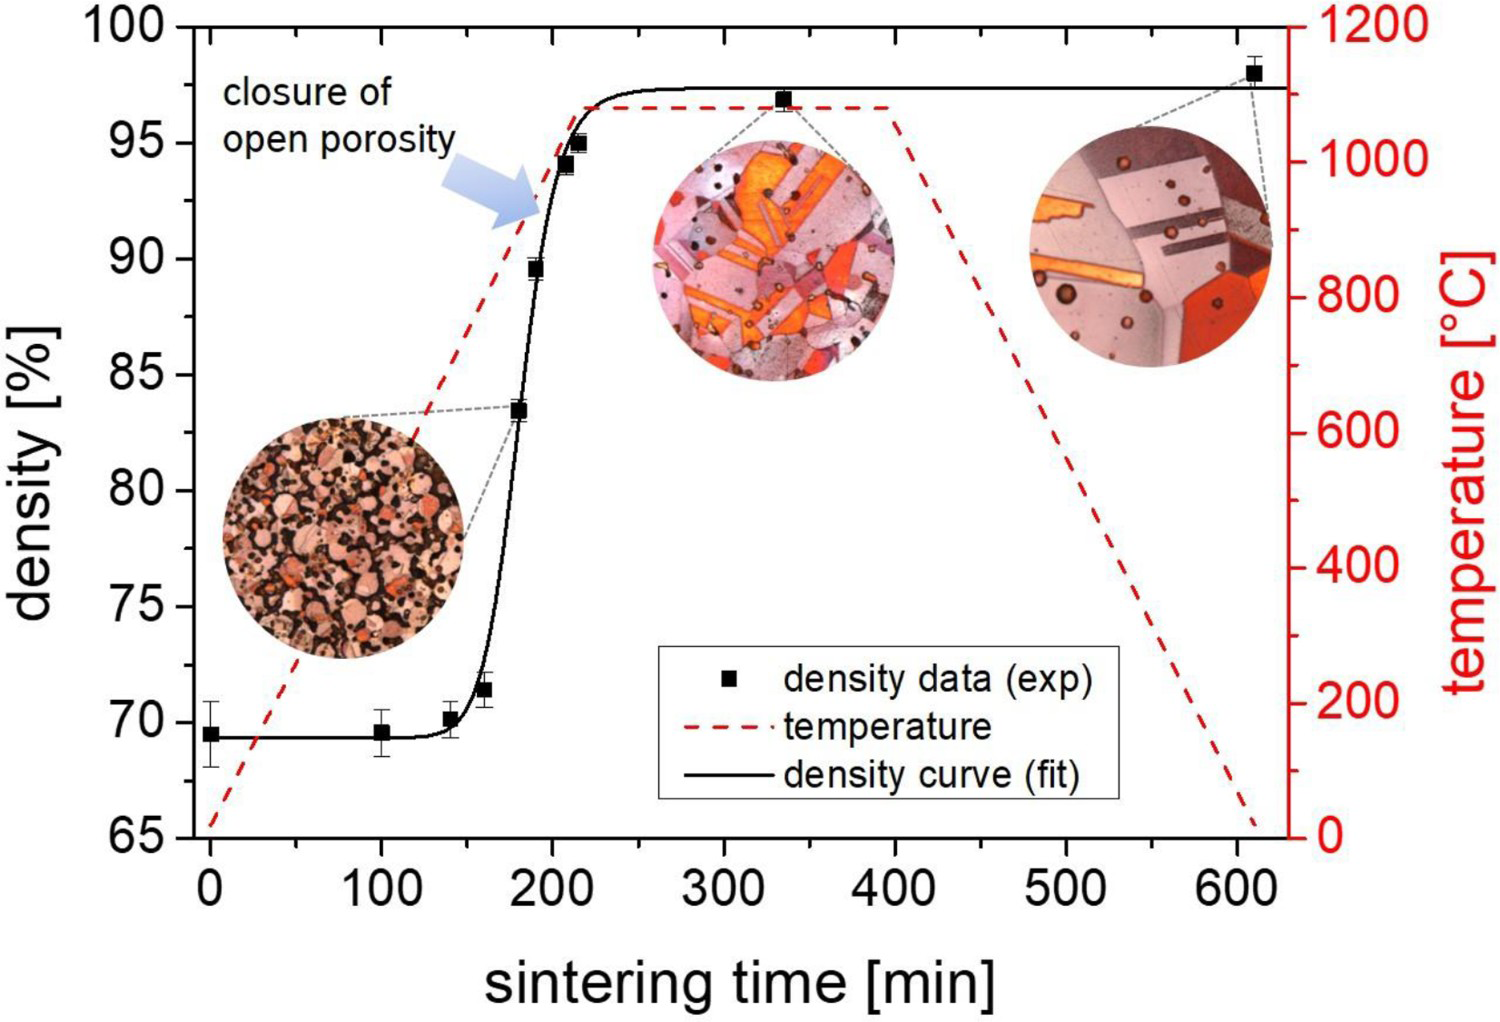
The shrinkage of pores and the associated reduction of free surface area are complex mechanisms and are essential for the densification. In the initial sintering state, contact and neck formation between particles are the predominant mechanisms based on surface diffusion [22]. Later on, the open porosity network becomes smaller and the pore channels become thinner. Figure 8 shows the development of the open, closed and total porosity during sintering of Cu powder green bodies. Starting with a green density of 70%, the complete porosity is part of an open porosity network. The closed porosity increases steadily and reaches a maximum of 6–7% a few minutes before reaching the maximum temperature of 1075 °C. The open porosity decreases continuously until it almost disappears when the closed porosity is at its maximum. From now on, the total porosity consists only of closed pores. The abrupt closure of the open porosity between 91 and 94% of porosity is a reproducible phenomenon and is noticed in all sintering experiments in this work, independently of the initial green density [14].
Open, closed and total porosity during pressure-less sintering of Cu powder green bodies for 3 h at 1075 °C in H2 with a heating and cooling rate of 5 K/min. The upper x-axis illustrates the temperature profile including the holding time of 3 h at the maximum temperature (1075 °C) and the following cooling ramp. The starting point for the heating ramp is the room temperature (RT).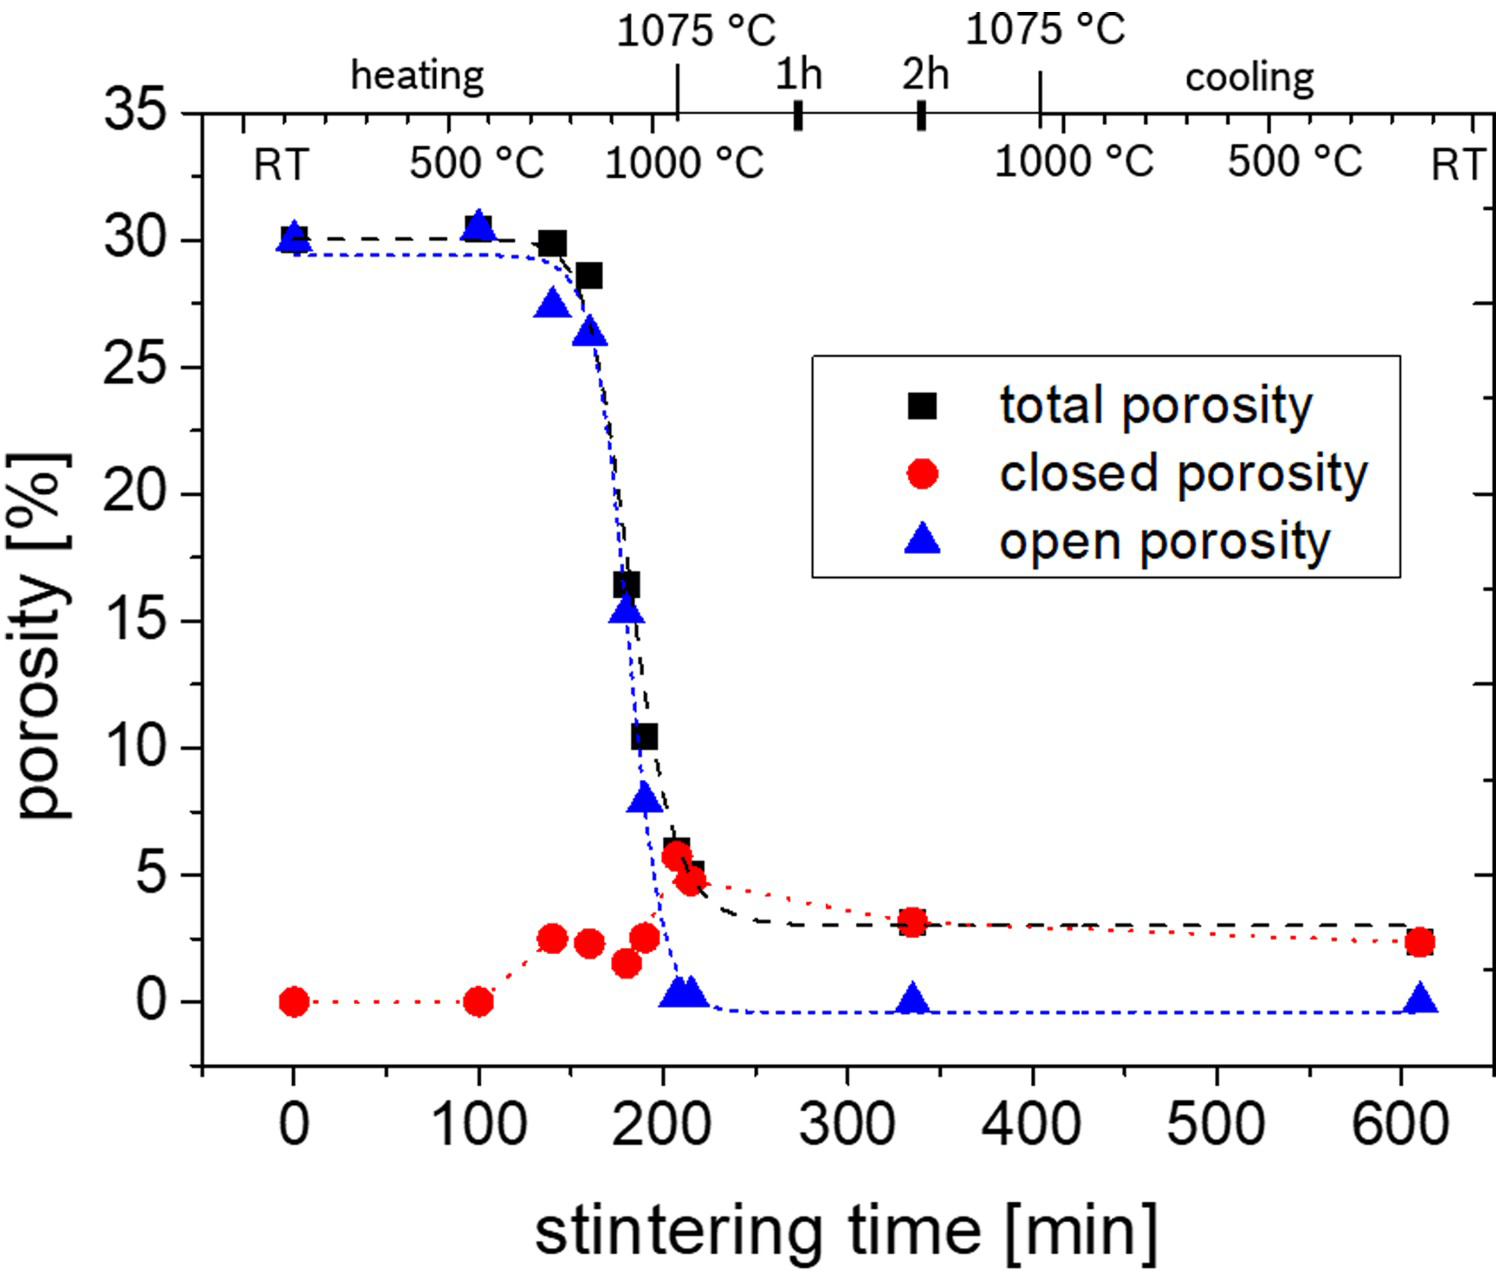
The heat conductivity is the main physical property for thermal applications. However, no full densification could be achieved by pressure-less sintering of Cu powder green bodies, which limits the heat conductivity as shown by the analytical models. To study the influence of the remaining pores on the heat conductivity, experimental heat conductivity measurements of sintered Cu samples are performed. Figure 9 shows the measured heat conductivity values. For these measurements, sintered Cu samples with porosities in the range of 1.2 and 19.1% were investigated. The sample with the highest porosity (19.1%) had a heat conductivity of 245.5 W/mK (±7.3 W/mK). The sample with the highest density (1.2% porosity), sintered with an optimised two-step sintering profile (see [14]), shows a heat conductivity of 343.1 W/mK (±5.6 W/mK), which is about 50 W/mK below the theoretical value of Cu (399 W/mK [23]). To ensure a correct measurement procedure, three Cu reference samples (OF-Cu) with a full density were measured. Figure 9 shows the reference measurement results as blue triangular data points. The literature value of Cu is within the measurement uncertainty of the experimentally determined heat conductivity (400.2 ± 4.7 W/mK) and confirms therefore the correctness of the experimental set-up.
Experimental results of heat conductivity measurements at 25 °C of pressure-less sintered Cu powder green bodies (black squares) depending on the porosity. The triangular data points represent reference measurements of pure high conducting Cu with full density.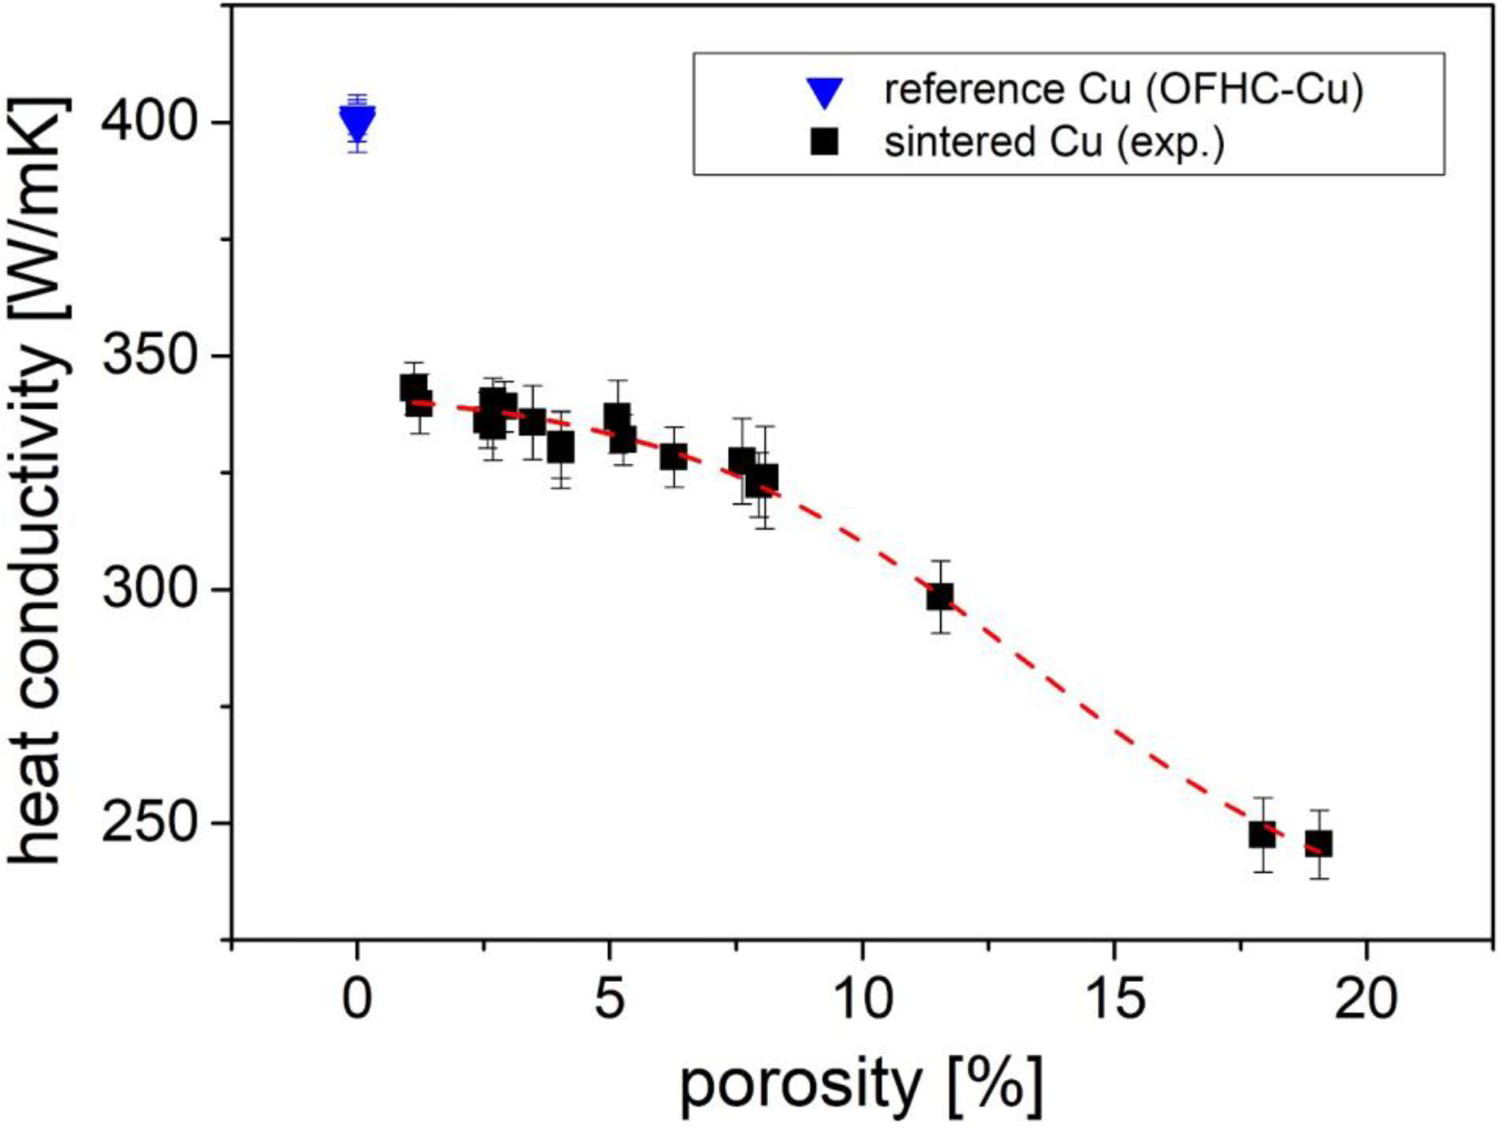
It is known from the literature that impurities like foreign elements or precipitations have an influence on the electrical conductivity of metals [24]. Any disturbance of the atomic lattice like point defects on the main or on the sub-lattice changes the band structure of the metal and, therefore, the properties of the electron transport. The heat conductivity of metals is based on an electron transport mechanism and is linked to the electrical conductivity. The Wiedemann–Franz law describes the temperature-dependent correlation between the electrical conductivity
 and the heat conductivity
 of metals

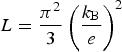
The proportionality constant
 is the Lorenz number (2.44·10−8 WΩK−2) and defined by the Boltzmann constant
 and the elementary charge

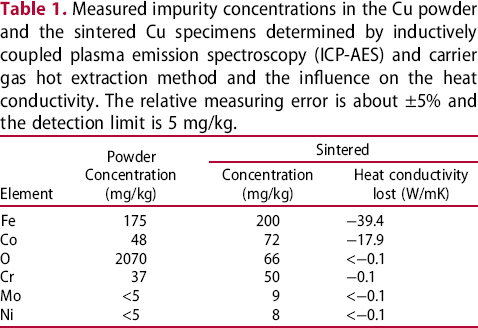
Measured impurity concentrations in the Cu powder and the sintered Cu specimens determined by inductively coupled plasma emission spectroscopy (ICP-AES) and carrier gas hot extraction method and the influence on the heat conductivity. The relative measuring error is about ±5% and the detection limit is 5 mg/kg.
Several publications [24,25] describe the effect of metallic impurities on the electrical conductivity of Cu. The strength of the effect on the conductivity depends strongly on the kind of element [25]. Figure 10 shows the influence of the Cr, Fe and Co concentration in Cu on the electrical and heat conductivity. For these three elements, a very strong effect is reported in the literature. The markings represent the experimental data of Cr, Fe and Co concentration in the sintered Cu sample. The quantitative influence of the elemental impurity concentration on the electrical conductivity is taken from [25]. The conversion between the electrical conductivity and the heat conductivity was done by using the Wiedemann–Franz law (see Equation (10)).
Influence of Cr, Fe and Co impurities in Cu on the electrical and heat conductivity. Data adapted from (copperalliance.org.uk). The heat conductivity is calculated from the electrical conductivity by using the Wiedemann–Franz law. The markings represent the measured impurity concentration of Cr, Fe and Co in sintered Cu.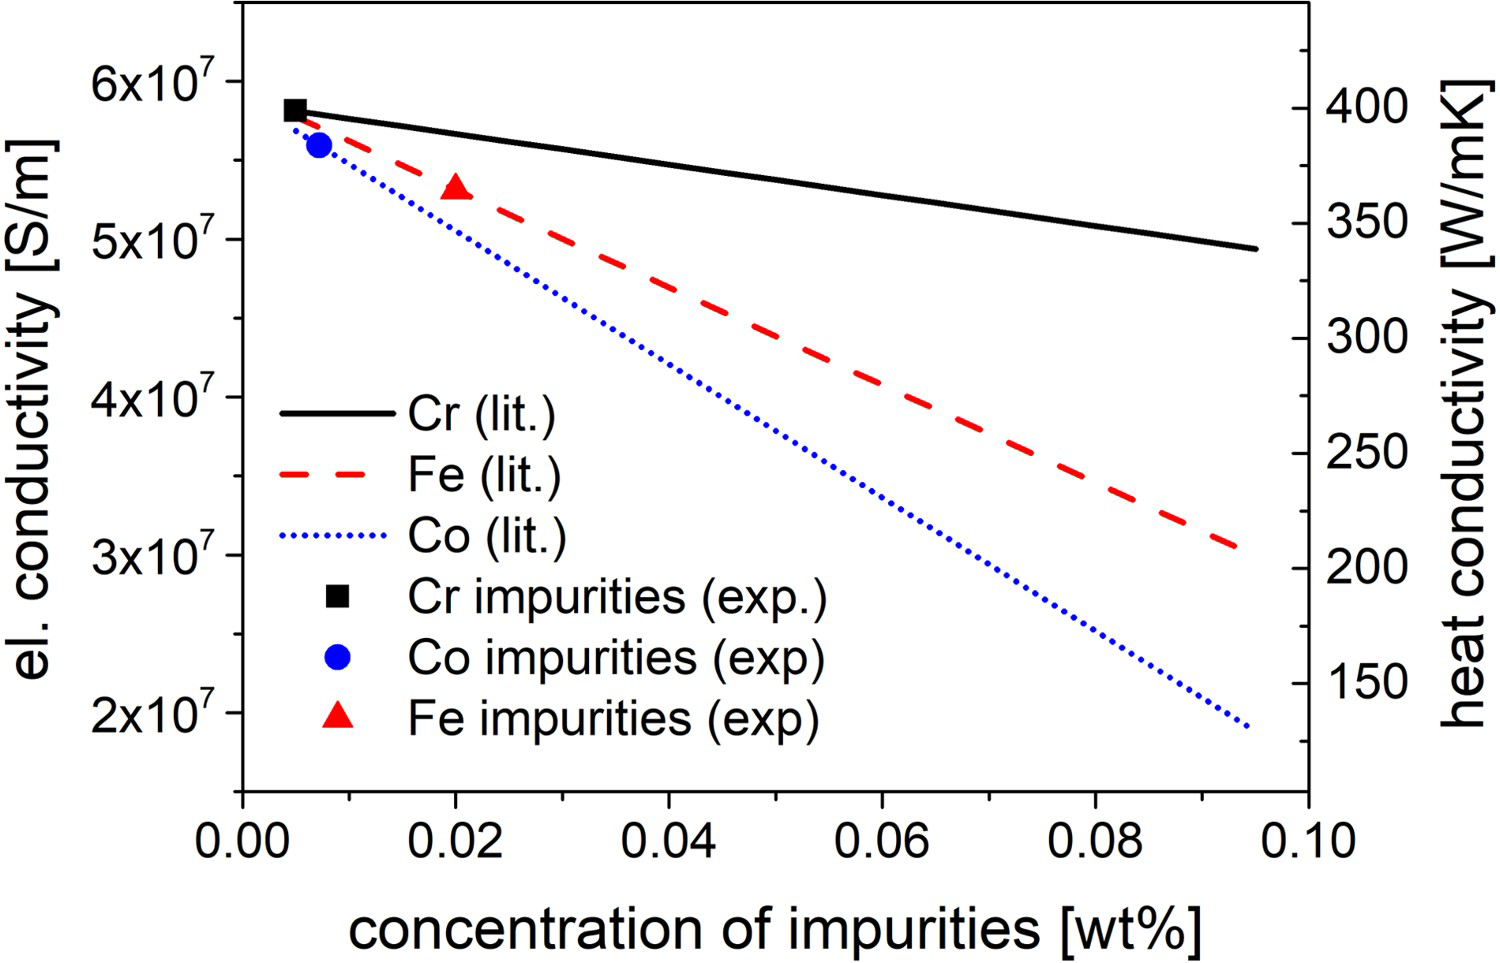
From these dependences visualised in Figure 10 and the Wiedemann–Franz law, the absolute reduction of heat conductivity can be derived. The right column of Table 1 lists the total reduction of the heat conductivity of each element: the Fe concentration of 200 mg/kg reduces the heat conductivity about 39.4 W/mK and has therefore the strongest influence. The second largest influence has Co with a concentration of 72 mg/kg, which causes a reduction of 17.9 W/mK. All other detected elements have a negligible influence on the heat conductivity at the measured concentration. Accordingly, the identified impurities caused a total reduction of the heat conductivity of Cu of about 57.4 W/mK.
The experiments show the influence of porosity and impurities on the effective heat conductivity. According to these results, high heat conductivities close to the theoretical limit are reachable by pressure-less sintering of Cu. However, a remaining porosity and especially powder impurities limit the heat conductivity. Even a small powder contamination of 200 mg/kg Fe in the powder reduces the heat conductivity by 8.5% (see Table 1). The difference of the Fe concentration in the pure powder and in the sintered sample is about 25 ppm, which is within the measurement uncertainty of the elemental analysis. This uncertainty causes a difference in the predicted heat conductivity reduction of 4 W/mK, which is nearly 10% of the reduction by Fe (−39.4 W/mK). Therefore, an error of 10% is assumed for all elements. Under the assumption that all detected metal impurity atoms are within the solubility limit in Cu and homogeneously distributed on the Cu lattice, the impurities in the used powder are responsible for a reduction of 57.4 W/mK (± 5.7 W/mK). Therefore, a heat conductivity of 340.6 W/mK (±5.7 W/mK) for the sintered Cu with the used impure Cu powder can be expected.
The elemental analysis of the pure powder and the sintered sample show essentially the same results (see Table 1). Only the oxygen content differs a lot. Before sintering, the pure powder contains 2000 mg/kg O, which is a 30 times higher concentration than after sintering. The high O content is a result of the storage condition of the powder in air and of the suspension route in water. Both processes promote the oxidisation of the Cu surface. However, the hydrogen atmosphere during sintering reduces the oxide layer of the particles. The fast reduction behaviour of oxidised Cu particles already at low temperatures could be demonstrated by thermogravimetric analysis (TGA) of oxidised Cu powder in H2 at 400 °C (not shown). In the initial powder, only traces of Mo under the measurable limit (<5 mg/kg) were detected. With 9 mg/kg Mo, a slightly higher amount of this element was measured. The usage of pure Mo heating filaments in the furnace can explain the higher amount of Mo in the sintered sample than in the powder. However, Mo has no significant influence on the conductivity of Cu at this small concentration (see the influence of metallic impurities in Cu in reference [25]). All other metallic impurities in the sintered sample were already present in the Cu powder. This is confirmed by the existence of grey and metallic particles inside the green bodies, which were detected by light microscopy investigations. Figure 11 shows exemplarily an initially sintered Cu powder green body with a grey particle inside. The chemical composition of these foreign particles determined by EDS analysis matches with the impurity concentration in the powder and the sintered specimen (see Figure 11(b)). The ratio of all detected impurities fits to a typical composition of an iron-based stainless steel. Probably, the gas atomisation of Cu in a process plant, where also steel powders are produced, contaminates the Cu powder and causes the reduction of the heat conductivity. The production of exclusively Cu powder in one production equipment would prevent the cross-contamination. In the case of completely pure powder, the effective heat conductivity would only depend on the remaining porosity.
Light microscopy (a) and SEM picture (b) of sintered Cu powder (heated to 800 °C with a heating rate of 5 K/min) with an impurity particle. The chemical composition of the impurity particle determined by EDS analysis is given in the table in the picture on the right-hand side and contains mainly Fe and Cr.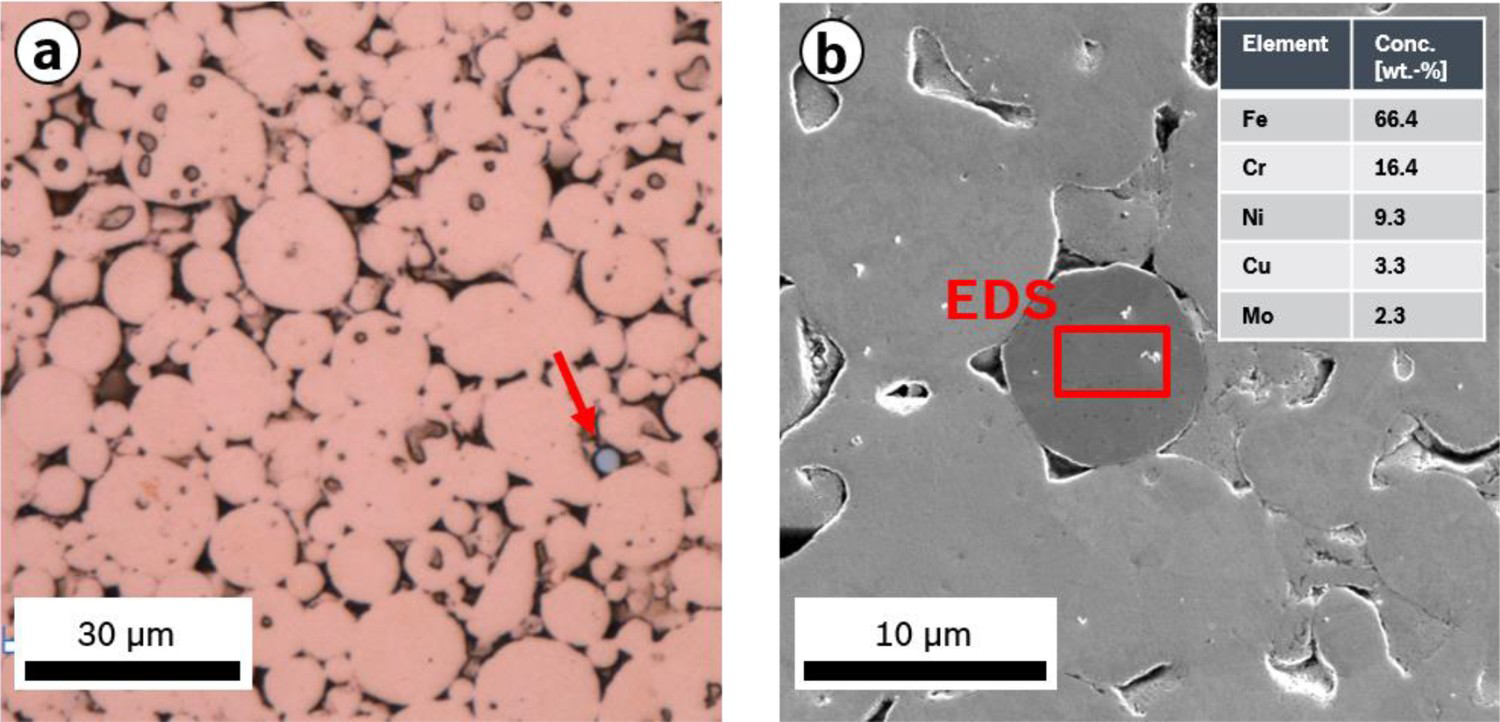
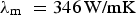
However, full densification seems not to be reachable by conventional pressure-less sintering of Cu, even by sintering for many hours close to the melting point [13,14]. To evaluate the experimentally determined influence of the porosity on the heat conductivity, analytic models were investigated and a numerical simulation was performed. Figure 13 shows the experimental results, the simulation results and the analytical models in one diagram. To achieve the best match between analytic models and experimental results, the maximum heat conductivity of a homogenous material without any pores
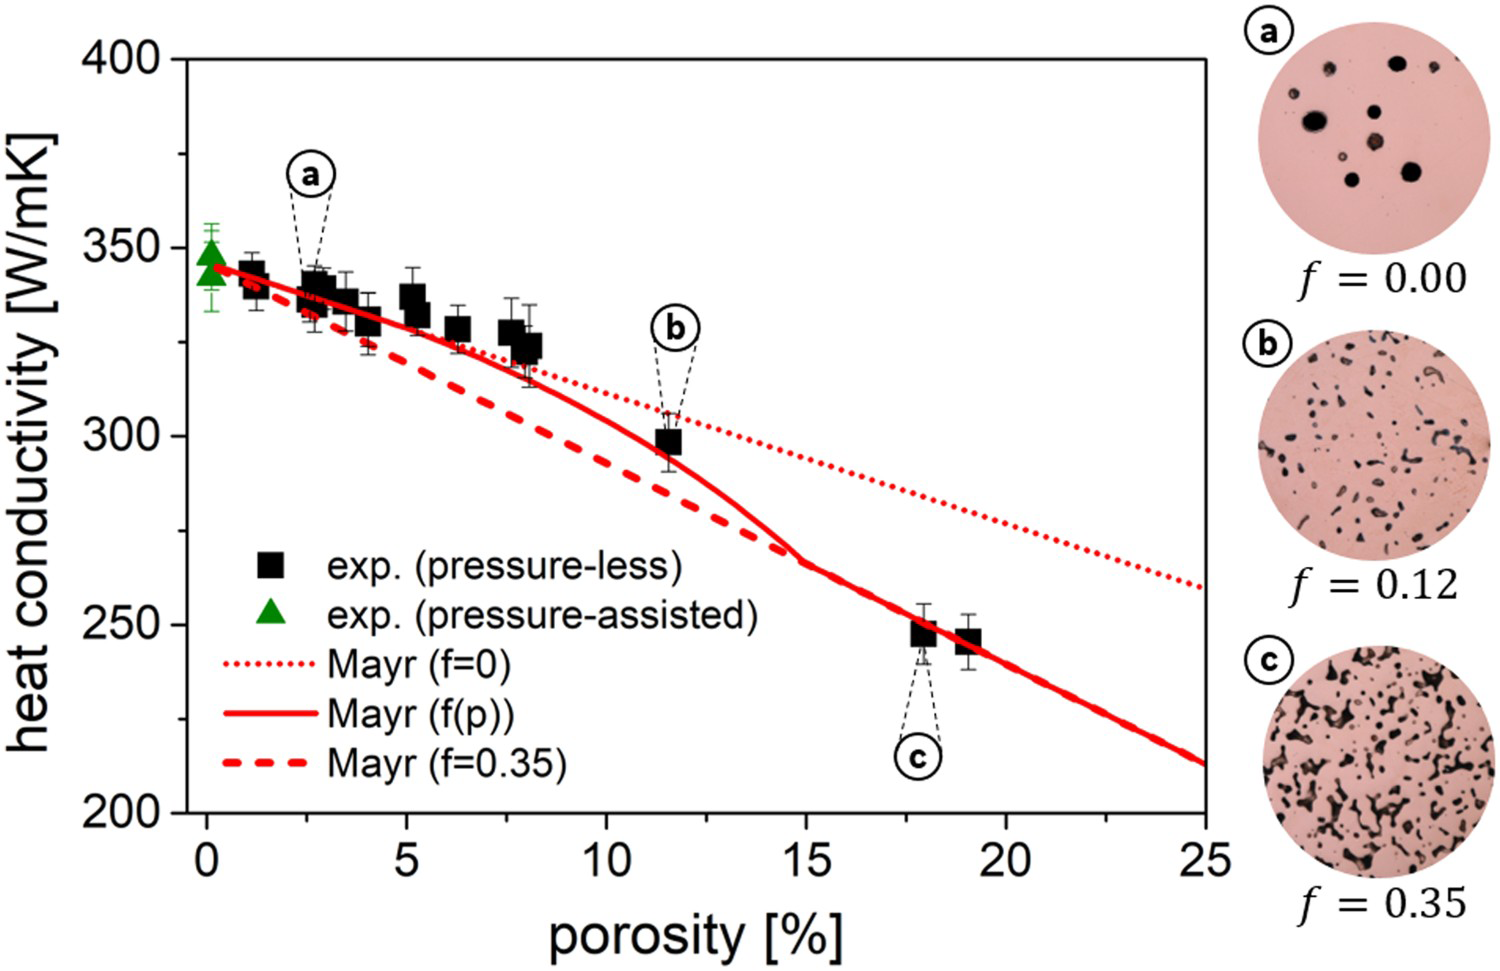
Influence of the porosity on the heat conductivity. The lines correspond to an analytical model with different geometry factors f, which considers the pore shape (dotted: f = 0; dashed: f = 0.35; full: f as a function of the porosity, see Equation (12)). A geometry factor of zero describes spherical pores (see micrograph a). The more irregularly shaped the pores are, the larger f is set (see micrographs b and c). The squares (pressure-less) and the triangles (pressure-assisted) present the experimentally determined heat conductivities of sintered Cu powder green bodies at 25 °C. has to be set to 346 W/mK for the analytic calculations and the simulation instead of 399 W/mK. This fits to the assumption that the given contamination decreases the maximum heat conductivity by 57.4 W/mK to a value of 340.6 W/mK (±5.7 W/mK), which is also proven by the pressure-assisted samples with 99.9% density (green triangles in Figure 13) and a measured heat conductivity of 346.0 W/mK (±8.2 W/mK). Generally, all analytical models predict quite similar heat conductivities for porosities smaller than 3% with a deviation of <2%. Accordingly, all investigated models are considered as valid for the prediction of the heat conductivity of sintered Cu with very high sintering densities. However, with increasing porosity, the models differ more. Maxwell's model and the simulation as well show a strong decrease of the heat conductivity with increasing porosity. The calculated conductivity for a sample with a porosity of 20% is <200 W/mK and therefore about 50 W/mK lower than the experimental value. Mayr's model with a geometry factor of
 fits very well for porosities smaller than 10% but underestimates the conductivity a lot for larger porosities. The opposite is the case for a geometry factor of 0.35. With this value, the experimental results with porosities in the range of 15–20% are hit. The pore shape and the kind of porosity network can explain this phenomenon. The experimental results of the porosity evaluation during sintering of the Cu powder green bodies (see Figure 8) show that the open porosity network closes when densities higher than 93% are reached. Moreover, the pore shape of closed pores approach a spherical shape, which can be considered by a geometry factor of
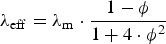
 in the model by Mayr. This match with the experimental results for porosities smaller than 5%, where the pores are spherically shaped (see solid line in Figure 12). In the case of an open porosity with cylindrically shaped pores, factors larger than zero have to be used to fit the experimental results, which can be seen by the dotted line in Figure 12 with a geometry factor of f = 0.35. To bridge the transition region of the pore structure in the range of 5–15% of porosity, an adjustment of the geometry factor to the present pore shape is necessary. To achieve this, Mayr's model is modified by a geometry factor that is a function of the porosity, depending on the shape of the pores. Therefore, the development of the geometry factor between 5 and 15% of porosity is approximated linearly. The regions of cylindrical and spherical pores as well as the transition region of both are considered by the following equation with the given ranges of validity


All experimental data points match with this analytical description of the heat conductivity of sintered Cu by setting the maximum heat conductivity to
 (see Figure 12).
Another valid fit is given by the modified model published by Aivazov et al. [15] (see the green curve in Figure 13 and Equation (8)) by adapting the empirical factor to
Influence of the porosity on the heat conductivity. All lines correspond to analytical models. The stars show the results of numerical simulations by GeoDict. The squares (pressure-less) and the triangles (pressure-assisted) present the experimentally determined heat conductivities of sintered Cu powder green bodies. instead of
 as Aivazov used
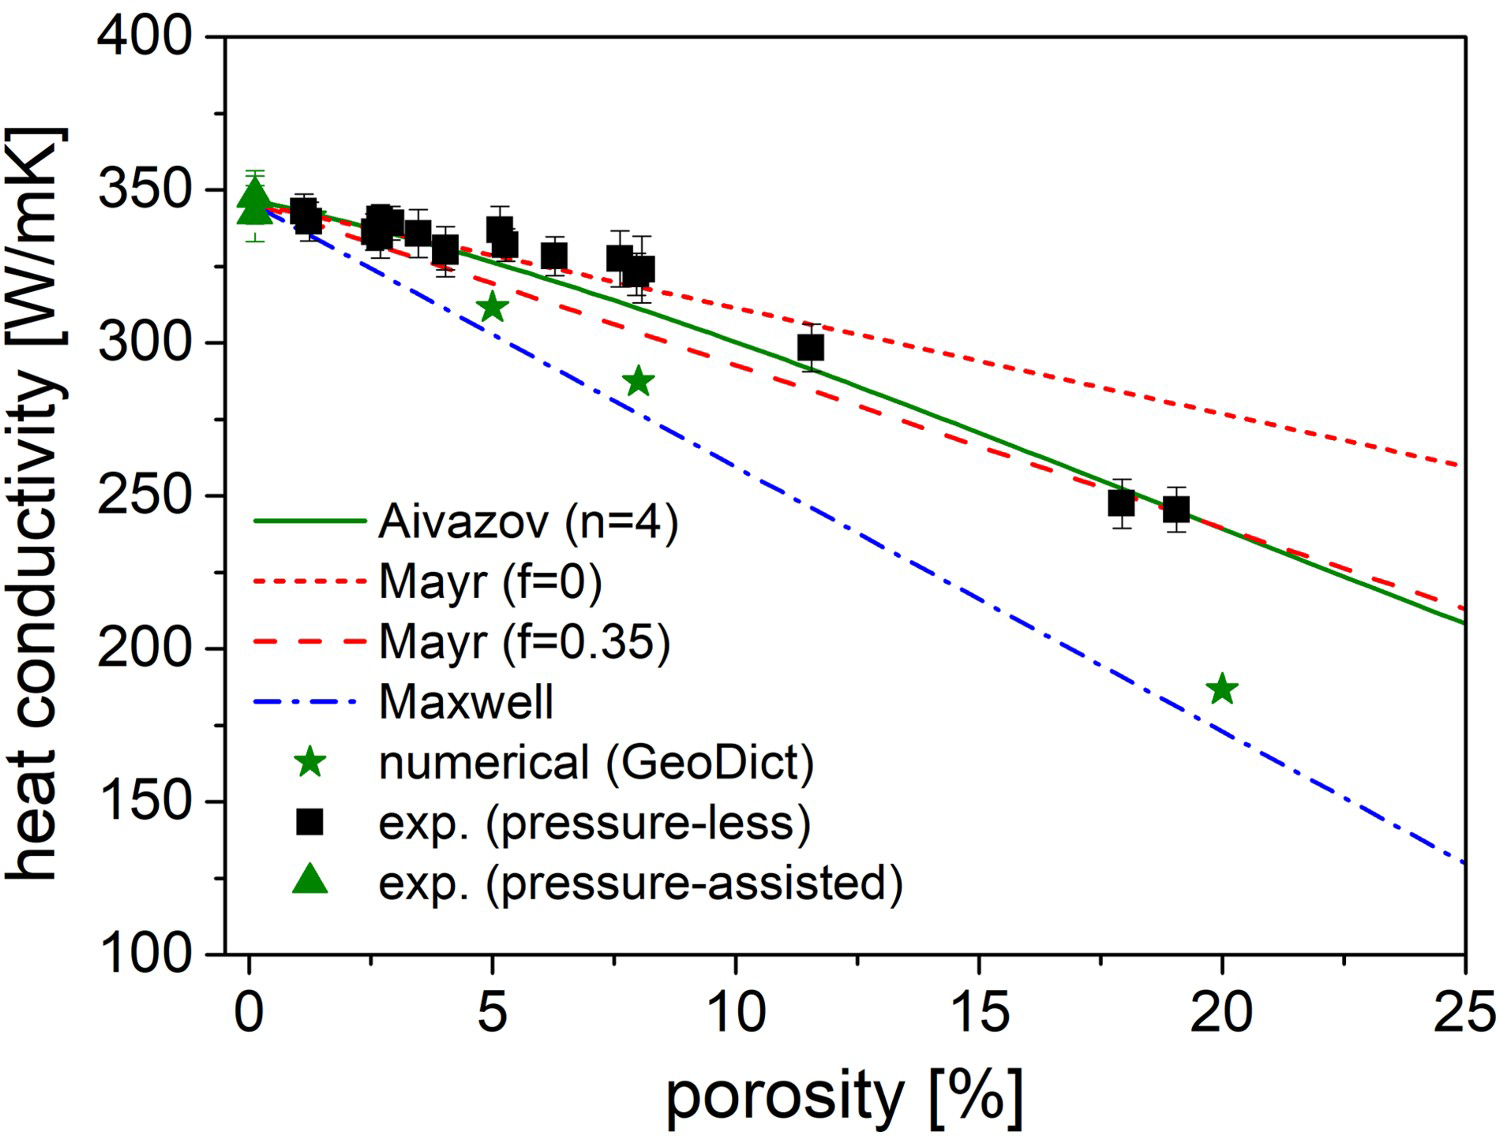
With this model, the whole porosity range from 0 to 20% is covered within the measurement inaccuracy of the experimental results including the transition from open to closed porosity.
The GeoDict simulation does not offer a higher accuracy of the predicted heat conductivity than the analytical models. All simulated results are very close to the values calculated by Maxwell's model. However, the simulation tool GeoDict offers great opportunities for more complex and heterogeneous materials like multi-material composites or if the influence of systematic changes in the microstructures like pore shape and pore size is investigated. For instance, GeoDict simulations could demonstrate the influence of the pore size of spherical pores on the effective heat conductivity at a constant porosity. Pore sizes in the range of a few micrometre up to 10 µm are typically present in sintered Cu when the final stage (<5% porosity) of sintering with nearly spherical shapes is reached. Figure 5 shows the effect of the pore sizes in the range of 1–11 µm at a given porosity of 5%. The difference between large pores with a diameter of 11 µm and small pores with 3 µm is about 5 W/mK in the case of Cu, which means a deviation of 1.5%. It is a clear trend to a higher conductivity with increasing pore size. The pore volume to interface area ratio, which increases with increasing pore size, can explain this trend. Interfaces between pores and the high conducting metal matrix act as scattering planes for the heat wave going through the material. Less pores and thus larger pores at a constant porosity offer less scattering sites and show therefore an increased conductivity behaviour. In this respect, larger and less pores are preferred in contrast to smaller pores with the same total porosity. However, the influence of the heat conductivity is relatively small for pore sizes in the range of a few micrometre, and show a subordinated effect compared to the influence of impurities and of an increased porosity. However, a shift to larger pores with a smaller total interfacial area between pores and dense matrix instead of smaller pores would enhance the conductivity properties.
All discussed influences on the heat conductivity of sintered Cu have to be considered if Cu parts are produced by sintering-based manufacturing techniques like BJ, MIM and FFF. The negative effect of impurities inside the metal powder can only be solved by using powder with a higher purity. However, the remaining porosity seems to be a diffusion problem, which is influenced by the sintering process. First investigations of the microstructure of sintered Cu (see Figure 7) show that long diffusion paths between large pores and grain boundaries decelerate the densification rate significantly. Preventing grain growth and enabling pore drag by mobile pores are two possible mechanisms to keep diffusion paths short [21,22,26]. Both mechanisms are controllable by temperature and enable therefore an optimisation of the sintering process by adaption of the temperature profile. Optimised temperature profiles during sintering are part of current research and first improved sintering paths are developed with final densities of 99.3% by pressure-less sintering of Cu green bodies with initial green densities of 70%. The optimisation of the sintering process will be important for BJ that produces green bodies with low packing densities of 50–60 vol.-% [13].
In this work, the relation between the heat conductivity and the porosity as well as the impurity concentration in sintered Cu is presented. Experimental heat conductivity measurements of pressure-less sintered Cu powder green bodies were performed and analytical models and a numerical simulation were used to predict the reduction of the heat conductivity caused by pores. These investigations showed that the influence of the remaining porosity in the range of 2–5% reduces the heat conductivity by <10 W/mK (<−3%). Based on the theoretical heat conductivity of Cu (399 W/mK [23]), a conductivity of roughly 385 W/mK should be reached by pressure-less sintering. However, the experimentally determined heat conductivity of pressure-assisted sintered Cu without any porosity is 346.0 W/mK (±8.2 W/mK). The elemental analysis of the given powder and the sintered samples showed impurities of Fe, Co, O, Cr, Mo and Ni. By combining measurements results and literature values, especially the contamination by Fe with a concentration of 200 mg/kg is responsible for a heat conductivity reduction of ∼39.4 W/mK. In total, all detected contamination by metallic elements found in the given Cu powder reduced the effective heat conductivity by 57.4 W/mK (−14.4%), which is in line with the experimental results. Accordingly, 340.6 W/mK (± 5.7 W/mK) is the maximum heat conductivity that can be reached by sintering of Cu powder green bodies, produced with the given powder and perfect sintering with full densification.
With this knowledge, it can be conducted that the purity of the powder has the main influence on the heat conductivity of sintered Cu. By prevention of metallic impurities, heat conductivities very close to the theoretical conductivity of Cu are reachable, even with a low percentage of porosity.
Footnotes
Acknowledgements
The author wants to thank the associates from the metallography lab at Saarland University as well as from the analytics department at the corporate sector research at Bosch for their support.
Disclosure statement
No potential conflict of interest was reported by the author(s).