
Abstract
Perceived Vulnerability to Disease may be defined as the beliefs about personal susceptibility to the transmission of infectious diseases and the emotional discomfort associated with the potential disease transmission. To evaluate these beliefs, the Perceived Vulnerability to Disease Scale (PVD) has been used in most studies. The aim of Study 1 was to validate the PVD questionnaire to the Spanish population. The sample was made up of 744 university students from all over Spain. Confirmatory factor analysis revealed that the items on the short version of the questionnaire corresponding to an interrelated two-factor model (perceived infectability and germ aversion) showed the best fit of all the tested models. In Study 2, scales to measure antifat attitudes, disgust and negative attitudes towards AIDS were used to analyse the criterion validity of the PVD questionnaire. The sample was made up of 434 university students. It was found that germ aversion was positively related with antifat attitudes, disgust and negative attitudes towards AIDS. In light of these results, we conclude that the short version of the questionnaire has good psychometric properties and can be used by the scientific community to measure Perceived Vulnerability to Disease.
Infectious diseases have imposed a threat to human beings since the beginning of their existence (Morens & Fauci, 2013). Recent empirical research indicates that the threat posed by infectious diseases has important implications for different psychological outcomes. For example, some studies show that individual differences in chronic concerns about disease transmission exist (Schaller & Duncan, 2007). According to some authors, these individual differences are related to relevant topics in Social Psychology such as ethnocentric attitudes (Navarrete & Fessler, 2006), antipathy towards individuals who are physically disabled (Park, Faulkner, & Schaller, 2003) and preferences for facial characteristics associated with good health (Welling, Conway, DeBruine, & Jones, 2007).
The reviewed literature shows that two different kinds of self-report measures may be used to assess perceived vulnerability to infectious disease. First, instruments designed to assess hypochondria and other health-relevant anxieties. These instruments measure beliefs about one’s susceptibility to disease, but they focus on very specific potential health problems, rather than on infectious diseases. For example, the Whiteley Index (Conradt, Cavanagh, Franklin, & Rief, 2006) and the Health Anxiety Inventory (Salkovskis, Rimes, Warwick, & Clark, 2002) are two of the most widely used instruments for measuring hypochondriacal worries and beliefs about health. It is important to remark that in the updated edition of the Diagnostic and Statistical Manual of Mental Disorders (DSM-V) (American Psychiatric Association, 2013), hypochondria and several related conditions have been replaced by two new empirically derived concepts like somatic symptom disorder and illness anxiety disorder. Regardless, the problem with these instruments is that they are typically designed for clinical diagnostic purposes, and for that reason are not usually used with the general population.
In the second place, there is a measure designed to assess perceived vulnerability to disease (Duncan, Schaller, & Park, 2009). The Perceived Vulnerability to Disease Scale (PVD) assesses beliefs about personal susceptibility to the transmission of infectious diseases and the emotional discomfort associated with the potential disease transmission. This instrument has shown good psychometric properties and can be used with the general population (Duncan et al., 2009). It is important to remark that this instrument focuses on infectious diseases rather than health problems like the scales mentioned above. For these reasons, we believe that the PVD (Duncan et al., 2009) is the most useful instrument that currently exists to measure perceived vulnerability to disease.
As has been pointed out before, the reviewed literature shows that perceived vulnerability to disease is a very good predictor of the prejudice towards different stigmatized groups (see, for example, Navarrete & Fessler, 2006). For this reason, we believe it is especially interesting to analyse the role that perceived vulnerability to disease may be playing in the explanation of the prejudice towards different social groups. In other words, the main goals of this work are to adapt into Spanish the PVD scale, but also to analyse its relationships with other social relevant variables.
Study 1
In Spain there has been no Spanish-language adaptation of the PVD scale to date. For this reason, the goal of this research is to obtain evidence of validity of a Spanish-language version of the PVD (Duncan et al., 2009). To do so, we first conducted a Confirmatory Factor Analysis (CFA) to verify the factorial structure proposed by Duncan et al. (2009) and then established the psychometric criteria of the PVD to make valid the use of this instrument by the Spanish-speaking scholarly community. It is important to mention that when there are plausible hypotheses regarding the structure of a model, as in our case, experts recommend the use of confirmatory factorial analysis more than exploratory analysis (Bollen, 1989).
Method
Sample
The sample was made up of 744 participants with an average age of 28.69 (SD = 9.95) and an age range between 18 and 45. 56.5% of the participants were between 18 and 29 years old. 284 were male and 460 were female. All the participants were students at Spain’s Universidad Nacional de Educación a Distancia (Spanish Open University, UNED). All of them voluntarily agreed to participate in the study.
Procedure
Information on the study was posted on the virtual courses taught by the researchers in this study in order to request participation by anyone interested. The students in the final sample had to complete the questionnaires online from the website. Because of the circumstances of the university where the study was performed (UNED), data were obtained from all the provinces in Spain. Questionnaires were completed anonymously.
Instruments
The PVD (Duncan et al., 2009) has been adapted to Spanish using the translation/back-translation methodology as stipulated by many authors (Gudmundsson, 2009) and the norms of the International Test Commission (Hambleton, 2005).
The first Spanish translation of the original scales was performed by one of the authors. This Spanish translation was independently reviewed by an additional evaluator, who worked with the first translator to reach an agreed-upon translation of the items, especially those which posed the most difficulty from the semantic and/or grammatical standpoint. Subsequently, a bilingual English translator back-translated to English the agreed Spanish translation, with no knowledge of the original scales in English in order to preserve the reliability of the back-translation. The scale translated into English and the original scale reached almost 100% grammatical agreement.
Items of the Perceived Vulnerability to Disease scale (PVD): English and Spanish version.
Note: 1Items of the Spanish short version; r = reverse scored.
Data analysis
Firstly, a first-order confirmatory factor analysis (CFA) was conducted to assess the fit of the factor structure proposed by the authors of the original scale (Duncan et al., 2009) in the Spanish version of the PVD. The robust unweighted least square method was used, as the factors of the scale did not meet the assumption of normality. To determine goodness of fit, the following indexes were employed: the Satorra-Bentler chi square, the goodness of fit index (GFI), the adjusted goodness of fit index (AGFI), the standardized root mean square residual (SRMR), the standardized root mean square error of approximation (RMSEA) and the comparative fit index (CFI), the normed fit index (NFI), the non-normed fit index (NNFI), the incremental fit index (IFI) and the consistent Akaike information criterion (CAIC). According to experts, values lower than .05 on the RMSEA, ≤ .08 on the SRMR and higher than .95 on the GFI, CFI, NFI, NNFI and IFI indicate good fit (Kline, 2011). However, it is important to mention that according to Hair, Anderson, Tatham, and Black (1998), values under .05 for the RMSEA indicate acceptable fit, and values under .10 indicate reasonable fit. Browne and Cudeck (1980) also postulate that a fit less than or equal to 0.08 is reasonable. Finally, in the case of the GFI, AGFI and CFI indexes, Bentler and Bonnet (1993) stipulated that values equal to or higher than .90 indicate good fit. The CAIC is a good fit index for model comparison and the general rule is that values smaller the better (Schreiber, Nora, Stage, Barlow, & King, 2006). The sample size was enough given that the relationship between the number of subjects and the number of items was greater than 45:1 (Bentler & Chou, 1987).
Secondly, in order to analyse the psychometric properties of the PVD (Duncan et al., 2009), it was decided to calculate the Cronbach’s alphas, a coefficient used to measure the reliability of a measurement scale, of both the scale as a whole and the subscales (Cronbach & Shavelson, 2004). According to Kline (2000), the reliability between .70 and .90 is good and between .60 and .70 acceptable.
The PRELIS and LISREL 8.8 (Jöreskog & Sörbom, 2006) programmes were used for the CFAs and, for the remaining analyses, SPSS 19. (SPSS 19.0, SPSS Inc, Chicago, IL).
Results
Confirmatory factor analysis
Fit indexes of the proposed model and the alternative models.
Note: 1Change in chi-square between the proposed model (Model 1) and the rest of the proposed alternative models.
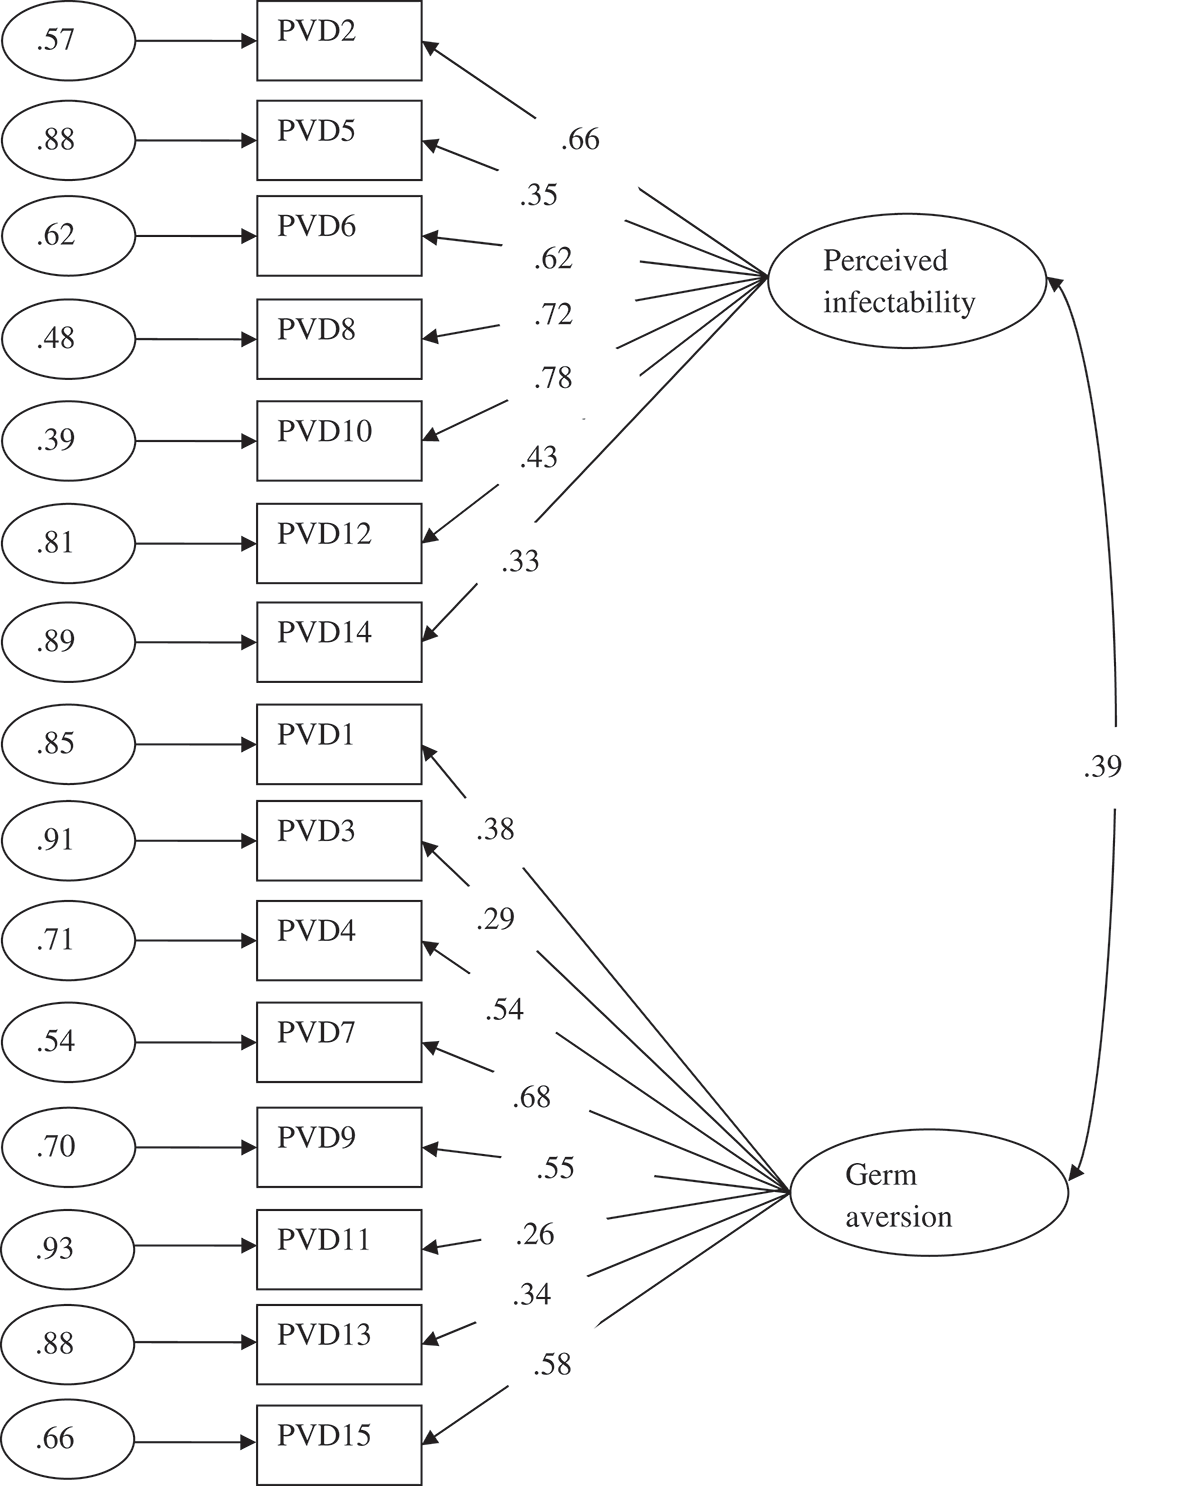
Results of confirmatory factor analysis. Model with all the items of the original scale. Standarized Solution.
Therefore, reversed items were removed and a CFA without them was conducted again (model 2). As can be seen in Table 2, the model fit improved significantly and substantially. Furthermore, all the parameters of the model were statistically significant (p < .05) and the standardized coefficients generally presented adequate values although they were moderate in the case of item 1 (Figure 2). Results of confirmatory factor analysis. Model without the reverse items of the original scale. Standarized Solution.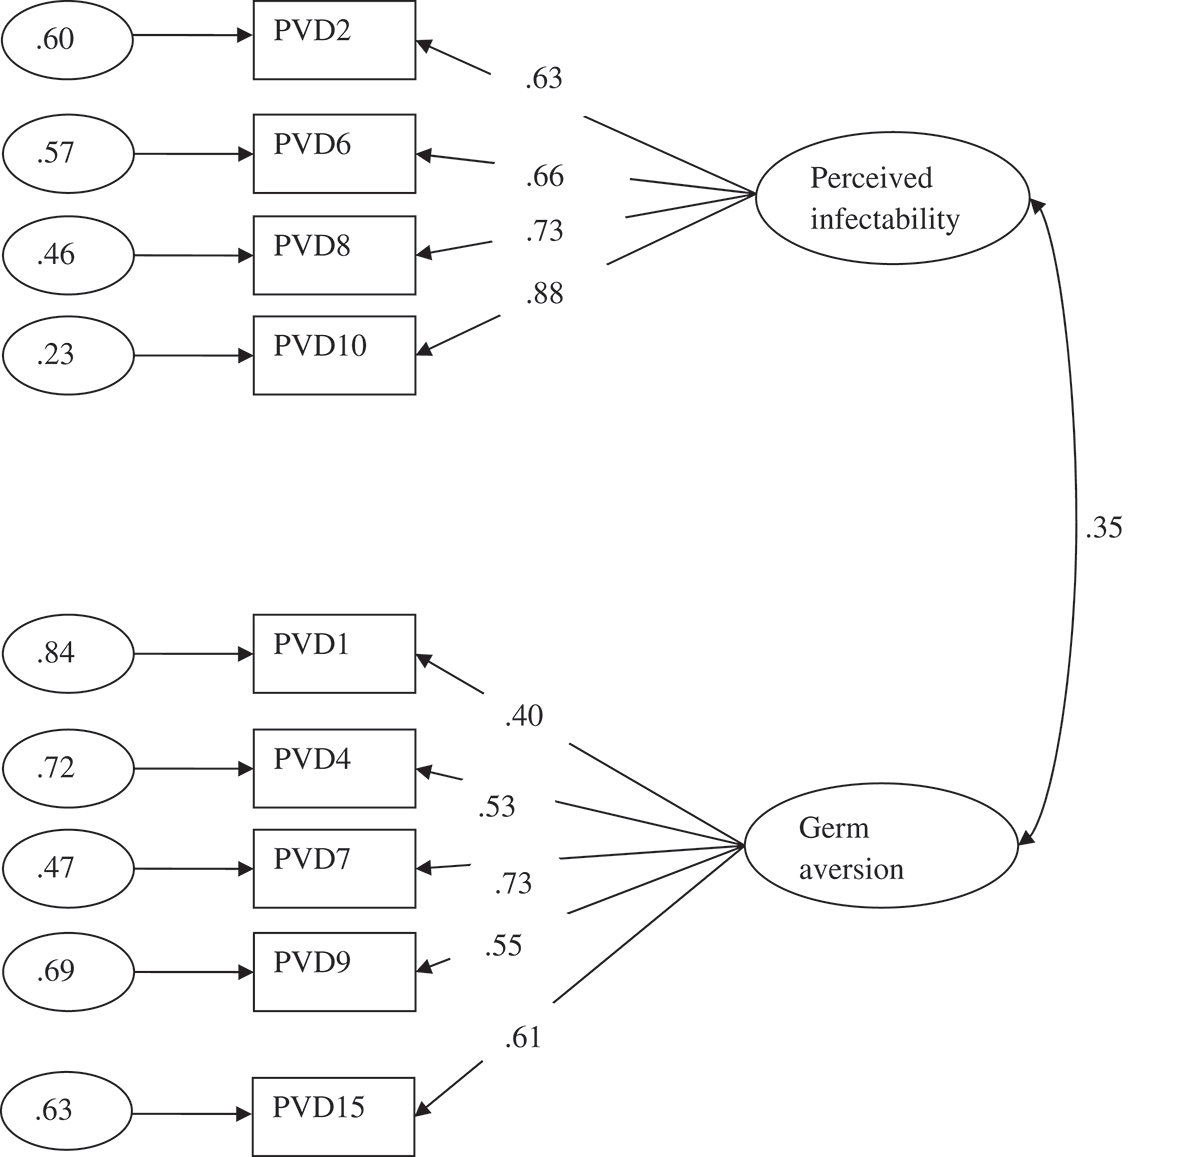
In order to check if there was a method effect (i.e., defects in the method of assessing a construct) and to make sure of the adequacy of the elimination of the inverse items, a third hypothetic factor grouping the reverse items was made (model 3). As can be seen in Table 2, although the RMSEA showed a better value, most of the fit indexes were better in the proposed model (model 2). Additionally, the change in chi-square was significant and it was the most parsimonious. Furthermore, the content of the reverse items was reviewed and they had the same meaning as the direct items. Therefore, the construct of each factor was adequately represented by the direct items retained in the proposed model (model 2).
Finally, the differences between the proposed model (model 2) and an alternative one-factor model (model 4) were tested. As can be seen in Table 2, this model showed a poorer fit.
Cronbach’s alphas
Once the factors had been established via the confirmatory analysis, the Cronbach’s alpha of the complete scale (nine items) was estimated, as the authors did in the original version, although the CFA revealed the existence of two subscales. The overall reliability of the scale was .68. Additionally, the reliability of the two subscales was calculated. The Cronbach’s alpha of subscale perceived infectability was .74 and for germ aversion was .60.
Conclusions
This study reveals that the Perceived Vulnerability to Disease scale (PVD) is a questionnaire that can be used in the Spanish-speaking community to measure beliefs about personal susceptibility to the transmission of infectious diseases and the emotional discomfort associated with the potential disease transmission.
However, in the Spanish version of the scale, one limitation found was the low reliability shown by reverse items. It is recognized that the assessment procedure might itself represent a source of construct invalidity (Fiske, 1987). Furthermore, some of these reverse items also began with a negative sentence, which is not recommended psychometrically (Martínez, Moreno, & Muñiz, 2005). In addition, some authors claim that reverse items are hard to understand and are a potential source of bias (van Sonderen, Sanderman, & Coyne, 2013). Therefore, these items were removed. This decision was taken based both on the comparison of alternative models and on the study of the content of the items. It was concluded that the content of the constructs was adequately measured by the remaining direct items and the results of the CFA showed that the scale without these items had evidence of construct validity.
Judging from the results, this short scale of nine items has a factorial structure of two subscales (perceived infectability and germ aversion), as shown by the confirmatory factorial analysis performed. Likewise, the reliability of both the total scale and the subscales is appropriate given the Cronbach’s alphas found (Kline, 2000) although the internal consistencies obtained in the Spanish sample (.68, .74 and .60) are lower than the ones obtained by the original authors (.82, .87 and .74). Additionally, it was found that the different subscales were positively related to each other, as shown by the analyses performed, as the original authors did (Duncan et al., 2009).
Therefore, the results reveal two conceptually distinct factors measured with psychometric guarantees by nine items. One factor measured by four items assesses individuals’ beliefs about susceptibility to infectious diseases (perceived infectability). The second factor measured by five items assesses individuals’ discomfort in situations that connote an increased likelihood for the transmission of pathogens (germ aversion).
Study 2
The PVD has been included in several recent investigations (see for example, Magallares et al., 2015). Among them, it has been found that perceived vulnerability to disease is related to the expression of antifat attitudes (Park, Schaller, & Crandall, 2007). This result is especially interesting because some authors argue that obesity may be spread through social ties (Christakis & Fowler, 2007) and that important similarities exist between the symptoms of obesity and contagious illnesses (Whigham, Israel, & Atkinson, 2006). In other words, the obesity epidemic may be explained by the social contagion of this disease (Ejima, Aihara, & Nishiura, 2013). Recently, it has been found that beverages created by obese children were more likely to result in feelings of sickness when they were assessed by the normal-weight participants of the study (Klaczynski, 2008), a result related to the role of contagion and magical beliefs literature (Rozin, Markwith, & Nemeroff, 1992). According to Klaczynski (2008), this finding implies a connection between obesity and abstract notions related to contagious diseases. In this line of thinking, it has been argued that antifat attitudes may be related to the perceived vulnerability to disease in a symbolic manner (Klaczynski, 2008). For these reasons, we believe that it is especially relevant to analyse the relationship that exists between prejudice towards obesity and perceived vulnerability to disease.
Additionally, it has been found that perceived vulnerability to disease is also positively related to disgust (Tybur, Lieberman, & Griskevicius, 2009). According to experts, disgust may be defined as a basic emotion that is elicited when people encounter a physical, sexual or moral contaminant which motivates distancing from the object (Oaten, Stevenson, & Case, 2009). Some authors suggest that disgust may have evolved to perform the function of disease avoidance (Tybur et al., 2009). Recently, it has been found that both disgust and perceived vulnerability to disease were related to the expression of antifat attitudes (Magallares & Morales, in press).
Finally, there is evidence to suggest that mere reference to a disease-label in the case of AIDS was sufficient to provoke avoidance (Park et al., 2003). The literature shows that HIV-related stigma is associated with the perception of threat implied by the infection. This occurs because of its perceived severity and also because there are misconceptions about the pathways of transmission, which determine the perception that the infection is easily acquired through social contact (Fuster, Molero, Gil De Montes, Agirrezabal, & Vitoria, 2013). For example, in Spain, almost 29% of the population would avoid a person with HIV in some situations of daily life (Fuster-RuizdeApodaca et al., 2014).
Therefore, the goal of the Study 2 was to analyse the criterion validity of the PVD scale (Duncan et al., 2009). For this reason, the relationship that may exist between negative attitudes towards people with weight problems, disgust and prejudice towards people with AIDS and perceived vulnerability to disease was studied.
Method
Sample
The sample was made up of 434 participants with an average age of 31.30 (SD = 9.58) and an age range between 18 and 45. 50.2% of the participants were between 18 and 29 years old. Of the total participants, 78 were male and 356 were female. All the participants were students at UNED. All of them voluntarily agreed to participate in the study.
Procedure
The same recruitment procedure for participants of Study 1 was used.
Instruments
The adapted version with nine items of the PVD (Duncan et al., 2009) conducted in Study 1 was used to measure perceived vulnerability to disease. The overall reliability of the scale was .70. Additionally, the reliability of the two subscales was calculated. The Cronbach’s alpha of subscale perceived infectability of four items was .80 and for germ aversion of five items was .57.
To measure antifat attitudes the Dislike subscale of the Antifat Attitudes questionnaire (AFA) (English version: Crandall, 1994; Spanish version: Magallares & Morales, 2014) was used. The Dislike subscale of the AFA evaluates negative attitudes towards overweight and obese individuals (Example: ‘I really don’t like fat people much’). This subscale of AFA (α = .75) consists of seven items scored on a seven-point Likert scale ranging from ‘strongly disagree’ (1) to ‘strongly agree’ (7). Higher scores on the Dislike subscale of AFA scale reflect greater antipathy towards obese people.
To measure disgust, The Three-Domain Disgust Scale (TDDS) was used (English version: Tybur et al., 2009; Spanish version: Sandin et al., 2013). This scale consists of 21 items rated on a seven-point Likert-like scale ranging from ‘not disgusting at all’ to ‘extremely disgusting’. This scale has three factors: pathogen, sexual and moral disgust. A score was computed by averaging the seven items of the pathogen disgust subscale (α = .72). An example of pathogen disgust would be ‘Sitting next to someone who has red sores on their arm’. Higher scores on this measure reflect greater physical disgust. A score was computed by averaging the seven items of the sexual disgust subscale (α = .80). An example of sexual disgust would be ‘An opposite-sex stranger touching your thigh in an elevator’. Higher scores on this measure reflect greater sexual disgust. A score was computed by averaging the seven items of the moral disgust subscale (α = .80). An example of moral disgust would be ‘Intentionally lying during a business transaction’. Higher scores on this measure reflect greater moral disgust.
To measure negative attitudes towards people with AIDS, the People with AIDS subscale of the Spanish questionnaire HIV Attitudes-Scale (HIV-AS) (Espada et al., 2013) was used. The People with AIDS subscale of the HIV-AS evaluates negative attitudes towards individuals with AIDS (Example: ‘If a friend became infected with HIV, I probably would distance myself from him’). This subscale of HIV-AS (α = .82) consists of three items scored on a seven-point Likert scale ranging from ‘strongly disagree’ (1) to ‘strongly agree’ (7). Higher scores on the People with AIDS subscale of HIV-AS scale reflect greater dislike towards people with AIDS.
Data analysis
To analyse the criterion validity of the adapted version of the Spanish version of the PVD, the relationship between between antifat attitudes, disgust and negative attitudes towards people with HIV or AIDS and perceived vulnerability to disease was studied using Pearson’s correlations.
The SPSS 19 (SPSS 19.0, SPSS Inc, Chicago, IL) was used.
Results
Correlations between the variables in Study 2.
Note: Perc. infectability: Perceived infectability; AFA: Antifat Attitudes; Pathogen: pathogen disgust; Moral: moral disgust; Sexual: sexual disgust; AIDS: negative attitudes towards AIDS. *p < .05 **p < .01.
Conclusions
It has been found that only germ aversion is related to antifat attitudes. This result is consistent with evidence that germ aversion is associated with negative evaluations of people characterized by morphological anomalies (Park et al., 2003), including people with weight problems (Park et al., 2007). Additionally, germ aversion is also positively related to the three domains of disgust (Tybur et al., 2009) and with negative attitudes towards people with HIV or AIDS (Park et al., 2003), which confirms what has been found in the reviewed literature. In the case of perceived infectability, the correlations are lower, and just significant for pathogen and sexual disgust, and with negative attitudes to people with HIV or AIDS. This last result is consistent with studies that have found that the perceived threat of the disease, especially the beliefs about the HIV transmission through social contact, is associated with HIV-related stigma (Fuster et al., 2013).
As a limitation of this study, it is important to note the low internal consistency of the germ aversion subscale (α = .57) compared to the original version (α = .74). One possible reason for this relatively low value might be the combination of standard deviations and the few items that integrate the factor. However, both the theoretical relevance of the factor and the model good fit to the data attenuate this limitation because in structural equation modelling what is tested is the model as a whole and not its parameters. This is because it is more important to build theory than data (Jöreskog & Sörbom, 1996). However, it will be necessary to consider the effects that the low internal consistency could have in the attenuation of correlations (Martínez, Hernández, & Hernández, 2006) and thus the predictive capability of this factor.
In addition, observing the correlations obtained, it seems that pathogen disgust may be mediating the relationship between perceived vulnerability to disease and negative attitudes towards AIDS, as well as between germ aversion and negative attitudes towards obese individuals and people with AIDS. Future research should address this issue.
General discussion
According to the results obtained, it can be said that the goals of these studies — to obtain evidence of construct and criterion validity of the PVD questionnaire — were fulfilled. As was pointed out before, we first obtained evidence of construct validity confirming the factorial structure proposed by Duncan et al. (2009) in the Spanish population. It is important to remark that the original authors that developed the questionnaire (Duncan et al., 2009) did not use a CFA to test the factorial structure of the scale, so, as far as we know, the results of the current investigation are the first to use this technique to test the factorial structure of the PVD. Secondly, we obtained evidence of criterion validity because it has been shown that antifat attitudes, disgust and negative attitudes towards people with AIDS are linked with germ aversion and just modestly related to perceived infectability. It is important to remark that, through the analysis of the criterion validity of the PVD scale, we have obtained a relevant psychosocial knowledge about the relationships of the perceived vulnerability of the disease with the prejudice towards obese people and people with HIV. For all these reasons, we believe that based on the information presented in the preceding sections, the PVD questionnaire can be safely used to measure beliefs about personal susceptibility to the transmission of infectious diseases.
As mentioned in the introduction, it is important to stress that the PVD (Duncan et al., 2009) is not the only scale used by the scientific community to measure perceived vulnerability to disease. For example, we have mentioned the Whiteley Index (WI) (Conradt et al., 2006) and the Health Anxiety Inventory (Salkovskis et al., 2002) but as we have said before, these instruments are usually used in clinical settings and do not measure worries about contagious diseases specifically. Regardless, we believe that the scale presented in this study can be used with psychometric guarantees for measuring beliefs about personal susceptibility to the transmission of infectious diseases, as revealed throughout this article, although we also think that it is important for professionals to be aware of the existence of other instruments and for them to choose the tool they deem the most useful.
These studies have at least two limitations. First of all, as has been said in the method section, the samples were made up of university students. We believe that it would have been worthwhile to use participants from other social strata or with lower educational levels in order to make the sample as heterogeneous as possible. For example, the differences in certain sociodemographic characteristics, such as the higher level of studies or the lower age, could affect the results because there are studies which found that people with higher level of education and the youngest express a lower degree of rejection towards people with HIV (Fuster et al., 2013). For this reason, the data provided should be interpreted in the light of these limitations. However, it is important to remark that the students at UNED have some special characteristics — some of them are working and are on average older than typical students (28 and 31 in our studies respectively) — that made them more similar to the general population than other university samples. In second place, the ratio of women to men in our samples (Study 1: 284 males vs 460 females; Study 2: 78 males vs 356 females) should be more similar to the one in the general population. Regardless, it is important to remark that Duncan et al. (2009) developed the test using a sample of students where the proportion of women was higher (405 males vs 1,134 females). Despite this, it would be necessary to conduct crossed validation of the results in future studies. We believe that this limitation may be a problem because, for example, men report more antifat attitudes than women (Magallares & Morales, 2013). In third place, our work and the studies cited in this paper on explicit attitudes towards members of stigmatized groups are limited because they assess only consciously held evaluations, which are subject to social desirability. It has been suggested that people may not report negative attitudes towards individuals with obesity or AIDS if they feel it is not appropriate to do so. For this reason, social psychologists are very interested in implicit attitudes in order to have a less biased evaluation of different forms of stigma (Hinman, Burmeister, Kiefner, Borushok, & Carels, 2015).
Despite these limitations, we believe that the PVD (Duncan et al., 2009) could be an appropriate tool for measuring beliefs about personal susceptibility to the transmission of infectious diseases. We think this instrument may be useful for all researchers in the Spanish-speaking community who are interested in studying perceived vulnerability to disease. As was pointed out before, the reviewed literature shows the importance of perceived vulnerability to disease in the explanation of different social relevant questions. For this reason, Spanish scholars interested in the study of prejudice towards different stigmatized groups may benefit from the Spanish version of the PVD. In the current work, prejudices towards obese individuals and people with HIV have been studied but other groups may be analysed in relation to perceived vulnerability to disease. We believe that knowing the role of the perceived vulnerability to the disease in the prejudice suffered by different stigmatized groups may be useful to design psychosocial interventions aimed to reduce this problem. For example, recently it has been shown that different forms of disease protection attenuated the relationship between concerns about disease and prejudice against stigmatized groups (Huang, Sedlovskaya, Ackerman, & Bargh, 2011).
Propiedades psicométricas y validez de criterio de la escala de Percepción de Vulnerabilidad a la Enfermedad (PVE en población española)
Las enfermedades infecciosas han constituido una amenaza para los seres humanos desde el principio de su existencia (Morens & Fauci, 2013). Investigaciones empíricas recientes sugieren que la amenaza que suponen las enfermedades infecciosas tiene importantes implicaciones en diferentes resultados psicológicos. Por ejemplo, algunos estudios muestran que existen diferencias individuales en la preocupación crónica por la transmisión de enfermedades (Schaller & Duncan, 2007). Según algunos autores, estas diferencias individuales están relacionadas con temas relevantes en Psicología Social tales como actitudes etnocéntricas (Navarrete & Fessler, 2006), antipatía hacia individuos con discapacidades físicas (Park, Faulkner, & Schaller, 2003) y preferencia por las características faciales asociadas a la buena salud (Welling, Conway, DeBruine, & Jones, 2007).
La bibliografía al respecto muestra que se pueden utilizar dos tipos de medidas auto-informe para evaluar la vulnerabilidad percibida a las enfermedades infecciosas. En primer lugar, existen instrumentos diseñados para evaluar la hipocondría y otros tipos de ansiedad relacionadas con la salud. Estos instrumentos miden las creencias del individuo sobre su vulnerabilidad frente a la enfermedad, pero se centran en posibles problemas de salud muy específicos y no en las propias enfermedades infecciosas. Por ejemplo, el índice Whiteley (Conradt, Cavanagh, Franklin, & Rief, 2006) y el Inventario de Ansiedad sobre la Salud (Salkovskis, Rimes, Warwick, & Clark, 2002) son dos de los instrumentos más ampliamente utilizados para medir la preocupación y las creencias hipocondríacas sobre la salud. Es importante señalar que en la edición actualizada del Manual de Diagnóstico y Estadística de los Trastornos Mentales (DSM-V; American Psychiatric Association, 2013), la hipocondría y diversas enfermedades relacionadas han sido reemplazadas por dos nuevos conceptos derivados empíricamente como el trastorno somatomorfo y el trastorno de ansiedad sobre la enfermedad. De cualquier modo, el problema con estos instrumentos es que están diseñados típicamente para el diagnóstico clínico y, por ello, no suelen utilizarse con la población general.
En segundo lugar, existe un instrumento diseñado para evaluar la vulnerabilidad percibida a la enfermedad (Duncan, Schaller, & Park, 2009). La Escala de Percepción de Vulnerabilidad a la Enfermedad (PVE) evalúa las creencias sobre la vulnerabilidad personal a la transmisión de enfermedades infecciosas y el malestar emocional asociado a la posibilidad de transmisión de enfermedades. Esta herramienta ha demostrado poseer buenas propiedades psicométricas, por lo que puede utilizarse con la población general (Duncan et al., 2009). Es importante señalar que esta escala se centra en las enfermedades infecciosas y no en los problemas de salud, como las mencionadas anteriormente. Por este motivo, creemos que la PVE (Duncan et al., 2009) es la herramienta más útil que existe en la actualidad para medir la percepción de vulnerabilidad a la enfermedad.
Como se ha señalado anteriormente, la bibliografía muestra que la percepción de vulnerabilidad a la enfermedad es un buen predictor del prejuicio frente a diversos grupos estigmatizados (véase, por ejemplo, Navarrete & Fessler, 2006). Por tanto, creemos que resulta de especial interés analizar el papel que la PVE podría desempeñar en la explicación del prejuicio respecto a distintos grupos sociales. Dicho de otro modo, los principales objetivos de este trabajo son, por un lado, adaptar la escala PVE al español y, por otro, analizar su relación con otras variables sociales relevantes.
Estudio 1
En España no se había realizado ninguna adaptación de la escala PVE hasta la fecha. Por tanto, un objetivo de esta investigación es conseguir evidencia de validez de una versión española de la escala PVE (Conradt, Cavanagh, Franklin, & Rief, 2006). Para ello, primero realizamos un análisis factorial confirmatorio (AFC) para verificar la estructura factorial propuesta por Duncan et al. (2009) y, a continuación, establecimos los criterios psicométricos de la PVE para validar el uso de este instrumento por la comunidad académica hispanohablante. Es importante mencionar que cuando existen hipótesis plausibles sobre la estructura de un modelo, como en nuestro caso, los expertos recomiendan utilizar el AFC como una opción mejor que el análisis exploratorio (Bollen, 1989).
Método
Muestra
La muestra estaba formada por 744 participantes con una media de edad de 28.69 (DT = 9.95) y un rango de edad de entre 18 y 45 años. El 56.5% de los participantes tenían entre 18 y 29 años. Del total de participantes, 284 eran hombres y 460 mujeres. Todos ellos eran estudiantes de la Universidad Nacional de Educación a Distancia (UNED), y todos ellos aceptaron voluntariamente participar en el estudio.
Procedimiento
Los investigadores publicaron información sobre el estudio en los cursos virtuales que impartían para solicitar la participación de quienes estuviesen interesados. Los alumnos que formaron la muestra final tenían que completar los cuestionarios en línea. Debido a las características de la universidad en la que se llevó a cabo el estudio (UNED), los datos obtenidos provenían de todas las provincias españolas. Los cuestionarios se respondieron de manera anónima.
Instrumentos
El cuestionario PVE (Duncan et al., 2009) fue adaptado al español utilizando el método traducción/retraducción estipulado por muchos autores (Gudmundsson, 2009) y por las normas de la Comisión Internacional de Test (Hambleton, 2005).
Uno de los autores llevó a cabo la primera traducción española de las escalas originales. Esta traducción fue después revisada independientemente otro evaluador que trabajó con el primer traductor para alcanzar una traducción consensuada de los ítems, especialmente los que presentaban mayor dificultad desde un punto de vista semántico o gramatical. A continuación, un traductor bilingüe de inglés retradujo el texto consensuado de nuevo al inglés, sin conocimientos previos de las escalas originales, para preservar la fiabilidad de la retraducción. La escala retraducida al inglés y la escala original presentaron casi un 100% de concordancia gramatical.
Ítems de la Escala de Percepción de Vulnerabilidad a la Enfermedad (PVE): Versión original en inglés y versión española.
Nota: 1 Ítems de la versión española corta; r = valoración inversa.
Análisis de datos
En primer lugar, llevamos a cabo un análisis factorial confirmatorio (AFC) para evaluar el ajuste de la estructura factorial propuesta por los autores de la escala original (Duncan et al., 2009) en la versión española de la escala. Por su robustez, utilizamos el método de mínimos cuadrados no ponderados, dado que los factores de la escala no cumplían el supuesto de normalidad. Para determinar la bondad de ajuste, utilizamos los siguientes índices: Chi cuadrado de Satorra-Bentler, índice de bondad de ajuste (GFI), índice de bondad de ajuste incremental (AGFI), residuo cuadrático medio estandarizado (SRMR), error medio cuadrático de aproximación (RMSEA) e índice de ajuste comparativo (CFI), índice de ajuste normado (NFI), índice de ajuste no normado (NNFI), índice de ajuste incremental (IFI) y coeficiente de Aikake (CAIC). Según los expertos, valores por debajo de .05 en el RMSEA, ≤ .08 en el SRMR y mayores de .95 en los índices GFI, CFI, NFI, NNFI y IFI, indican un buen ajuste (Kline, 2011). No obstante, es importante mencionar que, según Hair, Anderson, Tatham, y Black (1998), valores inferiores a .05 para el RMSEA indican un ajuste aceptable, y valores inferiores a .10 indican un ajuste razonable. Browne y Cudeck (1993) también defienden que un ajuste menor o igual a .08 es razonable. Por último, en el caso de los índices GFI, AFGI y CFI, Bentler y Bonnet (1980) estipularon que valores iguales o mayores de .90 indican un buen ajuste. El CAIC es un buen índice de ajuste para la comparación de modelos y la norma general es que cuanto menores sean los valores, mejor (Schreiber, Nora, Stage, Barlow, & King, 2006). El tamaño de la muestra se estimó suficiente, dado que la relación entre el número de participantes y el número de ítems era mayor de 45:1 (Bentler & Chou, 1987).
En segundo lugar, para analizar las propiedades psicométricas de la PVE (Duncan et al., 2009), decidimos calcular los correspondientes coeficientes alfa de Cronbach, un coeficiente utilizado para medir la fiabilidad de una escala, tanto de la escala en su conjunto como de las subescalas que la componen (Cronbach & Shavelson, 2004). Según Kline (2000), una fiabilidad entre .70 y .90 es buena, y entre .60 y .70 es aceptable.
Para realizar los AFC, se utilizaron los programas PRELIS y LISREL 8.8 (Jöreskog & Sörbom, 2006) y para los análisis restantes, se utilizó el programa SPSS 19 (SPSS 19.0, SPSS Inc, Chicago, IL).
Resultados
Análisis factorial confirmatorio
Índices de ajuste del modelo propuesto y de los modelos alternativos.
Nota: 1Cambio en Chi cuadrado entre el modelo propuesto (Modelo 1) y el resto de modelos alternativos propuestos.
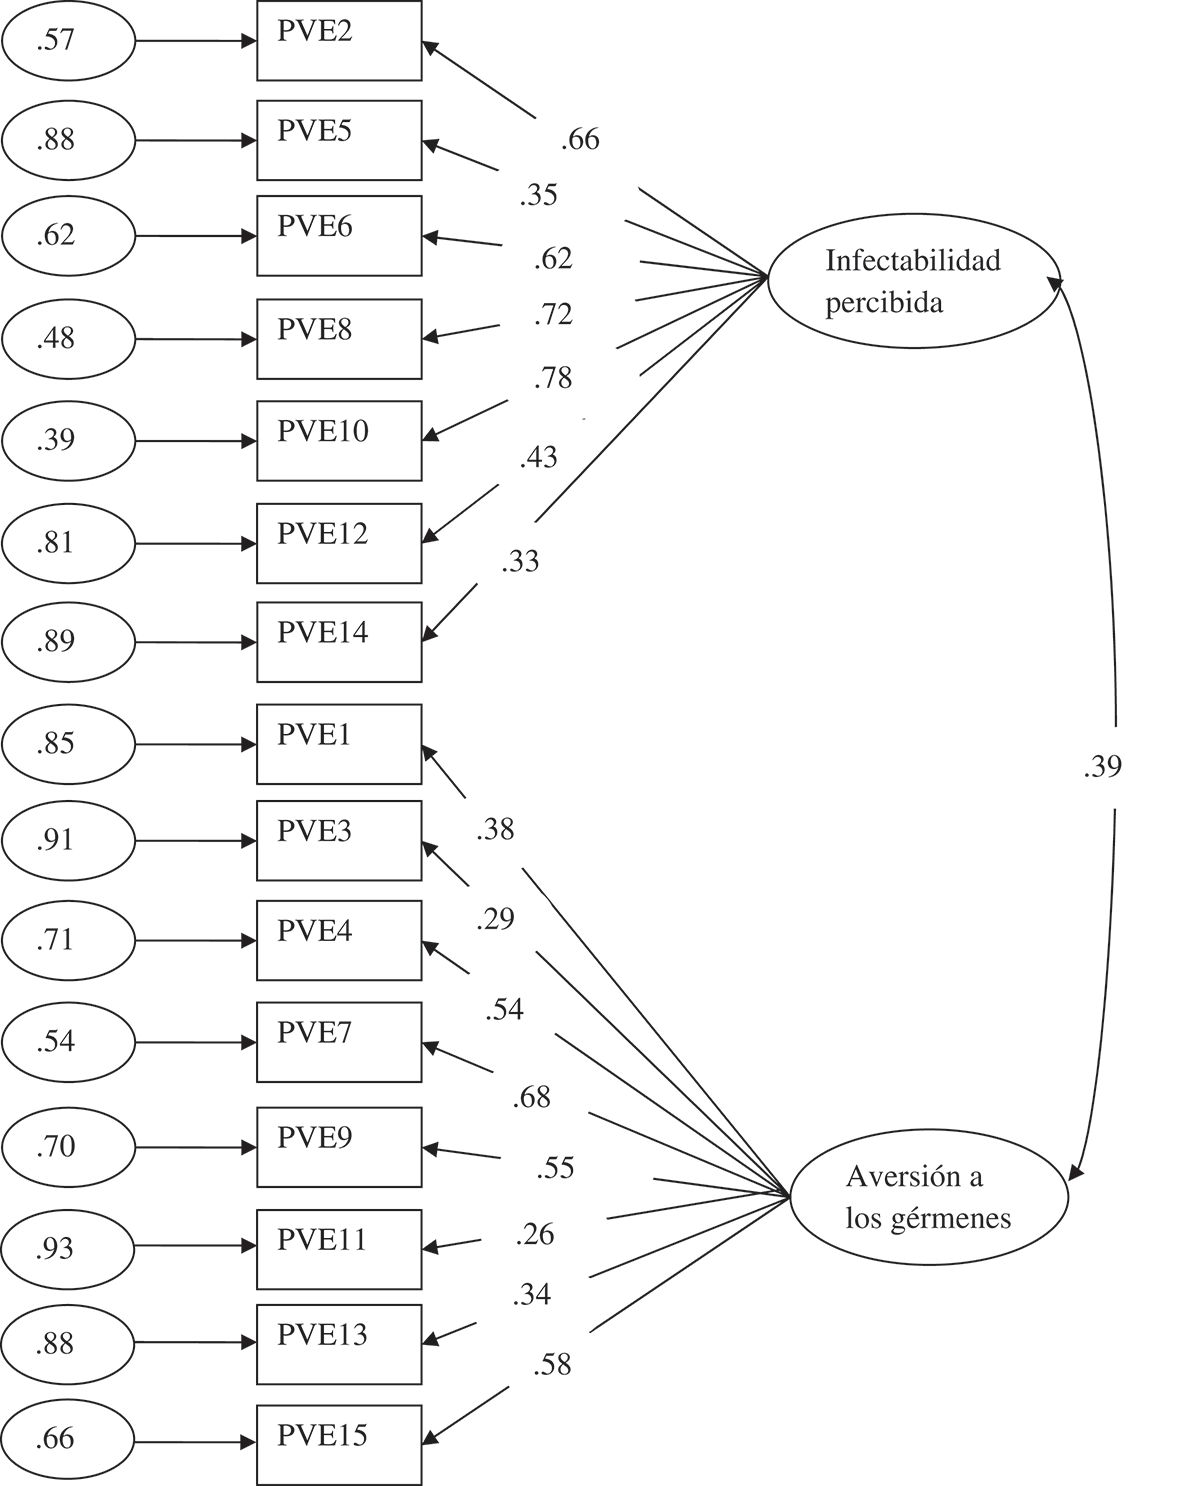
Resultados del análisis factorial confirmatorio. Modelo con todos los ítems de la escala original. Solución estandarizada.
Por tanto, se eliminaron los ítems inversos y se realizó un nuevo AFC sin ellos (modelo 2). Como puede verse en la Tabla 2, el ajuste del modelo mejoró considerablemente y significativamente. Además, todos los parámetros del modelo eran estadísticamente significativos (p < .05), y los coeficientes estandarizados, por lo general, presentaban valores adecuados, aunque moderados en el caso del ítem 1 (Figura 2). Resultados del análisis factorial confirmatorio. Modelo sin los ítems inversos de la escala original. Solución estandarizada.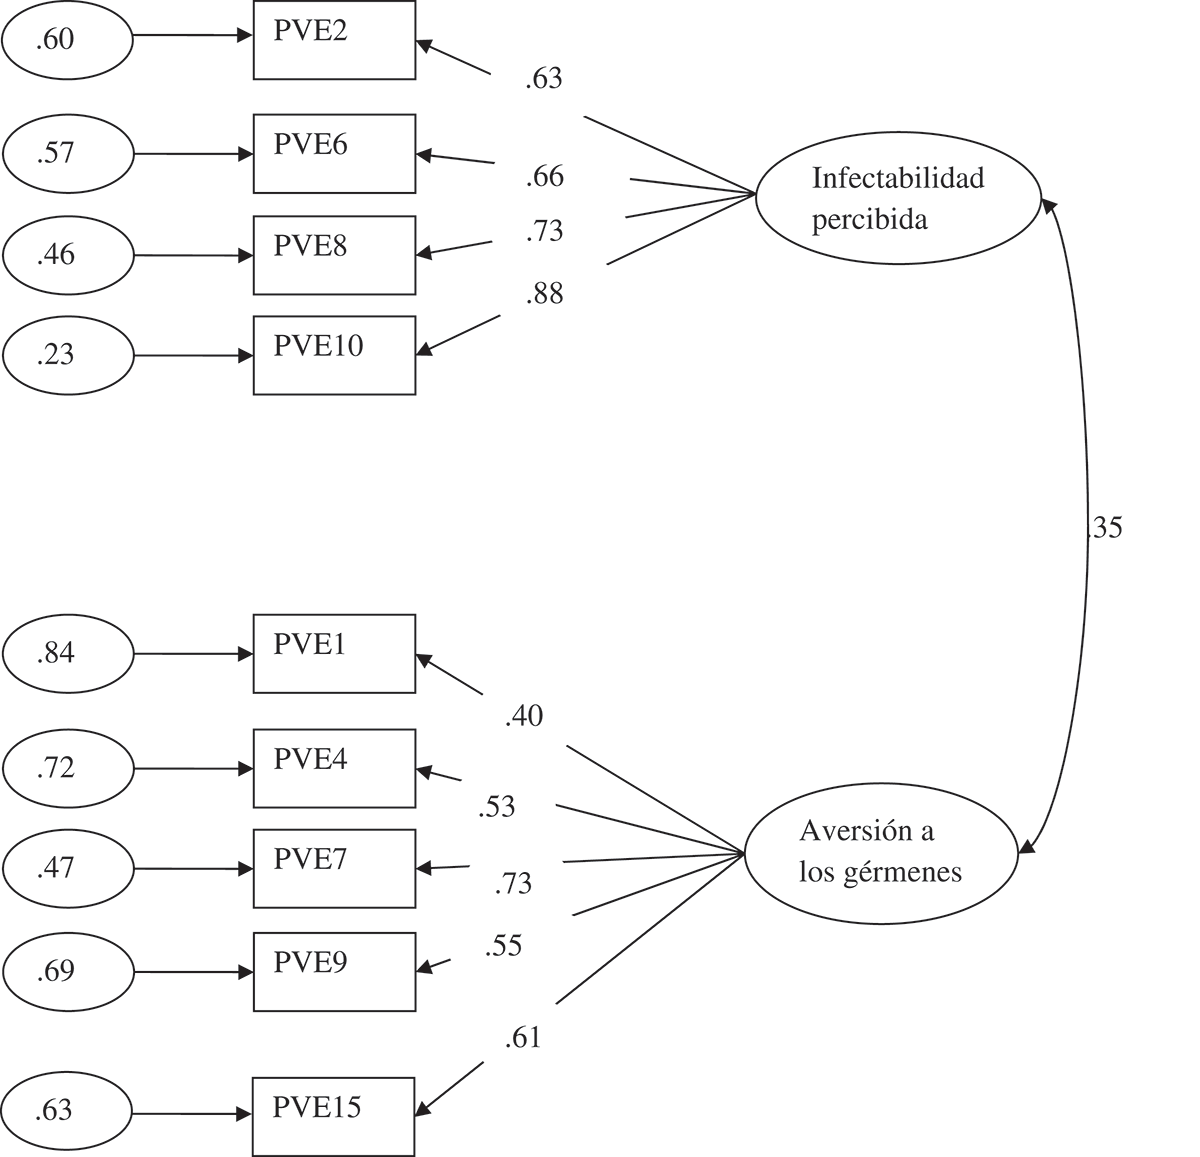
Para comprobar si existía un efecto del método (defectos en el método de evaluar un constructo) y para asegurar la adecuación de la supresión de los ítems inversos, se elaboró un tercer factor hipotético agrupando los ítems inversos (modelo 3). Como puede observarse en la Tabla 2, aunque el RMSEA mostraba un valor más adecuado, la mayor parte de los índices de ajuste eran mejores en el modelo propuesto (modelo 2). Además, el cambio en Chi cuadrado era significativo, mostrando mayor parsimonia. Asimismo, se revisó el contenido de los ítems inversos y se comprobó que tenían el mismo significado que los ítems directos. Por tanto, en el modelo propuesto (modelo 2), los ítems directos representaban el constructo de manera adecuada.
Por último, se comprobaron las diferencias entre el modelo propuesto (modelo 2) y un modelo unifactorial alternativo (modelo 4). Como puede verse en la Tabla 2, el ajuste de este modelo era menos satisfactorio.
Alfa de Cronbach
Una vez establecidos los factores a través de un análisis confirmatorio, se calculó el alfa de Cronbach de la escala completa (nueve ítems), como habían hecho los autores en la versión original, aunque el AFC reveló la existencia de dos subescalas. La fiabilidad de la escala era de .68. También calculamos la fiabilidad de las dos subescalas; cuyos coeficientes alfa de Cronbach fueron de .74 para la subescala de infectabilidad percibida y .60 para la de aversión a los gérmenes.
Conclusiones
Este estudio revela que la escala de Percepción de Vulnerabilidad a la Enfermedad (PVE) puede ser utilizada en la comunidad hispanohablante para medir las creencias sobre la vulnerabilidad personal a la transmisión de enfermedades infecciosas y el malestar emocional asociado a una posible transmisión.
Sin embargo, en la versión española de la escala, una de las limitaciones observadas fue la fiabilidad de los ítems inversos. Es conocido que el proceso de evaluación podría representar una fuente de invalidez del constructo (Fiske, 1987). Además, algunos de estos ítems inversos también comenzaban con un enunciado negativo, algo poco recomendable psicométricamente (Martínez, Moreno, & Muniz, 2005). Asimismo, algunos autores defienden que los ítems inversos son difíciles de comprender y, por tanto, constituyen una posible fuente de sesgo (van Sonderen, Sanderman, & Coyne, 2013). Por esta razón, los ítems inversos fueron suprimidos. Esta decisión se basó tanto en la comparación de los modelos alternativos como en el estudio del contenido de los ítems. Concluimos, pues, que el contenido de los constructos se podía medir de un modo adecuado a través de los ítems directos restantes, y los resultados del AFC confirmaron que la escala sin los ítems inversos evidenciaba la validez de constructo.
A la luz de los resultados, la escala reducida de nueve ítems muestra una estructura factorial de dos subescalas (infectabilidad percibida y aversión a los gérmenes), como puede observarse por el AFC realizado. Asimismo, tanto la fiabilidad de la escala completa como la de las dos subescalas arrojan valores apropiados, dado sus correspondientes alfas de Cronbach (Kline, 2000), si bien las consistencias internas obtenidas con la muestra española (.68, .74 y .60) son inferiores a las obtenidas por los autores originales (.82, .87 y .74). Se observó también que las diferentes subescalas mostraban relaciones positivas entre ellas, como muestran los análisis realizados, como era el caso en el estudio original (Duncan et al., 2009).
Por tanto, los resultados revelan dos factores conceptualmente diferentes medidos con total garantía psicométrica a través de los nueve ítems. Uno de los factores, medido por medio de cuatro ítems, evalúa las creencias individuales sobre la vulnerabilidad a las enfermedades infecciosas (infectabilidad percibida). El segundo factor, medido por medio de cinco ítems, evalúa el malestar individual en situaciones que conllevan mayor riesgo de transmisión de patógenos (aversión a los gérmenes).
Estudio 2
La PVE ha sido utilizada en varias investigaciones recientes (véase, e.g., Magallares et al., 2015). Entre sus resultados, se ha observado que la percepción de vulnerabilidad a la enfermedad está relacionada con la expresión de actitudes antiobesos (Park, Schaller, & Crandall, 2007). Este resultado resulta de especial interés, puesto que algunos autores proponen que la obesidad podría extenderse a través de lazos sociales (Christakis & Fowler, 2007) y que existen importantes similitudes entre los síntomas de la obesidad y los de las enfermedades contagiosas (Whigham, Israel, & Atkinson, 2006). Dicho de otro modo, la epidemia de obesidad actual podría explicarse por el contagio social de la enfermedad (Ejima, Aihara, & Nishiura, 2013).
Recientemente se observó que las bebidas preparadas por niños obesos tenían mayor probabilidad de ser valoradas como causantes de malestar por los participantes del estudio con un peso normal (Klaczynski, 2008), resultado que la bibliografía relaciona con el papel del contagio y de las creencias mágicas (Rozin, Markwith, & Nemeroff, 1992). Según Klaczynski (2008), este hallazgo implica una conexión entre la obesidad y algunas nociones abstractas relacionadas con las enfermedades contagiosas. En esta misma línea, se ha sugerido que las actitudes antiobesos podrían estar relacionadas de una manera simbólica con la percepción de vulnerabilidad a la enfermedad (Klaczynski, 2008). Por eso creemos que es particularmente relevante analizar la relación entre el prejuicio contra la obesidad y la percepción de vulnerabilidad a la enfermedad.
Además, se ha observado que la percepción de vulnerabilidad a la enfermedad está relacionada positivamente con el asco (Tybur, Lieberman, & Griskevicius, 2009). Según los expertos, el asco puede definirse como la emoción producida cuando las personas se enfrentan a un contaminante físico, sexual o moral que provoca el distanciamiento del objeto que la produce (Oaten, Stevenson, & Case, 2009). Algunos autores sugieren que el asco puede haber evolucionado para desempeñar la función de prevención de la enfermedad (Tybur et al., 2009). Recientemente se ha descubierto que tanto el asco como la percepción de vulnerabilidad a la enfermedad están relacionados con la expresión de conductas antiobesos (Magallares & Morales, en prensa).
Por último, existen evidencias que apuntan a que la mera referencia al nombre de una enfermedad, en el caso del SIDA, es suficiente para producir el rechazo (Park et al., 2003). La bibliografía relevante muestra que el estigma inherente al VIH está asociado con la percepción de la amenaza de infección. Esto ocurre debido a la percepción de su gravedad, y también por las falsas creencias sobre su transmisión, que dan lugar a la percepción de que la transmisión ocurre con facilidad a través del contacto social (Fuster, Molero, Gil De Montes, Agirrezabal, & Vitoria, 2013). Por ejemplo, en España, casi un 29% de la población evitaría a una persona con VIH en algunas situaciones de la vida cotidiana (Fuster-RuizdeApodaca et al., 2014).
Por consiguiente, el objetivo del Estudio 2 era analizar la validez de criterio de la escala PVE. Por tanto, procedimos a estudiar la relación que pudiese existir entre las actitudes negativas frente a las personas con problemas de peso, el asco y el prejuicio contra las personas con SIDA y la percepción de vulnerabilidad a la enfermedad.
Método
Muestra
La muestra estaba compuesta por 434 participantes con una media de edad de 31.30 (DT = 9.58) y un rango de edad de entre 18 y 45 años. El 50.2% de los participantes tenían entre 18 y 29 años. Del total de participantes, 78 eran hombres y 356 mujeres. Todos los participantes eran estudiantes de la UNED y todos ellos participaron de manera voluntaria en el estudio.
Procedimiento
Se siguió el mismo procedimiento que en el Estudio 1.
Instrumentos
Utilizamos la misma versión adaptada de nueve ítems del PVE (Duncan et al., 2009) utilizada en el Estudio 1 para medir la percepción de vulnerabilidad a la enfermedad. La fiabilidad general de la escala era de .70. También calculamos la fiabilidad de las dos subescalas: el alfa de Cronbach de la subescala de infectabilidad percibida, de cuatro ítems, era .80, mientras que para la subescala de aversión a los gérmenes era de .57.
Para medir las actitudes antiobesos, recurrimos a la subescala Antipatía del cuestionario Actitud Antiobesos (Antifat Attitudes, AFA; versión inglesa: Crandall, 1994; versión española: Magallares & Morales, 2014). Esta subescala del AFA evalúa las actitudes negativas frente a las personas obesas y con sobrepeso (e.g., ‘No me gustan mucho las personas obesas’). La subescala (α = .75) se compone de siete ítems puntuados sobre una escala tipo Likert que va de (1) ‘totalmente en desacuerdo’ a (7) ‘totalmente de acuerdo’. Los valores más elevados reflejan mayor antipatía hacia las personas obesas.
Para medir el asco, se utilizó la Escala Tridimensional de Sensibilidad al Asco (Three-Domain Disgust Scale o TDDS; en inglés: Tybur et al., 2009; versión española: Sandin et al., 2013). Esta escala consiste en 21 ítems valorados sobre una escala tipo Likert de siete puntos que oscilan ente ‘nada de asco’ y ‘asco extremo’. La escala está compuesta por tres factores: patógeno, sexual y moral. Calculamos la media de los siete ítems de la subescala de asco patógeno para obtener una valoración global de esta subescala (α = .72). Un ejemplo de asco patógeno sería ‘Sentarme al lado de una persona con llagas rojas en los brazos’. Los valores elevados de esta medida reflejan mayor nivel de asco físico. Del mismo modo, calculamos un valor global para la subescala de asco sexual extrayendo la media de los siete ítems correspondientes (α = .80). Un ejemplo de asco sexual sería: ‘Un extraño que te toca el muslo en un ascensor’. Los valores elevados de esta medida reflejan mayor asco sexual. Con la media de los siete ítems correspondientes a la subescala de asco moral, calculamos un valor global para esta subescala (α = .80). Ejemplo de asco moral: ‘Mentir intencionadamente durante una transacción comercial’. Los valores elevados de esta medida indican mayor nivel de asco moral.
Para medir las actitudes negativas frente a las personas con SIDA, utilizamos el cuestionario español Actitudes hacia el VIH/SIDA (Espada et al., 2013). La subescala Personas con SIDA de este cuestionario evalúa las actitudes negativas hacia las personas con SIDA (e.g., ‘Si un amigo contrajese el SIDA, probablemente me distanciaría de el’). Esta subescala (α = .82) consistía en 3 ítems valorados sobre una escala tipo Likert de 7 puntos, de (1) ‘totalmente en desacuerdo’ a (7) ‘totalmente de acuerdo’. Las valoraciones elevadas de esta subescala reflejan mayor desagrado hacia las personas con SIDA.
Análisis de datos
Para analizar la validez de la versión adaptada al español de la escala PVE, estudiamos la relación entre actitudes antiobesos, asco y actitudes negativas hacia personas con VIH o SIDA, así como la percepción de vulnerabilidad a la enfermedad, a través de las correlaciones de Pearson. Para ello utilizamos el programa SPSS 19 (SPSS 19.0, SPSS Inc, Chicago, IL).
Resultados
Correlaciones entre las variables del Estudio 2.
Nota: AG: aversión a los gérmenes; IP: infectabilidad percibida; AFA: Actitudes antiobesos; Patógeno: asco patógeno; Moral: asco moral; Sexual: asco sexual; SIDA: actitudes negativas hacia el SIDA. *p < .05 **p < .01.
Conclusiones
Se ha comprobado que solo la aversión a los gérmenes está relacionada con las actitudes antiobesos. Este resultado es consistente con la evidencia existente de que la aversión a los gérmenes está asociada con las valoraciones negativas de las personas con características morfológicas anormales (Park et al., 2003), ente las que se incluyen las personas con problemas de peso (Park et al., 2007). Además, la aversión a los gérmenes también está relacionada positivamente con las tres dimensiones del asco (Tybur et al., 2009) y con actitudes negativas hacia personas con VIH o SIDA (Park et al., 2003), confirmando otros resultados descritos en la bibliografía. En el caso de la percepción de infectabilidad, las correlaciones son inferiores, y apenas significativas para el asco patógeno y sexual, y con las actitudes negativas hacia las personas con VIH o SIDA. Este último resultado está en línea con otros estudios en los que se ha observado que la percepción de amenaza de la enfermedad, y en particular las creencias sobre la transmisión del VIH a través del contacto social, está asociada con el estigma debido al VIH (Fuster et al., 2013).
Entre las limitaciones del estudio es importante señalar la baja consistencia interna de la subescala de aversión a los gérmenes (α = .57), en comparación con la versión original (α = .74). Una de las posibles explicaciones de este valor relativamente bajo podría ser la combinación de desviaciones típicas y el reducido número de ítems que componen este factor. No obstante, tanto la relevancia teórica del factor como el buen ajuste del modelo a los datos atenúan esta limitación, puesto que, en los modelos de ecuaciones estructurales, lo que se prueba es el modelo en su conjunto, y no los parámetros que lo conforman. Esto es debido a que es más importante la construcción teórica que los datos (Jöreskog & Sörbom, 1996). A pesar de ello, sería necesario tener en cuenta los efectos que el bajo nivel de consistencia interna pudiese tener en la atenuación de las correlaciones (Martínez, Hernández, & Hernández, 2006) y, por tanto, en la capacidad predictiva de este factor.
Además, a la luz de las correlaciones observadas, podría deducirse que el asco patógeno es un mediador de la relación entre la percepción de vulnerabilidad a la enfermedad y las actitudes negativas hacia el SIDA, además de mediar entre la aversión a los gérmenes y las actitudes negativas hacia los individuos obesos y las personas con SIDA. Futuras investigaciones deberían abordar esta cuestión.
Discusión general
Según los resultados obtenidos, podría decirse que se han alcanzado los respectivos objetivos de nuestros estudios, conseguir evidencia de la validez de constructo y de criterio del cuestionario PVE. Como señalamos anteriormente, en primer lugar, obtuvimos evidencia de la validez del constructo confirmando la estructura factorial propuesta por Duncan et al. (2009) en la población española. Es importante señalar que los autores que desarrollaron el cuestionario original (Duncan et al., 2009) no realizaron un AFC para comprobar la estructura factorial de la escala, por lo que, hasta donde sabemos, los resultados de nuestra investigación son los primeros derivados de esta técnica para comprobar la estructura factorial del PVE. En segundo lugar, obtuvimos evidencia de la validez de criterio puesto que se ha demostrado que las actitudes antiobesos, el asco y las actitudes negativas hacia las personas con SIDA están relacionados con la aversión a los gérmenes y ligeramente relacionados con la infectabilidad percibida. Es importante señalar también que, a través del análisis de validez de criterio de la escala, hemos obtenido conocimientos psicosociales relevantes sobre las relaciones entre la percepción de vulnerabilidad a la enfermedad y el prejuicio hacia las personas obesas y las personas con VIH. Por todo ello, basándonos en la información presentada en las secciones previas, creemos el cuestionario PVE puede utilizarse con seguridad para medir las creencias personales sobre la vulnerabilidad a las transmisiones de enfermedades infecciosas.
Como se indica en la introducción, es importante enfatizar que el PVE (Duncan et al., 2009) no es la única escala utilizada por la comunidad científica para medir la percepción de vulnerabilidad a la enfermedad. Por ejemplo, hemos mencionado el índice Whiteley (IW; Conradt et al., 2006) y el inventario de Ansiedad sobre la Salud (Salkovskis et al., 2002), pero, como ya mencionamos anteriormente, estos instrumentos suelen ser utilizados en entornos clínicos y no miden particularmente la preocupación por las enfermedades contagiosas. En cualquier caso, creemos que la escala que presentamos en este estudio puede utilizarse con garantía para medir las creencias sobre la susceptibilidad personal de contraer enfermedades infecciosas, como se ha demostrado a lo largo de este artículo, aunque también creemos que es importante que los profesionales sean conscientes de la existencia de otros instrumentos de medición y que estos puedan elegir el que consideren más útil.
Estos estudios presentan al menos dos limitaciones. En primer lugar, y como ya se ha señalado en la sección sobre el método, las muestras estaban formadas por estudiantes universitarios. Creemos que hubiese sido conveniente contar con participantes de otros estratos sociales o con un nivel educativo inferior para que la muestra fuese lo más heterogénea posible. Por ejemplo, las diferencias en ciertas características sociodemográficas tales como el alto nivel educativo o la reducida media de edad podrían influir en los resultados, puesto que hay estudios que demuestran que las personas con alto nivel educativo y los individuos más jóvenes muestran un nivel más bajo de rechazo hacia las personas con VIH (Fuster et al., 2013). Por tanto, los datos obtenidos deben ser interpretados teniendo en cuenta estas limitaciones. No obstante, es importante resaltar que los estudiantes de la UNED tienen ciertas características especiales; algunos de ellos son trabajadores en activo y tienen una media de edad superior a la de un estudiante típico (28 y 31 respectivamente en nuestros estudios), lo que los hace más semejantes a la población general que otras muestras universitarias. En segundo lugar, la proporción mujeres/hombres en nuestras muestras (Estudio1: 284 hombres y 460 mujeres; Estudio 2: 78 hombres y 356 mujeres), debería acercarse más al de la población general. De todos modos, cabe señalar que Duncan et al. (2009) desarrollaron cuestionario utilizando una muestra de estudiantes en la que la proporción de mujeres era aún mayor (405 hombres, 1,134 mujeres). De todos modos, convendría realizar una validación cruzada de los resultados en futuros estudios. Creemos que, en el futuro, esta limitación podría suponer un problema, puesto que, por ejemplo, los hombres declaran un nivel más elevado de actitudes antiobesos que las mujeres (Magallares & Morales, 2013). En tercer lugar, nuestro trabajo y los estudios que se describen en este artículo sobre las actitudes explícitas frente a miembros de grupos estigmatizados, son limitados, puesto que solo reflejan evaluaciones conscientes, que están sujetas a aceptación social. Se ha sugerido que los participantes podrían no declarar actitudes negativas hacia individuos obesos o con SIDA si creen que no es algo apropiado. Por eso, los investigadores en el campo de la psicología social muestran gran interés en las actitudes implícitas para reducir el sesgo en la valoración de los diferentes tipos de estigma (Hinman, Burmeister, Kiefner, Borushok, & Carels, 2015).
A pesar de las limitaciones, creemos que el PVE (Duncan et al., 2009) podría ser un instrumento adecuado para medir las creencias personales sobre la vulnerabilidad a la transmisión de enfermedades infecciosas. Creemos que este instrumento puede resultar de utilidad para aquellos investigadores de la comunidad hispanohablante que estén interesados en el estudio de la percepción de vulnerabilidad a la enfermedad. Como ya hemos señalado anteriormente, la bibliografía relevante señala la importancia de la percepción de vulnerabilidad a la enfermedad en la explicación de diversas cuestiones sociales relevantes. Por ello, los investigadores hispanohablantes interesados en el estudio del prejuicio hacia distintos grupos estigmatizados podrían beneficiarse de la versión española del PVE. En este trabajo, hemos estudiado el prejuicio hacia los individuos obesos y las personas con VIH, pero existen otros grupos que podrían ser objeto de estudio en relación con la percepción de vulnerabilidad a la enfermedad. Creemos que conocer el papel que desempeña la percepción de vulnerabilidad a la enfermedad en el prejuicio hacia distintos grupos estigmatizados podría resultar de gran utilidad para el diseño de intervenciones psicosociales dirigidas a reducir este problema. Por ejemplo, se ha demostrado recientemente que distintos tipos de protección ante la enfermedad debilitan la relación entre preocupación por la enfermedad y prejuicio hacia grupos estigmatizados (Huang, Sedlovskaya, Ackerman, & Bargh, 2011).
Footnotes
Disclosure statement
No potential conflict of interest was reported by the authors. / Los autores no han referido ningún potencial conflicto de interés en relación con este artículo.