






Abstract
In the present study, laser engineered net shaping technology was successfully utilised to fabricate 316L stainless steel bulk specimens using unidirectional scanning path and weaving scanning path. Influence of scanning path and post-heat treatment on microstructural and mechanical properties of the as-deposited builds has been investigated. The results show that scanning paths have a significant impact on the grain morphology evolution. Consequently, the as-made samples by different scanning strategies show a great difference in the mechanical properties. Furthermore, the experimental results also demonstrate that post-heat treatment is an essential step in further optimising microstructure and improving mechanical properties.
Keywords
Introduction
Additive manufacturing technique leads a development trend of advanced manufacturing technology in the world, which has therefore attracted widespread attention.1–4 As a novel laser additive manufacturing technology based on laser cladding process with synchronous powder feeding, laser engineered net shaping (LENS)5–9 has been gradually considered as an effective and efficient technique in fabrication of metal components, especially in the aeronautical industry. According to the specified laser scanning path, metal components with complex shapes can be directly manufactured by means of a 3D CAD model using a laser beam with high energy density. LENS technology has many advantages compared with the conventional manufacturing techniques, such as low cost, short production period and more suitable for complex components.10–12
Microstructure (e.g. grain size, orientation and morphology) is a very important characteristic of as-formed parts as a dominant factor to influence mechanical properties. Generally, it has reported that the microstructure of as-formed parts has a developed dendritic morphology with epitaxial growth characteristics, and thus the mechanical properties cannot be improved significantly compared with their conventionally built counterparts.13–15 So microstructure optimisation is of vital importance and is getting more and more attention. Given that the microstructural evolution is influenced by thermal history experienced by components during fabrication, many research works have been carried out in this field. Bontha et al. 16 employed a combination of analytical and numerical modelling approaches to study the effects of process variables (i.e. beam power and beam velocity) on the solidification microstructure. Moreover, other experiments have shown that many manufacture process parameters (i.e. Z step, laser power, scanning speed and powder flow rate) have a significant impact on the grain morphology of the builds.17–20 During the investigation of the solidification nucleation and growth mechanisms, Wang et al. 20 found that near-equiaxed, full-columnar and the unique ‘steel-bar reinforced concrete-like’ mixed grains could be fabricated by adjusting powder flow rate. In addition to the above-mentioned parameters, laser scanning path also plays a significant role not only on determining the dimensional accuracy and surface morphology,21–24 but also on the microstructural properties. Therefore, the investigation on the effect of laser scanning path on the quality of end products has been at the spot of scientific attention. Using single direction raster scanning and cross direction raster scanning to prepare Inconel-718 alloy parts, the key conclusions obtained by Liu et al. 25 were that scanning pattern mainly affected the dendrite growth directions and the ductility was affected by the inhomogeneity of grain size. Tabernero et al. 26 and Lu et al. 27 investigated the microstructure and mechanical properties of the as-formed parts by applying differing scanning strategies. They found that the scanning strategy could affect the size of pores or cracks, which could lead deterioration of mechanical properties of the parts manufactured by additive manufacturing. However, grain morphology evolution has scarcely been concerned in these studies. In order to provide guidance for additive manufacturing structurally sound workpieces with superior mechanical properties, it is essential to study how the laser scanning pattern affects grain morphology evolution. The present research focuses on grain morphology evolution and mechanical properties of LENS 316L stainless steel samples by controlling two different laser scanning paths and post-heat treatment process.
Experimental methods
The forming of 316L stainless steel samples was carried out on a LENS system, which consists of a semiconductor laser (Laserline LDF 4000-100), a six-axis robot (KUKA ZH 30/60 III) and a powder feeding system with a coaxial nozzle (Precitec YC52).
Chemical composition (wt-%) of 316L stainless steel

Bulk 316L stainless steel sample was formed by LENS process using unidirectional scanning path (USP) and weaving scanning path (WSP), respectively, as schematically illustrated in Fig. 1. The process parameters utilised in this study are provided in Table 2. The both as-deposited samples were approximately 120 mm × 80 mm × 12 mm in size, wherein the width and height of each track were about 3 mm and 0.9 mm, respectively. After fabrication, each specimen was removed from the substrate, separated into two parts by molybdenum wire cutting, and one part was heat treated at 1050°C for 1 h and subsequently water-cooled.
Schematic illustration of two different laser scanning patterns: a USP; b WSP Utilised LENS process parameters for fabricating 316L stainless steel samples

The as-deposited and heat-treated specimens were made into metallographic specimens by polishing and etching using aqua regia. Microstructure on the longitudinal section (x–z) was observed using optical microscope (Nikon eclipse MA 100) and scanning electron microscope (SUPRA 55 SAPPHIRE). Microhardness was measured using a Vickers microhardness tester with a load of 2.94 N and a dwell time of 15 s. Tensile specimens were machined according to the Chinese GB/T 228.1-2010 standard, as shown in Fig. 2, and each datum presented was the average of three measurements.
Configuration of tensile test specimen
Results and discussion
Microstructural features
Schematic illustration of the molten pool boundaries from longitudinal cross-section of the USP sample is presented in Fig. 3a. Under optical observation, the molten pool boundaries are in circular arc due to the Gauss energy distribution of laser beam. The arc-shaped molten pool boundaries in zone I marked in Fig. 3a are parallel to each other, while the molten pool boundaries interlace with each other and show zigzag pattern as can be seen in zone II.
a Schematic illustration of molten pool boundaries from the lengthwise section of the USP sample; b, c and d optical microscope micrographs of the grain morphologies at different magnifications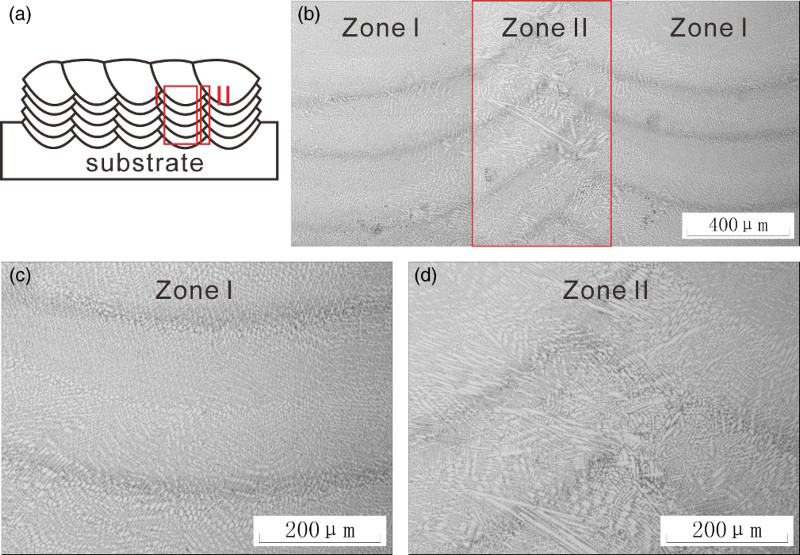
The as-deposited microstructure consists of columnar dendrites and equiaxed grains owing to the rapid solidification characteristic. Moreover, it is interesting that alternated microstructure with two typical microstructure characteristics can be observed, as shown in Fig. 3b. In the zone I, the solidification microstructure features a mixture of fine columnar dendrites with a smaller crystalline size and equiaxed grains (Fig. 3c), whereas the zone II is composed of coarse columnar dendrites with different columnar dendrite growth directions (Fig. 3d). The width of the zone I and the zone II are about 560–590 µm and 1350–1410 µm, respectively. As shown in Fig. 4a, three major microstructure morphologies from the bottom to the top region can be observed in a single track: columnar dendrites, columnar-plus-equiaxed grains, and equiaxed grains. According to the related solidification theory,13,28 the growth morphology of solidification structure is decided by the ratio of thermal gradient (G) and solidification velocity (R), namely G/R, and G × R determines the size of solidification structure. Owing to the solidification characteristics of the laser molten pool in this experiment, when multi-tracks are cladded, the value of G/R in the overlap zone is relatively greater than that at the centre of the molten pool because the depth at periphery is less than that at the centre. And meanwhile, G × R in the overlap zone is relatively lower. Consequently, the columnar dendrites continue to grow up and get large in the overlap zone between adjacent tracks. Small columnar dendrites and equiaxed grains form at the centre of the molten pool (Fig. 4b). With the proceeding of successive layer-upon-layer deposition process, the columnar dendrites with a larger crystalline size dominate in the overlap zone (i.e. zone II), while zone I is made up of fine columnar dendrites and equiaxed grains (Fig. 4c).
Schematic illustrations of the typical grain morphologies
Fig. 5a shows the schematic representation of the molten pool boundaries of the WSP sample. Typical microstructure of the as-deposited sample is featured in Fig. 5b, and optical micrographs at different regions are presented in Fig. 5c and d. It is noted that fine columnar dendrite and equiaxed dendrite growth prevails in the solidification microstructure. When the WSP is used, the scanning direction is vertical to that of the previous deposited layer. Consequently, coarse columnar dendrite zone in the upper region of the molten pool is remelted and the bottom region consisting of fine columnar dendrites and equiaxed dendrites is un-remelted (shown in Fig. 4d, where the dotted lines indicate the remelted region). Thus, in comparison with alternated microstructure, WSP sample exhibits more fine and uniform columnar dendrites and equiaxed grains (Fig. 5c and d).
a Schematic illustration of molten pool boundaries from the lengthwise section of the WSP sample; b, c and d optical microscope images of the grain morphologies at different magnifications
Mechanical properties
Microhardness
In order to master the microhardness distribution of the as-deposited parts, some test points, illustrated in Fig. 6a and b, were chosen to measure the hardness from the surface gradually to the inside on the cross-section and the distribution in the height direction is shown in Fig. 6c. It may be seen that laser scanning patterns do not significantly affect the microhardness. As shown in Fig. 6c, there are relative higher microhardness values near the specimen surface. Possible reasons for the above-mentioned result are as follows. During layer additive manufacturing, the prior-formed layers have been reheated when a new layer is deposited. Then occurred tempering effect can result in the decline of microhardness of the previously deposited layers.
29
Conversely, the top-most layer is not subject to the tempering effect, and has the fastest cooling speed due to both thermal conduction and radiation, so microhardness near the sample surface is relatively high. In addition, the microhardness distribution shows a periodical fluctuation along the height direction no matter which the scanning pattern is adopted. This cyclical fluctuation is mainly attributed to the alternated zones of fine grain zones and coarse grain zones, as can be seen in Fig. 7, wherein the dotted red line represents the molten pool boundary. When a new layer is deposited on the previously deposited layer, grains on the downside of molten pool boundary get coarser due to the reheating treatment. Then a coarse grain zone could form, resembling welding heat-affected zone. Consequently, the troughs in these curves correspond to the coarse grain zones.
a and b Schematic of the test positions; c hardness distribution in the height direction Microstructure near the molten pool boundary of the heat-treated WSP sample and microhardness at different regions

As can be seen in Fig. 6c, the Vickers hardness values of heat-treated samples are lower than those of as-deposited samples. In general, solution treatment is found to cause solid solution strengthening. On the other hand, carbide and σ phase will dissolve in austenitic matrix after solid solution treatment (shown in Fig. 9). 30 The combined effect results in a reduction in microhardness. The average Vickers hardness values of the USP and WSP specimens are about 261 HV(300 g) and 262 HV(300 g) respectively, which are still higher than that of the forged 316L stainless steel of 186 ± 6 HV(300 g). Moreover, the microhardness of the as-deposited specimens by two scanning patterns has still showed cyclical fluctuations along the height direction. The fluctuation amplitude decreases significantly, as can be seen in Fig. 6c.
Tensile properties
The schematic diagrams of tensile specimens are depicted in Fig. 8, wherein the dotted line represents the laser scanning direction. For USP sample, two kinds of tensile test specimens were designed according to the tensile loading direction, which is perpendicular or parallel to the laser scanning direction.
Schematic drawings of tensile test specimens: a USP tensile test specimens; b WSP tensile test specimens
Tensile data of as-deposited, as-deposited + heat-treated and forged samples.

For the USP, it can be found from Table 3 that the tensile properties are anisotropic with the tensile loading direction perpendicular or parallel to the scanning direction. The tensile strength along the laser scanning direction is higher than that perpendicular to the scanning direction, and the elongation is just the opposite. Possible reasons for the aforementioned result are as follows. According to the slip mechanism proposed by Wen et al.,
31
besides grain slipping, slipping along molten pool boundaries also contributes to the ductile deformation of as-deposited parts. The slipping occurs under the function of shear stress. The yield limit and the critical shear stress are expressed as follows:
Schematic illustrations showing the tensile loading direction and molten pool boundary

After solid solution treatment, the tensile strengths of all the as-deposited alloys decrease and the elongations increase. The elongations of the as-deposited specimens by the weaving scanning pattern are approximately equivalent with that of the forged alloy, and the tensile strengths have still increased by about 65%. Scanning electron microscopy (SEM) micrographs of as-deposited and heat-treated WSP samples are shown in Fig. 10. Obviously, it can be found that the regular dendrites are demolished and the network eutectic microstructure changes from continuous into discontinuous after solid solution treatment due to the dissolution of carbide. These changes can reduce the barrier effect on the grain boundary slipping and increase the elongation. Furthermore, the solid solution treatment makes microstructure and composition uniform and reduces internal stress, which can also further optimise the tensile properties. Therefore, these results indicate that a suitable heat treatment process can be utilised to optimise microstructure and assure excellent mechanical properties.
SEM micrographs of the WSP sample: a as-deposited sample; b as-deposited + heat-treated sample
The metallographic microstructures of the tensile specimen fracture section are observed and the results are shown in Fig. 11. For the USP tensile test specimen (perpendicular), the fracture occurred in the zone II as marked in red (Fig. 11a). Owing to the existence of coarse columnar dendrites with different columnar dendrite growth directions (Fig. 3d), firstly, this will lead to the weak binding force of these molten pool boundaries in zone II, and secondly, will produce stress concentration at the junction of these molten pool boundaries. As a result, the crack will initiate from these weakest zones and then easily propagate to speed-up the fracture. Contrarily, the harmful effect of the coarse columnar dendrite can be neglected for the weaving scanning pattern because of its finer microstructure. The fracture crossed over the molten pool has confirmed by the transverse-section picture of the fracture surface as shown in Fig. 11b. This result also demonstrates that the fracture strength of the as-deposited stainless steel specimen prepared by WSP is superior to that by USP.
Optical micrographs of fracture surface on longitudinal section: a USP tensile test specimen (perpendicular); b WSP tensile test specimen
Conclusions
Microstructure and performance can be optimised by adjusting laser scanning paths. Using USP, the microstructure of the prepared sample alternated with two typical characteristics, whereas for WSP the sample shows a finer microstructure. As a result, the tensile test specimens prepared by WSP exhibit better tensile properties.
No significant differences are observed in microhardness values for the two different laser scanning patterns. The microhardness distribution shows a periodical fluctuation along the height direction for both scanning patterns due to an alternative arrangement of coarse grain zone and fine grain zone.
After solid solution treatment, the regular dendritic structure disappears and the network eutectic microstructure changes from continuous into discontinuous. Although the tensile strength decreases, the ductility increases significantly. Moreover, the performance of the samples deposited by WSP is superior to that by USP and the conventional forgings.
A proper laser scanning pattern and post-heat treatment are essential to obtain workpieces with a dense and uniform microstructure and with excellent performance.
Footnotes
Acknowledgements
This work was carried out with the financial support of the National Key Basic Research and Development Program (No. 2011CB013402), Liaoning Natural Science Foundation (No. 2014028002), Liaoning Science and Technology Innovation Project (No. 201303002), SBW-DUT Key Research and Development Program, the Fundamental Research Funds for the Central Universities.