
Abstract
At high-strength steels very high cycle fatigue (VHCF) failure always occurs at subsurface inclusions. As a result, the failure shows large scatter and is not observable or predictable prior to failure. In order to understand the mechanisms leading to crack initiation in VHCF, it is necessary to make the failure observable. Within our work, a new testing procedure is introduced that enables the simulation of subsurface conditions at the surface and thereby the localisation of the failure. Therefore, specimens with artificial surface defects were tested in vacuum atmosphere. In our work, we will show the testing procedure and the validation of the results. Further, the transferability of our results on the failure at subsurface inclusions is discussed.
Introduction
Fatigue tests of different high-strength steels including bearings steels as for example the well-known SAE 52100 show no classic fatigue limit. The fatigue failure still occurs beyond an ultimate number of cycles of 107 even below the classic fatigue limit for this ultimate number of cycles.
1
,
2
The need of constantly increasing fatigue lives of structural components, especially in the transportation and energy sectors where high reliability and low weight are important, leads to growing interest on fatigue performance of material in the so-called very high cycle fatigue (VHCF) region with numbers of cycles larger than 107.
3
,
4
The reasons for this late failure are typically non-metallic inclusions inside the matrix, which cause an increase in the local stress field around them under mechanical deformation.
2
To estimate this effect, the maximum stress intensity factor (SIF) KI,max at an inclusion was introduced.
5
According to Murakami,
6
the SIF can be calculated by the cross-section area of the initiating inclusion measured on the fracture surface, the applied maximum tensile stress σo and a constant C (C = 0.65 for surface inclusions and C = 0.5 for subsurface inclusions) as follows:
If a fatigue crack initiates at an inner inclusion, a ring-like smooth fracture surface in the vicinity of the inclusion is build, the so-called fish-eye. In the VHCF regime, the fracture always takes place at inner inclusions with a SIF smaller than the threshold value for propagation of a long crack Kth and the fracture is accompanied by an additional characteristic fine granular area (FGA) on the fracture surface in the vicinity of the initiating inclusion. 7 , 8
This characteristic part of the fracture surface connected to VHCF was observed by many researchers. As a result of different observation techniques, multiple notations exist in literature and it is also called optical dark area, 9 granular bright facet 1 or rough surface area. 10 The crack within the FGA grows until the SIF at the edge of the FGA reaches the above-mentioned threshold value for long cracks Kth. 7 , 8 , 11 , 12 From this point on, the propagation of a long crack is possible. This long crack propagation forms the fish-eye part on the fracture surface. Thus, the formation of the FGA in the vicinity of an inclusion represents the initiation of a propagable long crack and is responsible for late crack initiation leading to failure at very long fatigue lives. The fatigue crack growth inside this FGA cannot be cycle by cycle for VHCF failure because the growth per cycle would be smaller than the lattice spacing. 9 As a consequence, the responsible mechanism has definitely to be discontinuous.
The mechanism of the FGA formation is not completely understood until now. Various researcher proposed various different models for the formation of FGAs. Murakami et al. 9 , 11 , for example, are of the opinion that hydrogen trapped by inclusions promotes crack growth inside the FGA. Thus, hydrogen-assisted growth of a short crack leads to the initiation of a propagable crack at inclusions. Shiozawa et al. 12 in contrast argue that decohesion of small carbides in the vicinity of an inclusions leads to local formation of small crack, which coalesce with each other to a microcrack. Another model established for FGA formation in Ti–6Al–4V by Nakamura et al. 13 and Oguma and Nakamura 14 states that repeated contact of the fracture surfaces at negative load ratios leads to the formation of the FGA. During the compressive part of the load cycle, the contact of the fracture surfaces causes cold-welding of the fracture surfaces. This process leads to the microstructure refinement later observed at the fracture surface. This model is promoted by the fact that the fine granular layer disappears at positive load ratios. 4 According to Sakai et al. 15 at first, a fine granular layer with the size of the later FGA forms around the inclusion. The coalescence of micro-debondings at the interface of the fine granular layer and the coarse matrix leads finally to initiation of a macroscopic crack. Our model proposed by Grad et al. 7 refines the approach of Sakai. Thus, the stress concentration around an inclusion leads to local dislocation motion. The dislocations arrange to cell structure with dislocation-rich cell walls. By dislocation extinction, new grain boundaries are formed.
According to various researchers,16–19 grain refinement in metals leads to a reduction of the threshold Kth. In fact, a strong local grain refinement is always observed inside the FGA. If this grain refinement develops prior to crack initiation and propagation, the threshold value for crack propagation inside the refined volume is different compared to the one of the original microstructures. But the local SIF remains constant. Thus, if the local grain refinement leads to a sufficient decrease of the local threshold value, a crack can initiate and propagate in the fine-grained volume. The grain refinement continues in the plastic zone at the crack tip and leads stepwise to grain refinement followed by crack propagation in the FGA. Thus, in contrast to Sakai, it is a discontinuous process of grain refinement and crack propagation that leads to the FGA observed at the fracture surface. All induced mechanisms have in common that the FGA formation ends when a threshold value for crack propagation inside the fish-eye is reached.
Fatigue phenomena accompanied with grain refinement are also well known for rolling contact fatigue in bearing steels. In this context, the so-called white etching regions are observed at butterflies around inclusions, white etching cracks or white etching bands, which consist of an ultrafine-grained microstructure. Here, the mechanisms and the question whether grain refinement is a symptom or the reason for fatigue damage is not yet clarified. 20 Parallels between the FGA formation mechanism and fracture mechanism connected to grain refinement in bearing fatigue might exist.
The fact that the formation of the FGA takes place inside the material makes it difficult to observe the formation in situ. Thus, all models can only be based on observations on the fracture surface after failure occurred. Accordingly, no prestages of VHCF failure have been observed that could prove one of the existing models. In order to clear the mechanisms behind FGA formation, alternative examination methods have to be found. Various researchers indicate that fatigue failure inside the volume is comparable to failure in a vacuum environment. 13 ,21–24 Even if artificial defect was deliberately placed at the specimens surface, no VHCF failure was observed on this defect in ambient air. 25 Thus, vacuum conditions might be a crucial factor for FGA formation and resulting crack initiation in the VHCF regime. To our knowledge, FGA formation has never been observed at the specimen's surface. But are these results still valid if the tests are performed in vacuum?
Our work targets on an understanding of the crack initiation mechanism leading to VHCF failure of high-strength steels. For this purpose, ultrasonic tension–compression fatigue tests (R = −1) with the high-strength steel 100Cr6 (SAE 52100) were carried out until an ultimate number of cycles of 109. In case of high-strength steels, VHCF failure always occurs at subsurface inclusions. As a result, VHCF failure shows large scatter and is not observable or predictable prior to failure. In order to understand the mechanisms leading to crack initiation in VHCF, it is necessary to make the failure observable. Within our work, a new testing method is introduced that enables the localisation and accordingly the observation of the VHCF failure. In order to simulate the conditions of subsurface failure at the surface, fatigue tests were performed in ultra-high vacuum with artificial flaws as crack initiation sites. By this testing procedure, conditions of subsurface failure shall be reproduced at the surface. In addition to the position of the crack initiating flaw, the applied SIF can be clearly defined before each test. Thus, it might be possible to observe the fracture mechanism in the VHCF-regime quasi-in-situ previous to the final failure by interrupted test. Further, it would be possible to confirm and refine the threshold values for failure in the VHCF regime.
In this work, we show the testing procedure and the validation of the results. In this context, detailed microstructural and fracture mechanical investigations were conducted. Further, the transferability of our results to the failure at subsurface inclusions will be discussed. In future work, this testing procedure will help to get a better understanding of crack initiation in the VHCF regime. With this new approach, we want to prove and refine our model for crack initiation by FGA formation proposed 2012. 7
Experimental procedures
Material and specimen
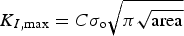
The material used in this study is the high carbon/chromium bearing steel 100Cr6 (material number 1.3505, similar to SAE 52100 or JIS SUJ2) in a high cleanliness condition. The fatigue specimens have an hourglass-shape with a minimum diameter of 4 mm in the centre and a stress concentration factor of 1.027 (see Fig. 1a). They were manufactured from a rolled round bar with a diameter of 65 mm. In order to avoid segregations in the centre of the bar, the specimens were taken eccentrically. The specimens were machined in annealed condition with radial and axial oversize. Afterwards, the specimens were austenitised for 20 min at 855°C, cooled down rapidly and then hold for 7 h at 220°C in a salt bath. This treatment results in a lower bainitic microstructure with an almost uniform hardness of 780 HV10. Figure 1b shows the resulting bainitic microstructure. In a second heat treatment, the specimen were austenitised for 20 min at 840°C, quenched in oil (60°C) and then annealed for 2 h at 180°C. The resulting martensitic microstructure in Fig. 1c shows a hardness of 775 HV10. After the heat treatment, the specimens were manufactured into the final shape by cylindrical grinding. Measurements show that the residual stresses produced during grinding diminish after about 10 µm below the surface. To reduce residual stresses and surface defects as a result of the grinding procedure, the surface layer in the specimen's gauge length was removed by mechanical polishing. By this conditioning, crack initiation at surface defects like striations which were created during the machining process can be avoided.
a Ultrasonic fatigue specimen (dimensions in mm) with the positioning of an artificial defect and SEM image of a lateral cut through the defect, b SEM image of the bainitic microstructure and c SEM image of the martensitic microstructure.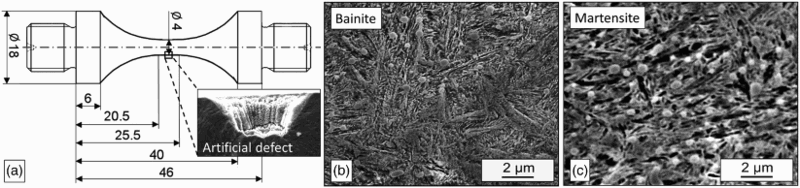
Finally, the artificial surface defects were induced by an ultrashort pulse laser (picosecond laser). By this treatment, hemispherical defects with a radius of approximately 25 µm can be induced as seen in Fig. 1a. During the laser treatment, material is vaporised by ultra-short laser shots in a very local area and marginal heat is transferred to the surrounding material. As shown in ‘Microstructural investigation’ section, this technique avoids a change in the local microstructure in the vicinity of the artificial defects and should accordingly not affect the fatigue failure mechanisms.
Testing methods
Push–pull fatigue tests (R = −1) were carried out on an ultrasonic piezoelectric fatigue testing device at a frequency of about 20 kHz. Figure 2 shows the ultrasonic oscillatory system with a cross-section cut through the vacuum chamber. The fatigue tests for the specimen with artificial defects were performed in ultra-high vacuum (P < 10−6 mbar) at room temperature. Therefore, the ultrasonic transducer is extended by two λ/2 components, which generate two new points without translational displacement where the vacuum chamber can be sealed off (see Fig. 2). To limit the heat development of the specimens due to the high testing frequency to ΔT < 15 K and to keep the testing time down, the specimens were tested by ultrasonic pulse–pause cycles and the system was cooled at the λ/2 components with a cold air gun during the tests in order to optimise the heat flow. The temperature was controlled with a thermographic camera through an infrared inspection glass at the vacuum chamber.
Ultrasonic fatigue testing device with a cross-section cut through the vacuum chamber.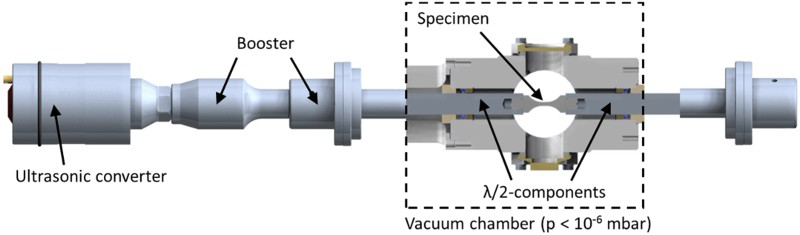
The fracture surfaces of the failed specimens were imaged and analysed with a scanning electron microscope (SEM). For fracture mechanics analysis, the defects and the characteristic fracture surface regions are measured in SEM. To give more insight into structure changes around the artificial surface defect due to fatigue, this region was also analysed by analytical transmission electron microscopy (TEM) in cross-section geometry. The fracture surface regions along the crack path were visualised by an energy-filtered TEM (EFTEM, Jeol 2010 equipped by Tridiem 863 Gatan image filter) in a bright-field mode in details. Moreover, the local crystal structure and the corresponding grain size were successively checked by using selected area diffraction (SAD) technique (individual analysed areas of diameter 600 nm) along the fracture surface. The diffraction patterns of several inner regions of the sample were also taken for comparison. The cross-section samples (TEM lamella) were prepared by focused ion beam (FIB) technique 26 , 27 using a dual-beam tool (FEI Altura 865, Ga+ ions source operating at 5 and 30 keV and field-emission SEM). Two-layer tungsten coating was locally applied to the fracture surface region of interest as a protective layer before ion cutting. An amorphous character of these protective layers warrants an absence of any spurious diffraction spots due to sample preparation.
Results and discussion
S–N curve and fracture mechanics
Figure 3 presents the S–N data for the two different microstructures with artificial defects. As can be seen from the diagram, the martensitic microstructure shows slightly superior fatigue life compared to bainite. The fatigue tests further show that VHCF failure occurs for both types of artificial surface defects if the tests are performed in ultra-high vacuum. With surface defects tested in vacuum, no change from surface to subsurface defects can be observed. Although the artificial defects size and shape is always the same and shows little scatter, the fatigue life fluctuates strongly at one stress level. This large scatter in lifetime of more than an order of magnitude occurs especially in the HCF and VHCF regime. Whether the scatter is caused by crack initiation time or by crack propagation cannot be cleared till now. Especially the bainitic specimen at stress amplitudes of 750 MPa shows the largest scatter.
S–N curve for martensitic and bainitic specimen with artificial surface defects tested in vacuum (p < 10−6 mbar).
This fatigue behaviour can be understood better if the SIFs at the artificial defect are taken into account. For that reason, every defect has been measured with SEM at the fracture surface in order to derive SIFs according to SIF's at the artificial defects and at the FGA's observed at the fracture surface. model by Murakami.
6
The results are presented in Fig. 4. As you can see, there is a trend that fatigue life extends with decreasing SIFs like observed for non-metallic inclusions. Another analogy to failure at inclusions is the fact that artificial defects in vacuum show VHCF failure with the additional appearance of a fine granular zone at the fracture surface (see ‘Fracture surfaces’ section) if the threshold value for propagation of a long crack is undercut. This feature can only be observed for fatigue life with Nf > 106. The open signs in Fig. 4 represent the SIF calculated for the FGAs in the vicinity of the artificial defects investigated in SEM. Like for inclusions, the FGA formation at the artificial defect represents the initiation of a propagable crack and is completed as soon as Kmax,FGA exceeds Kth. The comparatively large defect size used to avoid failure at subsurface inclusions unfortunately leads to low differences between KI,max of the defect and Kth and consequently to small FGAs. For future tests and investigations, smaller optimised artificial defects should be used to get larger FGAs.
model by Murakami.
6
The results are presented in Fig. 4. As you can see, there is a trend that fatigue life extends with decreasing SIFs like observed for non-metallic inclusions. Another analogy to failure at inclusions is the fact that artificial defects in vacuum show VHCF failure with the additional appearance of a fine granular zone at the fracture surface (see ‘Fracture surfaces’ section) if the threshold value for propagation of a long crack is undercut. This feature can only be observed for fatigue life with Nf > 106. The open signs in Fig. 4 represent the SIF calculated for the FGAs in the vicinity of the artificial defects investigated in SEM. Like for inclusions, the FGA formation at the artificial defect represents the initiation of a propagable crack and is completed as soon as Kmax,FGA exceeds Kth. The comparatively large defect size used to avoid failure at subsurface inclusions unfortunately leads to low differences between KI,max of the defect and Kth and consequently to small FGAs. For future tests and investigations, smaller optimised artificial defects should be used to get larger FGAs.
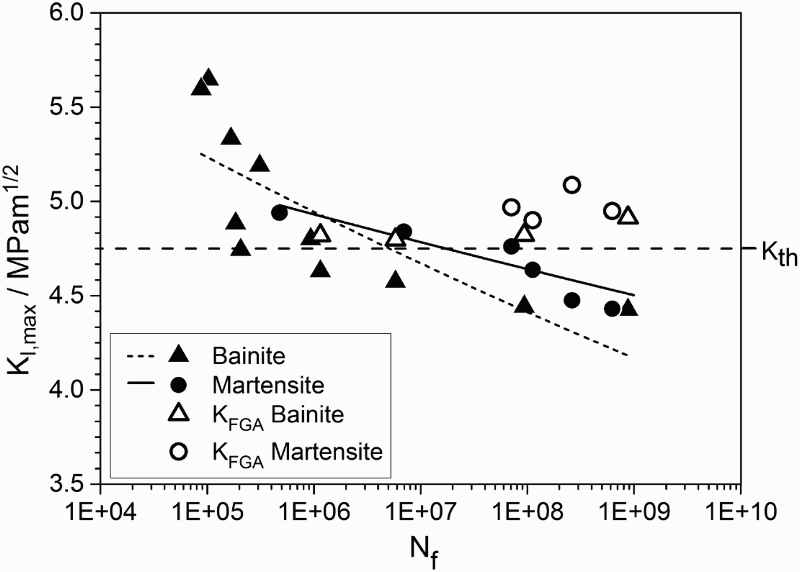
In order to determine whether the fatigue crack initiation at artificial defects for VHCF is comparable to initiation at inclusions which was observed in detail in our prior work, 7 detailed microstructural investigations were executed. These results are presented later in detail in ‘Microstructural investigation’ section.
Fracture surfaces
Except for one specimen with a very large inclusion inside cracks always initiated at the artificial defects at the specimens surface. According to failure at inclusions, different stages of crack propagation can be observed at the fracture surface. As for failure at inclusions, a smooth circular fracture surface called fish-eye occurs always around the defect. For VHCF failure, additionally, a rough granular area similar to the FGA around inclusions can be observed in the vicinity of artificial defects that were tested in vacuum environment. Figure 5 shows the fracture surfaces of specimen with different fatigue lives. For the specimen with fatigue lives larger than 106, the FGA is clearly visible in the enlarged viewing of Fig. 5b and c. In SEM, the FGA is defined by its rougher surface morphology. Thus, the size of the FGA is the border of this rough area as marked by the white dashed line in Fig. 5. The measured size of the FGA in SEM could be controlled later in TEM by measuring the length of the crack with detectable grain refinement at the lamella.
Fracture surfaces at the crack initiating artificial defects: a martensitic specimen without FGA (Nf = 476 731), b bainitic specimen with FGA (Nf = 874 869 000) and c martensitic specimen with FGA (Nf = 6 963 260).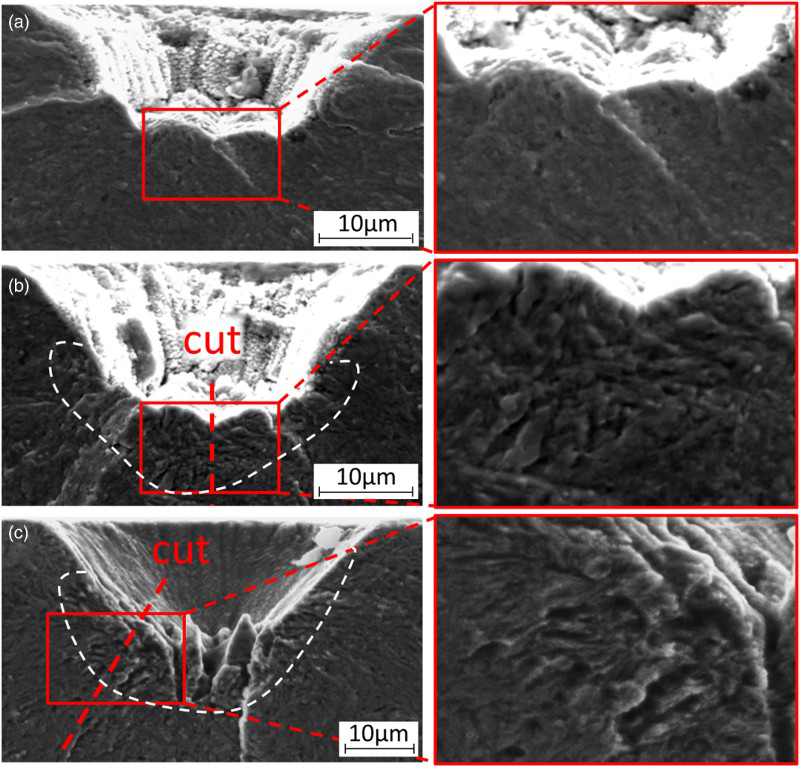
The fracture surfaces were observed more in details by TEM. The results of these investigations will be discussed in detail in ‘Microstructural investigation’ section using the example of Figure 5b and c. The red lines mark the cut positions for preparation of the TEM lamella.
Microstructural investigation
In order to clear whether the microstructure in the vicinity of artificial defects tested in vacuum atmosphere consists of a fine granular structure comparable to the FGA observed at inclusions, investigations by TEM have been performed. Specimens that showed FGA-like structures at the fracture surface in SEM as well as unstressed defects were examined to make sure that grain refinement in VHCF specimen does not already exist in unstressed specimen as a result of the manufacturing of the defects by laser sublimation. The unstressed specimen represents the initial state of the microstructure and reveals any local changes or influences as a result of the laser treatment used to introduce the artificial defects. Consequently, a TEM lamella was prepared to observe the local microstructure. In Fig. 6, the position of the FIB cut at the artificial defect and the resulting TEM lamella are presented. The TEM image shows slight changes at the surface inside the artificial defect. The defect is covered with a thin layer (<0.5 µm) of molten not completely vaporised material. SAD measurements were conducted near by the defect and for comparison on the untreated microstructure. The Laue diffraction patterns observed during SAD investigation of the microstructure in the vicinity of the artificial defect is identical to the original microstructure with a grain size of about 1–2 µm and proves that there is no initial grain refinement as a result of the laser treatment. Neither the TEM image nor the SAD investigation in the vicinity of the defect showed local grain refinement at the initial state as a result of the ultrashort pulse laser treatment. If any refinement can be observed in stressed specimen, it has to be as a result of the fatigue testing.
TEM investigation of the initial microstructure at an unstressed defect: a TEM lamella with microstructure close to the defect and b SEM micrograph of the defect with the cut position of the TEM lamella.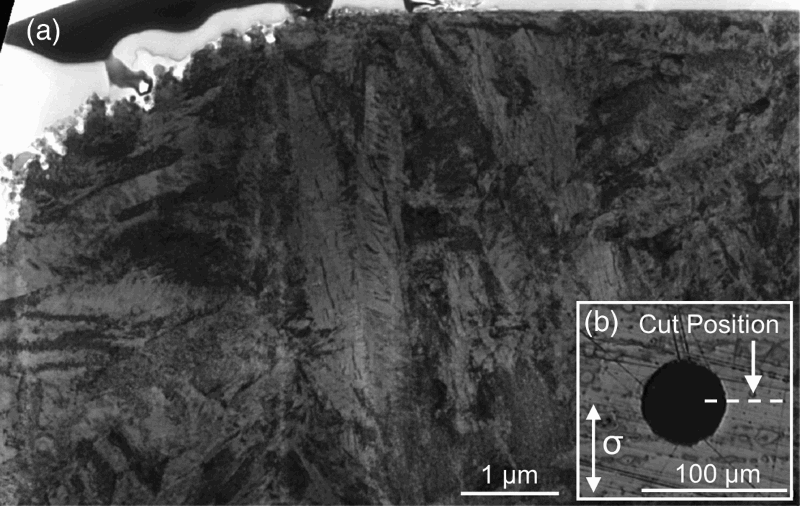
In the next step, the fine granular structure observed at artificial defects of specimen that failed in the VHCF regime was analysed. Here, the results of the TEM investigations of one representative specimen with a martensitic microstructure will be shown in order to illustrate the characteristics of the FGA at an artificial defect. The position for the preparation of the TEM lamella is marked by a dashed line in Fig. 5c. Figure 7 presents an overview of EFTEM image of the electron transparent region of the TEM lamella (width of 9.5 µm, cross-section thickness of 50–130 nm starting from the lamella surface) together with the SAD patterns taken from the selected lamella regions (red circles). The artificial defect in this image is placed in the left. The fracture surface is located at the top. The practically homogeneously grey round regions are carbides. Two main features can be visually recognised from Fig. 7.
TEM and SAD investigations at an artificial defect in a martensitic specimen showing FGA in SEM; red circles mark the areas where SAD was performed.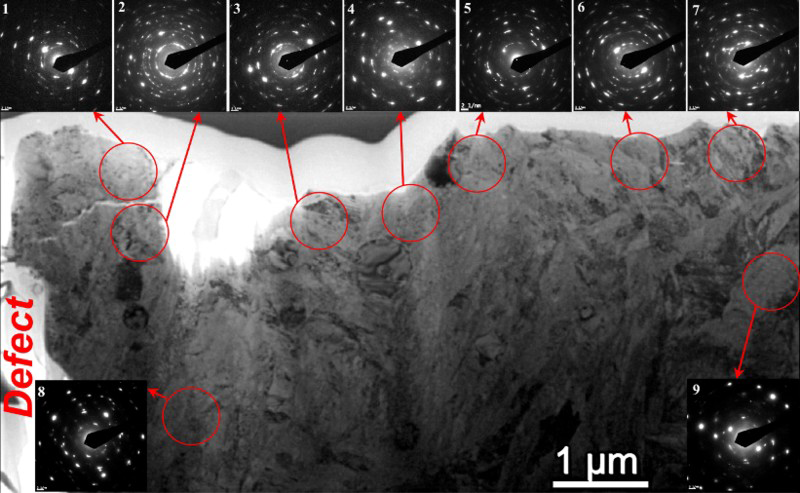
First, some secondary cracks exist within this region: a big one at the left up (between the first and second regions) with the length of about 1.3 µm as well as a small one (length of about 0.3 µm) within the third region. A series of the very small cracks (of about or <10 nm long) is observed at higher magnifications within the second region, too. This might indicate the initiation of multiple small cracks until one crack gets dominant.
Second, clearly recognisable crystal grains are visible in the lover half of the image only. Within the submicron-wide stripe near to the fracture surface, the faceted grains are small or are not detectable at such lower magnifications at all. This observation is a strong indication of building a fine-grain area in the vicinity of the fracture surface. The SAD patterns taken within the subsurface stripe region (thickness of about 0.6–0.8 µm) confirm this visual finding.
The diffraction patterns in this region consist of a superposition of Debye–Scherrer rings onto Laue patterns. The formers are characteristic for fine polycrystalline structures with grain size being substantially smaller as the size of the analysed area (here about 600 nm), whereas the latter are caused by grains being comparable to this size (or exceeding it). The Debye–Scherrer pattern is a dominating one in area 2, whereas the Laue one dominates in area 1. Other local areas analysed (Fig. 7, areas 3–7) constitute a combination of these limited cases with different weighting of the fine- and coarse-grained components. This alternating microstructure goes on along the crack path leading to a fracture surface in the FGA zone where slightly refined middle-sized and larger grains alternate with strongly refined fine-grained areas.
An analysis of the diffraction pattern of area 2 gives an averaged grain size of about 70–100 nm. It is important to note that the averaged grain size estimated varies from area to area but never exceeds a value of some hundreds nm (<200–300 nm). Such a strongly refined material is not observed in the about 2-micrometer distant regions below the fracture surface (areas 8 and 9) as well as quite far from the defect, where an averaged grain size of about 1–2 µm was estimated by ion-induced secondary electron imaging in FIB on the samples with the similar initial structure. 7
A quantitative evaluation of the diffraction patterns of the areas 1–7 shows that the fine-grained material consists mainly from martensite with very small amount of austenite. A splitting of the (2 0 0) and/or (1 1 2) diffraction spots of martensite is observed in some diffraction patterns (areas 2, 3 and 5).
If repeated contact of the fracture surfaces would lead to this grain refinement as often reported in literature, the fine-grained layer should completely cover both fracture surfaces. Additionally, the question arises why no deformation at the fracture surfaces of the fish-eye is detectable if fracture surface contact and cold-welding takes place as mentioned by Nakamura et al. 13 and Oguma and Nakamura. 14 Even at higher loads where fracture surface contact should be more detrimental and more pronounced, no deformation is observable inside the fish-eye. This fact gives a distinct evidence for crack initiation during VHCF failure and the formation mechanism of the FGA. The first conclusion is that grain refinement takes place prior to crack initiation or propagation inside the plasticised volumes around defects or inclusions. This local grain refinement results in a local decrease of the threshold value for crack propagation as already mentioned in the introduction. Consequently, a crack can propagate inside the fine-grained volume as soon as the local microstructure is fine enough or in other words as soon as the local threshold value undercuts the SIF at the defect, respectively, the crack tip. According to the Hall–Patch relation, the local grain refinement is attended by an increase in the local yield stress. As a result of this local change of the properties and connected displacement discontinuity, a stress concentration at the interface between fine and coarse microstructure is to be expected. In combination with the knowledge that grain refinement leads to a decrease in the threshold value for crack propagation, it is in all likelihood that cracks initiate and propagate inside the refined zone but close to the interface. This fact can be seen at the secondary crack between the coarse grain in SAD 1 and the fine grains in SAD 2 in Fig. 7. Sakai et al. 15 already described this behaviour in his model as debonding of the fine-grained zone and the original matrix. This propagation behaviour finally leads to the characteristic rough FGA zone at the fracture surface with mirror-inverted fine and coarse granular parts at each fracture surface.
Results for bainitic specimen are comparable to martensitic specimen. Local grain refinement could be detected at the fracture surface in the vicinity of the artificial defect. Figure 8 shows the lamella (position see Fig. 5) with the observed fine-grained zone at the fracture surface with the corresponding ring-like diffraction pattern. But the results were not as pronounced as for martensitic specimens. A reason for that is not apparent yet. But the occurrence of the FGA is in general very local and for large defects comparatively small. As a result, the positioning of the TEM lamella can strongly affect the results.
a TEM lamella of the bainitic specimen from Fig. 5b with the marked fine-grained area, b region for SAD and c SAD pattern.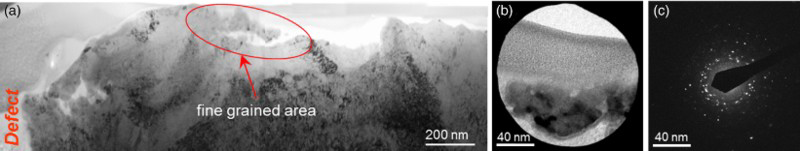
The results of the test performed in ultra-high vacuum indicate the necessity of a vacuum environment for the occurrence of VHCF. In case of our plasticity-based model, the influence of the environment on the plasticity has to be discussed.
It is reported in literature that in ultra-high vacuum plasticity is approximately reversible. Additionally, the plastic zone in metals is larger and the slip band density is higher in vacuum than in air environment. 28
The formation of dislocation cells might then just be a result of the statistical occurrence of random energetically favourable dislocation structures as mentioned by Hähner 29 driven by the alternating stresses and the slip reversibility in vacuum. For negative stress ratios dislocations can move back and forth until a favourable dislocation arrangement occurs. This could also explain the large scatter in fatigue life. Without alternating dislocation movement like for positive load ratios, dislocation will only pile up at the next microstructural barrier without forming cell walls or new grain boundaries. With this mechanism, it would also be possible to explain the absence of FGA formation for positive load ratios observed by Kovacs et al. 4 The enhanced plasticity in vacuum might be responsible for the existence of subsurface VHCF failure and the occurrence of FGA.
Conclusions
Ultrasonic fatigue test with artificial surface defects induced in high-strength steel specimen tested in ultra-high vacuum led to failure in VHCF regime. In case of VHCF failure, the characteristic FGA could be observed at the fracture surface in the vicinity of artificial defects. Transmission electron microscopy investigations clearly show strong grain refinement at the fracture surface inside the FGA. The observed characteristics fit to those of FGAs at non-metallic inclusions reported in literature. 7 , 15 Vacuum might enable crack initiation by formation of this FGA on the surface defects and could thereby be the reason for the occurrence of VHCF failure in high-strength steel that was not observed earlier in air environment. 25 Thus, vacuum fatigue tests with specimen containing an artificial surface defect can simulate subsurface failure at inclusions. This makes it possible to locate and monitor the VHCF failure prior to failure. In future work, this will help to get a better understanding of the formation of FGAs and crack initiation during VHCF in high-strength steels that could not be observed quasi-in-situ till now.
Footnotes
Acknowledgement
This research was carried out in the framework of the German Research Foundation (DFG) priority program 1466 – Infinite Life. The authors would like to thank the DFG for the financial support of this work and the Photonic Center Kaiserslautern for the production of the laser defects.