
Abstract
ASTM F75 femoral knee implant components distort during manufacture due to residual stress re-distribution or inducement. X-ray diffraction, neutron diffraction, centre-hole drilling and the contour method residual stress determination techniques were applied to as-cast and/or shot-blasted components. The centre-hole drilling and contour methods can only be considered qualitative as a result of uncertainty associated with the elastic anisotropy of gauge volumes. Additionally, neutron diffraction experimentation returned unfeasible results. However, it was qualitatively identified that a shot-blasting shell-removal process has the ability to significantly alter the bulk residual stress state of the implants and induce a stress state which would cause distortion by re-distribution following material removal during manufacturing processes.
Keywords
Introduction
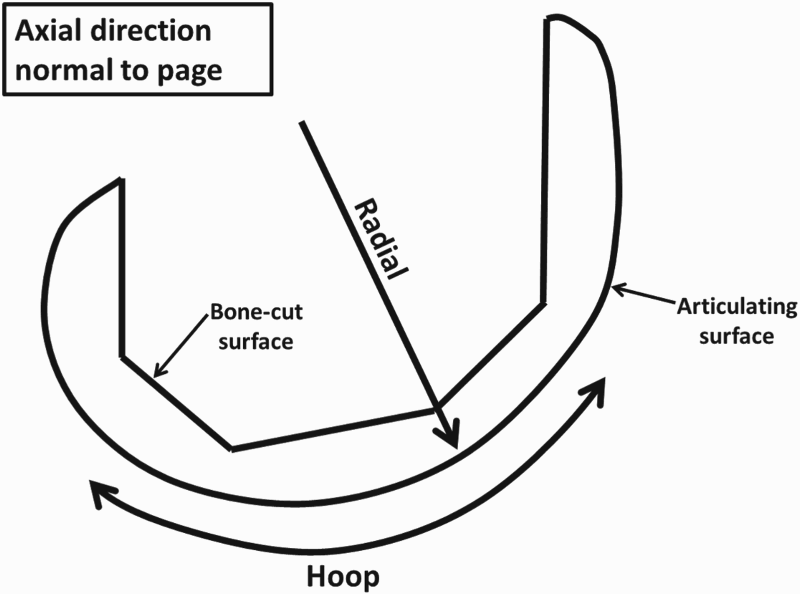
Femoral knee implants, referred to as ‘femorals’ in this article, are one component of a total-knee-replacement. Residual stress is of interest in order to understand dimensional distortion during manufacture where the open end of the femorals’ ‘C-shape’ (see Figure 1) increases following material removal, referred to as flowering. Material is only removed from the articulating surface (i.e. the outside of the ‘C-shape’, see Figure 1) during manufacture. Therefore, flowering is either the result of residual stress being induced or pre-existing residual stress redistributing [1]:
Induced residual stress: The material removal process induces tensile residual stress on the articulating surface. Redistributed residual stress: Assuming the femoral has an existing residual stress state consisting of a compressive exterior layer and a tensile interior, partial or total removal of the compressive layer of residual stress near the articulating surface will result in flowering. Prior to material removal, there are a number of manufacturing processes which may influence the femorals residual stress state. Of these, casting and shot-blasting are investigated here. Sketch of a typical femoral cross-section showing its main geometric axes; hoop, radial and axial. A typical femoral would fit within a 70 mm cube.
Flowering results in femoral components which are not within specification and are thus either rejected or re-worked depending on each manufacturer's own processes. There is therefore the potential for significant improvements in the efficiency of the manufacturing process which would result in reduced business and environmental cost. Production capacity would also be increased, which is of interest as it is predicted that future demands for implants will increase significantly [1]. The motivation for this research is covered in more detail in Conroy and Tanner [1].
Conroy and Tanner [1] was a literature review for the determination of residual stress within ASTM F75 femoral components with some initial experimental results reported for X-ray diffraction and the centre-hole drilling method. From Conroy and Tanner [1] it was concluded that the determination of residual stress within as-cast ASTM F75 femoral implants would be challenging as they have a complex geometry, their microstructure is inhomogeneous, they work-harden rapidly, they have poor neutron scattering properties and they have a coarse, elastically anisotropic grain structure. Therefore, certain techniques would be limited in their application and would require various non-conventional experimental efforts.
Given the aforementioned difficulties and uncertainties it was of interest to select residual stress determination techniques from which experimental results could be compared in order to verify stress signs and magnitudes. A number of residual stress determination techniques were applied in order to allow such comparisons. Neutron diffraction [2–4], a non-destructive residual stress determination technique with below-surface depth capability, was selected in order to allow a direct comparison with results obtained by the contour method [5–8], which is a destructive technique. X-ray diffraction [9,10], a non-destructive surface residual stress determination technique, can be successfully applied to the surfaces of ASTM F75 femorals which experience plastic deformation [1]. Therefore, this method was selected to be applied prior to the application of the centre-hole drilling method [11–13]. In addition nano-indentation hardness measurements and microstructural evaluations were conducted as a means to better understand results from the aforementioned residual stress determination techniques.
It should be noted that for visualisation and explanatory purposes the femorals main axes are simplified and described as hoop, axial and radial (see Figure 1). This notation is maintained when describing directions of stress determined by various techniques for ease of interpretation, even though the notations may not be technically correct. For example the use of hoop to describe stress determined by the centre-hole drilling method along the direction which most closely aligns to the hoop-direction, this does not imply the centre-hole drilling method is capable of determining hoop stress.
Methodology
Test samples
List of femorals utilised for application of various residual stress determination techniques.
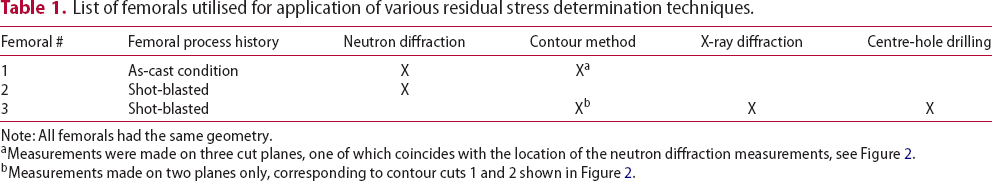
Note: All femorals had the same geometry.
aMeasurements were made on three cut planes, one of which coincides with the location of the neutron diffraction measurements, see Figure 2.
bMeasurements made on two planes only, corresponding to contour cuts 1 and 2 shown in Figure 2.
Femoral #1: a femoral in the as-cast condition which was subject to non-destructive measurement by neutron diffraction followed by the contour method. The intent was to directly compare the two residual stress determination techniques.
Femoral #2: a shot-blast femoral which was subject to neutron diffraction.
Femoral #3: a shot-blasted femoral which was subject to the following techniques, the result of which were to be compared; the contour method, X-ray diffraction and the centre-hole drilling technique.
The known coarse and varied grain size of ASTM F75 femorals, which is of the order of hundreds of micrometres [14–18], can have implications for all applied residual stress determination techniques [1]. In an effort to refine the grain structure, the femorals utilised for experimentation were cast with an inoculant [1].
Femorals in two conditions, as-cast and shot-blasted, were used for experimentation. These manufacturing processes were identified as those most likely to alter the bulk residual stress state of the femoral prior to material removal processes. These manufacturing processes are covered in more detail in Sections ‘Casting’ and ‘Shot-blasting’.
Casting
During solidification and cooling some areas of the femoral will cool and contract before others. As these different regions will have differing temperature-dependent yield-strengths, there exists the potential for plastic strain to be induced. The inducement of non-uniform plastic strain will result in a residual stress state which will exist at room temperature [19]. Assuming a simple geometry component which solidifies from its exterior surfaces and neglecting mould constraints, a residual stress state consisting of a compressive exterior region balanced by a tensile interior would be expected at room temperature following casting [19]. However, the residual stress state of the femorals in the as-cast condition is unknown given that residual stress resulting from casting is influenced by a wide variety of parameters including; component shape [19–22], mould friction coefficient [23], mould mechanical strength properties [24,25] and cooling-rates [22,23].
Shot-blasting
Shot-peening and shot-blasting involve the high-speed impact of a small round metallic/ceramic piece, called ‘shot’, with the sample. During impact the shot plastically deforms the surface in tension (i.e. stretches the surface), following the impact this stress sign reverses to a compressive residual stress [26]. It would therefore be expected that shot-blasting would induce a compressive near-surface residual stress with a balancing tensile stress at interior regions. However, the significance of the induced residual stress state on flowering is unknown and will be dependent on the volume of material influenced by the shot-blasting process and the magnitude of stress induced. It should be noted that differences exist between shot-peening and shot-blasting processes. Shot-peening processes are intended as a means to intentionally induce compressive surface stress to increase a components fatigue life [26], whereas shot-blasting processes are intended as cleaning processes [27]. Shot-peening processes are often well characterised with peening-intensity, shot-stream path and impinging angle being controlled factors [26]. The shot-blasting process applied during femoral preparation had a number of differences towards a typical shot-peening process:
The process utilised a centrifugal-wheel to accelerate stainless steel shot at the femorals whilst they were tumbled on a rubber belt, which ensures all areas of the components are cleaned [27]. Therefore, the intensity of the blasting across the femoral was not a controlled factor and variations in the induced residual stress state may exist between localised regions on a femoral or vary from one femoral to another. For the intent to induce residual stress during peening the shot should ideally be harder than the workpiece [26]. However, the hardness values of the shot utilised were within the range of 250–350 Hv [28], which is comparable with the hardness values of the matrix material of cast ASTM F75 which is in the region of 310–350 Hv [29]. Therefore the depth and magnitude of compressive residual stress induced during the shot-blasting process will be less than that of a specifically designed shot-peening process [26].
Neutron diffraction
Neutron diffraction experimentation was conducted on the ENGIN-X strain-scanner at the ISIS Pulsed Neutron and Muon Source, Science and Technology Facilities Council, Rutherford Appleton Laboratory, Didcot OX11 0QX, UK. Diffraction techniques non-destructively determine strain by the comparison of a change in inter-atomic lattice plane spacing, d, between a strained and an un-strained sample. When neutrons of a particular wavelength, λ, interact with a crystalline material at the Bragg angle, θ, constructive interference in the diffracted beam occurs, which is identified using neutron detectors. The inter-atomic spacing, d, can then be calculated using Bragg's law [30]:
In the case of ENGIN-X, a Time of Flight (ToF) facility, the Bragg angle θ remains fixed at 90°, but the wavelength varies and is determined by the length of time it takes neutrons to travel from the beam-choppers through to the detectors, hence the name ToF.
Challenges
Holden [3] outlines that for neutron diffraction, coarse grain effects begin to become noticeable when the average grain diameter reaches approximately 100 µm. Coarse grain structure can result in (i) apparent strains due to shifts in the centroid of the Sample Gauge volume (SGV) from that of the Instrument Gauge Volume (IGV), (ii) misalignment of SGV centroids for each strain vector and (iii) beam-extinction [3,4,31,32]. To alleviate the effect of coarse grain structure during neutron diffraction, the number of grains contributing to the diffraction spectrum needs to be increased [32]. A number of potential methods to achieve an increase in diffracting grains are listed below. The maximum allowable grain size using the following techniques is unknown:
The use of ToF in favour of monochromatic wavelength facilities such that full diffraction patterns can be obtained. This is advantageous as each grain within the gauge volume will have a greater probability of contributing to the diffraction spectrum. Increasing the gauge volume size [32]. Success of this method will depend on the distribution of the diffracting grains within the larger gauge volume [3]. The application of this method is limited by resolution requirements. A 2 × 2 × 2 mm3 gauge volume was utilised during experimentation as this was considered the largest applicable to the femoral while still retaining spatial resolution capable of distinguishing potential stress gradients. Rotation of the specimen about an axis perpendicular to the diffraction plane which effectively increases the number of grains contributing to the diffraction spectrum [3,32]. This method is typically applied at monochromatic wavelength facilities, the angular spread in data collection in the horizontal and vertical planes at ToF facilities [3] has a similar effect. In the case of coarse grain structure, the shift in the centroid of the SGV from the IGV should be opposite for measurements which are 180° apart from each other. Averaging of measurements 180° apart will cancel errors associated with the SGV centroid shift [33]. Owing to the limited beam-time allocation and the long count times required, this approach was not applied. However, the potential benefits of this approach was assessed by obtaining diffraction measurements 180° apart for each d-zero reference specimen.
The high Co and Cr content of ASTM F75 results in poor nuclear scattering properties which would be expected to result in long count times, high background noise and limited path-lengths [1]. Additionally the high absorption of neutrons across the gauge volume will lead to a shift in the centroid of the SGV from the IGV. It is recommended that the maximum dimension of the Nominal Gauge Volume (NGV) be less than the neutron attenuation length, lµ, of the material [4]. Considering the 2 × 2 × 2 mm3 gauge volume and the worst case scenario of pure cobalt, which has an attenuation length of 2.57 mm [4], this recommendation was adhered to during experimentation.
Lattice parameter measurement
The scattering vector defines the direction of strain measurement and bisects the incident and diffracted neutron beam. At least six strain measurements are required at each measurement point to fully determine the stress tensor. During experimentation, oftentimes because of beam-time limitations, principal strain directions are assumed based on prior knowledge of the sample's processing history or assumed to act along the main geometrical axes of a component [34]. This procedure allows for the stress tensor to be characterised by three determined strains [4,31,34]. Alternatively, if residual stress in specific directions are of interest, then the measurement of three orthogonal strains will correctly determine the stress along those strain directions [4].
In order to make efficient use of allocated beam-time just three orthogonal strain measurements were made during experimentation and the determination of the hoop-direction stress was prioritised [1]. One scattering vector was therefore aligned along the hoop-direction of the femoral; the other two were aligned with the remaining main geometrical axes of the femoral (see Figure 1). It is unknown if the directions labelled in Figure 1 correspond with the principal stress directions or not, therefore it cannot be assumed that the full stress tensor was determined.
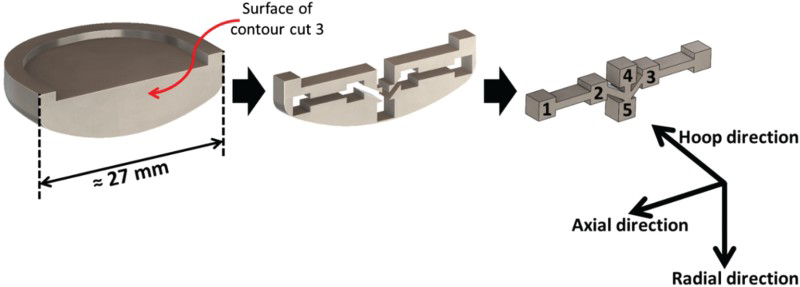
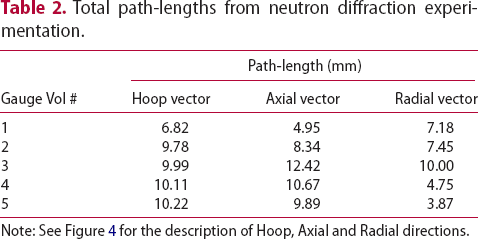
Measurements on femoral #1, the as-cast femoral, were initially attempted at four locations through the thickness of the femoral on a plane corresponding to contour cut number 2, indicated in Figure 2. However, on this plane path-lengths ranged from 21 to 38 mm and no diffraction peaks were observed. Therefore, the location of measurements was moved to those detailed in Figure 2 where shorter path-lengths were possible (see Table 2) and five 2 × 2 × 2 mm3 gauge volumes were irradiated. Neutron diffraction measurements were also made on femoral #2 corresponding to the same locations as gauge volumes 1, 2, 4 and 5 from femoral 1. Gauge volume 3 was not measured due to time constraints.
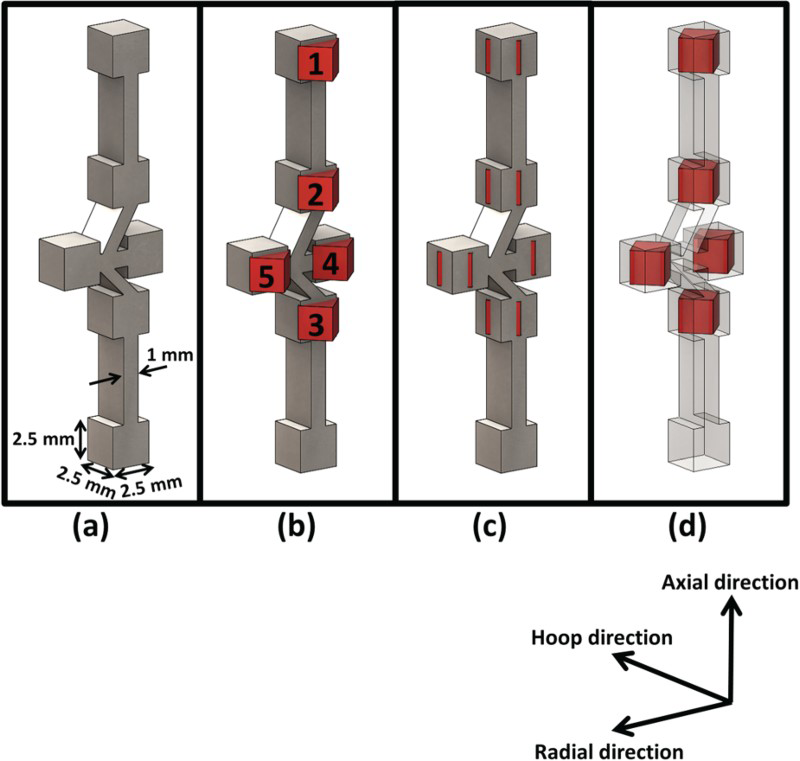
CAD representations of each contour method cut in order of sequence. Neutron diffraction gauge volumes coincided with the plane for the third contour method cut. Each gauge volume was 2 × 2 × 2 mm3. Note: only contour cut 1 and contour cut 2 were applied to the shot-blasted femoral (i.e. femoral #3 from Table 1). Series of images representing the manner in which d-zero specimens #1 to #5 were obtained from the remaining component of the femoral following contour cut 3. Total path-lengths from neutron diffraction experimentation. Note: See Figure 4 for the description of Hoop, Axial and Radial directions. (a) Shows a CAD representation of the joined d-zero specimens which were sectioned from femoral #1 (as-cast) after the application of the contour method (see also Figure 3). (b) The numbered cubes show the original location and orientation of each neutron diffraction volume from the measurement of the lattice parameter in the radial and hoop-directions. Each gauge volume cube was 2 × 2 × 2 mm3. The gauge volume numbering corresponds to that shown in Figure 2. Images (c) and (d) show the locations of the neutron diffraction gauge volumes during experimentation to determine the reference lattice parameter. The centre of each gauge volume was off-set approximately 1.25 mm from those shown in image (b). Total path-length for each lattice parameter measurement was approximately 3.5 mm.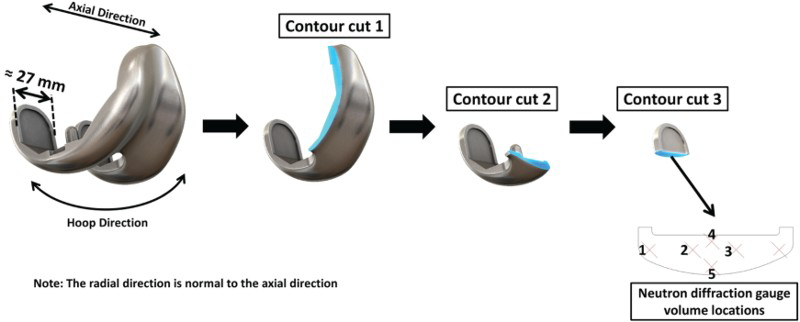
During the experiment, the femoral was mounted to a fixture and three flat surfaces were used to define X, Y and Z planes utilising a theodolite. Experimental planning software, SScanSS [35–37], and a virtual representation of the component were used to specify gauge volume locations, calculate neutron path-lengths and write scripts to control the instrument.
Reference lattice parameter measurement
Residual stress determination by neutron diffraction requires values for the stress-free lattice parameter appropriate to each point measured, often referred to as ‘d-zero’. Initial d-zero measurements were made on a ≈5 mm diameter cylindrical sample of material ≈4 mm long which was sectioned, using electro-discharge machining (EDM), from a cylindrical casting which was cast at the same time as femoral #1 and #2. This d-zero sample is referred to as d-zero specimen #0.
Following contour cut 3 (see Section ‘Contour method’ for more detail) multiple d-zero specimens were sectioned from the as-cast femoral using wire-EDM. These d-zero specimens were taken from regions as close as possible to the original neutron diffraction gauge volume locations, see Figures 2–4, and are named d-zero specimens #1, #2, #3, #4 and #5, which corresponds to the gauge volume numbering shown in Figure 2–4. These d-zeros had to be off-set from the original neutron diffraction gauge volumes as the contour method plane passed through their centres. A thin piece of material was left as a connection between d-zero specimens #1 through to #5 in order to make efficient use of beam-time by avoiding the individual alignment of each d-zero specimen in ENGIN-X. The purpose of measuring reference lattice parameter from these d-zero specimens was to eliminate the effect of path-length, investigate the effects of large grain size and to identify any spatial variations in d-zero spacing.
Two measurements were made on each d-zero specimen at 180° to each other in order to investigate the potential benefit of the tecnique highlighted in Section ‘Challenges’ as a means to address the challenges of a coarse grain structure [33]. As each measurement returns two scattering vectors at ENGIN-X, d-zero values in two directions were obtained for each measurement. For d-zero specimens #1 to #5 scattering-vector-directions corresponded to the hoop and radial directions of the original lattice parameter measurements. For d-zero specimen #0, no specific alignment was utilised.
Data analysis
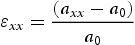
Neutron diffraction enables measurement of average elastic strains within the gauge volume defined by the intersection of incident and diffracted beams. The elastic strain,  , along a direction ‘x’, can be determined from the change in the lattice parameter, axx, of the crystalline material with reference to the unstressed value, a0, thus;
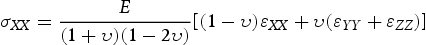
Essentially in all diffraction investigations, stress calculations are based on continuum mechanics using Hooke's law. The stress is calculated from the elastic strains in the gauge volume measured along three mutually orthogonal directions:
The Rietveld analysis [38] to determine lattice parameters was performed using GSAS software [39] in conjunction with the ISIS in-house software, Open Genie. Library GSAS template files for Face-Centred-Cubic (FCC) cobalt were not available; therefore templates files for FCC iron were used for peak-fitting purposes. FCC iron has the same cubic structure and a similar lattice parameter to that of FCC cobalt, therefore the software would locate and fit all peaks for FCC cobalt.
Owing to excessive noise and/or weak diffraction intensities and/or missing peaks, a number of diffraction spectrums would not converge during fitting analysis without the use of commands in Open Genie which alter peak-profile fitting coefficients, sigma and gamma, for the ToF profile function 3 (see Larson and Von Dreele [39]).
Contour method
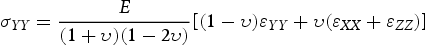
The contour method was performed by StressMap at The Open University, Walton Hall, Milton Keynes, MK7 6AA, UK. Femoral #1 (as-cast) was sectioned in three cuts as described in Figure 2. As the contour method determines residual stress normal to the cut surface [5], these cuts enabled mapping of the axial and hoop components of residual stress. Each contour cut measurement was performed in three different steps: (i) femoral preparation and its cutting by wire Electrical Discharge Machining (wire-EDM) (see Section ‘Femoral preparation and wire-EDM cutting’), (ii) measurement of the cut faces’ deformations using a coordinate measuring machine (CMM) (see Section ‘Data analysis and stress back-calculation’) and (iii) data analysis and stress back-calculation using a linear Finite Element (FE) analysis method (see Section ‘Surface profile measurement’).
Two contour cuts were also performed on femoral #3 (shot-blasted) to map the axial and hoop components of residual stress on the planes illustrated by contour cut 1 and contour cut 2 in Figure 2, contour cut 3 was not applied.
Challenges
Individual ASTM F75 grains are elastically anisotropic and this anisotropy has been observed in polycrystalline tensile-test specimens [1]. This anisotropy in conjunction with the femorals coarse grain structure may render the gauge volume of a strain-relief residual stress determination method, such as the contour method, elastically anisotropic [1]. The contour method can account for elastic anisotropy if the spatial variation of elastic modulus is known and included within the FE model [6,40], however the elastic modulus variation within the ASTM F75 femoral implants was not known and elastic properties were assumed to be isotropic.
It is desirable to conduct the contour cut along a plane which enables having two symmetric parts about the cut plane. However, this is not always achievable for complex shape samples such as the femoral. The size of the required symmetric region on either side of the cut can be estimated as a distance of 1.5 times the part thickness [6], which would be approximately 10 mm in the case of the femoral. The femorals did not fulfil this requirement, however the degree of asymmetry within the region for contour cut 1 and cut 2, see Figure 2, was low and thus errors associated with asymmetry were expected to be small [6]. In contrast, the degree of asymmetry of contour cut 3 was considerable. Thus, a different data analysis approach was applied.
Femoral preparation and wire-EDM cutting
Femoral preparation consisted of applying special measures, including use of sacrificial layers [41], to mitigate wire entry/exit effects which were of particular concern for thin sections and for determining near-surface residual stress. On completion of the femoral preparation, custom-designed tooling was used to clamp the femoral, or cut parts of the femoral, on the wire-EDM bed in order to avoid their free movement during cutting.
All contour cuts were conducted on an Agie Charmilles wire-EDM machine with a 100 µm diameter brass wire. Prior to cutting, the femoral and clamping fixtures were left to reach thermal equilibrium within the EDM deionised water tank. Cutting trials on ASTM F75 femoral were performed in advance to determine suitable wire diameter and wire-EDM machine parameters. Requirements of the wire-EDM cut are covered in Hosseinzadeh et al. [8] and Bouchard et al. [42].
Surface profile measurement
Following wire-EDM cutting, the pairs of cut parts were cleaned, dried and left in a temperature-controlled laboratory to reach thermal equilibrium before starting the surface profile measurements. The deformations of the newly-cut-faces were measured using a Zeiss Eclipse CMM fitted with a Micro-Epsilon laser probe. A 0.1 mm grid measurement point spacing was adopted. Furthermore, the perimeters of the cut parts were measured using 3 mm diameter ruby-tipped Renishaw PH10M touch trigger probe; this information was used during the data processing analysis to align the two cut surfaces.
Data analysis and stress back-calculation
The stress back-calculations were performed within ABAQUS, a FE analysis software package, using linear elastic stress analysis. All models were meshed with 10-node quadratic tetrahedron elements. The femorals were assumed to have homogeneous isotropic elastic properties with a room temperature Young's modulus of 220 GPa and Poisson's ratio of 0.3, as applied for the neutron diffraction method. Two different approaches were applied to analyse measurements from the three contour cuts: the standard approach described in Prime et al. [43] for contour cuts 1 and 2 and a new data analysis approach, described below, to take into account the asymmetry effect of contour cut 3.
In the standard data analysis approach, the data sets for opposing cut faces were first aligned using the measured perimeters and then interpolated onto a common grid before averaging to remove errors due to shear stress and possible anti-symmetric cutting artefacts. The averaged data were then smoothed using cubic splines. This smoothed displacement data was then applied as boundary conditions, with reverse sign, on the cut face of the corresponding contour cut's part in ABAQUS. Two additional constraining boundary conditions were also imposed on the models to avoid rigid body motion.
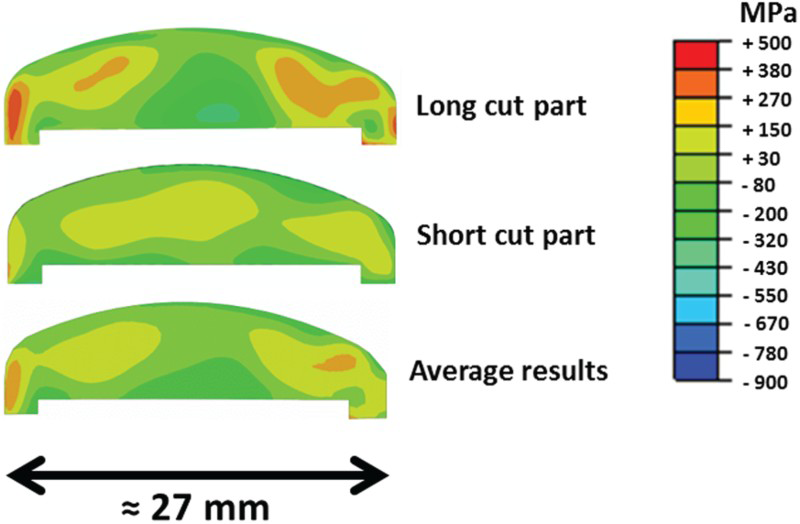
To take into account the asymmetry effect for contour cut 3, the data sets from the two cut faces were separately smoothed (using a cubic spline) and applied as boundary conditions on the corresponding cut part (short or long cut part, see Figure 5). The final stress distribution from contour cut 3 was obtained by averaging the stress results from the short and long cut parts.
Labelling of different sections of the femoral, the dotted white lines denote the plane of the wire-EDM cuts.
Usually when multiple cuts are conducted on a component the superposition principle is required to reconstruct the original stress distribution on the cuts [5]. As part of this work multiple cuts were undertaken, thus for the contour cut 2, the ‘original’ (undisturbed) hoop stresses on the contour cut 2 plane = ‘relaxed’ hoop stresses (due to contour cut 1) + ‘remaining’ hoop stresses measured by contour cut 2. Similarly, the ‘original’ (undisturbed) hoop stresses on the contour cut 3 plane = ‘relaxed’ hoop stresses (due to contour cut 1) + ‘relaxed’ hoop stresses (due to contour cut 2) + ‘remaining’ hoop stresses measured by contour cut 3. However, because the relaxed hoop stresses due to contour cut 1 on contour cut 2 and due to contour cuts 1 and 2 on contour cut 3 were negligible, as determined by the FE model, the superposition principle was not applied.
X-ray diffraction
X-ray diffraction can determine strain to a depth of approximately 5 µm for cobalt alloys [10]. Conroy and Tanner [1] has shown that X-ray diffraction is a suitable method for application to ASTM F75 samples which have experienced plastic deformation on their surfaces, which results in suitably refined diffracting domains. X-ray diffraction was applied to the shot-blasted femoral, femoral #3, following application of the contour method. The stress relief at the point of application (see Figure 6) due to the contour cuts was negligible.
Labelled image showing the location of the centre-hole drilling and X-ray diffraction measurements on femoral #3 (shot-blasted femoral). The X-ray diffraction measurements were applied prior to the centre-hole drilling technique and were made in the hoop and axial directions.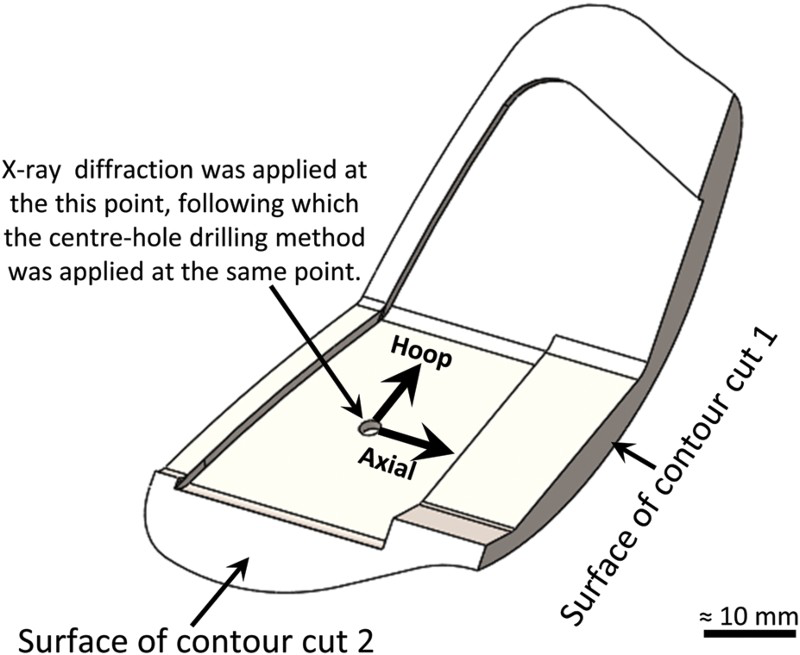
The cos-α X-ray diffraction method [44,45] was applied by Pulstec Industrial Co. Ltd, 7000-35, Nakagawa, Hosoe-cho, Kita-ku, Hamamatsu-City, Shizuoka Pref., 431-1304, Japan using their Pulstec µ-360 diffractometer equipped with a manganese-ray tube and a 2 mm diameter aperture. The {311} diffraction plane was utilised for experimentation due to its low sensitivity to inter-granular strain [31] and its high multiplicity factor of 24 [10]. The X-ray diffraction method was applied to the area highlighted in Figure 6 in two orthogonal directions (i.e. axial and hoop-directions).
Centre-hole drilling
The centre-hole drilling technique was conducted at the University of Limerick, Limerick, Ireland. The incremental drilling method was applied using a Micro-Measurements RS-200 drilling rig [46] at the location shown in Figure 6. An orbital drilling technique with a high-speed air-turbine and a 1.6 mm diameter inverted-cone carbide dental burr was utilised. The femoral was lightly clamped and adhered into a custom fixture for drilling, strain readings were monitored during clamping to ensure no strain was induced as a result. The strain gauges were wired using a 3-wire quarter-bridge arrangement for automatic lead-wire temperature compensation and increased measurement sensitivity in comparison to 2-wire arrangements [47].
As ASTM F75 is difficult to machine [1] the hole was progressed in steps of no more than 2 µm and it was ensured the orbital drilling was started and stopped at different points of rotation to prevent distortion of the drilled hole [48]. Based on prior experience of drilling ASTM F75 using the RS-200, this drilling procedure results in the best possible hole-geometry quality.
In an effort to reduce potential elastic anisotropy effects which may affect the strain response of each gauge-element differently, a Micro-measurements EA-06-125RE-120 strain gauge was used as a means to include as many grains as possible under each strain gauge element. The femoral surface was prepared as per guidance documents by the Vishay Precision Group [49]. As the femoral surface has a dimpled effect from the shot-blasting process, the gauge was adhered using M-Bond AE-10, a 2-part epoxy, as per guidance documents by the Vishay Precision Group [50]. This adhesive filled the dimples on the femoral surface, smoothing of the surface using abrasive paper was avoided as it would be expected to significantly alter the near-surface stresses [51].
The application of the incremental centre-hole drilling method fell outside the standard on a number of points and therefore obtained results can only be considered as indicative:
Femoral thickness: At the point of application the femoral was approximately 8 mm thick, as opposed to the required 10.26 mm [11], see Table 3. The femoral is therefore considered an ‘intermediate’ thickness component, which is not catered for in ASTM E837 [11]. Distance from boundaries/section changes: Distances were less than the 15.4 mm requirement [11], see Table 3. Diameter of the drilled hole: The maximum theoretical hole diameter possible using a 1.6 mm burr, the largest available at the time of application, would be 3.2 mm. However a degree of overlap was required to ensure a core material did not remain at the centre of the hole. The drill off-set was set such as to aim for a 3 mm diameter hole, but a 2.89 mm hole resulted. For the 1/8″ gauge utilised ASTM E837 [11] recommends a minimum hole diameter of 3.75 mm for application to a non-uniform stress state. ASTM E837 minimum requirements for the centre-hole drilling method compared with the experimental application to the femoral.
The integral method and calibration coefficients given in ASTM E837 [11] were utilised for stress calculation purposes. However, it would have been more appropriate to apply custom calibration coefficients which account for the above mentioned deviations [52].
Tikhonov second-derivative regularisation was also applied during the application of the integral method and regularisation factors were iteratively trialled until the deviation between the misfit vectors and the standard error was less than 5%, as described in ASTM E837 [11].
Nano-indentation
The shot-blasting process induces residual stress by plastic deformation on the surface of the component. This plastically deformed exterior layer of the femoral would be expected to exhibit an increase in hardness due to the work-hardening properties of the material [1]. Instrumented indentation was selected as a method to determine the thickness of this hardened near-surface layer. ASTM F75 consists of a cobalt-based matrix with M23C6 carbides distributed through it [15,53]. As the M23C6 carbides exhibit higher magnitudes of hardness [29] it is only of interest to determine the hardness of the cobalt-based matrix. Nano-scale indentation was therefore selected due to its fine spatial resolution, these measurements were conducted at the University of Limerick, Limerick, Ireland.
Samples were prepared by mounting them in Bakelite followed by grinding with 240, 500 and 1000 grit paper. Grinding was followed by polishing with 9, 3 and 1 µm abrasives and samples were finished with a vibro-polish using 0.06 µm colloidal silica for at-least 2 h. An Agilent Technologies G200 indenter was used and a continuous stiffness measurement technique was applied [54], which allows for hardness and elastic modulus to be determined as a function of indentation depth. This hardness vs. depth capability was utilised to determine if carbides existed below the samples surface which would alter the hardness measurement result. Indents were made using a diamond-shaped Berkovich indenter to a depth of 2 µm with a strain rate target of 0.05 s−1 and a surface-detection stiffness criteria of 200 N m−1. Such indentation depths resulted in indent diameters, i.e. a circle which encloses the entire indent, of ≈16 µm. Hardness values were averaged over a depth range of 1–2 µm and a Poisson's ratio of 0.3 was assumed.
Following indentation the samples were etched to reveal grain boundaries and carbides. The samples underwent an electrolytic etch using a 10% ammonium persulphate solution. An 8 V DC source was used, the negative terminal of cable was utilised as the cathode, the sample to be etched was the anode. The cathode was swiped above the sample surface until a yellow tint was observed, which typically takes 3–5 s. All indents were then inspected using an optical microscope and indents which indented on grain boundaries or on carbides were omitted from the results.
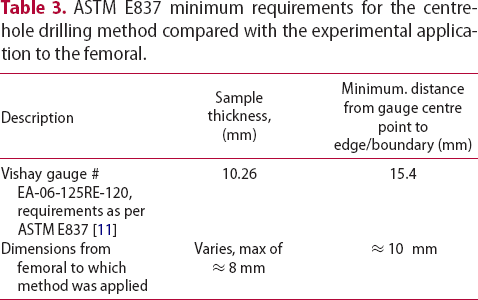
Two indentation arrays, Array 1 and Array 2, were applied to the cut surface of contour cut 2 (see Figure 7) of femoral #3 (i.e. the shot-blasted femoral) and for comparison purposes measurements were also made on the surface of contour cut 2 of the as-cast sample, femoral #1, referred to as Array 3 and Array 4.
Schematics showing the location of indentation Array 1 and Array 2.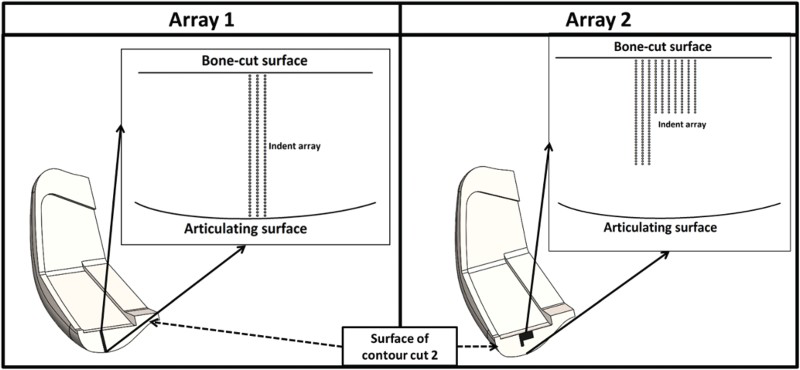
Array 1
The first indentation array was 3 indents wide and 44 indents long with 150 µm centre-centre spacing (see Figure 7). The 150 µm spacing adheres to recommendations in both ISO 14577 [55] and ASTM E2546 [56]. This array of indents passed from the bone-cut surface through to the articulating surface (see Figure 1 for an image labelling the bone-cut and articulating surfaces).
Array 2
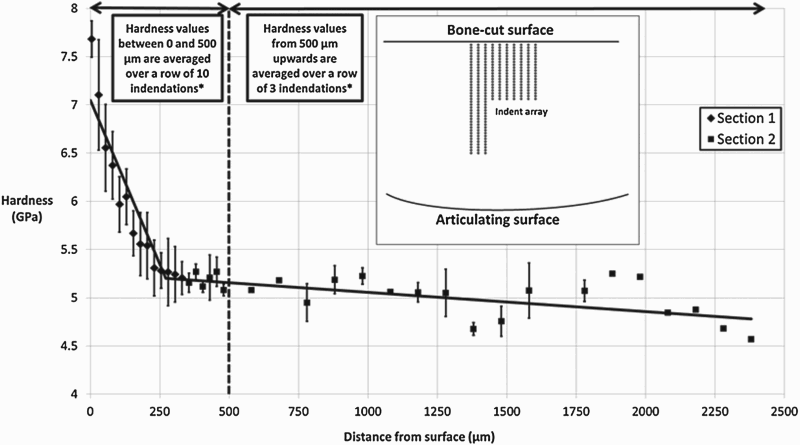
In order to attain a greater resolution of information towards the exterior surface of the femoral a second array was applied. This array initially consisted of 10 indents wide by 20 indents long with a centre-centre spacing of 25 µm. After this the array narrowed to 3 indents wide by 20 indents long with a centre-centre spacing of 100 µm, see Figure 7. It should be noted that this refined indentation spacing does not adhere to spacing recommendations outlined in ISO 14577 [55] and ASTM E2546 [56], therefore results obtained can only be considered as indicative.
Array 3
An array of 3 indents wide by 6 indents deep with 150 µm centre-centre spacing was made from the bone-cut surface on an as-cast sample. The 150 µm spacing adheres to recommendations in both ISO 14577 [55] and ASTM E2546 [56].
Array 4
An array of 5 indents wide by 10 indents deep with 50 µm centre-centre spacing was made from the bone-cut surface on an as-cast sample. Fifty micrometres spacing was chosen for spatial resolution purposes but does not adhere to recommendations in both ISO 14577 [55] and ASTM E2546 [56], therefore results obtained can only be considered as indicative.
Microstructural evaluation
Given that cast ASTM F75 exhibits a coarse grain structure and that FCC crystals directions will be dependent on the solidification direction during casting, texture may exist within the femoral [1]. Both texture and grain sizes were assessed during microstructural evaluations conducted at the University of Limerick, Limerick, Ireland. The following metallographic samples were evaluated, metallographic samples were prepared as per the procedures outlined in Section ‘Nano-indentation’:
D-zero specimen #0: This metallographic sample was prepared such that the view was along the axial axis of the cylinder D-zero specimens #1–5: These specimens were mounted such that the surfaces of the contour cut facing in the hoop-direction could be evaluated (see Figure 3). These specimens would simultaneously yield information about both the neutron diffraction gauge volumes and contour cut 3 for the as-cast femoral. Contour cut surfaces: Metallographic samples from each of the contour cut surfaces for the as-cast femoral (femoral #1) were prepared. Contour cut 3 for the as-cast specimen was evaluated in conjunction with d-zero specimens #1–5 mentioned above.
A Hitachi SU-70 Scanning Electron Microscope (SEM) set at an accelerating voltage of 20 keV with a Nordlys Electron Back Scatter Diffraction (EBSD) detector and relevant software was utilised to obtain inverse-pole maps of various regions of the metallographic samples [57]. Considering the anticipated coarse grain structure, step-sizes of 10–15 µm were deemed appropriate to allow for time-efficient EBSD scanning. The EBSD scans were controlled and data indexed using Oxford Instruments HKL Channel 5 software with alpha-Cobalt as a reference pattern. Inverse-pole maps were then generated using Oxford Instruments HKL Tango software.
An EBSD scan was conducted at the centre of each d-zero specimen at a magnification of ×100, which covered an area approximately 1 mm high by 1.25 mm wide. A number of scans of the same specifications were conducted at interior and near exterior regions of each of the contour cut surfaces.
Results and discussion
Neutron diffraction
D-zero specimens
In total, d-zero measurements were made on six different specimens. Two measurements per d-zero specimen were made at 180° to each other with scattering vectors as detailed in Section ‘Lattice parameter measurement’. The average d-zero lattice parameter was 3.57915 Å and all d-zero lattice parameters, including fitting uncertainty, fell within the range of 3.57825–3.58045 Å. Relative to the overall average d-zero lattice parameter, deviations in terms of strain for each d-zero specimen are shown in Figure 8 and were calculated as follows:
Deviation of lattice parameters for each scattering vector relative to the overall average d-zero lattice parameter (see Equation (6)). Overall standard deviation: 
 . Standard deviation omitting d-zero specimen #1 and #5:
  .
.
The lattice parameter of d-zero specimens #1 to #5 exhibited a greater degree of scatter about the overall average than that of d-zero specimen #0, which shows good agreement (see Figure 8). This observation suggests that coarse grain structure was not problematic for d-zero specimen #0. In a number of cases the lattice parameter for the same scattering vector-direction in the 0° and 180° rotations do not agree, suggesting that a coarse grain structure is causing a shift in the SGV centroid from that of the IGV. All d-zero specimens, except for #0 and #1, displayed missing diffraction peaks and varying peak intensities between scattering vectors, further evidence of an excessively coarse grain structure leading to an insufficient number of diffracting domains.
Figure 9 shows deviation, in Deviation of lattice parameters for each scattering vector with measurements 180° apart averaged. Overall standard deviation:  , of lattice parameters for each scattering vector-direction averaged for the 0° and 180° rotations, the purpose of which was to reduce systematic errors [33], as outlined in Section ‘Challenges’. As can be observed by comparing Figure 8 with Figure 9, the averaged 0° and 180° lattice parameter for d-zero specimens #2 through to #4 resulted in a reduced deviation from the overall average and greater agreement between lattice parameters from radial and hoop-directions. Omitting d-zero specimen #1 and #5, which still exhibit inexplicable deviation, a 62% reduction in the standard deviation between individual lattice parameter-deviations given in Figure 8 and the average lattice parameter-deviations given in Figure 9 was observed. This finding is in agreement with observations by Holden [33] for a coarse-grained material. This experimental technique will thus significantly reduce systematic errors associated with SGV shifts as a result of coarse grain structure. Additionally, it is expected that a spatial variation in d-spacing does not exist considering that d-zero specimens #2, #3 and #4 moved towards to the overall average lattice parameter following averaging of lattice parameters 180° apart.
 . Standard deviation omitting d-zero specimen #1 and #5:
  .
.
Femorals
As anticipated, due to the scattering properties of ASTM F75 [1], required count times were excessive. Count times in the region of 2.5 h per measurement were required in order to obtain fitting strain errors in the region of  for path-lengths up to ≈10 mm during experimentation. A measurement with a 2 × 2 × 2 mm3 gauge volume and a 14 mm path-length in an Fe sample would take 1.5 min to achieve
  uncertainty on ENGIN-X [36].
The magnitude of the majority of determined stress values obtained were not feasible, some values were of the order of thousands of MPa, therefore determined residual stress is not reported. The only reported stress results are those included in Table 5 for comparison with the contour method.
Path-length limitations
Diffraction spectrums from the gauge volumes of femoral #1 and the corresponding d-zero specimens were compared. During comparisons it was ensured the scattering-vector-direction was consistent for each gauge volume. This comparison allowed for the investigation of the effect of increasing path-lengths against the d-zero specimens which had a minimal total-path-length of ≈3.5 mm. The intensity of diffraction peaks became unsuitable for fitting for total paths-lengths above ≈5 mm and diffraction peaks became undistinguishable for path-lengths greater than ≈8 mm. Thus for successful measurement purposes with ASTM F75, path-lengths less than 5 mm are recommended. Additionally, missing peaks and varying intensities were noted between diffraction spectrums, further evidence of a coarse grain structure, as verified by microstructural evaluations (see Section ‘Microstructure evaluation’).
Summary
Neutron diffraction determined residual stress magnitudes were not reliable. Following a review of the various diffraction spectrums it can be concluded that both large grain sizes and path-lengths hindered the ability to obtain reliable results. Neutron diffraction is not a suitable residual stress determination technique for application to ASTM F75 femorals. On the basis of observations made, neutron diffraction residual stress determination in ASTM F75 components would only be feasible under the following restrictive conditions:
○ Grain structure sufficiently refined to give diffraction patterns with peaks of sufficient intensity from all possible diffraction planes. ○ Total neutron path-lengths less than 5 mm. ○ Two measurements at 180° to each other for each scattering vector. This requirement would be difficult to achieve give the above prohibitively short total-path-length capabilities.
Contour method
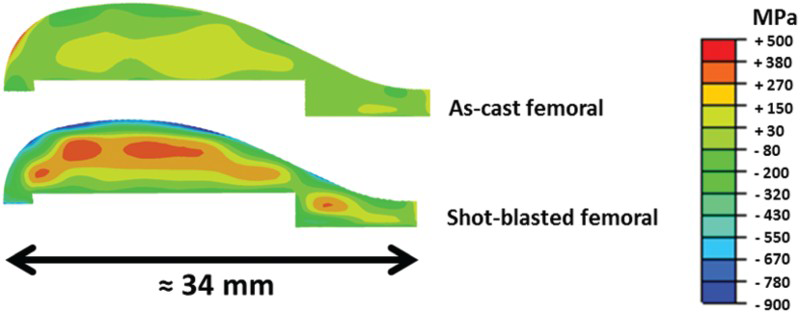
Figures 10–13 show the contour plots of residual stress determined by the contour method for both femoral #1 (as-cast) and femoral #3 (shot-blasted) on each cut plane detailed in Figure 2. From a comparison of contour plots from femoral #1 and femoral #3 a significant change in magnitude of the bulk stress of the femoral can be observed in axial and hoop-directions. The shot-blasting process induced a compressive near-surface layer of stress balanced by a tensile interior region, i.e. the expected stress state outlined in Section ‘Shot-blasting’.
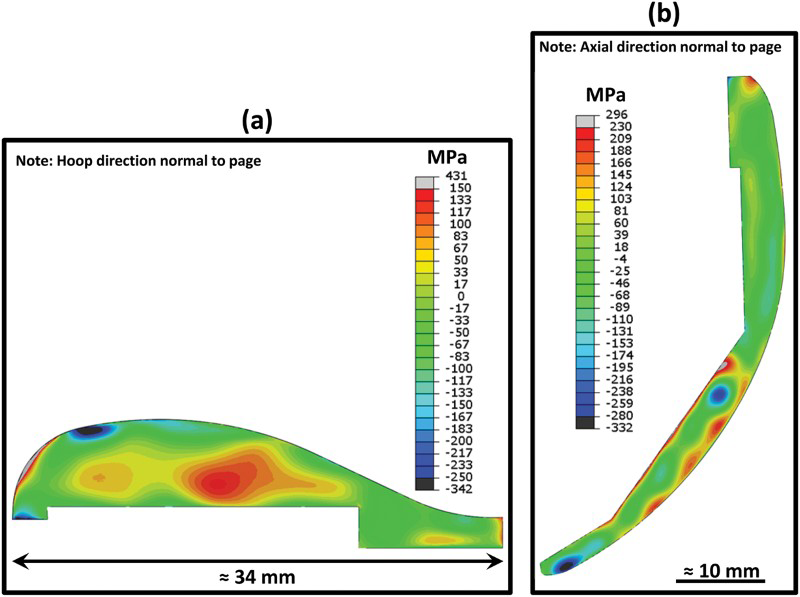
Contour maps of axial residual stress determined by the contour method on the cut 1 plane (see Figure 2) for femoral #1 (as-cast) and femoral #3 (shot-blasted). Contour maps of hoop residual stress determined by the contour method on the cut 2 plane (see Figure 2) for femoral #1 (as-cast) and femoral #3 (shot-blasted). Contour plots of femoral #1, the as-cast femoral, with altered limits on the contour colouring scheme. (a) Shows the cut 2 plane and (b) shows the cut 1 plane (see Figure 2 for reference to the cut planes).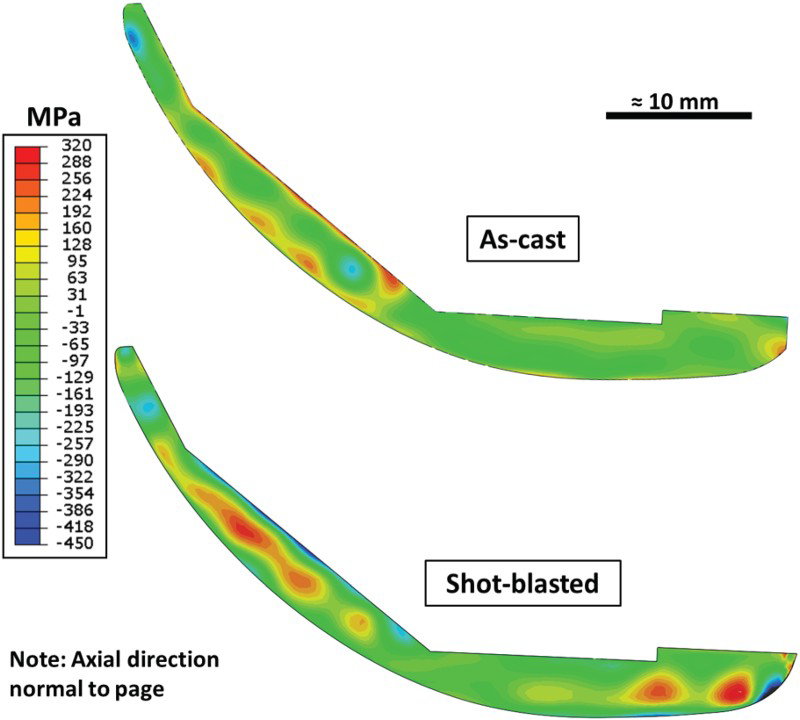
Line plots of the hoop-direction stress determined by the contour method (see Figure 14) show a compressive stress layer of significant magnitude and thickness near the articulating surface on femoral #3 (shot-blasted). A compressive stress in the hoop-direction near the articulating surface of the femoral is an optimal condition for flowering following material removal [1]. Contour method hoop-direction results also show that the articulating surface experienced a greater degree of induced compressive stress than the bone-cut surface (see Figure 14). This is likely due the fact that the bone-cut surface for contour cut 2 was in a corner (see the inset image in Figure 14). The geometry of this corner appears to have an influence on the stress distribution and/or the geometry of this area may have resulted in lower exposure during shot-blasting. Further evidence that the corner-geometry feature influences the shot-blasted femorals stress state can be observed from the contours of Figure 10 as well as comparison between line plots for path 1 and path 2 shown in Figure 15. Contour cuts away from these corner features may reveal a larger magnitude of near-surface compressive hoop stress on the bone-cut side.
Line plots from both femoral #1 (as-cast) and femoral #3 (shot-blasted) on the cut 2 plane (see Figure 2), along the path shown on the inset image. Cut 2 corresponds to the hoop component of stress, see Figure 1. Hoop-direction centre-hole drilling results are also included along with averaged X-ray diffraction results. Figure 6 shows the location of the centre-hole drilling and X-ray diffraction results. As the integral calculation method was applied for the centre-hole drilling method, stress determined is an average over each drilled-hole depth increment, therefore the depth increments shown are at the centre of each drilled-increment.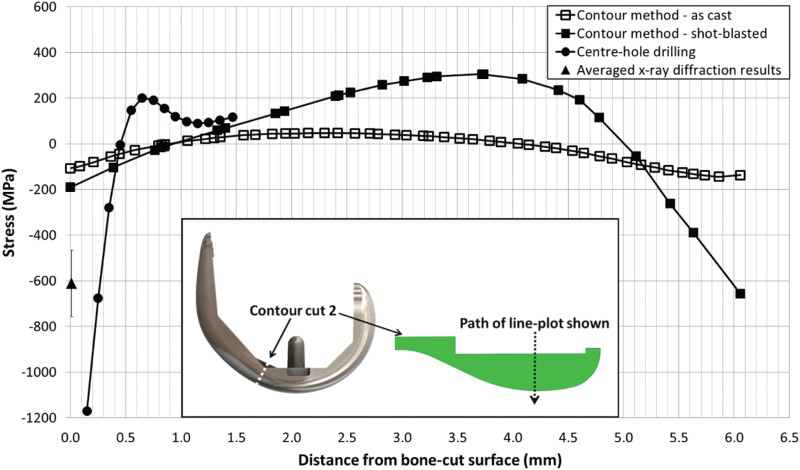
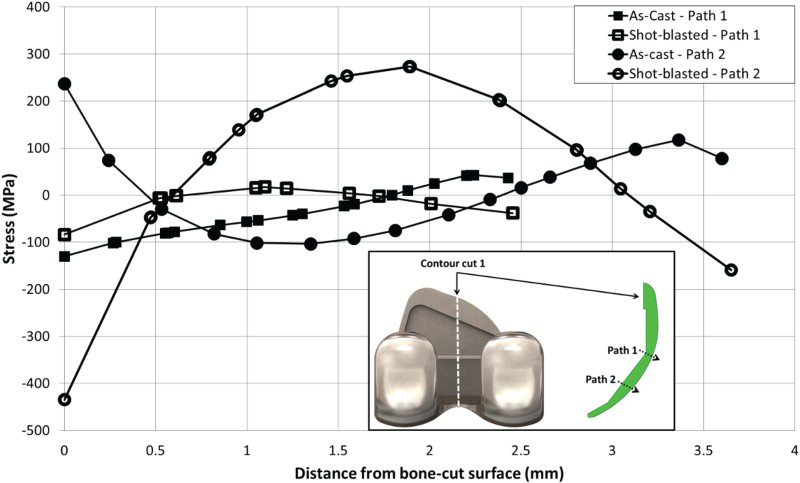
Figure 13 shows contour plot results from contour cuts 1 and 2 from femoral #1 (as-cast) with an altered range on the legend to show the spatial variation in stress in greater detail. Results from contour cut 2 display the expected stress state of a cast component with a compressive exterior and tensile interior [19]. Contour cut 3 on femoral #1 (see Figure 12) displayed a complex residual stress state in the hoop-direction which does not agree with contour cut 2 for femoral #1. This disagreement suggests that the residual stress state from casting is not consistent about the hoop-direction. The cause of this disagreement is likely the result of the following influences; more complex solidification near the extremities of the femoral, casting mould constraints or contour method asymmetry errors. Contour cut 1 also has a complex stress state with some exterior regions of tension and interior regions of compression (see Figure 13). This deviation from the expected aforementioned stress state is likely the result of a complex solidification and cooling scenario.
The contour method has shown that the shot-blasting process significantly alters the bulk residual stress of the femoral from its as-cast condition, despite the use of low-hardness shot. This ability of the shot-blasting process to alter the bulk residual stress is attributed to the large surface-area to volume ratio of the femoral. The large surface-area to volume ratio means that the volume of material into which compressive stress is induced is large relative the volume of the entire sample. Image analysis was conducted on the contour plot for the shot-blasted part (femoral #3) in the hoop-direction (Figure 11) where the surface area of compressive to tensile stress was determined to be split 44–56%. For the axial direction (Figure 10) the split was 52% compressive to 48% tensile.
X-ray diffraction
X-ray diffraction residual stress measurements obtained from femoral #3 are shown in Table 4. The large standard deviation values are the result of a coarse grain structure, which was evident by observation of varying intensity in the DeBye rings (see Figure 16). While the DeBye ring does have varying intensity, it is not considered ‘spotty’ and the results can be considered indicative of a bi-axial compressive surface stress [1] of significant magnitude, as would be expected following the shot-blasting process [26].
Three-dimensional view of the Debye ring obtained from X-ray diffraction measurement in the axial-direction. Intensity is represented by peak height in Z direction. Varying peak intensities of the Debye ring of interest suggests the presence of coarse grain structure [1]. X-ray diffraction results from femoral #3 (shot-blasted) shown in Figure 6. Note: Results were obtained utilising a Pulstec µ-360 diffractometer with elastic constants E311 = 193 GPa; 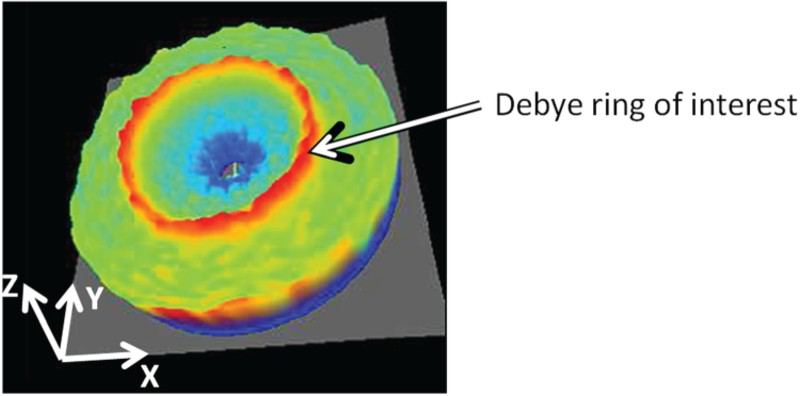
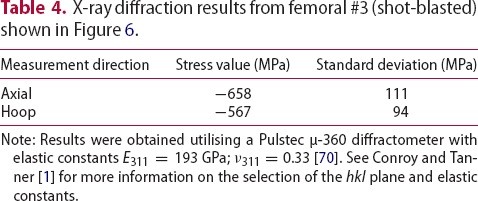
 [70]. See Conroy and Tanner [1] for more information on the selection of the hkl plane and elastic constants.
Centre-hole drilling
Figures 14 and 17 show the results from the centre-hole drilling method applied to femoral #3 (shot-blasted) in the hoop and axial directions, respectively. As the femoral's surface was prepared using silicone-carbide abrasive paper (which alters the near-surface residual stress [51]) and the surface was dimpled (which resulted in uncertainty in the determination of the zero-datum [12]), the first depth increment from the incremental centre-hole drilling measurement was dismissed and therefore results are only reported from a depth of 0.15 mm.
Axial-direction centre-hole drilling results compared with axial-direction contour method results and averaged X-ray diffraction results. Inset image shows location of contour method line plot, Figure 6 shows the location of the centre-hole drilling and X-ray diffraction results. As the integral calculation method was applied for the centre-hole drilling method, stress determined is an average over each drilled-hole depth increment, therefore the depth increments shown are at the centre of each drilled-increment.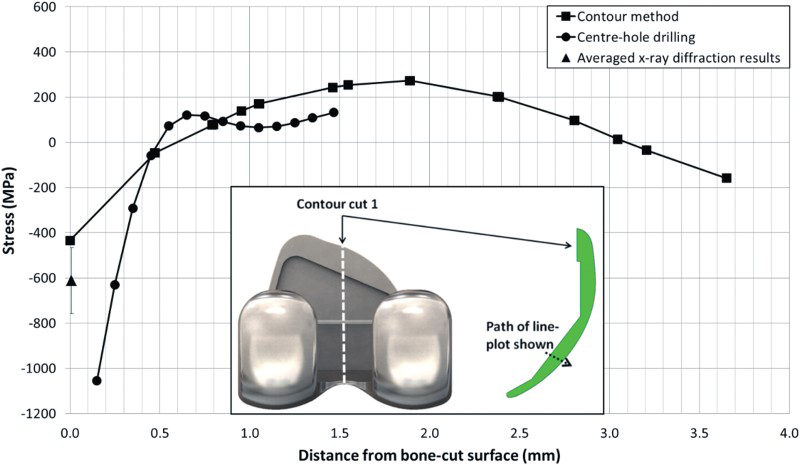
Guidelines exist for the magnitude of stress which can be determined by the centre-hole drilling method: measurements in thick samples can be made up to 80% of yield-strength and up to 50% of yield in thin samples [11]. The application of the Vishay EA-06-125RE-120 strain gauge means that the femoral is considered an ‘intermediate’ thickness component, which is not covered by ASTM E837 [11]. From Figure 14 and 17 it can be observed that the magnitude of determined near-surface stress is in excess of the tensile yield-strength of coarse-grained as-cast ASTM F75, which is approximately 5–600 MPa [29]. Such large magnitudes do not adhere to the aforementioned stress magnitude limitations and therefore the results can only be considered as indicative [11]. The occurrence of plastic deformation results in the over-determination of residual stress magnitudes along with unknown errors related to strain-gauge-rosette position relative to the principal stress directions [11,59].
However, it should be noted that during a process which induces surface plastic deformation, such as shot-blasting, an exterior layer of material is work-hardened (the depth of which was assessed by nano-indentation and is reported in Section ‘Nano-indentation’) and the grain structure is refined (see findings of the X-ray diffraction measurements reported in Conroy and Tanner [1]). Therefore, there exists the potential for the work-hardened material to resist plastic deformation of residual stress higher than the tensile properties of the coarse-grained non-work-hardened as-cast material, this potential depends on the degree and depth of plastic deformation. As an example, ultrafine-grained forged CoCrMo alloys exhibited a 0.2% tensile proof stress in region of 1 GPa [60] in comparison to 5–600 MPa for the material in an as-cast coarse-grained condition [29]. However, for the first depth increment the magnitude of stress determined was in excess of upper-limit yield-stress potential of 1 GPa (see Figures 14 and 17), therefore plastic deformation definitely occurred.
Steinzig et al. [61] and Nau and Scholtes [62] have shown that the geometry of the drilled hole is influential the on accuracy of the centre-hole drilling method. Considering ASTM F75 is a difficult material to machine, the geometry of the drilled hole was inspected and found not to be an idealised straight-sided flat-bottomed hole as would have been assumed in the generation of the calibration coefficients for the integral method. Rounded corners at the hole-side to bottom intersection were evident which would have been a result of wearing of the drill burr; it is likely that the degree of rounding at the holes corners become more severe with depth as the drill bit wore. The geometry of a hole drilled by Veqter Ltd, was found to be of better quality with straighter sides, a flat bottom and corners with less severe rounding. The residual stress results from Veqter's measurement were reported in Conroy and Tanner [1]. The drilling method applied by Veqter Ltd, also utilised the same 1.6 mm inverted-cone dental-carbide-burr, however the drill was CNC controlled to drill a 4 mm diameter hole in an orbital fashion using an electric motor with ≈10 krpm spindle speed. The difference in hole-geometry quality is believed to be the result of following differences between the two drilling methods:
The high-speed air-turbine, with reported spindle free-speeds of ≈350 krpm [61], would be expected to result in accelerated burr wear. Occasional sticking of the drill burr occurred due to the low torque of the air-turbine. Veqter's orbital drilling method had a greater degree of overlap during orbital drilling, the RS200 only allows for the burr to be rotated with a fixed off-set. This greater overlap would be expected to result in a hole with a flatter bottom.
Despite the outlined short-comings, the centre-hole drilling results shows the expected stress state of a compressive near-surface residual stress, switching to tensile at interior regions. In agreement with observations from the contour method results, it can be concluded, qualitatively, that the shot-blasting process induced a large magnitude near-surface compressive stress.
Nano-indentation
The results for the shot-blasted femoral, shown in Figures 18 and 19 for indentation Array 1 and Array 2 (see Section ‘Nano-indentation’ for a description of each array), show the expected work-hardened layer near exterior surfaces. This hardened layer was not observed for the as-cast femoral (Array 3 and Array 4) which had an average hardness of 5.42 ± 0.26 GPa. In an effort to estimate the thickness of hardened layers, the data was split into sections which were perceived to display a linear trend. Best-fit straight lines, using the least-squares method, were applied to each of these sections and the intersection of lines was used to determine the thickness of the work-hardened layers. The thickness of the observed hardened layer from Array 1 was of the order of 500 µm (see Figure 18). Array 2 suggests a hardened layer 270 µm thick, see Figure 19. However, these results from Array 2 should only be considered indicative, in an effort to obtain greater spatial resolution indent spacing guidelines were not adhered to.
Nano-indentation hardness measurements from Array 1 which were made on femoral #3 (shot-blasted). Nanoindentation hardness measurements start from the bone-cut surface of the femoral (0 µm), the last row of indents were ≈65 µm from the articulating surface. Where possible indentation hardness data shown for each depth increment has been averaged over 3 indents on each row and the standard deviation of this average is shown by the error bars. Indents which imprinted on carbides or grain boundaries were omitted and therefore each data point shown may not be an average of 3 indents. The hardened layer near the bone-cut surface was determined to be approximately 485 µm thick and hardened layer near the articulating surface approximately 550 µm thick. Inset image gives a schematic of the layout of the indentation array. Nano-indentation hardness measurements from Array 2 which were made on femoral #3 (shot-blasted). Nano-indentation hardness measurements start from the bone-cut surface of the femoral (0 µm) towards its interior. The hardened layer near the bone-cut surface was approximately 270 µm thick. Inset image gives a schematic of the layout of the indentation array. *Indents which imprinted on a carbide or grain boundary have been omitted; therefore each data point may not be an average of 10 or 3 measurements as stated.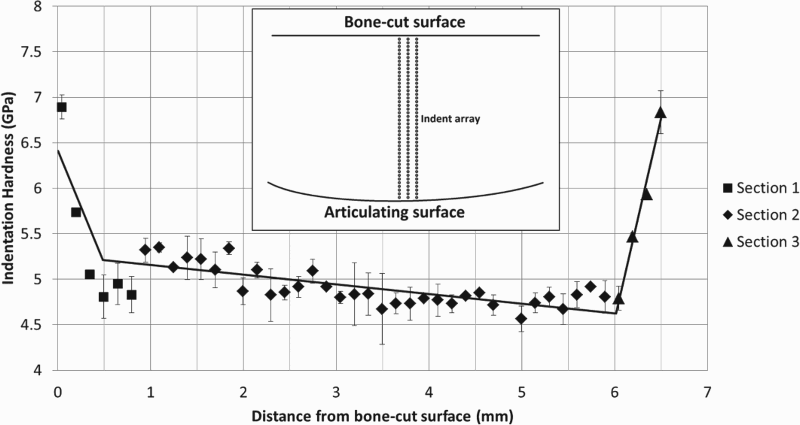
Microstructure evaluation
D-zero specimen #0
D-zero specimen #0 displayed elongated grains which grew radially from the cylinders surface. Grains towards the exterior surface of the casting were of the order of 200 µm while those towards the central regions became elongated and approached approximately 500 µm in length and 200 µm in width. The grain structure of d-zero sample #0 was more refined than that of the other gauge volumes subject to neutron diffraction experimentation, this observation is in agreement with observations from the diffraction spectrums of the d-zero specimens discussed in Section ‘D-zero specimens’.
D-zero specimen #1
D-zero specimen #1 displayed grain sizes throughout its bulk of similar magnitude to the interior region of specimen #0. No preferred orientations were noted.
D-zero specimens #2 through to #5
D-zero specimens #2 through to #5 all displayed similar grain structures of large columnar grains whose lengths were aligned in particular directions. The grains were of the order of 1 mm in length and 3–400 µm in width. Figure 20 was typical of the grain structure observed for d-zero specimens #2 through to #5. The direction of the length of the columnar grains observed in each d-zero specimen suggest the femoral solidified from its exterior surfaces, as opposed to solidifying around its hoop-direction. It would therefore be expected that strong <100> texture exits in this solidification direction [63–65]. The surface of the metallographic samples prepared would have been 90° to the solidification direction and therefore <111> grain orientations would not be expected as <111> directions would be aligned 35.24° from the <100> direction. As can be observed from Figure 20 few grains towards the <111> direction existed normal to the surface, this texture was also observed from EBSD maps for d-zero specimens #1 to #5. This texture would result in an elastic modulus less than the overall bulk average in the direction normal to the surface as <111> directions exhibit the largest elastic modulus values [1].
EBSD map of d-zero gauge volume #3. Map step size: 10 µm.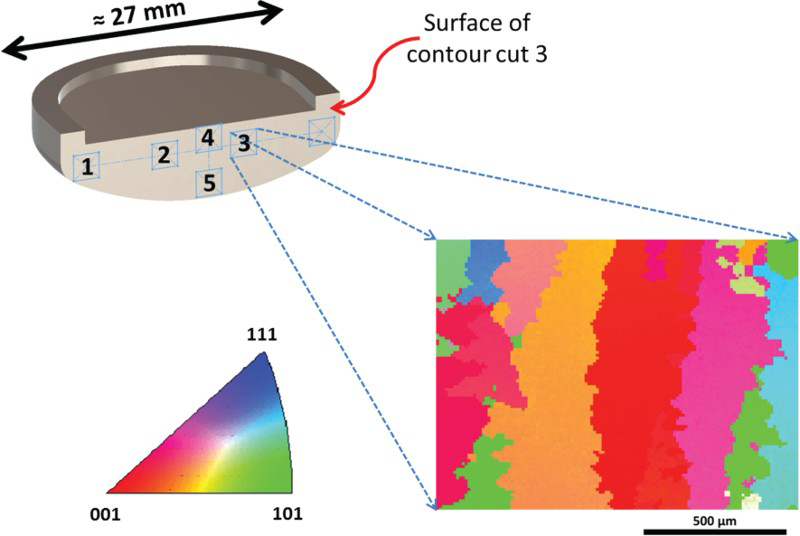
Contour cut surfaces of femoral #1
The surfaces of contour cut 1 and cut 2 exhibited coarse grains sizes of 500 µm upwards, the shape of which were random as were their orientations. See the discussion for d-zero specimens #2 through to #5 in Section ‘D-zero specimens #2 through to #5’ for a description of the microstructure of contour cut 3.
Summary
In summary the grain structure of ASTM F75 varies significantly depending on the location within the femoral. Near-surface and small cross-section areas result in more refined grain structures due to quicker cooling-rates and the use of an inoculant in the prime-coat layer of the casting shell.
Strong texturing within the implant would be expected to exist in the direction of solidification. A less severe degree of texture in the hoop-direction in the vicinity of contour cut 3 of femoral #1 was observed. Therefore, the assumption of isotropic elastic material properties for neutron diffraction, centre-hole drilling and the contour method will result in errors when determining stress from strain, the degree of the error will depend on the true elastic properties in the direction of the strain measured relative to the assumed elastic properties.
Overall discussion
Comparison of stress in the hoop-direction for the as-cast femoral as determined by neutron diffraction and the contour method.
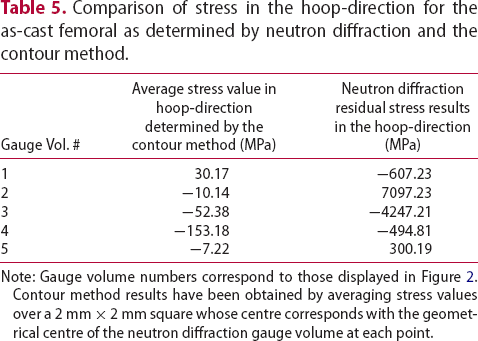
Note: Gauge volume numbers correspond to those displayed in Figure 2. Contour method results have been obtained by averaging stress values over a 2 mm × 2 mm square whose centre corresponds with the geometrical centre of the neutron diffraction gauge volume at each point.
Figures 14 and 17 show a comparison between centre-hole drilling, X-ray diffraction and the contour method determined residual stress results in the hoop and axial direction for femoral #3 (shot-blasted). Qualitative agreement between these results exists. The centre-hole drilling and contour method results show a similar trend of increasing near-surface compressive stress, but with larger magnitudes determined by the centre-hole drilling method. However, the location of these measurements should be noted, X-ray diffraction and centre-hole drilling were applied at the same location while the contour cut planes were some distance away (see Figure 6). It was outlined in Section ‘Contour method’ that the geometry of the femoral at the location of contour cut 2 may result in low near-surface compressive stresses on the bone-cut side. The application of the contour method closer to the location of the centre-hole drilling and X-ray diffraction method may yield better agreement between the magnitudes of the results, although the occurrence of plastic deformation during application of the centre-hole drilling method resulted in an over-determination of stress of unknown magnitude. Additionally, the near-surface capabilities of the contour method are limited [6], albeit improved by the use of special precautions such as sacrificial layers [6] and fine grid spacing during surface profile measurement. The X-ray diffraction results also compliment the contour method and suggest that the trend of increasing compressive stress determined by the contour method would continue towards the surface. On a qualitative basis, all three residual stress methods confirm the shot-blasting process, despite utilising low-hardness shot, induces a compressive exterior layer of stress of significant magnitude and alters the bulk residual stress state of the femoral component.
The thicknesses of the hardened layers observed (≈0.27–0.5 mm) are approximately 50% of the thickness of the compressive stress layer determined by the incremental centre-hole drilling and the contour method, which were ≈0.5–0.8 mm (see Figure 14). Therefore nano-indentation harness testing could be used as a means to investigate manufacturing processes which induce surface plastic deformation. The thickness of the plastically deformed layer would give an indication as to whether or not the manufacturing process is capable of altering the bulk residual stress state of the femoral. The aforementioned thicknesses are significant relevant to the overall thickness of the femoral which varies from 2 to 8 mm.
Microstructural evaluations revealed the grain structure of cast ASTM F75 was coarse and varied, with texture as a result of solidification directions. This confirmed texture, combined with the significant variance in individual-crystal-direction elastic properties previously identified [1], confirms that assumption of isotropic material properties is incorrect. This assumption would influence all results reported, apart from X-ray diffraction [1]. This influence cannot be quantified without accurate three-dimensional knowledge of the elastic modulus of the femoral.
Elastic modulus variation, if known, can be accounted for in the finite element models of the contour method in order to allow quantitative residual stress determination [6,40]. Given the coarse grain structure it could also be possible to observe Type II stress (i.e. grain-dependent stress) when the true elastic properties of the femoral are represented. Determination of the grain sizes and orientations would be a challenging task as the elastic properties of grains behind the contour cut surface would be required as well as those on the cut surface. Potentially feasible methods could be the removal of layers of material from the contour cut surface and mapping the grain orientation of each layer using EBSD [66] or the application of neutron transmission tomography to non-destructively determine the grain structure and orientation in the vicinity of the applied contour method cut [67–69].
Conclusions
Shot-blasting casting shell removal processes have the ability to significantly alter the bulk residual stress state of the femoral implant, even with the use of low-hardness shot. An induced compressive exterior region of residual stress with a balancing interior tensile region results, as verified by the contour method, X-ray diffraction and the centre-hole drilling technique. Centre-hole drilling and the contour method are capable of qualitatively determining differing stress states and expected stress profiles in cast ASTM F75. Therefore, these techniques are suited for qualitative process investigations. X-ray diffraction has previously been shown as a feasible quantitative technique [1]. Neutron diffraction is not a feasible method for residual stress determination on cast ASTM F75 femorals. The averaging of neutron diffraction lattice parameters obtained 180° apart will significantly reduce systematic errors associated with SGV shifts as a result of coarse grain structure. The shot-blasting process has the ability to work-harden the material to a depth of ≈270–500 µm from the surface. Nano-indentation hardness testing can be used to assess the potential influence of residual stress inducement by processes which plastically deform the surface of ASTM F75 femorals. Nano-indentation displayed a near-surface work-hardened layer of material, of significant thickness, which was induced by shot-blasting. The use of a Micro-measurements RS200 high-speed air-turbine drilling rig is not suitable for drilling ASTM F75 for the application of the incremental centre-hole drilling method. Electric-motor driven burrs at ≈10 krpm drilling in an orbital fashion with adequate overlap is more favourable.
Footnotes
Acknowledgements
The authors would also like to acknowledge the following personnel, universities and companies for conducting residual stress determination measurements and/or providing technical consultation: Dr Mike Woodard and Mr Yoshi Teramoto at Pulstec Industrial Co. Ltd., 7000-35, Nakagawa, Hosoe-cho, Kita-ku, Hamamatsu-City, Shizuoka Pref., 431-1304, Japan. Dr Xavier Ficquet and Dr Ed Kingston at Veqter Ltd., Unit 8 Unicorn Business Park, Whitby Road, Brislington, Bristol, BS4 4EX, UK. Dr Mike Prime, Los Alamos National Laboratory, Los Alamos, NM 87545, USA. Dr Gary Schajer, The University of British Columbia, Department of Mechanical Engineering, Vancouver Campus, 2054-6250 Applied Science Lane, Vancouver, BC Canada V6T 1Z4.
Disclosure statement
No potential conflict of interest was reported by the authors.