
Abstract
The plastic deformation and fracture behaviour of a high-nitrogen nickel-free austenitic stainless steel were examined by performing tensile testing at room temperature and at a wide strain rate range. The tensile testing demonstrated that this steel shows a significant strain rate dependence of the strength and ductility. With increasing strain rate from 10−4 to 1 s−1, the yield strength increases from 673 to 801 MPa and the ultimate tensile strength increases from 958 to 1003 MPa; the uniform elongation decreases from 75 to 44% and the total elongation decreases from 86 to 58%. The analysis of the stress–strain curve by using the Ludwigson equation showed that this steel exhibits a two-stage strain hardening behaviour, the strain hardening exponents at low and high strain regions ( and
and  ) and the transition strain (
 ) decrease with increasing strain rate. Based on the analysis results of the stress–strain curve, the transmission electron microscopy characterisation of the microstructure and the scanning electron microscopy observation of the deformation and fracture surfaces, the significant strain rate dependence of the strength and ductility of this steel was discussed and connected with the variation in the dislocation activity with strain rate.
Keywords
Introduction
High-nitrogen nickel-free austenitic stainless steels (nitrogen content is usually larger than ∼0.4% in mass percent, termed as HNSs) as one group of the important engineering materials have obtained great attentions owing to their excellent mechanical properties, i.e. improved strength and ductility, adequate work-hardening ability, high fracture toughness and desirable resistance to corrosion, etc [1–11]. These attractive properties depend on the benefit roles of nitrogen in enhancing solid-solution strengthening and stabilising austenitic structure [1,3–6,8]. The high content of nitrogen in austenitic structure would replace expensive nickel and offer an additional advantage of cost-saving [1,3,4,6,8]. Moreover, the enhanced solubility of nitrogen with increasing the contents of alloying elements, i.e. manganese and chromium, can be advantageous for it to be effectively applied in the manganese and chromium-based stainless steels [1,3,8].
Many attempts have been made to study the tensile mechanical properties and the microstructure evolution of the HNSs or other nitrogen alloyed austenitic stainless steels for extending their engineering applications [12–31]. These studies suggested that the plastic deformation and fracture behaviour of these steels depended on various kinds of internal and external factors, such as grain size [12,16], twin structure (e.g. size, shape and amount of twin) [17,23–25], allying elements (e.g. contents of carbon and nitrogen) [13–15,21,26,30,31] and testing temperature and strain rate [18–20,22,27–29]. However, it is noted from these studies that very limited efforts were made to study the plastic deformation and fracture behaviour of the HNSs at a very wide range of strain rate.
In this work, the plastic deformation and fracture behaviour of a HNS are investigated by tensile testing at a wide strain rate range from 10−4 to 1 s−1 at room temperature. The experimental tensile stress–strain curves were analysed by using the Ludwigson equation. Based on the analysis results of the stress–strain curve, the transmission electron microscopy characterisation of the microstructure and the scanning electron microscopy observation of the deformation and fracture surfaces, the significant strain rate dependence of the strength and ductility of this HNS was discussed and connected with the variation in the dislocation activity with strain rate.
Materials and experimental produce
Nominal chemical compositions of the present HNS (mass percent, %).

Microstructure observation of the present HNS before testing was performed by using a field emission scanning electron microscopy (FESEM, SUPRA-40) with electron backscattering diffraction (EBSD) analysis. The obtained data were analysed by orientation imaging microscopy with discrete step size in the range of 10–100 nm for EBSD mapping. Crystallographic structure of the present HNS before testing was examined by X-ray diffraction analysis (D/MAX-2500PC) with CuKα radiation. Microstructure characterisation of the present HNS at different plastic strains was carried out on a transmission electron microscopy (TEM, JEM-2100F) under an accelerating voltage of 200 kV. To obtain the thin foil HNS for EBSD and TEM observation, the specimens cut from the bulk HNS were first mechanically ground to a thickness of ∼20 μm, then thinned by an ion beam with a tilt angle of 4–8° using an Ion Polishing System (Gantan 691, U.S.A) under a voltage of 5 kV. Morphologies of the deformation and fracture surfaces of the present HNS were examined by FESEM.
Results
Microstructures
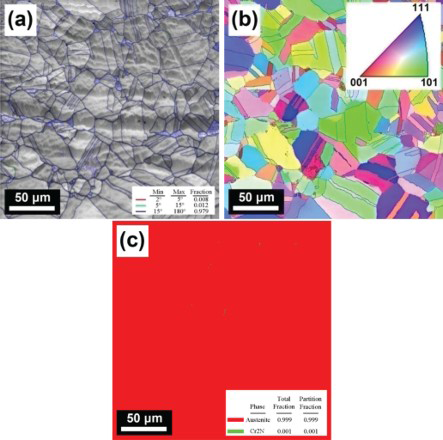
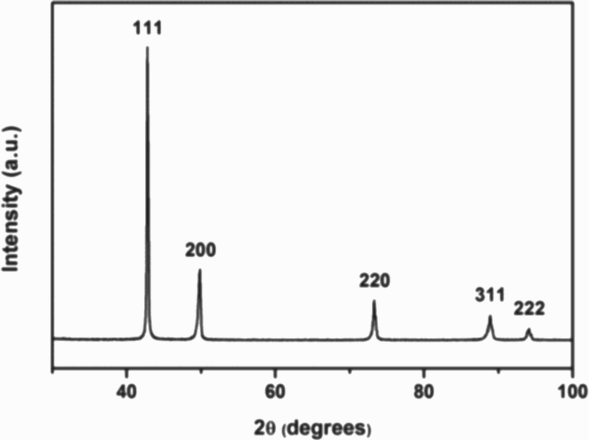
Figure 1 shows the results of the EBSD analysis of the present HNS. As shown, the intragranular misorientations presented in the Kikuchi pattern quality map (Figure 1(a)) and the stereographic triangle displayed in the inverse pole figure map (Figure 1(b)) reveal the variations of the intragranular misorientations and the contents of grain boundaries (GBs), respectively. It is clearly seen that the present HNS exhibits predominant high-angle GBs (misorientation gap The results of the EBSD analysis of the present HNS, (a) Kikuchi pattern quality map, (b) inverse pole figure map and (c) phase distribution map. X-ray diffraction pattern of the present HNS. ) and roughly equiaxed grains with random crystalline orientations. Twins formed during the solution treatment are also visible in some grains. The statistical measurements showed that the average grain size of the present HNS is about 40 μm. The phase distribution map in Figure 1(c) shows that the present HNS is composed of the austenitic phase (99.9%) and the very smaller amount of Cr2N phase (0.1%). The X-ray diffraction pattern of the present HNS in Figure 2 reveals that the present HNS is composed of the fcc austenitic phase and no characteristic peaks of Cr2N and ferrite phases can be observed, which is consistent with the results of the phase distribution in Figure 1(c).
Tensile properties
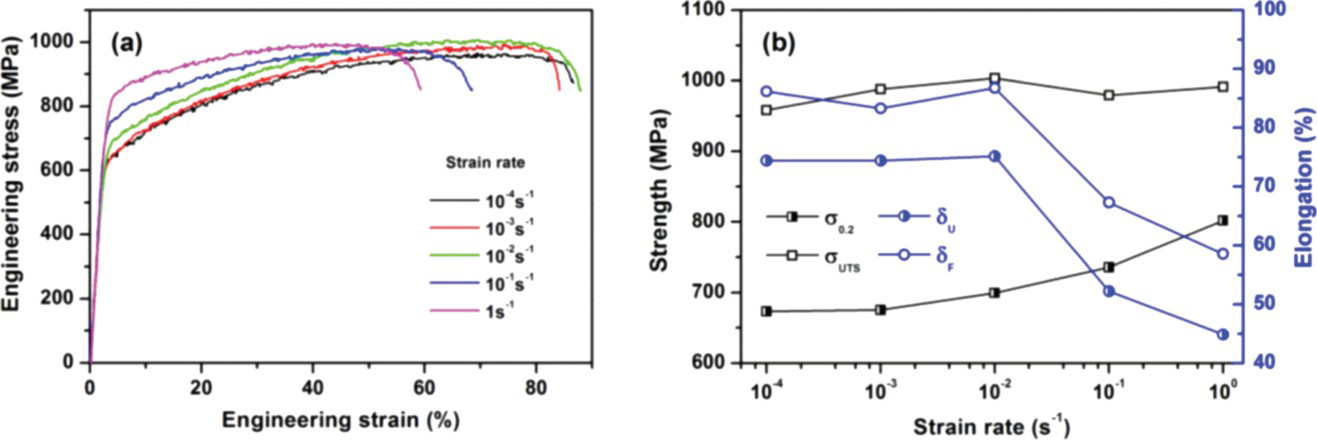
Figure 3(a) shows the engineering stress–strain curves of the present HNS tested at different strain rates (10−4 to 1 s−1) at room temperature. The tensile stress initially increases almost proportionally with strain in the initial elastic deformation stage. As strain further increases, a continuous yielding and strain hardening behaviour is observed. The region of the strain hardening gradually becomes short with increasing strain rate. The variations of the yield strength ( (a) Engineering stress–strain curves of the present HNS, (b) variations of tensile properties with strain rate. ), ultimate tensile strength (
 ), uniform elongation (
 ) and total elongation (
 ) with strain rate are plotted in Figure 3(b). As shown,
  and
and  increase and
  and
and  decrease with increasing strain rate.
Analysis of stress–strain behaviour
Figure 4 shows the typical double logarithmic true stress–true plastic strain ( Typical double logarithmic true stress–true plastic strain curves of the present HNS tested at two different strain rates ( ) curves of the present HNS tested at two different strain rates (10−4 to 1 s−1). In these
  curves, a distinct two-stage hardening behaviour can be observed, i.e.
  initially increases slowly in a nonlinear way up to a certain strain and then increases relatively rapidly in a linear way. Such two-stage strain hardening behaviour is similar to those observed in previous studies [32–36], which can be adequately analysed by using the Ludwigson equation, but cannot by using the Hollomon equation due to the existence of the positive stress deviation at low strain region. Using the Ludwigson equation, the flow stress can be expressed as [37] follows:

 is the term related to the contribution of the stress deviation from the Hollomon equation at low strain region,
  corresponds to the onset of the macroscopic plastic strain, i.e. the value of
  at
at  ,
,  is strength coefficient,
  and
and  are the strain hardening exponents related to multiple slip and planar slip of dislocations at high and low strain region, respectively.
 and
and  ).
).
Various parameters in Equation (1) can be determined by using the analysis method of Ludwigson [37]. By fitting experimental (a) Double logarithmic  data at high strain region (Figure 5(a)), the values of
  and
and  were obtained. Then the values of
  and
and  were determined by fitting experimental
  versus
  data at low strain region (Figure 5(b)) by using the obtained values of
  and
and  . Besides
  ,
,  ,
,  and
and  , the transition strain
  defined as critical strain above which the term
  can well fit the
  curve at high stain region is also an important parameter, which represents a transition in plastic deformation mechanism from planar slip of dislocations at low stain region to multiple slip at high strain region. The value of
  can be determined by letting the value of
  be very small in comparison with the value of
  , i.e. setting
 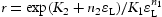 to be some arbitrary small value [32–34,37–39]. Based on the previous studies [32–34,37–39], a value of
  is selected to determine the value of
  in this study.
 curves of the present HNS at high strain region and (b) the corresponding
  versus
  curves at low strain region.
The resultant data of Variations of the parameters ( Parameters derived from the stress–strain curve of the present HNS by using the Ludwigson equation. ,
,  ,
,  ,
,  and
and  obtained by the above analysis are listed in Table 2. The corresponding variations of
  ,
,  ,
,  ,
,  and
and  with strain rate are shown in Figure 6. It can be seen that the values of
  ,
,  and
and  tend to decrease with increasing strain rate. The values of
  and
and  are nearly constants in the entire strain rate, which can be also seen in Table 2. It is interesting to note that the data fitted by using the Ludwigson equation exhibit a systematic trend with strain rate besides the unique set of parameters that can be obtained for each strain rate.
 ,
,  ,
,  ,
,  and
and  ) derived from the Ludwigson equation with strain rate of the present HNS.
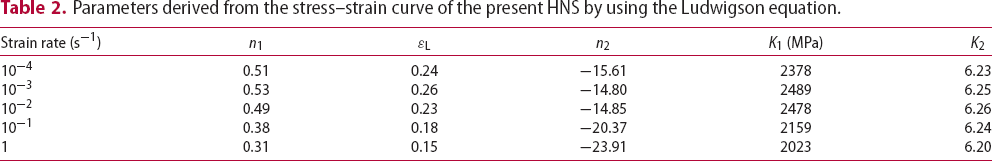
 )
)


 (MPa)
(MPa)
Figure 7 shows the typical comparison results of experimental and the corresponding fitted Typical comparisons of experimental and fitted Parameters derived from the stress–strain curve of various fcc metals and alloys in Ref. [37] by using the Ludwigson equation. curves of the present HNS tested at different strain rates (
 ,
,  and
and  ). As seen, the experimental
  curves at the entire strain range can be well fitted by using the Ludwigson equation for its large number of parameters (four parameters) according to the fact that the good approximation of an equation to experimental curves depends on the number of its parameters [33,40]. The parameters derived from the stress–strain curve of various face centred cubic (fcc) metals and alloys, with different levels of stacking fault energy (SFE) by using the Ludwigson equation in Ref. [37], are listed in Table 3, in which, the metals are arranged with increasing SFE values in a broad range of
  . As shown, the largest values of
  and
and  can be obtained in the stainless steels and brass with the lowest SFE. The lower values of
  and
and  are obtained in the metals with somewhat higher SFE, i.e. silver and copper. However, the values of
  and
and  cannot be obtained in the aluminium and nickel with the highest SFE. This suggests that the level of SFE can be evaluated according to the values of
  and
and  derived from the Ludwigson equation, i.e. austenitic stainless steels and brass (Table 3) with low SFE values usually exhibit a high value of
  and
and  . Obviously, the larger
  and
and  of the present HNS (Table 2 or Figure 6) are obviously associated with its low SFE (about
  ).
).
 curves of the present HNS tested at different strain rates.
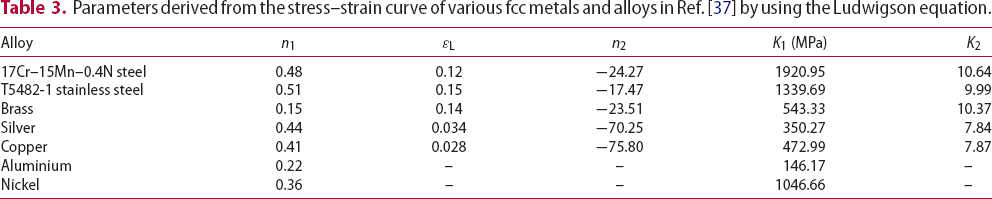


 (MPa)
(MPa)
Microstructures of the deformed specimens
Figure 8 shows the typical TEM images of the dislocation structures of the present HNS at different strain and strain rates ( TEM images of the present HNS deformed at 6 and 35% true plastic strain and the corresponding high-resolution TEM images of 35% true plastic strain with different strain rates, (a), (c), (e)  and
and  ). At low strain, i.e. the true plastic strain is about 6% (Figure 8(a,b)), both randomly distributed dislocations and aligned dislocation arrays can be observed and the density of these dislocations increases with increasing strain rate. At high strain, i.e. the true plastic strain is about 35% (Figure 8(c,d)), the density of tangled dislocations becomes higher and the distribution of the dislocations appears more uniform. Furthermore, the fine and straight twins can be observed and their amount increases with increasing strain rate, indicating that high strain rate favours twinning. The details of these twin structures can be seen in the high-resolution TEM images (Figure 8(e,f)), which correspond to the regions marked by white arrows in Figure 8(c,d).
 , (b), (d), (f)
  .
.
Characterisation of deformation and fracture surfaces
Figure 9 shows typical FESEM images of the deformation surfaces taken at the necking region of the present HNS tested at two different strain rates ( FESEM images of the deformation surface taken at the necking region and fracture surface morphologies of the present HNS tested at two different strain rates, (a), (c), (e)  and
and  ). As shown, the deformation surfaces are rather rough and irregular. At low strain rate (Figure 9(a)), many microvoids or microcracks can be found, but at high strain rate (Figure 9(b)), the size of microcracks becomes large and their number or density becomes small as compared with that at low strain rate. The magnified deformation surfaces in Figure 9(c,d) reveal the presence of plenty of deformation or shear bands (marked by red arrows). These shear bands appear in groups and are approximately parallel to one another. In addition, some shear steps can also be observed (marked by blue arrows). Such deformation mode through shear bands indicates that the localisation of plastic deformation is prevalent at the necking region [41].
 , (b), (d), (f)
  .
.
Figure 9(e,f) shows the typical fracture surface morphologies of the present HNS tested at two different strain rates ( and
and  ). It can be also seen that the fracture surfaces are basically perpendicular to the tensile axis in all these figures. Many dimples with a certain depth and different sizes can be observed, showing the typical feature of the ductile fracture. At low strain rate, the dimples are deep in depth and large in size (marked by white arrows) (Figure 9(e)). Such fracture surface means a large tensile ductility. At high strain rate, the dimples are shallow (in depth) and small in size (marked by white arrows) (Figure 9(f)).
These above morphologies of the deformation and fracture surfaces are consistent with the variations of the tensile strength and ductility shown in Figure 3(b) and give the direct explanation for the dependence of the plastic deformation and fracture behaviour on strain rate of the present HNS.
Discussion
For plastic deformation of polycrystalline metals, the statistically stored dislocations (SSDs) would generate initially in intragranular sources and the glide of SSDs is gradually in a form of planar or single slip and tends to occur uniformly in the grain interior [42,43]. The glide of SSDs would undergo short-range resistance due to the local pinning of carbon and nitrogen interstitial atoms [32,38]. As the deformation proceeds, the geometrically necessary dislocations (GNDs) would generate to relax the stress/strain concentration produced in the regions near the GBs [42,43]. The glide of GNDs transforms gradually into the multiple slip on the intersecting slip systems [42,43] and expands from the GB regions towards to the grain interiors. The region of the multiple slip becomes larger and that of planar slip becomes smaller and disappears gradually. From different strain hardening roles of the planar slip and the multiple slip, the above dislocation activities can be clearly identified by the strain hardening exponents ( and
and  ) and the transition strain (
 ) derived from the analysis of the stress–strain curve based on the Ludwigson equation. It has been suggested that
  is the measurement of the long-range stress associated with the interaction among the dislocations on the intersecting slip systems or the strain hardening role generated by the forest dislocations,
  is the measurement of the short-range stress due to the interaction of planer glide dislocations with solution interstitial atoms and
  represents the strain at which a significant transition in the dislocation glide mode from the planer glide to the cross slip takes place. Therefore, the dependence of the dislocation activities on strain rate can be explained through the variations of
  ,
,  and
and  with strain rate [32,44,45].
It is easily understood that the above dislocation mechanisms would be affected by the SFE due to the strong dependence of the planar slip and multiple slip on the SFE [33,37]. In general, for fcc metals and alloys with low SFE, the planar slip would be the dominant mode of dislocation glide because it is difficult for full dislocations to dissociate into partial dislocations [33,37]. This would lead to large  ,
,  and
and  . In contrast, for fcc metals and alloys with high SFE, the multiple slip would occur at a lower strain because it is easy for full dislocations to dissociate into partial dislocations [33,37]. This would result in small
  ,
,  and
and  . This effect of the SFE on the dislocation slip mode is confirmed by the parameters of
  ,
,  and
and  derived from the analysis of the stress–strain curve by using the Ludwigson equation for the present HNS (Table 2 or Figure 6) and other fcc metals and alloys in Ref. [37] (Table 3).
For plastic deformation of polycrystalline metals, a critical (threshold) stress is needed for dislocations to nucleate or initiate from intragranular sources. Owing to the high storage rate or high density of dislocations (SSDs and GNDs) generated at high strain rate, a high initial critical stress or a high yield strength would be expected at high strain rate. The subsequent plastic deformation would involve the multiplication and motion of dislocations and the interactions of dislocations on intersecting slip systems. The dislocation network created due to such dislocation activities would further hinder the motion of dislocations and thus lead to the strain hardening. At high strain rate, the high storage rate or high density of dislocations would enhance the multiple slip process and make the transition in the dislocation glide mode from the planer glide to the multiple slip takes place at a lower strain. At the same time, the enhanced interaction of dislocations at high strain rate promotes earlier occurrence of the dynamic recovery process of dislocation structure or the formation of dislocation substructures (twins) (Figure 8(c,d)). As a result, a high, but rapidly reduced strain hardening rate would be expected at high strain rate. In contrast, a relatively low, but slowly reduced strain hardening rate would occur at low strain rate. Such variations in the strain hardening behaviour are confirmed by the reduced  ,
,  and
and  with increasing strain rate (Table 2 or Figure 6) and can be connected with the strain rate dependence of the ultimate tensile strength of the present HNS. The slightly increased ultimate tensile strength at high strain rate arises from the smaller stress increment caused by the higher, but rapidly reduced strain hardening (smaller
  ) (Figure 3(b)) in spite of the higher yield strength. In contrast, the higher ultimate tensile strength at low strain rate is attributed to the larger stress increment caused by the low, but slowly reduced strain hardening (larger
  ) (Figure 3(b)) in spite of the lower yield strength.
Owing to the inhomogeneous nature of plastic deformation of polycrystalline metals, a high strain hardening ability is generally needed to delay the deformation or strain localisation process [46]. At low strain rate, the multiple slip and substructure would develop more uniformly and fully over a wide strain range, which suppresses the deformation or strain localisation process and delays the onset of plastic instability or necking until a higher strain. Meanwhile, the grain deformation or GB sliding may also occur at low strain rate, which could delay the nucleation and growth of local microcracks by enhancing the deformation accommodation among the grains. At low strain rate, although the strain hardening rate is lower, it still continues over a larger strain range. As a result, a high tensile ductility (uniform and total elongations) is thus expected. In contrast, at high strain rate, the higher strain hardening can suppress the deformation or strain localisation process in the low strain region, but this role would reduce rapidly as the strain increases. The nucleation and growth of local microcracks will occur at a low strain level and a low tensile ductility is thus expected. The above explanations for the strain rate dependence of the tensile ductility of the present HNS are well supported by the characterisation results of the deformation and fracture surfaces shown in Figure 9.
Conclusions
The plastic deformation and fracture behaviour of a high-nitrogen nickel-free austenitic stainless steel were examined by performing tensile testing at room temperature and at a wide strain rate range. The tensile testing demonstrated that this steel shows a significant strain rate dependence of the strength and ductility. The analysis of the stress–strain curve by using the Ludwigson equation showed that this steel exhibits a two-stage strain hardening behaviour. Based on the analysis results of the stress–strain curve, the transmission electron microscopy characterisation of the microstructure and the scanning electron microscopy observation of the deformation and fracture surfaces, the significant strain rate dependence of the strength and ductility of this steel was discussed and connected with the variation in the dislocation activities with strain rate. It reveals that the increased yield strength with increasing strain rate arises from the high storage rate or high density of dislocations; the slightly increased ultimate tensile strength with increasing strain rate arises mainly from the lower strain hardening ability (higher, but rapidly reduced strain hardening rate) after higher yielding; the decreased uniform and total elongations with increasing strain rate are attributed to the lower strain hardening ability (higher, but rapidly reduced strain hardening rate).
Footnotes
Acknowledgements
The authors greatly thank Huai Wang for his help in the laboratory work, especially for the preparation of specimens used in this study.
Disclosure statement
No potential conflict of interest was reported by the authors.