
Abstract
A framework for process-related resin selection and optimisation is proposed in the context of research and development for industrial applications of high-pressure resin transfer moulding. The first stage involves validation of the reaction kinetics model by differential scanning calorimetry and characterisation of viscosity, storage- and viscous-shear moduli by dynamic mechanical analysis in a rheometer as a function of time. It also includes capillary pressure measurements of curing resin impregnating a fibre yarn. Process-related resin selection criteria are based on the optimisation of cycle time, including filling time against gel time, micro-infiltration time and demould time. The proposed framework and associated test and analysis methodologies are applied to three epoxy resin systems in connection with carbon fibre reinforcement.
Keywords
Introduction
The application of resin transfer moulding (RTM) in an industrial scale production line requires the constituent materials to be used to their greatest effect in an optimised process [1]. Different reinforcements and resins may be used in RTM and for each type of material there are many varieties and grades available commercially [1–4]. Subsequently, resin screening necessitates lengthy programmes of experimentation or complex computer simulations [5–9]. However, it is possible to develop a methodology involving a faster and more simplified analysis in circumstances where the resin screening exercise is undertaken in conjunction with a mould design and reinforcement that are well known and have been previously optimised. The aim of this study has been to assemble a framework for process-related resin selection and optimisation for a given RTM mould and fibre reinforcement. In this framework, set requirements may be modified regarding mechanical and other properties of the RTM composite product, filling length and filling time, total cycle time, demould time and post-cure time.
The proposed methodology is demonstrated in this study for different types of epoxy systems, which constitute a class of polymers that are used in industry not only as composite matrices, but also in paints, coatings and adhesives [10–12]. Their extensive use can be attributed to their numerous desirable properties: high modulus, high strength and (depending on structure) high glass transition temperature (Tg) [13–16]. In order to enhance the quality and productivity of RTM, the interdependency of all aspects contributing to the process as a whole must be understood [1,6,17–19]. The first area to be considered must be the current processing parameters and the desired enhancement. Simply taking the size of the target component, for example, small components can be easily formed using RTM with ‘snap cure’ resin systems. Such systems often employ highly reactive epoxy resins or polyurethane systems [20–23], which require dynamic curing parameters due to their highly reactive nature, the lower temperature allowing for the infusion of the resin followed by an increase in temperature to cure. Alternatively, for large complex components which lend themselves well to RTM processing, the user will be limited to isothermal processing as it is not generally economical to vary the temperature of a large RTM mould, despite the recent development of induction heating for mould surfaces [24]. The consequence is that the resin screening framework for the RTM of large automotive components can be based on isothermal resin curing.
Issues observed during the infusion stage in an isothermal process include achieving full resin infusion prior to the resin reaching its gel point whilst ensuring processing times are maintained as short as possible [21,25–27]. In order to achieve the high rates of resin injection required, state-of-the-art equipment must be used such as injection systems primarily used for polyurethane processing. Current, commercially available high-pressure resin transfer moulding (HP-RTM) systems boast injection heads capable of 12 kg min−1 with a low-pressure radial piston pump feeding a high-pressure pump capable of rates of 36 kg min−1, and the equipment withstanding pressures exceeding 200 bar [28].
The resin flow during the stage of impregnation of the fibre reinforcement by the resin is governed by Darcy's law [29]:
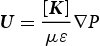
 is the pressure gradient in all directions. In resin screening, for a set geometry and fibre reinforcement, the velocity and, subsequently, the impregnation time would depend on the resin viscosity which would, in turn, be affected by the degree of curing. Ultimately, the degree of curing, governed by the reaction kinetics, would control both the gel time and the time at which the polymer composite would reach the required Tg and mechanical properties.
An additional issue, prominent in HP-RTM, is a distinct difference between the flow fronts of the macro-flow (between fibre tows or fibre bundles) and micro-flow (between fibres within a fibre tow or a fibre bundle) [6,30,31], which depends primarily on the ratio of macro- and micro-permeabilities of the fibre reinforcement. The total impregnation time then includes the completion of the micro-impregnation within the fibre tows or yarns in and near the last filled region of the fibre reinforcement, i.e. by the flow front. Micro-infiltration of the fibre tows or yarns takes place mainly transversely to the fibres [30] and is induced by the capillary pressure at the flow front and vacuum pressure, if it is applied, whereas the effect of injection pressure is less significant at the micro-flow front [30].
Hence, a framework is presented in this study for the process-related resin selection for a given mould and fibre reinforcement, based on the ability of the resin to fully fill the mould and fully impregnate the reinforcement without any premature gelling, voids or micro-voids, to minimise the overall cycle time in the mould (filling and curing) while guaranteeing demoulding a composite product with optimum structural and mechanical performance.
Materials and methods
Three epoxy-based matrix systems were investigated in the development of the resin screening method. Resin (a) supplied by Huntsman was XB6469 resin using cure agent Aradur 2954. Resin (b) again from Huntsman was Araldite LY1564 resin using curing agent Aradur 22962. Finally, resin (c) supplied by Gurit was T-Prime 130-1 resin using T-Prime 130-1 hardener.
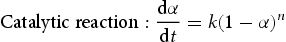
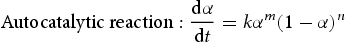
Differential scanning calorimetry (DSC) experiments were carried out to determine the type of reaction kinetics (catalytic described by Equation (2) or autocatalytic described by Equation (3)) [32] and the reaction constants for each resin system.
Dynamic mechanical analysis (DMA) tests of the resin systems were carried out using a TA instruments DHR-1 Rheometer and 25 mm parallel plate geometry in a frequency sweep at a strain of 10% and different times to provide data for the storage- and viscous-shear modulus, G′ and G′′, respectively, as a function of curing time.
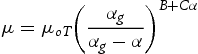
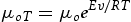
DMA tests at the low frequencies, f = 0.1 and 1 Hz, were conducted to characterise the rheology of each curing resin and determine the viscosity μ as: µ = G′′/ω where ω is the angular frequency (in rad s−1). From graphs of viscosity against time, then, the maximum filling time can be determined before μ reaches a critical value, beyond which the viscosity is not allowed to rise during filling as it would cause processing problems for a given mould and reinforcement combination, such as slow filling and incomplete impregnation before gelling. Given than the viscosity is a function of temperature and degree of curing:  , the data were used to fit and determine the constants of the following equations describing the curing system rheology [32,35,36]:

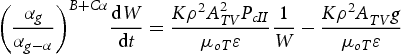
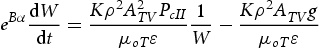
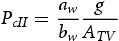
Measurements of the capillary pressure of each resin PcII parallel to the fibres were carried out by measuring the mass of each curing epoxy system rising into a carbon fibre bundle, following the methodology and using the equipment described by Amico and Lekakou [37]. However, as this is the first time in the literature that the Pc of a curing system has been determined, the change of viscosity as a function of curing following Equation (5) or (6) has been taken into account in Equation (8a) or (8b), respectively:
Results
Reaction kinetics
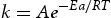
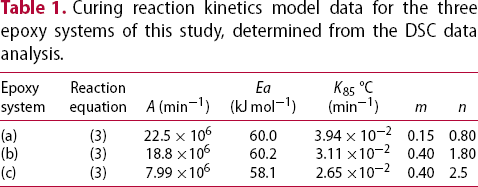
Figure 1 displays an example of data analysis to determine the reaction kinetics for resin system (a). The results of dynamic DSC (Figure 1(a)) were fitted according to the Ozawa [33] and Kissinger method [34] (Figure 1(b)) to determine the reaction activation energy as: Ea = 63.4 kJ mol−1 and Ea = 60.0 kJ mol−1, respectively, as well as the pre-exponential factor A = 22.5 × 10⁶ min−1. A catalytic reaction of equation-type (2) fitted the data of Figure 1(a) only after the peak exotherm, whereas an autocatalytic reaction of equation-type (3) fitted a larger portion of the data (Figure 1(c)) with optimised values of constants: m = 0.15 and n = 0.8. The so determined reaction kinetics parameters were inputted in equations (3) and (4) to predict the extent of reaction versus time for the isothermal DSC at 85°C and these predictions compare very well with the corresponding experimental data for system (a) as is shown in Figure 1(d). Table 1 presents the reaction kinetics model constants and parameters for all three investigated epoxy resin systems, determined as illustrated in Figure 1. All three epoxy systems appear to follow autocatalytic reaction kinetics.
Example of DSC analyses and numerical fitting of experimental data for resin (a): epoxy system XB6469/Aradur 2954: (a) experimental data of dynamic DSC at different temperature rise rates β; (b) fitting of the experimental data of dynamic DSC according to the Ozawa method [33] and the Kissinger method [34] to determine Ea and A; (c) fitting of the dynamic DSC experimental data to obtain the type and order of reaction, in this case autocatalytic type of reaction with determination of m and n constants; (d) validation of the reaction kinetics model and determined reaction parameters in (b) and (c) by comparing predictions and experimental data in isothermal DSC at 85°C. Curing reaction kinetics model data for the three epoxy systems of this study, determined from the DSC data analysis.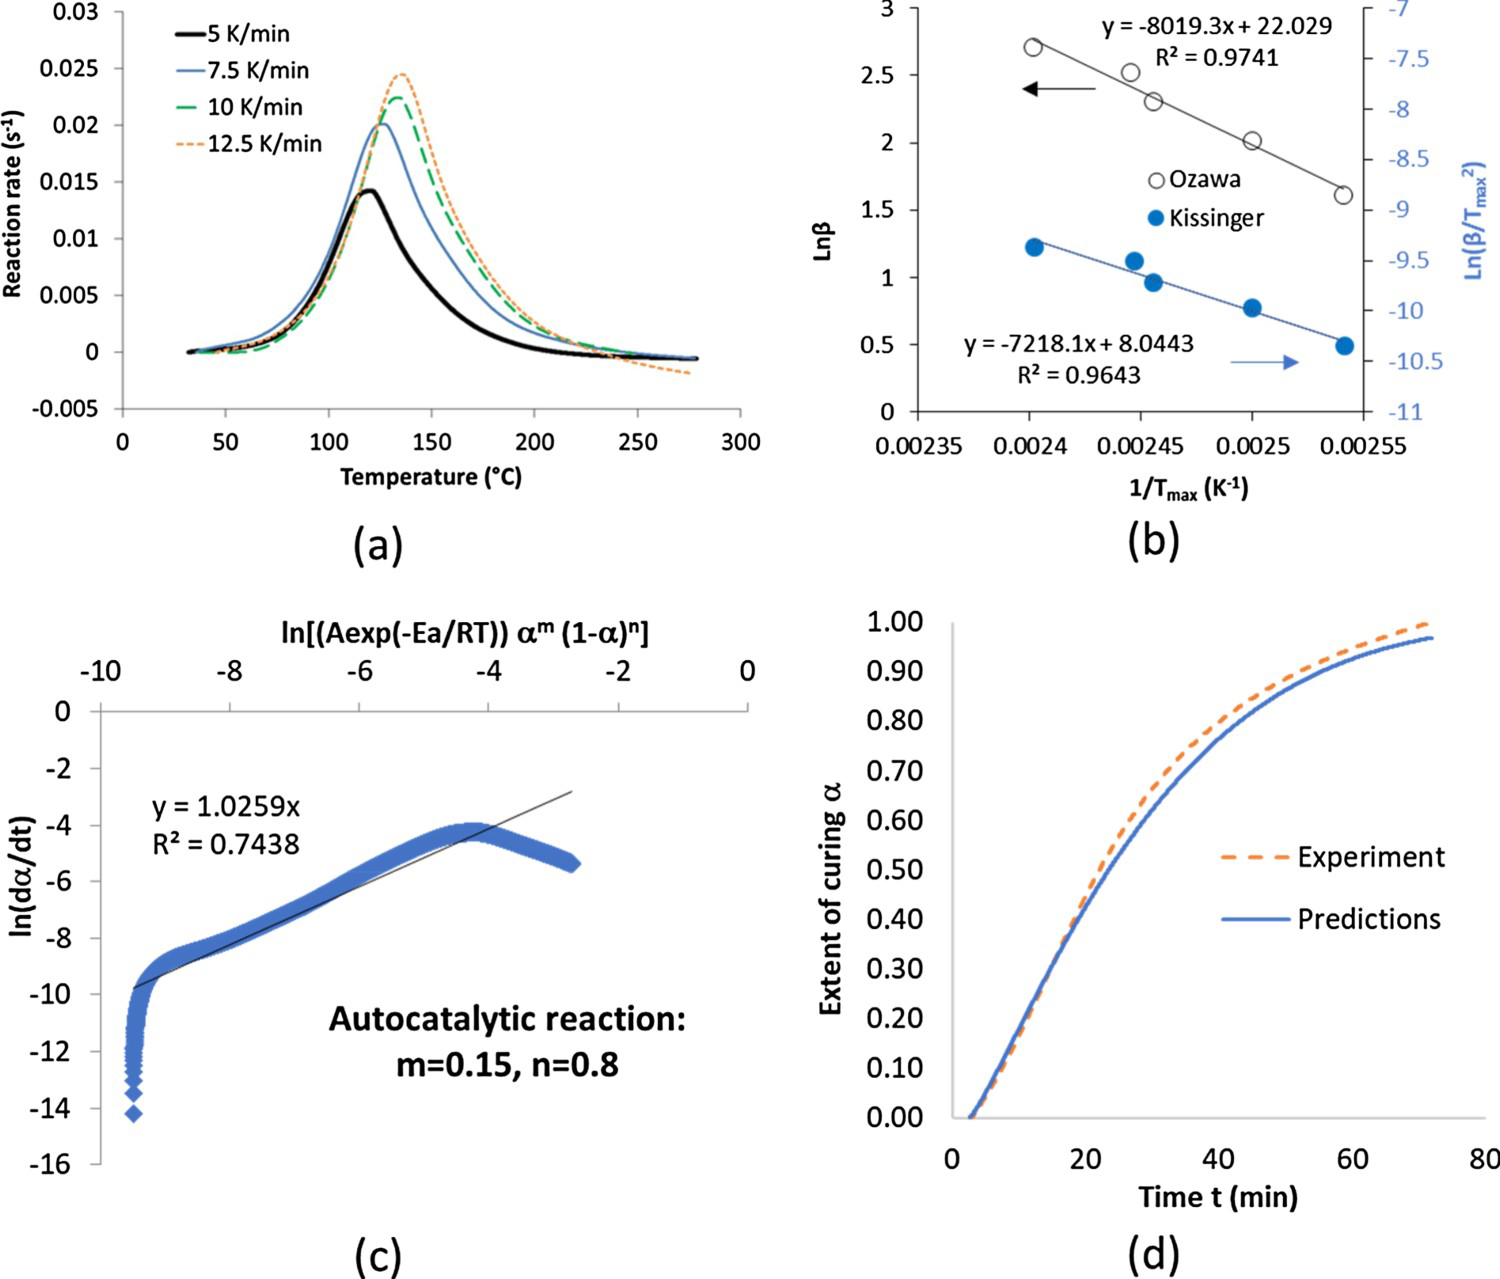
Results of the DMA tests
Figure 2 presents an example of viscosity data for resin system (a) at 85°C and at two different frequencies, 0.1 and 1 Hz: the 0.1 Hz frequency appears to capture the viscosity rise at gel point early and is in fact closer to the state of slow flow conditions present at RTM, hence, it was used for the viscosity measurements of all resin systems at 85°C which are presented in Figure 3. The rheology models of viscosity against the degree of curing, described by the alternative Equations (5) and (6), were fitted to the experimental data for each resin system with the derived model parameters displayed in Table 2. The corresponding viscosity predictions against time are shown in Figure 3 (as well as the predicted progress of curing) where it can be seen that both Equations (5) and (6) fit well the experimental data for resin system (b), Equation (6) fits better for resin system (a) and Equation (5) fits better for resin system (c).
Graphs of experimental viscosity data from DMA tests at 0.1 and 1 Hz and 85°C for resin/curing agent system (a). Graphs of viscosity (experimental data from DMA tests at 0.1 Hz and 85°C and predictions according to Equations (5) and (6)) against time and predicted degree of curing against time according to Equation (3) for the three epoxy resin/curing agent systems of this study. Chemico-rheological model parameters derived from the rheological tests (at 0.1 Hz and 85°C) and the reaction kinetics model of the three epoxy/curing agent systems of this study.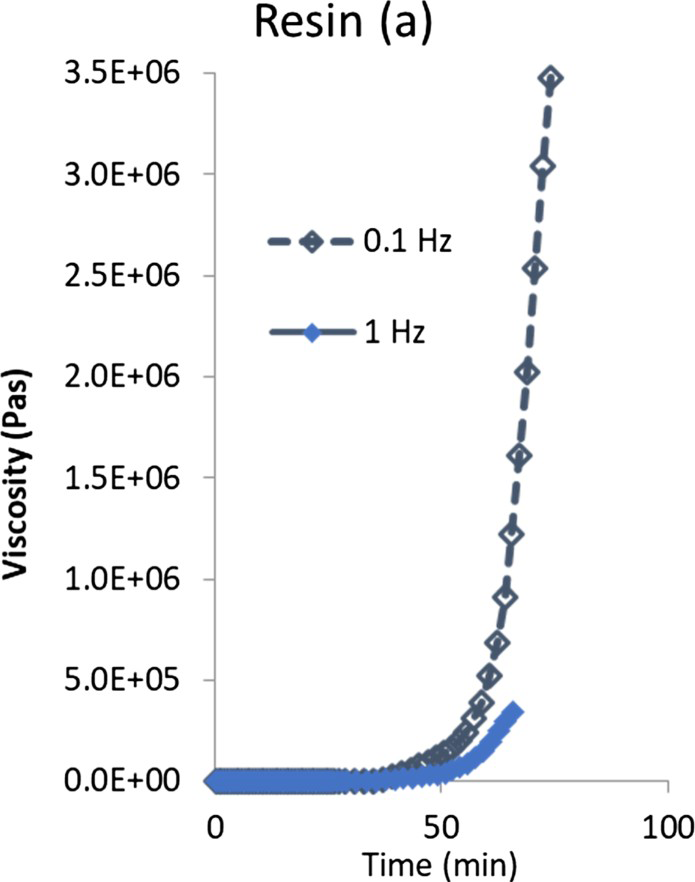
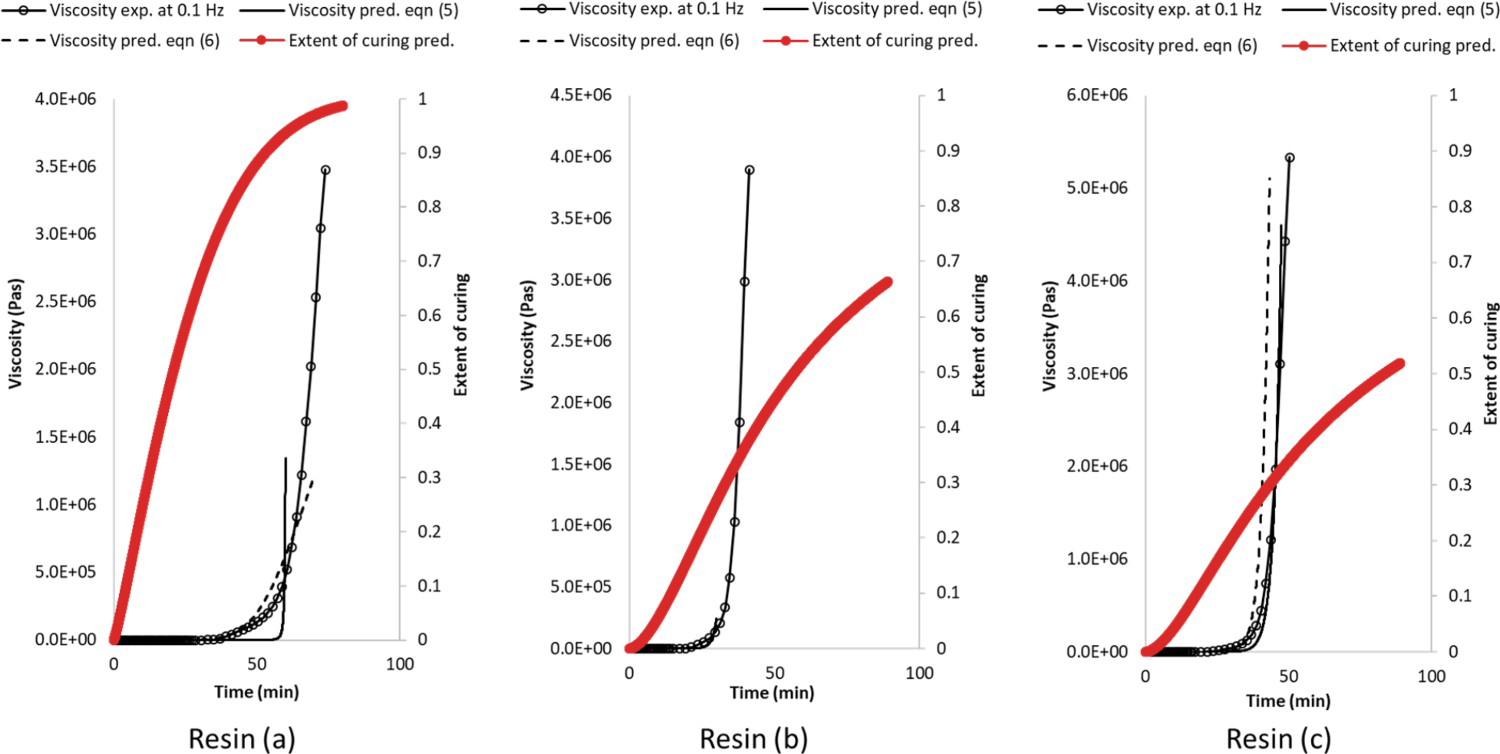
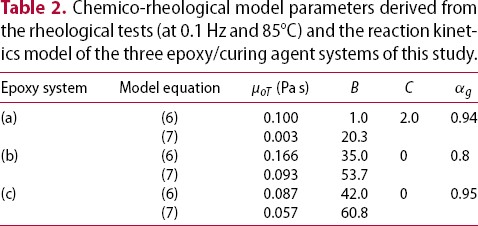
Figure 4 presents the experimental data of the shear storage modulus, G′, versus time during DMA tests at 100 Hz for the three epoxy resin systems curing isothermally at 85°C. Epoxy systems (a) and (b) exhibit a fast rise of G′ after the gel point, followed by some reduction after 4 MPa which we suspect is due to the detachment of the solid specimen from the rotating disc plates of the DMA instrument. System (c) demonstrates a steady rise of G′ with available data values above 10 MPa.
Experimental data of the storage shear modulus as a function of curing time from DMA tests at 100 Hz and 85°C for the three epoxy resin/curing agent systems of this study.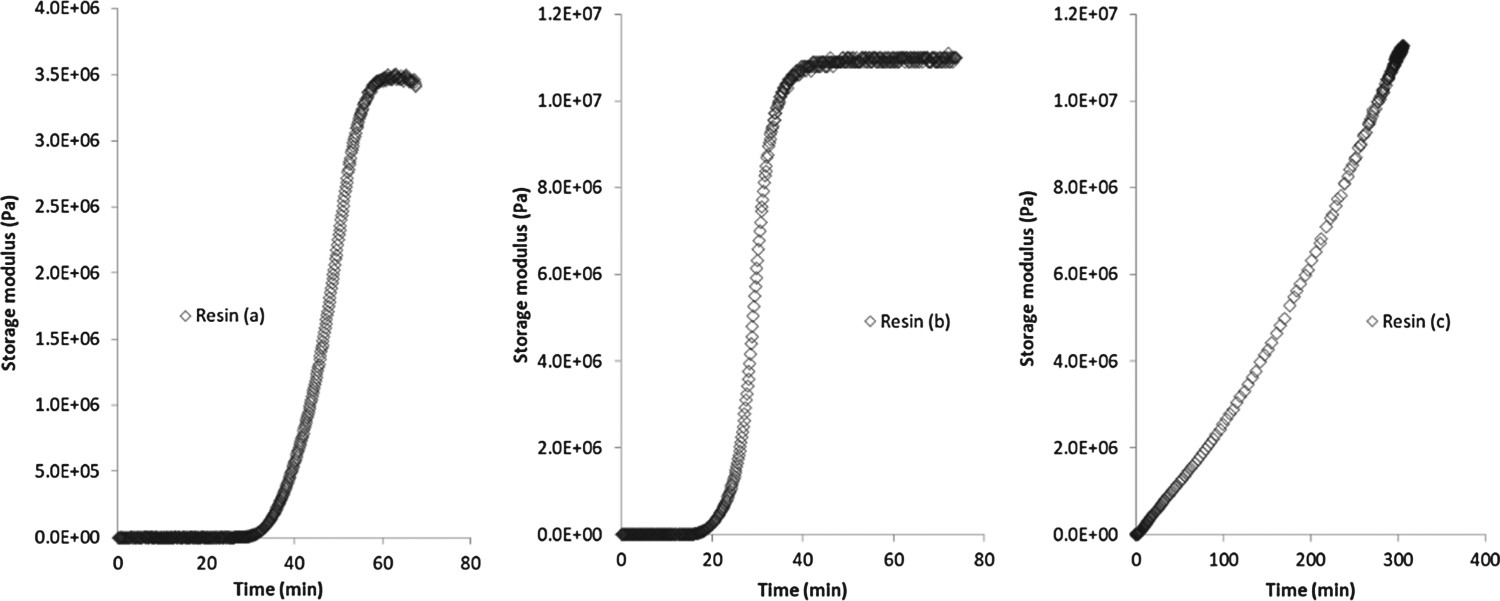
Results of the capillary pressure tests
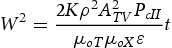
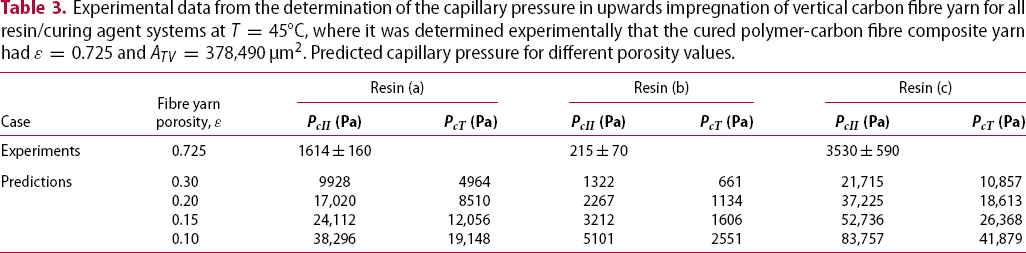
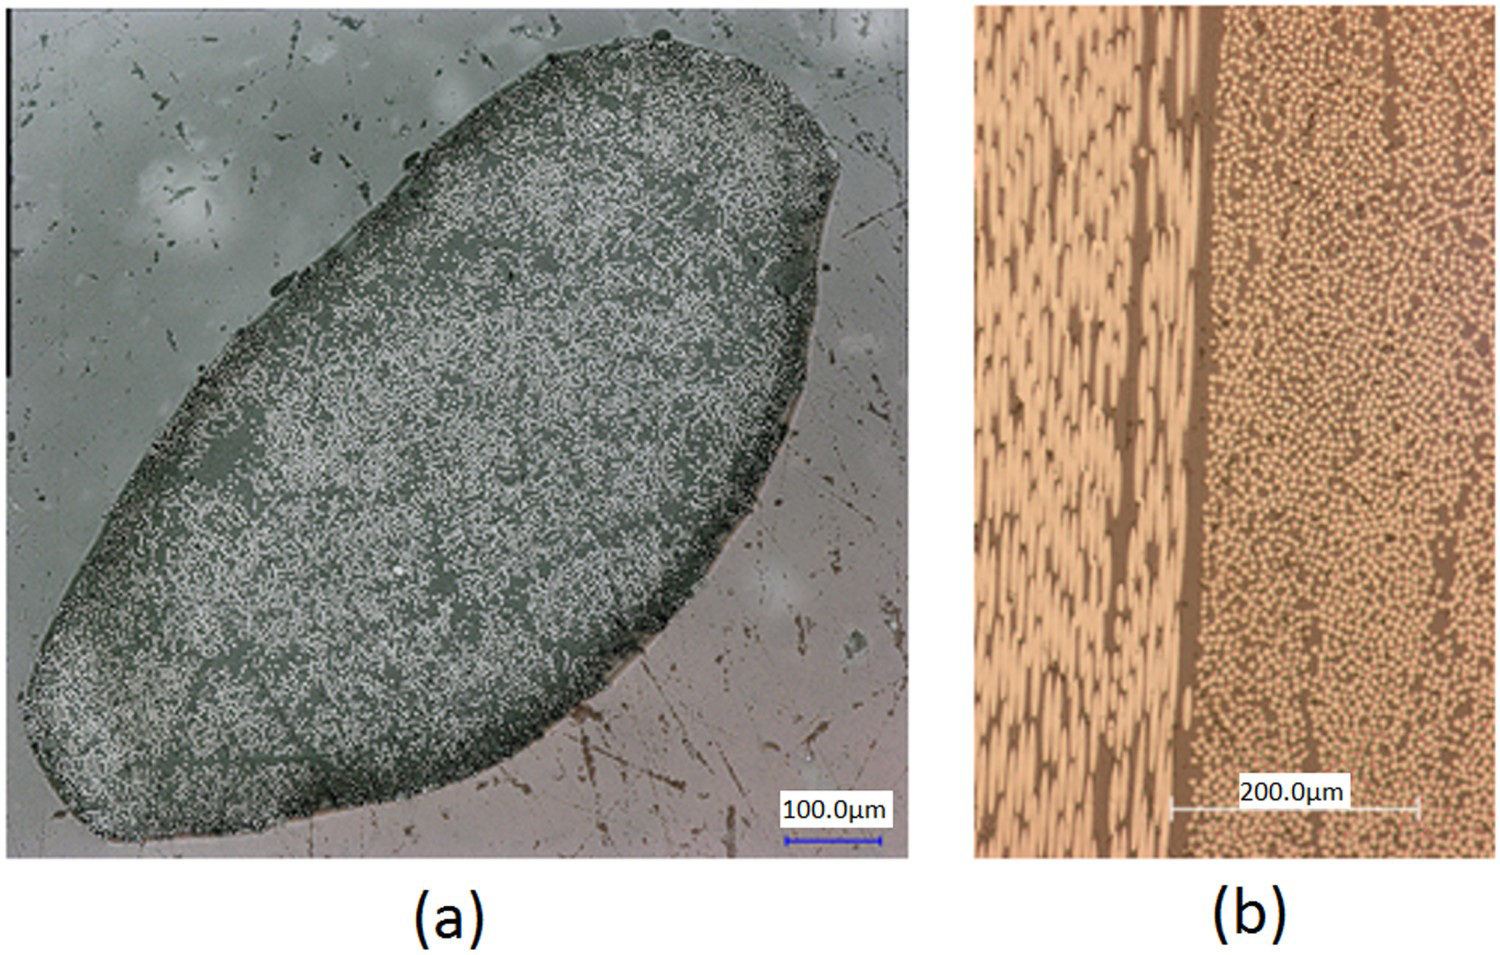
Figure 5 presents the experimental data for all resin-curing agent systems. The data at the start of the impregnation (when the effect of gravity may be neglected) were fitted linearly in plots of W2 versus time, t, following Equation (10), when the gradient represents 2αw μoX from which αw was determined. The data were then converted into the x- and y- axes of Equations (8a) and (8b) and best fit lines were drawn with gradient αw as previously determined; their intercept (if negative) represented bw. In two experiments with resin system (b), the equilibrium weight We was reached (dW/dt = 0), in which case the intercept was determined as: bw = αw/We. The best fit equations were also employed in the calculation of predicted weight against time via numerical integration of Equations (8a) and (8b): the predictions are presented against the experimental data in the bottom row of graphs in Figure 5. Differences between repeat experiments and also between the best fits and the experimental data can be detected. After some initial time it is suspected that the resin impregnation may enlarge the fibre yarn cross-section and subsequently increase the porosity that would reduce the capillary pressure and, hence, the rate of resin rise (resins (b) and (c)) or would increase the permeability and facilitate the flow of a low viscosity resin (resin (a)). Table 3 presents the determined values of the capillary pressure PcII parallel to the fibres for each resin/curing agent system, determined after inputting an average value for porosity (ϵ = 0.725) and ATV, derived from image analysis of cured impregnated carbon fibre yarn cross-sections as in Figure 6(a): it appears that resin systems (b) and (c) have the lowest and highest PcII values, respectively.
Experimental data and best fits of upwards impregnation experiments of a vertical carbon fibre yarn at T = 45°C for all resin/curing agent systems. Experimental data from the determination of the capillary pressure in upwards impregnation of vertical carbon fibre yarn for all resin/curing agent systems at T = 45°C, where it was determined experimentally that the cured polymer-carbon fibre composite yarn had ϵ = 0.725 and ATV = 378,490 µm2. Predicted capillary pressure for different porosity values. Composite cross-sections: (a) cross-section of cured impregnated free fibre bundle in capillary experiments with determined ϵ = 0.725 and ATV = 378,490 µm2, (b) part of cross-section of epoxy-stitch-bonded carbon fibre composite produced by RTM.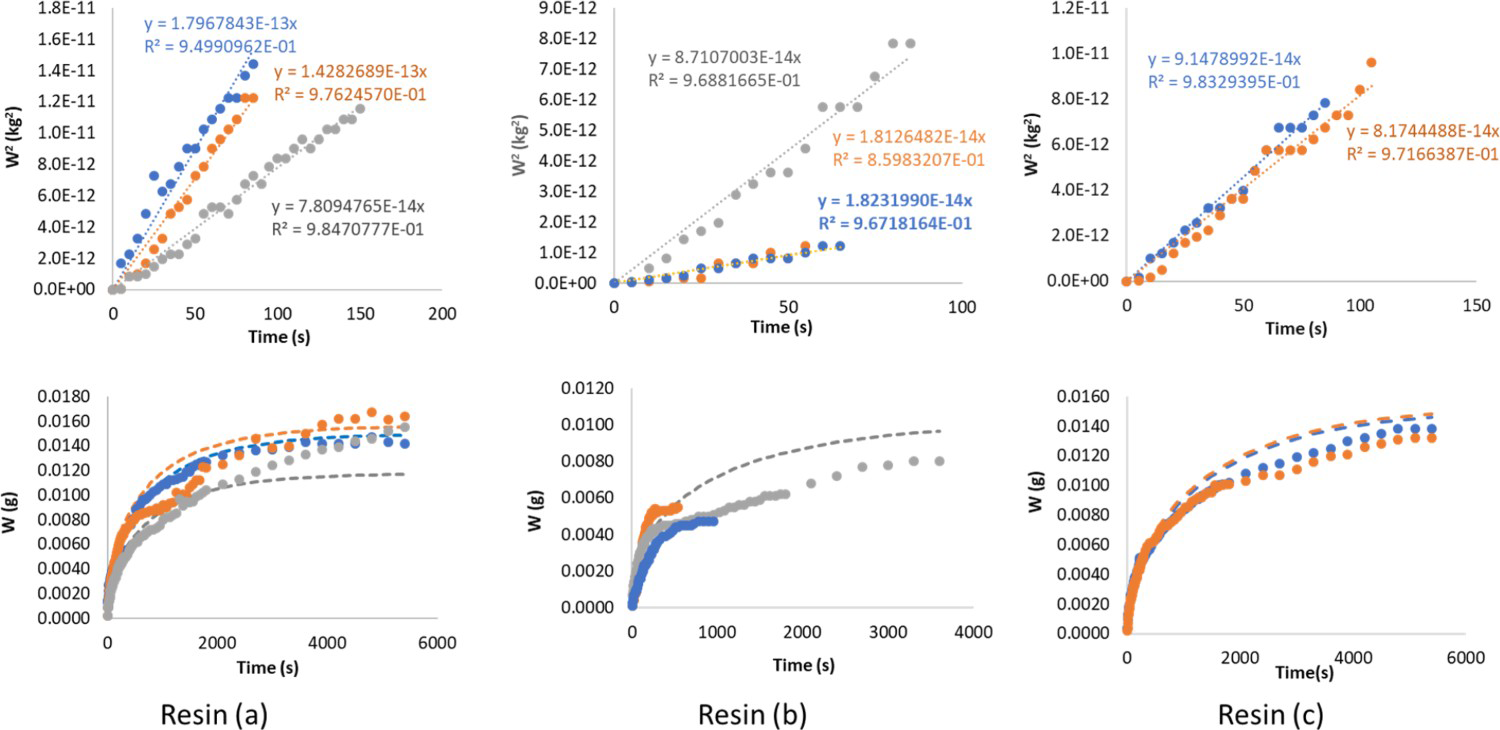
Discussion
The proposed framework for process-related resin selection in isothermal HP-RTM for a given mould and fibre reinforcement is based on a first stage of experimental studies to establish reaction kinetics, viscosity and shear storage modulus as a function of curing time and capillary pressure at known porosity value as outlined in the second section and demonstrated in the third section. The next stage includes the process of resin screening to minimise filling and demould time and ensure full macro- and micro-infiltration of the fibre reinforcement at the end of filling.
Demould time is a key part of the cycle time and cost as it represents the utilisation time of each RTM mould, which defines the production rate. Considering the rise of shear storage modulus at the process temperature in Figure 7(a), it can be determined when the composite is sufficiently cured for demoulding. If the demould time of the RTM polymer composite product had been optimised for resin (a), for example, to 65 min, this corresponds to G′ = 3.47 MPa. This value for G′ is reached at 28 min for resin (b) and at 128 min for resin (c). Resin (b) seems to compare favourably against the other two resins in terms of achieving time- and cost-effective RTM production.
Diagrams demonstrating the relation between process requirements and properties of the curing resin systems.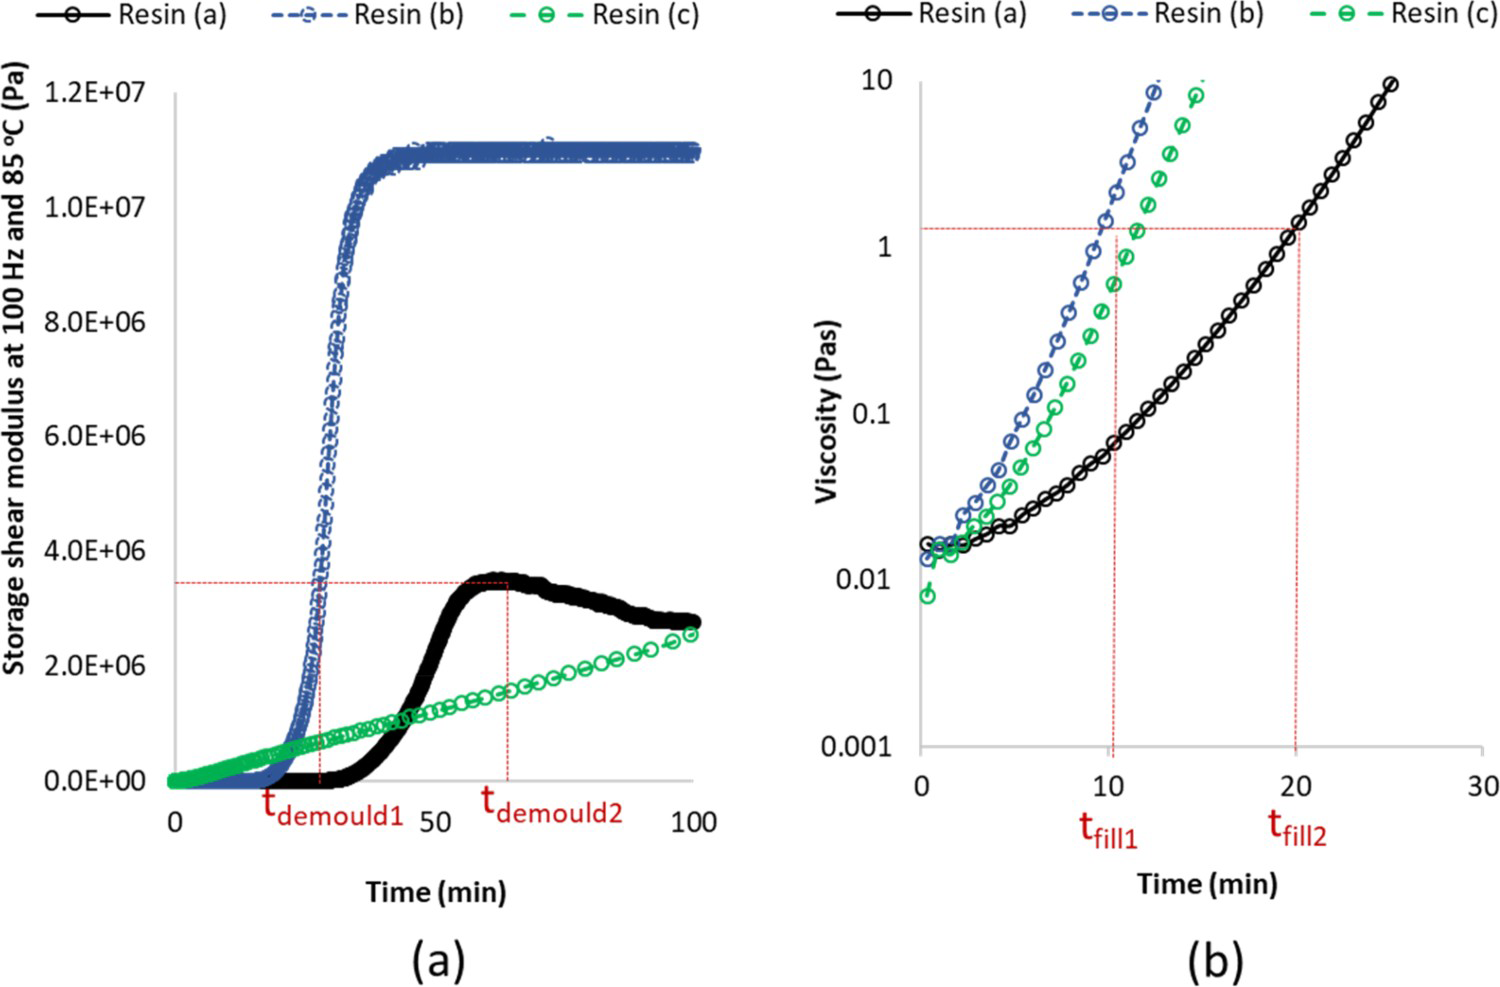
With regards to gel time against infiltration time, the three systems all display a low starting viscosity but differ in terms of the start of gel time as is shown in Figure 3. Depending on the maximum filling time requirement, one may choose all or narrow the selection to complete filling during RTM before resin gel occurs. As shown in Figure 7(b), if for example, the RTM process had been optimised initially for resin (a) to a filling time of 20 min corresponding to a viscosity of about 1 Pa s at the end of filling, resins (b) and (c) reach that viscosity after about 10 min, which means that the filling time would need to be reduced to 10 min to avoid gelling or too slow impregnation; this might be achieved by increasing the injection pressure, for example.
Micro-infiltration should also be completed before gelling, where fibre yarns near the macroscopic flow front at the end-of-fill are the last to be impregnated by resin via micro-infiltration. In the case of multiple layers of unidirectional fibres or in stitch-bonded fabrics, layers and yarns are highly compressed, at ϵ = 0.05−0.4, and micro-infiltration times may be 20% of the filling time in HP-RTM [30]. Application of vacuum aids not only micro-infiltration but also accelerates macro-infiltration, which ultimately increases the difference between the flow fronts of macro- and micro-infiltration and causes additional delays of micro-infiltration after the filling in the form of macro-infiltration is complete. Capillary pressure is beneficial as it induces only micro-flow and is negligible in the macro-channels. According to the Young-Laplace equation [37], the capillary pressure is proportional to: F(1−ϵ)/ϵ where F = 4 or 2 for flow parallel or perpendicular to the fibres, respectively. On that basis and following from the experimental data of PcII, the values of both PcII and PcT have been calculated for different possible values of micro-porosity ϵ of carbon fibre yarns and are displayed in Table 3. Micro-flow is accomplished mainly under capillary pressure transverse to the fibres PcT. As seen in Table 3, at a micro-porosity ϵ = 0.1, resins (c), (a) and (b) exert a transverse capillary pressure of 0.4, 0.2 and 0.02 bar, respectively, which means that the corresponding micro-infiltration times are related as: 1:2:20. Hence, while resin (b) may offer distinct advantages in terms of quick gelling and early demould time, care must be taken to complete micro-infiltration and ensure the absence of micro-voids.
Conclusion
A framework for process-related resin selection and optimisation in HP-RTM has been developed with potential applications in large components, made from composite materials, for the automotive industry. This framework is based on a simplified analysis and is applicable to case-studies of resin screening in association to a fibre reinforcement and mould design already known and previously optimised. The proposed methodology has been successfully demonstrated for three epoxy resin systems in this study. In this, the three epoxy resin systems were assessed for their relative suitability in an HP-RTM process with respect to processing, in the infiltration, curing and demoulding stages.
Fitting of the experimental data of dynamic DSC tests at different temperature rise rates led to the conclusion that all three epoxy systems followed an autocatalytic type of curing reaction and yielded all the parameters of the reaction kinetics model for each resin system. Subsequently, a high level of agreement was seen between theoretical calculations of the extent of reaction and the corresponding experimental data, under isothermal conditions. Isothermal DMA experiments at the RTM process temperature and a frequency of 0.1 Hz yielded shear viscosity data, which in conjunction with the reaction kinetics model, were used to successfully fit chemico-rheological models and determine the model parameters. The so determined experimentally or predicted viscosity curves as a function of time, during isothermal curing at the RTM process temperature, were employed to ensure that filling was completed before gelling occurred and reduce the filling time. Further isothermal DMA experiments at the RTM process temperature and a frequency of 100 Hz yielded shear storage modulus data as a function of the curing time, which were used for resin selection on the basis of minimising demould time while achieving a critical minimum storage modulus value. A numerical methodology was presented, for the first time, of fitting data of upwards capillary flow of a curing resin system in a fibre yarn and was successfully demonstrated for the three epoxy systems investigated in this study, by determining their capillary pressure in a carbon fibre yarn for different porosity values. The capillary pressure values contributed to the resin screening in terms of the relative micro-infiltration times. In the case where a resin has shown superior performance in terms of filling and demould time but exhibits low capillary pressure, this is a warning to ensure that micro-infiltration is complete before removing the holding pressure.
In conclusion, through the creation and validation of the framework in this study, the screening process and optimisation of resin systems for HP-RTM can be carried out consistently and with increased efficiency. The polymer resin of choice can be utilised to greater effect allowing the overall cost of optimisation and target process to be carried out more efficiently.
Footnotes
Acknowledgements
This work is part of the EngD Programme in Micro- and NanoMaterials and Technologies at the University of Surrey.
Disclosure statement
No potential conflict of interest was reported by the authors.