
Abstract
Understanding the growth mechanisms of nanomaterials usually leads to the successful preparation of targeted micro-structures with excellent properties. In this paper, flower-like and roughly spherical ZnO nanocrystals have been successfully synthesised through facile wet chemical methods, i.e. hydrothermal pathways and homogeneous precipitation method. The photocatalytic activities of the prepared photocatalysts were evaluated by degradation of rhodamine B (RhB) and phenol under ultraviolet (UV) irradiation. Remarkably, the ZnO powder via homogeneous precipitation (urea/Zn2+ = 2.0) exhibited better photocatalytic performance and photostability than those of flower-like ZnO substrate. The enhanced photocatalytic properties could be attributed to more active catalytic sites and effective separation of carriers, which were confirmed by low-temperature nitrogen adsorption, photocurrent responses, and photoluminescence spectral analysis. A possible mechanism for the excellent photocatalytic activity of ZnO substrates was proposed.
Introduction
Industrial wastewater contains a large amount of harmful organic compounds, which is challenging the quality of human life. Semiconductor photocatalysis has attracted a great deal of attentions due to their wide application to environmental remediation, especially for the removal of organic pollutants [1,2]. When illuminated with a certain light source, electron–hole pairs are generated in these semiconductor photocatalysts. The generated electron–hole pairs will transfer to the surface of the semiconductors, and then initiate a series of complex chemical reactions that result in degradation of the adsorbed contaminants [3].
Among the various semiconductors, ZnO nanomaterials have been widely studied for environmental remediation due to their unique properties, such as high catalytic activity, physical and chemical stability, low cost and environmental friendliness [4,5,6]. In general, photocatalytic reactions are believed to occur at the interface between catalyst surfaces and contaminants, therefore, it is expected that the photocatalytic activity of ZnO is dependent on the structural and morphological characteristics [7]. Precise control of the shape and size of ZnO nanocrystals allows for tailoring of their properties to satisfy application requirements. For example, Peng and co-workers synthesised rodlike and hierarchical ZnO nanomaterials via a single-step refluxing route. The results show that the hierarchical ZnO has a larger specific surface area than that of rodlike ZnO [8]. Mauro and co-workers synthesised three kinds of ZnO nanomaterials with the morphologies of film, nanofibers and nanorods by different reaction routes. They found that the best photocatalytic performance was obtained for the ZnO nanorods sample due to enhancement of the exposed surface [9]. Rashad and co-workers prepared ZnO nanoparticles through hydrolysis and condensation of zinc acetate dehydrate, and ZnO nanoparticles with an average size of 22.4 ± 0.6 nm exhibited a strong quantum confinement effect [10]. Gancheva et al. have used three different synthesis methods – homogeneous precipitation (HP), tribophysical treatment, and sonochemistry – to fabricate polycrystalline zinc oxides, which exhibit good photocatalytic activity that is strongly influenced by the preparation conditions [11]. Kislov et al. studied the photoactivity and photostability of different single-crystalline surfaces of ZnO [12]. Their results showed that photolysis of ZnO strongly depended on orientation. The photocatalytic efficiency of the different ZnO crystalline planes for degradation of methyl orange under ultraviolet (UV) irradiation was suggested to follow the order of  > (0001) >
  . The
. The  -O surface of ZnO exhibited the lowest photolytic stability. These experimental results imply that the morphology and particle size play an important role in photocatalytic efficiency and resistance to photocorrosion. Moreover, some researchers have reported hybridisation of carbon materials with ZnO to improve its photocatalytic efficiency and anti-photocorrosion [13,14]. Although the influence of synthesis conditions on the final ZnO morphology and subsequent variation in its photocatalytic properties has been reported, the structural and performance differences between ZnO products through hydrothermal synthesis and homogeneous precipitation (HP) method are often not examined. In addition, few previous works have comparatively studied the growth mechanism of ZnO produced by hydrothermal synthesis and HP method, which has important guiding significance for fabrication and applications.
In this work, we have employed two facile wet chemical methods, i.e. HP method and hydrothermal pathways, to prepare ZnO nanostructures with nearly spherical and flower-like morphologies. In terms of the HP, the ZnO nanoparticles (NPs) with different sizes and shapes could be obtained by simply altering the urea/zinc nitrate molar ratio. The UV light photocatalytic efficiency and photostability of the as-prepared ZnO-NPs were evaluated using phenol and rhodamine B (RhB) as probe compounds. Additionally, our as-prepared ZnO-NPs displayed better photocatalytic performance and photo-stability in the UV light region than the flower-like ZnO via hydrothermal (HT) pathways in the same conditions. Bearing in mind all the possible mechanisms that govern crystal growth, we try to establish a better understanding of how to grow ZnO in various forms. In addition, we were able to clearly understand the dependence of photocatalytic activity and photostability on the structural and morphological characteristics of the ZnO nanomaterials.
Experimental section
Materials
All chemicals were of analytic grade and used as received without further purification, unless otherwise stated. Zinc nitrate hexahydrate (Zn(NO3)2·6H2O, AR), phenol (C6H5OH, AR), sodium sulphate (Na2SO4, AR), isopropanol (IPA, AR), benzoquinone (BQ), and rhodamine B (RhB) were purchased from Sinopharm Chemical Reagent Co., Ltd (Shanghai, China). Urea, sodium hydroxide (NaOH, AR), sodium oxalate (Na2C2O4, AR) and Trisodium citrate dehydrate (C6H5Na3O7·2H2O) were obtained from Xilong Chemical Co., Ltd (Shantou, China). All aqueous solutions were prepared with deionised water.
Samples preparation
The ZnO NPs were synthesised via a HP-assisted heat treatment method. In a typical synthesis, to 0.2 M Zn(NO3)2 solution, the surfactant 1mmol C6H5Na3O7·2H2O was added into zinc nitrate solution under constant stirring. Then, different concentrations of urea (urea/zinc nitrate molar ratio = 1.5, 2, and 3) were added slowly with constant stirring until a homogeneous solution was achieved. This solution was then heated to 95°C with continuous stirring for 2 h. During the reaction, a milky white precipitate was obtained, which was found to be hygroscopic. The hygroscopic products were preserved in a desiccator, and then annealed in air at 450°C at a heating rate 10°C min–1 for 2 h inside a muffle furnace. The white precipitate became greyish white ZnO-NPs powder after calcinations. For comparison, we also synthesised nanaostructured ZnO powder via hydrothermal pathways. To 1.75 mmol Zn(NO3)2 solution, 2 M NaOH was added to yield a solution pH = of 12 (without any surfactant or chelating agent), then, the solution was transferred into a Teflon-lined stainless-steel autoclave with effective volume of 100 mL. The autoclaves were filled with 70 mL of the above solution, sealed and then kept in an oven at 120°C for 3 h. After cooling to room temperature, the precipitate was washed repeatedly with deionised water and then dried at 60°C for 12 h.
Characterisation
The structure and morphology of the products were examined with field-emission scanning electron microscopy (FESEM, S-4800, Hitachi, Japan) equipped with an energy dispersive spectrometer (EDS, INCA Energy, Oxford, UK). The microstructures of the products were characterised in detail by transmission electron microscopy (TEM, JEM-2010F, JEOL, Japan) with an acceleration voltage of 200 kV. The crystal phase was studied with powder X-ray diffraction analysis (XRD, D/Max-2550 V, Rigaku, Japan; CuK, λ = 0.15406 nm) in the wide-angle region from 10° to 80° with a scanning speed of 2° min–1.
The sample's specific surface area was measured by low-temperature (77.4 K) nitrogen adsorption on the basis of the Brunauer–Emmett–Teller (BET) equation with a surface area analyser (Autosorb- iQ2, Quantachrome, USA). The Fourier transform infrared (FT-IR) spectra of the samples were measured by the KBr pellet method on a Spectrum Two FT-IR spectrophotometer in the wave-number range of 4000–400 cm−1. Room temperature photoluminescence (PL) spectroscopy measurement at 325 nm excitations was performed using Zolix, OmniPL-LF325 with a He–Cd laser. UV–visible (UV–VIS) absorbance spectra were obtained for the dry-pressed disc samples with a UV–VIS spectrophotometer (UV-2550, Shimadzu, Japan). BaSO4 was used as a reflectance standard in a UV–VIS diffuse reflectance experiment.
Evaluation of photocatalytic performance
The photocatalytic performance of the as-prepared products was evaluated by decomposition of RhB and phenol under UV irradiation at room temperature. A 300-W UV lamp with maximum emission at 365nm was used as UV light source. The distance between the liquid surface of the suspension and the light source was set to ∼11 cm. The photodegradation experiments were performed with the sample powder (30 mg) suspended in solutions of the pollutants (60 mL; RhB 15, and phenol 20 mg L–1) with constant stirring. Before irradiation, the suspensions were stirred in dark for 30 min to ensure adsorption/desorption equilibrium. At certain time intervals, 3 mL solution was drawn out and centrifuged at 5000 rev min(1 for 5 min to obtain a clear liquid. The quantitative determination of RhB and phenol were performed by measuring the intensity of the respective absorption peaks (RhB at 553 nm; phenol at 270 nm) with a UV–VIS spectrophotometer (Lambda35, Perkin Elmer, USA).
Photoelectrochemical measurement
Photocurrent measurement was performed in a three-electrode quartz cells with 0.5 M Na2SO4 electrolyte solution. Platinum wire was used as a counter electrode, and saturated calomel electrodes (SCEs) were used as reference electrodes. ZnO films electrodes (1 cm × 1 cm) on ITO glass served as the working electrode. The photoelectrochemical experiment results were recorded with an electrochemical system (CHI-660E Instruments). The photocurrent responses of photocatalysts under UV irradiation by two germicidal lamps (λ = 254 nm, 16 W) at room temperature were measured. The distance between the surface of working electrode and the light source was set to ∼10 cm. The I–t curves were measured at 0.0 V with the lights switched on/off every 30 s.
Results and discussion
Structure and morphology
An X-ray diffraction pattern of the as-prepared products is shown in Figure 1. All of the peaks matched well with the bulk ZnO, which could be indexed as the hexagonal wurtzite structure of ZnO (P63mc, a = 3.249 Å, c = 5.206 Å, JCPDF No 36-1451). No extra peak is detected by XRD, indicating the superior purity of the ZnO samples.
XRD of ZnO samples: (a) hydrothermal synthesis, (b) Zn2+:urea = 1:1.5, (c) Zn2+:urea = 1:2.0, (d) Zn2+:urea = 1:3.0.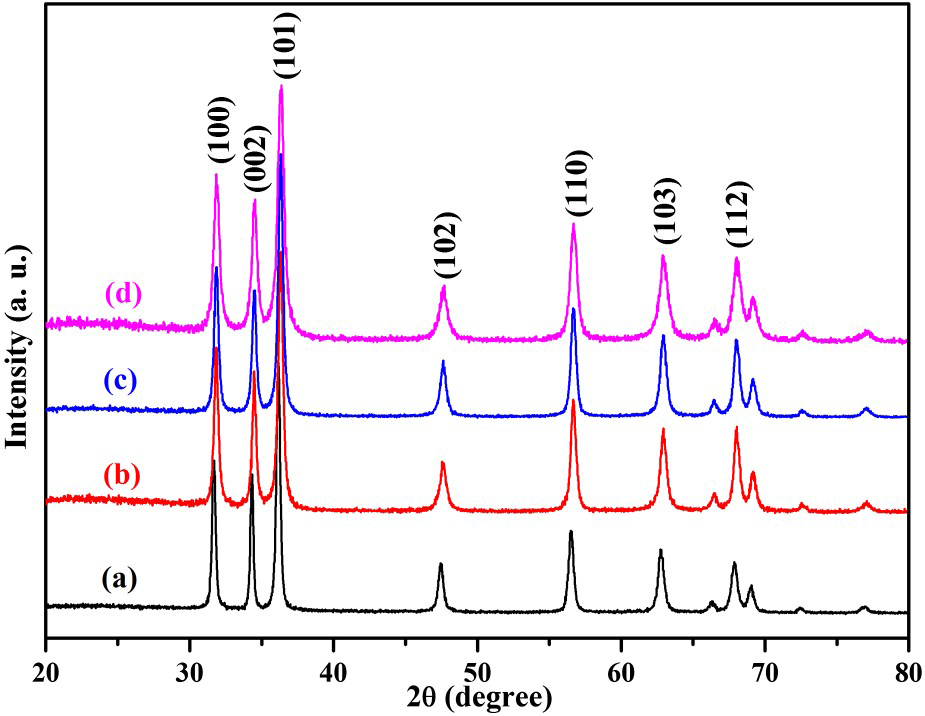
The formation of the ZnO wurtzite structure was further confirmed by FT-IR spectral analysis (shown in Figure 2(A)). The FT-IR spectrum of ZnO samples has shown a very broad band at ∼3450 cm−1. This band corresponds to the O–H stretching arising from –OH groups bound to the ZnO or surface-adsorbed water molecules and the peak at 1630 cm−1 could be assigned to O–H bending [15]. The strong peak at 1383 cm−1 is attributed to the surface-adsorbed CO2 molecules on homogeneous precipitation (HP) ZnO NPs [15]. The disappearance of the peak at 1383 cm−1 in the HT ZnO powders may be due to the low specific surface area (i.e. few CO2 molecules on ZnO). For ZnO samples, a strong Zn–O–Zn band at ∼450 cm−1 is visible, which is the characteristic peak of nanocrystalline ZnO [16]. However, HP ZnO NPs projected their identity on account of the most intense Zn–O–Zn and O–H stretching bands. These features would have positively contributed to higher photoactivity.
(A) FT-IR spectra and (B) N2 adsorption–desorption isotherms of ZnO samples and their corresponding pore size distribution(inset): (a) hydrothermal synthesis, (b) Zn2+:urea = 1:1.5, (c) Zn2+:urea = 1:2.0, (d) Zn2+:urea = 1:3.0.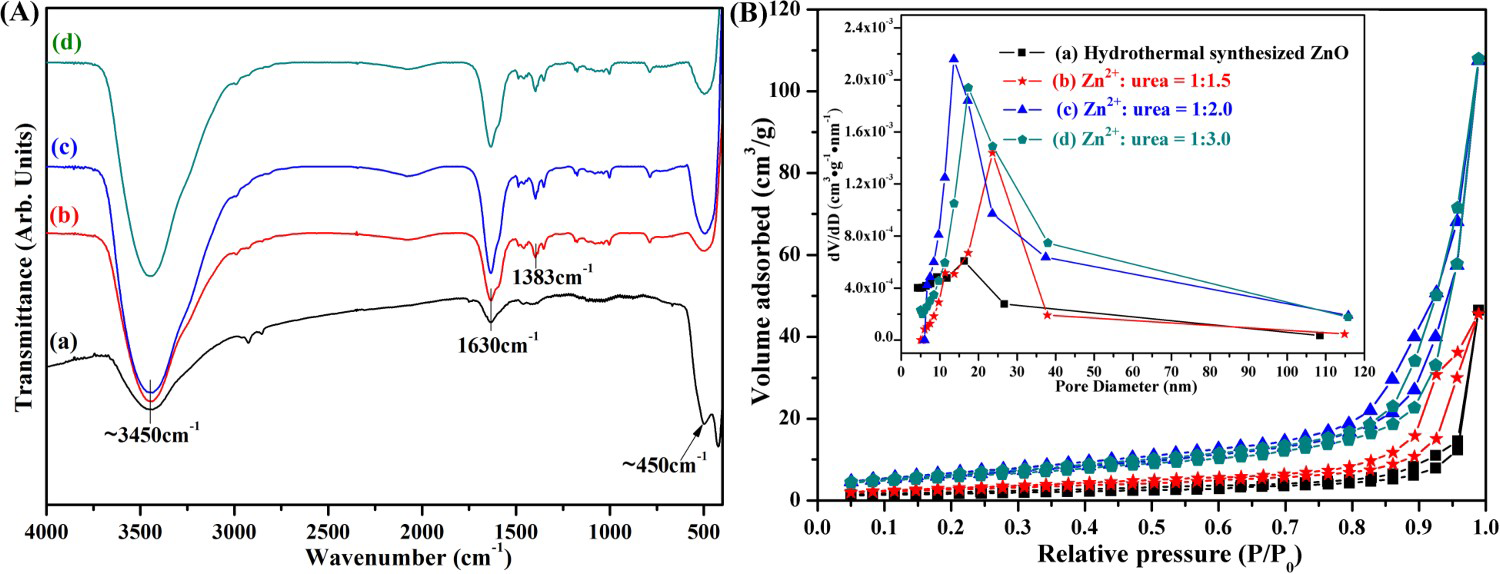
As shown in Figure 2(B), the pore structure of ZnO products were investigated by nitrogen adsorption–desorption isotherms, and the pore size distribution were calculated by BJH method. The N2 adsorption–desorption isotherms of synthesised HT and HP ZnO particles at the ration of Zn2+:urea = 1:3.0 exhibited a hysteresis loop, similar to a type II pattern representing the predominant nonporous structure according to the IUPAC classification [17]. The sharp increase in the adsorption volume of N2 was observed and located in the P/P0 range of 0.65–0.99. This sharp increase can be attributed to multilayer adsorption or the capillary condensation, indicating that macropores formed due to contact among the micro-particles or the aggregation of HP ZnO NPs. Furthermore, the HP ZnO particles at the ration of Zn2+:urea = 1:1.5, 1:2.0 display classical type-IV isotherms with type H3 hysteresis loops, which indicates finite multilayer adsorption in these NPs. The specific surface area for HP ZnO particles at the ration of Zn2+:urea = 1:1.5, 1:2.0 and 1:3.0 are, 9.76, 22.14 and 20.91 m2 g–1, respectively. The much larger specific surface area of HP ZnO products when the ration of Zn2+:urea is 1:2.0, which may be due to the smaller grain size and more interfacial boundaries. While the area of the hysteresis loop of HT ZnO is lower than the other three HP ZnO samples, which indicated a decreased BET specific surface area. A single-modal pore size distribution was formed in HP ZnO NPs, whereas a bimodal distribution and weak pore peak was exhibited for HT ZnO powders. Such change can be interpreted as a consequence of nucleus growth caused by thermally induced crystallization, which is in good agreement with the detailed XRD and SEM results.
Figure 3(a) presents typical SEM images of the obtained product via a facile hydrothermal method without using any capping agent. It is evident that HT ZnO crystals exist as flower architectures self-assembled by nanorods with diameters of ∼310 nm and lengths of ∼900 nm. The mean size of the flowers is approximately 1.8–2.4 μm. While the morphologies of the obtained ZnO NPs via a HP-assisted heat treatment method were all roughly spherical in shape (see Figure 3(b–d)). The crystallite sizes of ZnO samples were highly dependent on the urea: Zn2+ ratio. For example, at a urea/Zn2+ molar of 1.5 (HP ZnO-1), the size of individual particles calculated from this micrograph was 27.6 ± 3.7 nm, but the individual particles appear to be broadly agglomerated with uneven particle size (see in Figure 3(b) shown in red-circled region) result in low B–E–T-specific surface area. Figure 3(c) reveals grains with a mean diameter of 30.8 ± 4.3 nm for the synthesised ZnO NPs at urea/Zn2+ molar of 2.0 (HP ZnO-2), and confirmed the homogeneous particle size distribution of this sample. Therefore, the higher specific surface area of the sample at urea/Zn2+ molar of 2.0 than that at 1.5 is due to its nanosized homogeneous granulometry, although it possesses a larger mean diameter. The statistical analysis of the individual particles for synthesised ZnO samples at urea/Zn2+ molar of 3.0 (HP ZnO-3) revealed an average size of 25.8 nm in diameter, as shown in Figure 3(d).
Typical FESEM images and particle size distribution of ZnO samples: (a) hydrothermal synthesis, (b) Zn2+:urea = 1:1.5, (c) Zn2+:urea = 1:2.0, (d) Zn2+:urea = 1:3.0.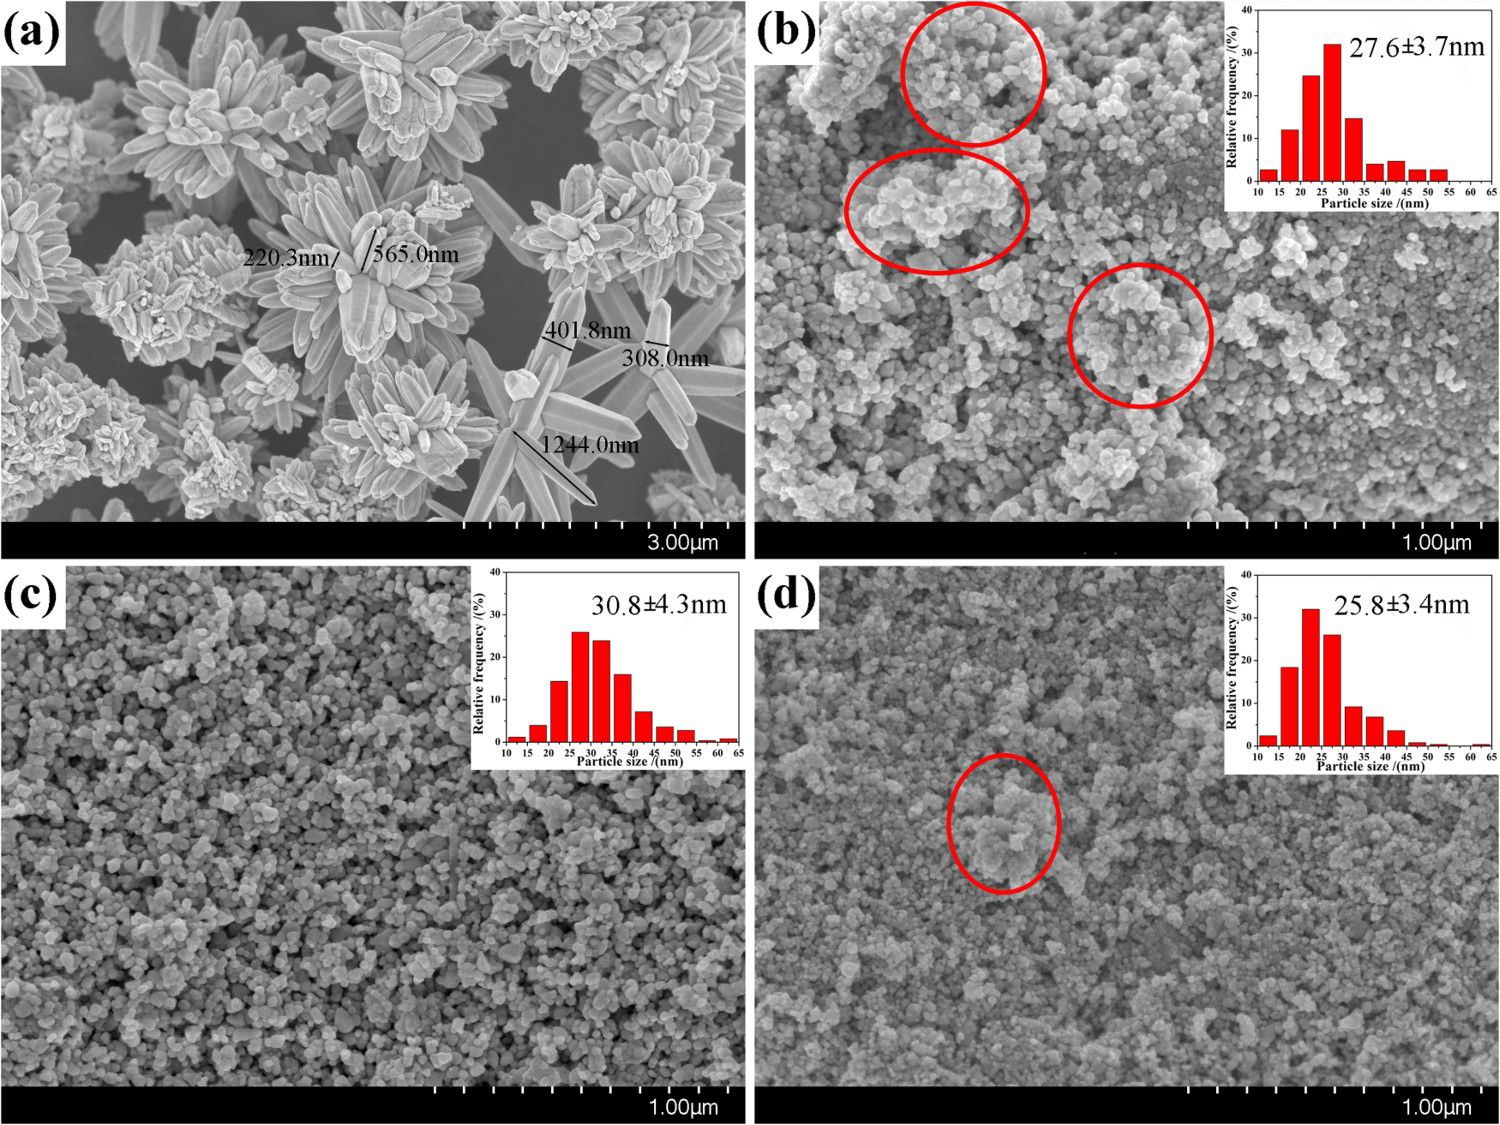
In summary, all HP ZnO samples exhibited smaller crystallite size, which are calculated from SEM images, in contrast to ZnO NPs obtained by hydrothermal synthesis. The smaller particle size and narrow distribution obtained in HP ZnO NPs is possible because of surfactant sodium citrate attaches to the surface of ZnO particles, leading to the decrease of induction time (the time elapsed between attained super-saturation and the presence of nucleus) [18,19]. Therefore, the critical nucleus size and the number of molecules are smaller. Moreover, the ZnO powders prepared by the HP method are formed in a controlled way: the urea in the solution can slowly release OH− on heating, and the gradual rise in pH results in the nucleation and growth of uniformly nanosized particles [20].
Formation process and growth mechanism
As shown in Figure 4(a,b), HT ZnO displays flower-like architectures self-assembled by submicrorods. The TEM images of HT ZnO appear dark grey due to its large diameter. Figure 4(c,d) show the SEM and TEM images of the HP ZnO-2 product, which has a grain size of 25–30 nm in a narrow distribution, which agrees well with the detailed SEM results (as shown in Figure 3(c)).
SEM (a and c) and TEM (b and d) images of ZnO products: (a and b) hydrothermal synthesis; (c and d) homogeneous precipitation (Zn2+:urea = 1:2.0).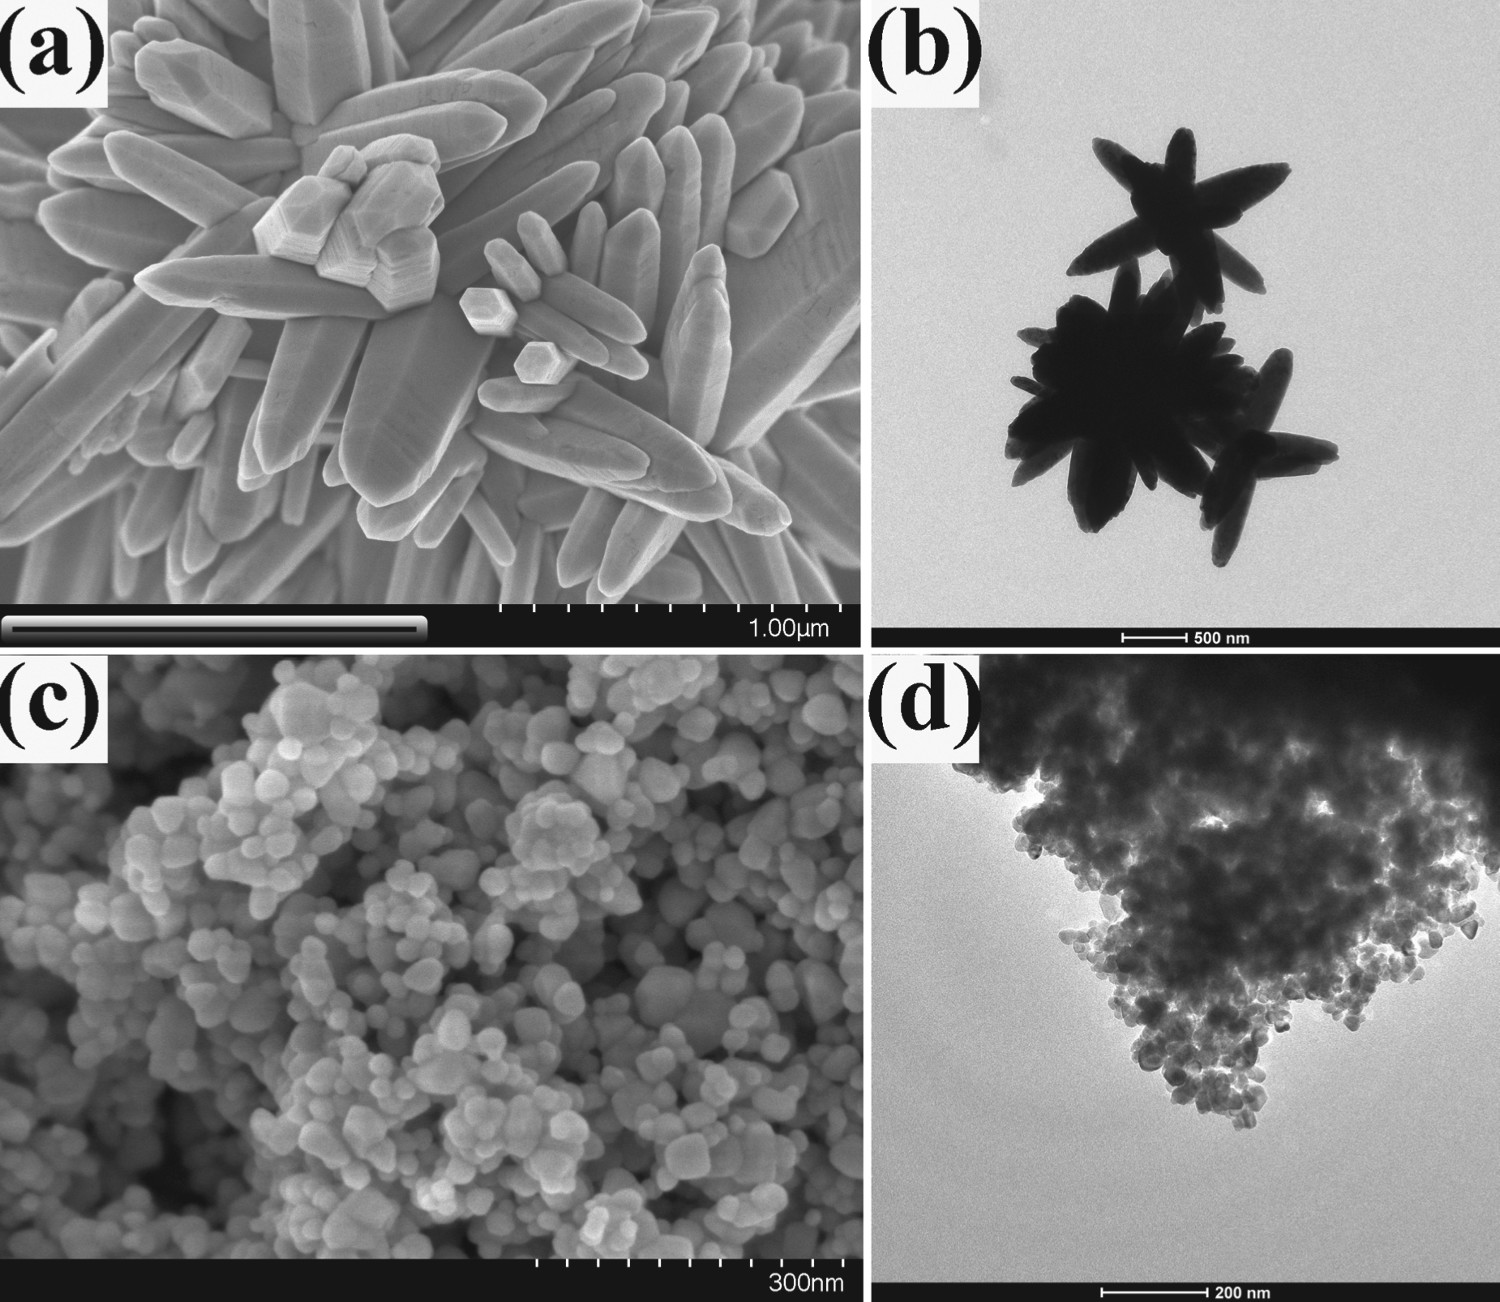


Morphology of ZnO powders prepared from the different alkali environment created by urea and NaOH.
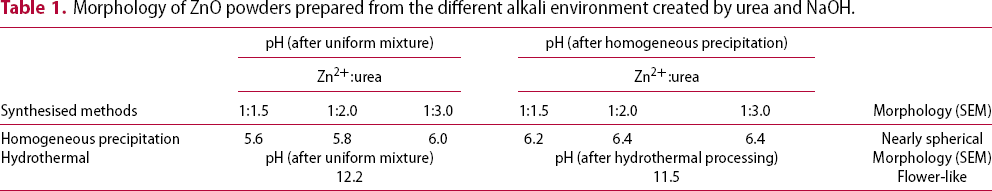
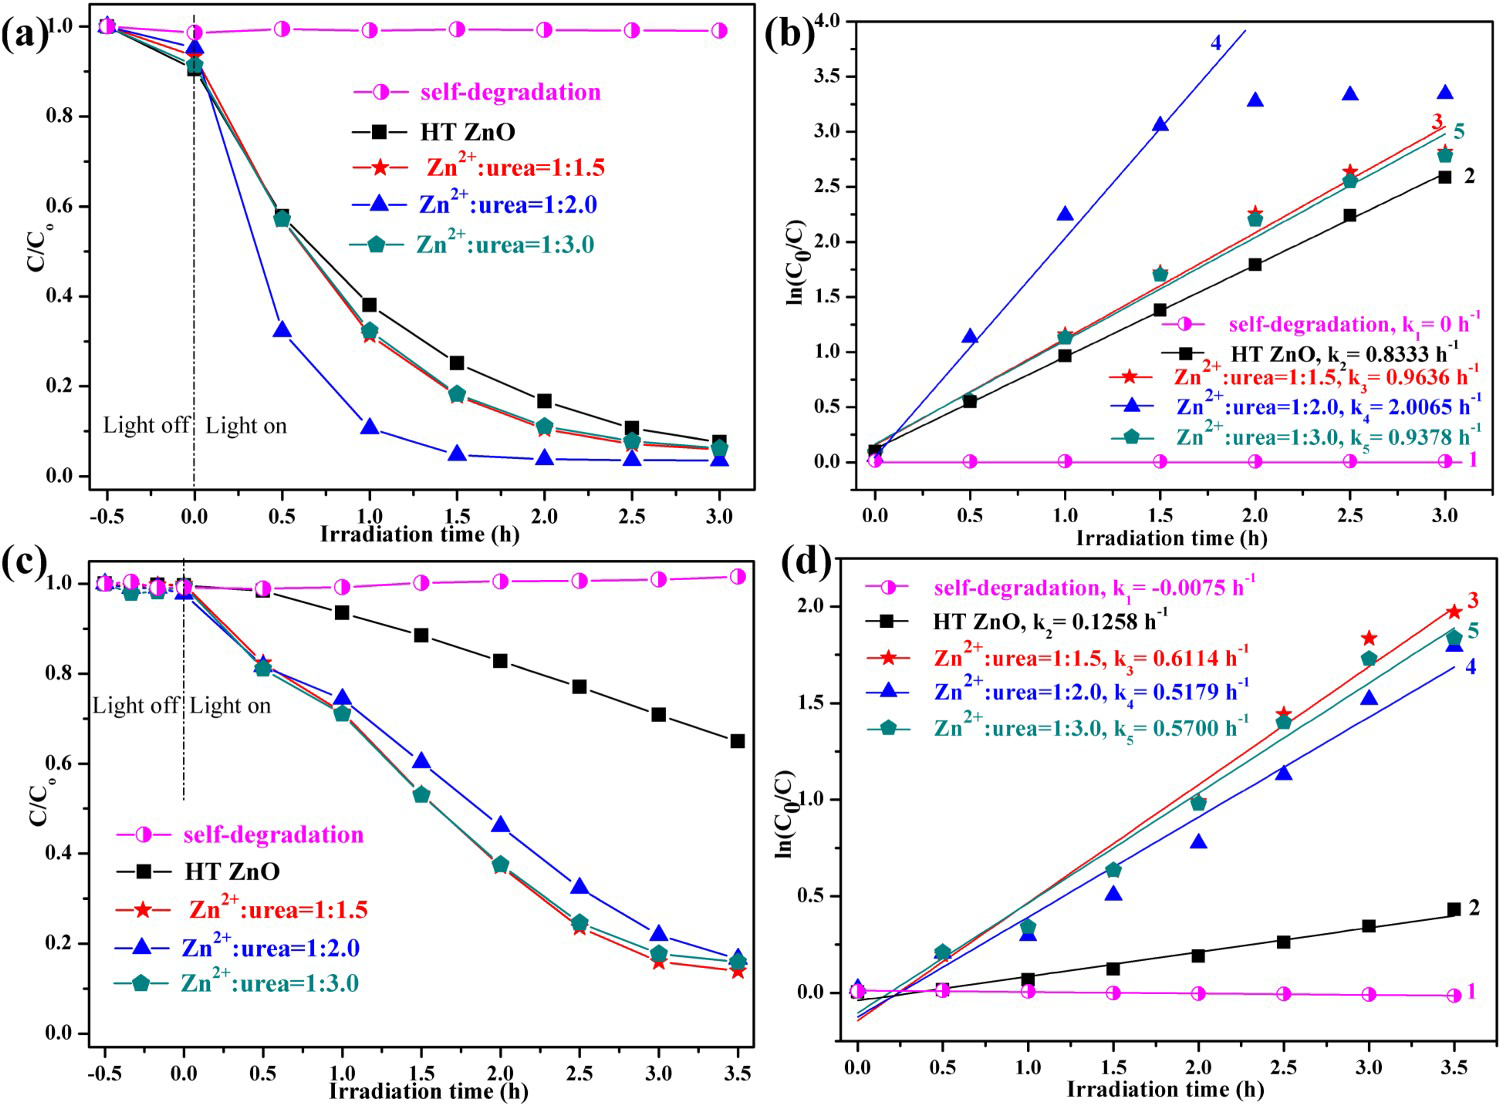
We think the process of the formation of the flower-like nanostructures can be involved in two stages: formation of ZnO nuclei and orientated growth. In the first stage Zn2+ from Zn(NO3)2·6H2O would react with OH− to produce zinc hydroxide (Zn(OH)2) precipitates. Under this special hydrothermal condition, the precipitates would transform into ZnO nuclei (Equation (1)). Prolonging the reaction time, more ZnO nuclei are produced, and they would aggregate to deduce the surface energy, resulting in the formation of ZnO seeds. At the same time, Zn2+ from Zn(NO3)2·6H2O would react with OH− to generate the growth unit of [Zn(OH)4]2−, as described by Equation (2). Afterward, [Zn(OH)4]2− ions would diffuse and adsorb on the surface on the ZnO seeds. Finally, [Zn(OH)4]2− ions become minute ZnO particles in situ through decomposition, as described by Equation (3). To the best of our knowledge, the fastest growth direction of the wurtzite ZnO is along the direction of the c-axis [0001], where it is Zn-terminated and consequently positively charged. At higher pH there is a larger number of [Zn(OH)4]2− ions, which have a tendency to diffuse and adsorb along the positive plane (0001)-Zn, resulting in a rod-based flower-like ZnO microstructure (Figure 4(a)).
In our experiments, the growth process of HP ZnO crystallites at a low pH of 5.6–6.4 (as shown in Table 1) can be described by the following equations.


At the first stage, the urea molecule began to hydrolyse to produce ammonia, and formed  anions and OH− anions according to Equations (4)–(6). The
  ions would further react with the Zn2+ ions, which were released by Zn(NO3)2·6H2O, and form zinc carbonate hydroxide according to Equation (7). During the reaction process, sodium citrate acted as a capping agent adsorbed on the surface of ZnO precursor to minimise their surface area and decrease their energy. In addition, the supersaturation of configuration ion in solution was uniform result in a small ZnO precursor particle size. Finally, the nearly spherical structure was obtained by calcining the precursor, as described by Equation (8).
UV–VIS diffuse reflectance spectra (DRS)
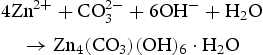
UV–VIS DRS was used to determine the optical properties of the samples. It can be seen from Figure 5 that nature of absorption band with a sharp cut-off at ∼388 nm of samples, which assigned to the phase pure ZnO formation. A plot obtained via the transformation based on the Kubelka–Munk function versus the energy of light is shown in the inset of Figure 6. The estimated band gap values of the samples are approximately 3.21, 3.19, 3.21 and 3.20 eV, corresponding to HT ZnO, HP ZnO-1, HP ZnO-2 and HP ZnO-3, respectively. Furthermore, these results agree with the existing reports [23, 24]. The UV–VIS DRS results indicated that all ZnO samples exhibited similar light adsorption range.
UV–VIS DRS for (a) hydrothermally synthesised ZnO and HP-prepared ZnO (b) Zn2+:urea = 1:1.5, (c) Zn2+:urea = 1:2.0, (d) Zn2+:urea = 1:3.0. The inset displays Kubelka–Munk plots of ZnO samples for band-gap estimation. (a) Photocatalytic activities and (b) first-order kinetic plots for the photodegradation of RhB over synthesised ZnO. (c) Photocatalytic activities and (d) first-order kinetic plots for the photodegradation of phenol over synthesised ZnO.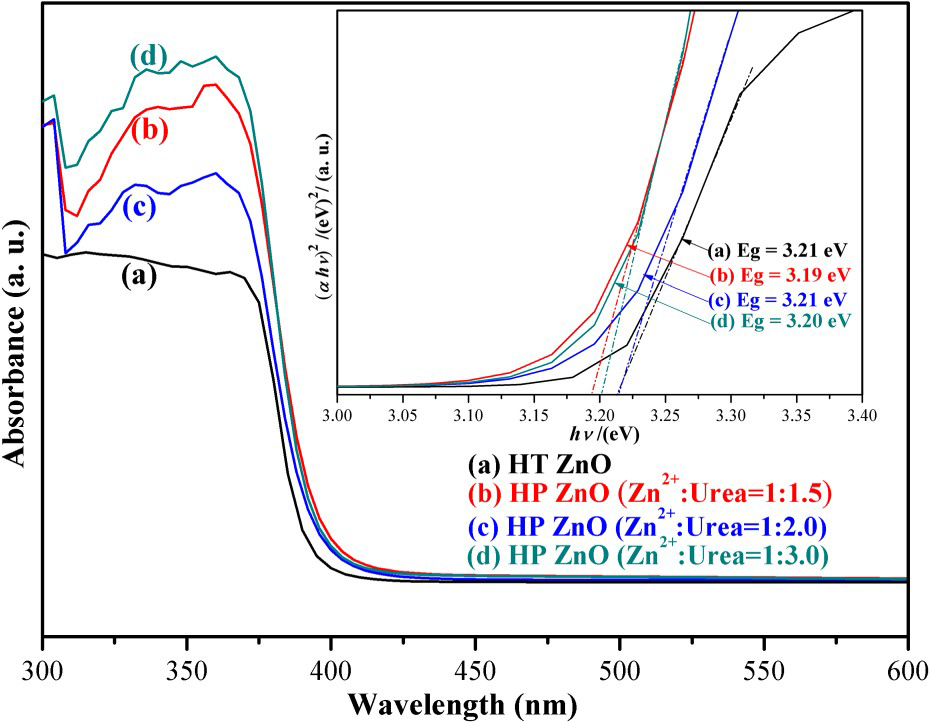
Photocatalytic activity and photostability
To demonstrate the potential environmental application, the photocatalytic activity of these ZnO NPs was investigated by evaluating the degradation of RhB and phenol as model contaminates. The photocatalytic activities and first-order kinetic plots for the photodegradation of RhB over synthesised ZnO were presented in Figure 6(a,b). The degradation of RhB hardly occurred without any catalyst, which indicated that the photoinduced self-sensitized photolysis of RhB could be neglected. The degradation efficiency of RhB solution over HT ZnO was ∼74.86% in 1.5 h. However, the HP ZnO at urea/Zn2+ molar of 2.0 (HP ZnO-2) displayed higher photocatalytic activity (1.5 h, 95.29%) than that of HT ZnO. Figure 6(b) shows the relationships between ln(C0/C) and the irradiation time for RhB degradation. As the relationships were linear (R ≥ 0.97), the photocatalytic degradation curves fit well with first-order reaction. The HP ZnO-2 exhibited the highest rate constant (k4 = 2.0065 h−1) in all samples, which was approximately 2.4 times larger than that of HT ZnO (k2 = 0.8333 h−1).
Moreover, the photocatalytic activities and first-order kinetic plots for the photodegradation of phenol over synthesised ZnO are presented in Figure 6(c,d). All samples presented the low adsorption capacity for the phenol, indicating that the characteristic absorbance decreasing mainly resulted from photocatalytic degradation of phenol. The photocatalytic degradation of phenol follows the order: HP ZnO-1 (3.5 h, 86.07%) > HP ZnO-3 (3.5 h, 84.07%) > HP ZnO-2 (3.5 h, 83.37%) > HT ZnO (3.5 h, 35.04%). Clearly, HP ZnO exhibits better photocatalytic activity than HT ZnO under the same conditions, which might be attributed to its larger surface area and thereby increase the separation efficiency of charge carriers. In addition, the HP ZnO exhibited larger rate constant than that of HT ZnO. In summary, the as-prepared HP ZnO-2 had shown superior photocatalytic activity toward RhB and phenol under UV light irradiation.
Photocatalyst stability is an important factor for practical application. To investigate the stability of photocatalytic performance in UV light region, HP ZnO-2 was used to degrade RhB dye in six repeated cycles, and the results are shown in Figure 7. It was noteworthy that the photocatalytic performance of the HP ZnO-2 exhibited effective photostability under UV light irradiation (Figure 7(a)), where the photocatalytic activity decreased by only 1.03% after six cycles. The HP ZnO-2 photocatalysts were gained from the suspension by a simple filtration and then observed by XRD. For comparison, the XRD patterns of the samples before and after UV irradiation were measured together under the same conditions, and the results are shown in Figure 7(b). All the diffraction peaks can be indexed as the hexagonal ZnO, which were consistent with the JCPDS 36-1451. The XRD patterns showed that no change could be found when ZnO suffered from six catalytic runs. These results imply that HP ZnO-2 had no obvious photocorrosion and was highly stable, even after repeated cycles.
(a) Six photocatalytic degradation cycles of RhB using HP synthesised ZnO samples at urea/Zn2+ molar of 2.0 (HP ZnO-2) under exposure to UV irradiation; (b) the XRD patterns and the FESEM images of this ZnO samples (c) before and (d) after reused six cycles under exposure to UV irradiation, respectively.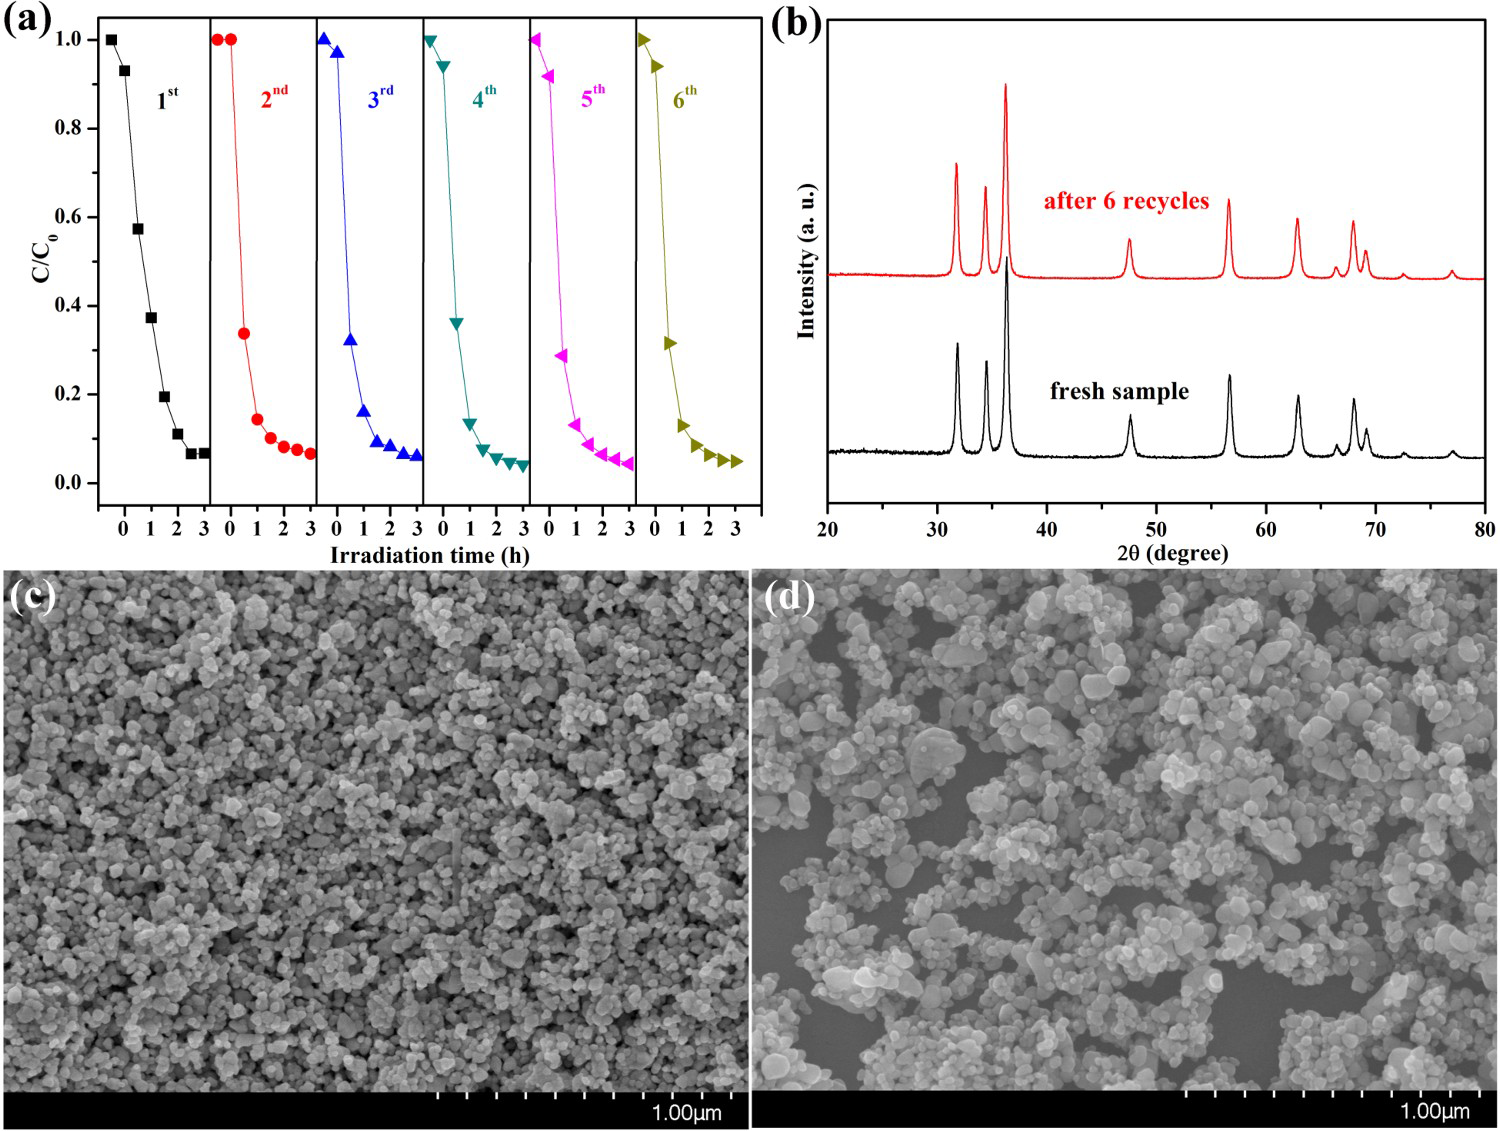
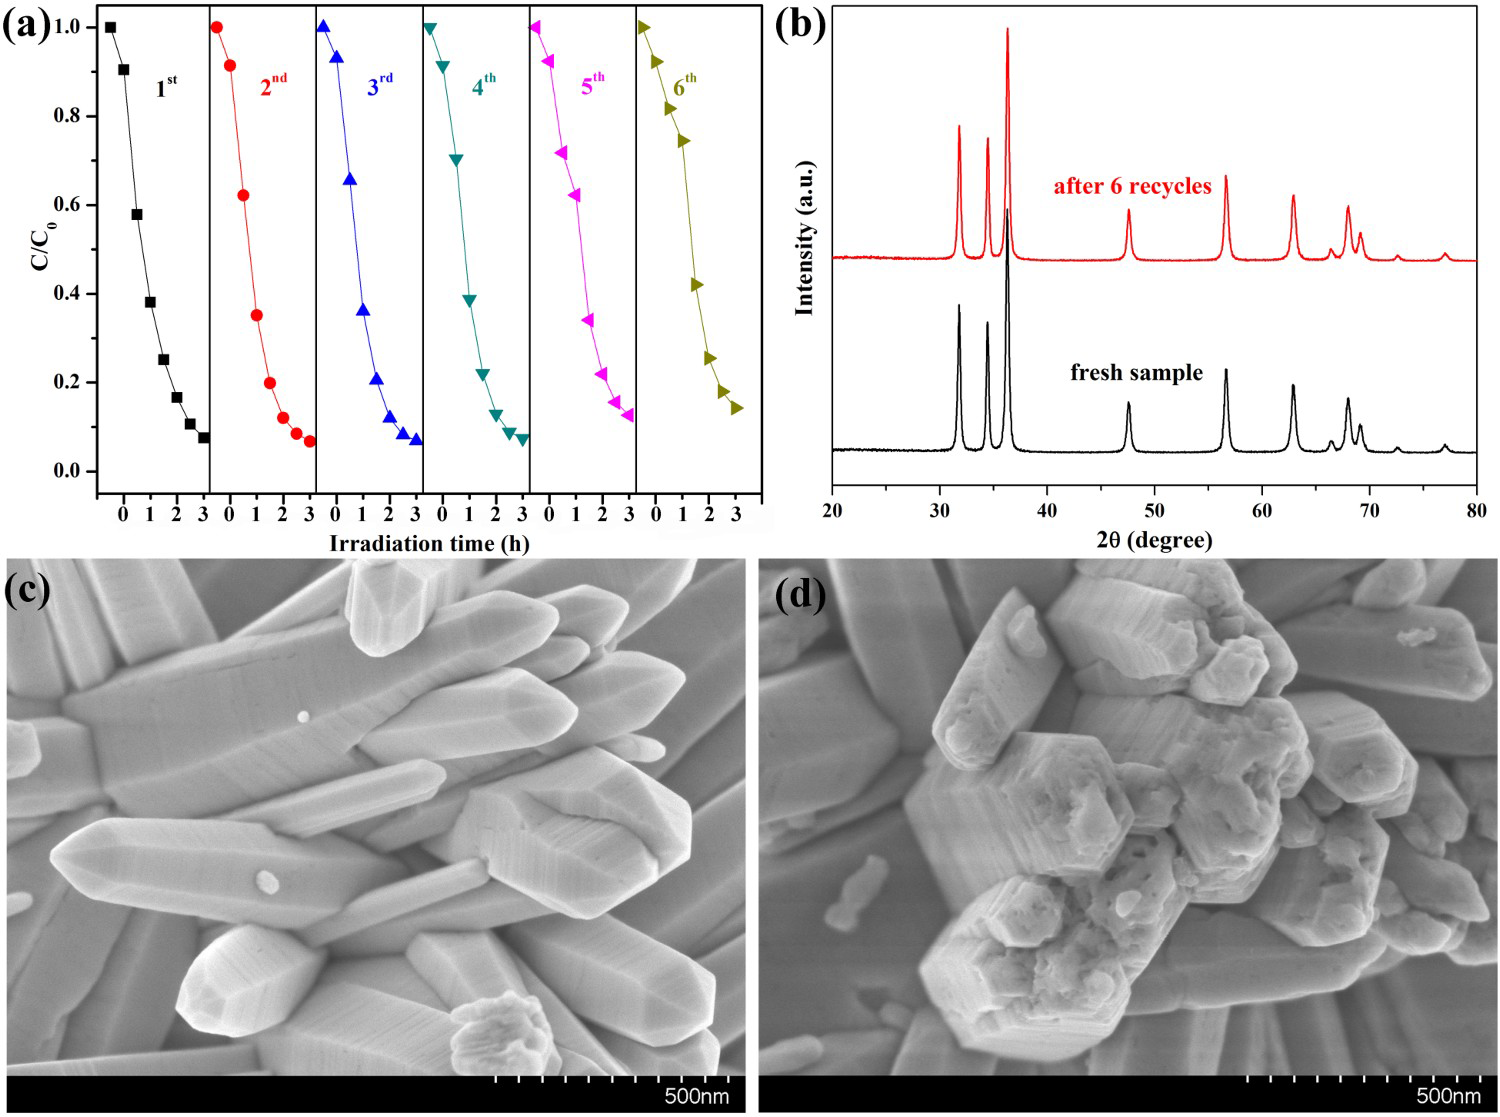
For comparison, we also investigated the photostability performance of HT ZnO. It was clear that the photocatalytic activity of HT ZnO reduced by 6.74% after six cycles (Figure 8(a)). It was found that the (a) Six photocatalytic degradation cycles of RhB using hydrothermally synthesised ZnO samples under exposure to UV irradiation; (b) the XRD patterns and high-magnification FESEM images of this ZnO samples (c) before and (d) reused six cycles under exposure to UV irradiation. plane of rodlike ZnO suffers from significant photoinduced dissolution corresponding to Figure 8(d), whereas the HT ZnO crystalline planes are intact before exposure to UV irradiation (Figure 8(c)). Many reports have suggested that ZnO semiconductor suffers from a decrease in photocatalytic activity due to the photoinduced dissolution [25]. The photocorrosion process of ZnO is described by the following equations [26].
As the  surfaces are located in the end of long rodlike ZnO, their surfaces area is smaller than that of nonpolar
  surfaces. On the other hand, photocorrosion occurred on limited
  surfaces rather than on the rodlike HT ZnO bulk. Therefore, XRD pattern of HT ZnO showed that none evident change after six catalytic runs (shown in Figure 8(b)) though photocorrosion occurred and decreased photocatalytic activity of HT ZnO. These findings strongly confirmed the enhanced photocatalytic behaviour of the HP ZnO-2 photocatalyst.
Possible mechanism of improved photocatalytic activity
It is well-known that the photodegradation performance in the photocatalytic reaction system comes from the strong oxidising properties of the active species: holes (h+), superoxide anion radicals  , and hydroxyl radicals (
 ) [27, 28]. In order to understand which active species are dominant, the photocatalytic degradation process is performed through active species trapping experiments. Benzoquinone (BQ) [29], sodium oxalate (Na2C2O4) [27], and isopropanol (IPA) [30] are used as the
  scavenger, h+ scavenger, and
  scavenger, with concentrations of 1, 10, and 10 mmol L−1, respectively.
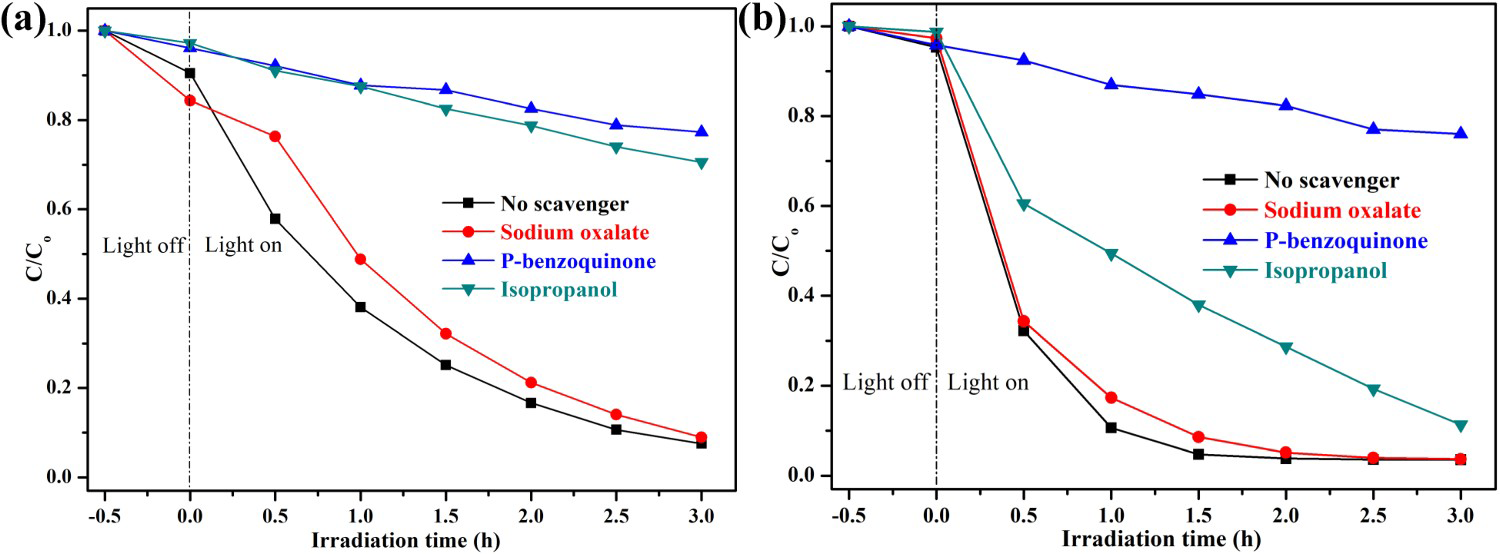
Figure 9 displays the influence of different quenchers on UV light photocatalytic activity of ZnO samples for the degradation of RhB. The degradation efficiency of RhB changed slightly with the addition of sodium oxalate, implying that few h+ were formed in the photocatalytic reaction system. However, the degradation activity of ZnO samples decelerated drastically after the addition of p-benzoquinone, indicating that Effects of various scavengers on the photocatalytic degradation of RhB over (a) hydrothermally synthesised ZnO, (b) HP-prepared ZnO at urea/Zn2+ molar of 2.0 under UV light irradiation. radicals play a very important role in the reaction system. Moreover, after the addition of isopropanol (IPA), the photodegradation efficiency of RhB was inhibited significantly as the result of the quenching of
  , which indicated the
  is the main active species generated in ZnO photocatalytic reaction system. However, compared with HP ZnO-2, the decrease in the photocatalytic activity of HT ZnO is more severe by addition of IPA. In this case, holes will constantly be consumed by the photo-corrosion process, resulting in a smaller amount of
  in the HT ZnO reaction system. In addition, a portion of
  was quenched after addition of isopropanol. Finally, the decrease in the photocatalytic activity of HT ZnO is more severe than that of HP ZnO-2 by addition of IPA.
In summary, the main reactions in the photocatalytic reaction system of ZnO were conducted as follows [18, 31].


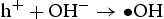


Generally, the photoluminescence spectra of photocatalysts can be used to illustrate the recombination rate of the photogenerated electron–hole pairs. As shown in Figure 10, the PL spectra of ZnO samples present an important UV emission at ∼379 nm that can be attributed to the free excitons [32,33], and another broad yellow and green peaks in the range of 450–600 nm attributed to the intrinsic or extrinsic defects (such as oxygen vacancies and Zn interstitial) in ZnO samples [34,35]. It can be observed that HT ZnO exhibited the strongest photoluminescence with an emission peak centred at ∼574 nm. The possible defects on/near the surfaces should be clarified for the explanations of surface-dependent emission intensity [36]. Figure 11 shows the schematic models of the atomic structures on Photoluminescence (PL) spectra of (a) hydrothermally synthesised ZnO and homogeneous precipitation prepared ZnO (b) Zn2+:urea = 1:1.5, (c) Zn2+:urea = 1:2.0, (d) Zn2+:urea = 1:3.0, λex = 325 nm. Schematic models of the atomic structures on different crystal surfaces of ZnO: (a)  and
and  crystal surfaces of ZnO, respectively. For the wurtzite HT ZnO crystal, the
  directions are the polar direction, and the
  direction is nonpolar. The corresponding
  surfaces are therefore polar surfaces, and the
  surfaces are nonpolar. The nonpolar
  surfaces are electrically neutral and have relatively low surface energy, thus, very few defects should present on the surface. For the
  surfaces, as shown in Figure 11(b), half of the O atoms connect to three Zn atoms (marked by a dotted line), and the other half of the O atoms only connect to two Zn atoms (marked by a dashed line). Thus, the average surplus charge of one surface O atom is 5/6. Therefore, the polar
  surfaces need to eliminate the surplus charges to form a stable surface when they are exposed, there should be many more oxygen vacancies formed on or near the surface. It can be observed that HT ZnO exhibited the strongest photoluminescence with an emission peak centred at ∼574 nm, which could be related to defects on polar
  surfaces.
 , (b)
, (b)  .
.
Compared with HT ZnO, the PL peaks of HP ZnO (prepared via HP method) in the range of 450–600 nm decreased largely may due to the high crystallinity and higher perfection of the surface states. Therefore, HP ZnO exhibited favourable photocatalytic activity in terms of slow recombination rate of photogenerated electron–hole pairs [37], which was confirmed in photocatalysis experiments of the as-prepared ZnO products.
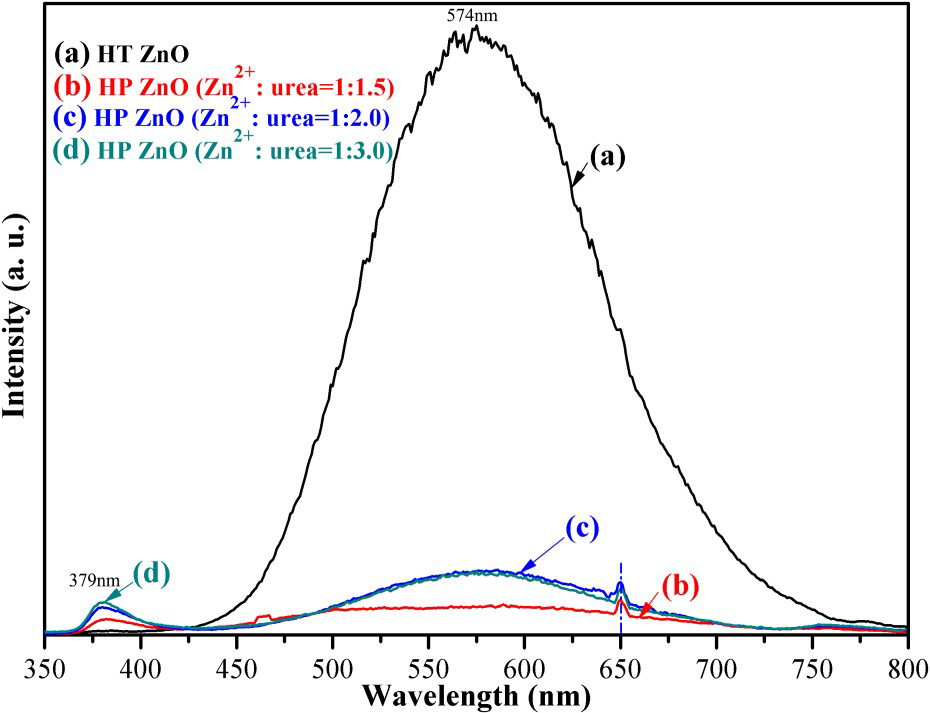
The photocurrent response is an effective method to understand the generation, separation, and migration of photogenerated carriers in the photocatalytic process. Figure 12 shows the photocurrent responses of ZnO samples in the light and dark. It can be clearly seen that the photocurrent densities of all forms of HP ZnO are higher than that of the HT ZnO substrate. The photocurrent increases in the order HT ZnO, HP ZnO-1, HP ZnO-2 and HP ZnO-3, which approximately corresponds with their photocatalytic activity. In general, the enhanced photocurrent response indicated a more effective separation of photoinduced electron–hole pairs and a faster interfacial charge carriers transportation in the HP ZnO samples.
Photocurrent transient response of ZnO samples under UV irradiation (λ = 254 nm): (a) hydrothermal synthesis, (b) Zn2+:urea = 1:1.5, (c) Zn2+:urea = 1:2.0, (d) Zn2+:urea = 1:3.0. [Na2SO4] = 0.5 M.
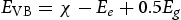
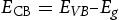
Furthermore, the band edges of a semiconductor are vital and closely entwined with its physicochemical properties. Hence, it is important to consider the band energy of semiconductors. The band edge positions at the point of zero charge (PZC) were estimated by the following equations [38, 39].
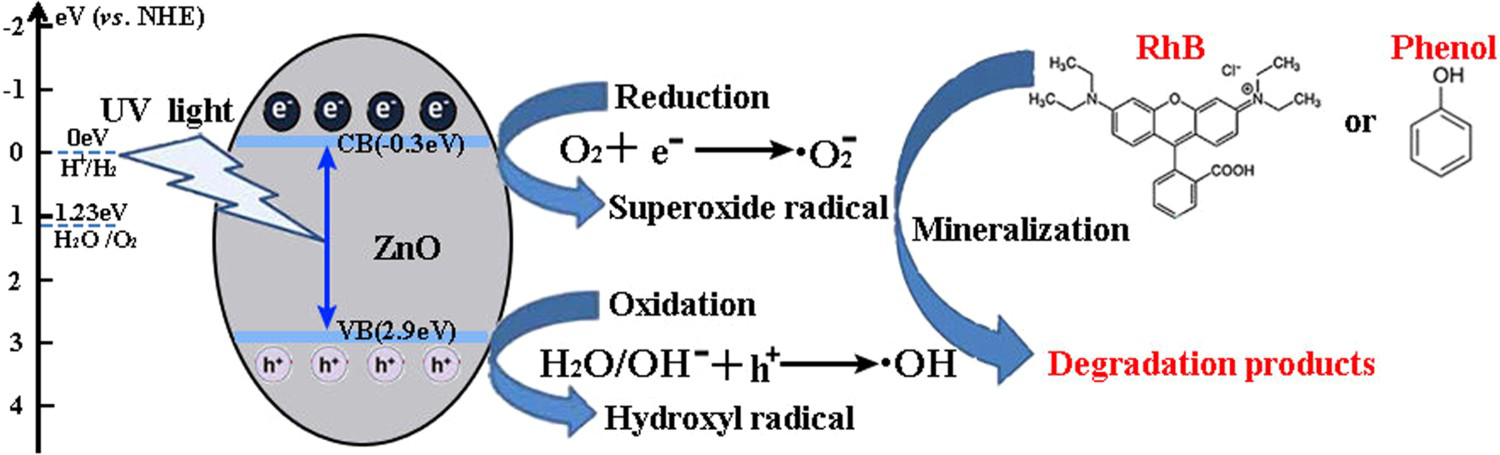
Based on the above characterisation, a possible mechanism for the enhanced photocatalytic performance of HP ZnO-2 under UV light has been proposed, as illustrated in Figure 13. When HP ZnO-2 is exposed to UV light, the electrons in the valence band are excited and move to the conduction band, leading to the formation of h+ that will be quickly transported to the surface of the particle due to the short distance. Subsequently, the h+ further reacted with the absorbed OH− or H2O molecules, producing Schematic representation of the photocatalytic reaction. with a strong oxidising nature, which was assigned to the oxidisation of organic contaminant. Separated electrons might be consumed by the oxygen molecules dissolved in the solution, thus, the physisorbed oxygen is converted to chemisorbed oxygen
  . During the photocatalytic oxidation process, two main reactive oxidative species,
  , were formed, which were involved in the destruction process of RhB and the phenol structure respectively. Their oxidation or reduction activities destroy the conjugated structure. With prolonged light irradiation, the effects of active intermediate species were enhanced, resulting in further opening-ring and mineralisation of less organic matters [40,41].
Compared with HT ZnO and HP ZnO-2 with much higher specific surface area, determined by N2 adsorption–desorption isotherms, not only facilitate the surface absorption of the UV light and mass transport but also provide more active catalytic sites, resulting in the production of highly reactive oxygen species (ROS) and photocatalytic performance [42]. Additionally, the superior crystalline quality and lower surface defects of HP ZnO-2 may improve its charge-separation efficiency and prolong the lifetime of charge carriers, which is supported by the XRD, PL, and photocurrent results. As a result, HP ZnO-2 exhibited enhanced photocatalytic activity and better photostability.
Conclusions
Two kinds of bare ZnO nanocrystals with different morphologies, namely rod-based flower-like and nearly spherical, have been successfully synthesised through hydrothermal pathways (HT) and homogeneous precipitation method (HP) respectively at a relative low temperature. The photocatalytic degradation of RhB and phenol in aqueous solution has been investigated in detail by employing the two kinds of ZnO nanomaterials under UV irradiation separately. HP ZnO-2 presented the highest efficiency among all the as-prepared photocatalysts because it has more active catalytic sites and highly reactive oxygen species production. A reactive species trapping experiment demonstrated that  and
and  were the main reactive species in the photocatalytic process. In addition, the enhanced photoactivity and better photostability over HP ZnO-2 sample is accredited to the lower surface defects and the promotion of e−/h+ separation. This investigation provides an understanding for designing applicable ZnO-based photocatalysis nanomaterials by reasonably controlling pH and particle dispersion.
Footnotes
Disclosure statement
No potential conflict of interest was reported by the authors.