
Abstract
Si/Graphene nanoparticles represent attractive alternative anode materials for Lithium-ion batteries. Graphene nanosheets with different properties, including surface area, defect distance, and charge-transfer resistance, were fabricated and characterised in Si/Graphene nanocomposites formed by static-electric self-assembly then by an in-situ reduction process. Graphene nanosheets that exhibited the highest surface area, the shortest defect distance, and the lowest charge-transfer resistance demonstrated the best overall electrochemical performance, with a high initial discharge capacity of 2692 mAh g−1, good cycling performance of 1135 mAh g−1, at the 200th cycle at the current rate of 0.5 C. This work shows the preferable graphene quality for Si/Graphene nanocomposite anode and provides insights into the design of graphene nanocomposite electrodes, regardless of the graphene synthesis method.
Keywords
Introduction
Silicon (Si) is a promising candidate for use as the anode material in Lithium-ion batteries, since it exhibits a very high theoretical capacity of 3579 mAh g−1. However, the Si anode suffers from large volume expansion (∼300%) and low conductivity during the lithiation and delithiaion processes [1,2]. The volume expansion causes cracking and pulverisation of the Si anode, which leads to poor cycling performance, while the low conductivity results in low rate performance [3,4]. Carbon coating is one of the most prevalent methods to improve conductivity and electrochemical performance, meeting the following requirements: the carbon should retain intimate contact with the Si nanoparticles before and after volume expansion; be electronically and ionically conductive; and be electrochemically stable to form solid electrolyte interphase (SEI) layers [5,6].
Over the last decade, Si/Graphene anodes have attracted much attention, due to graphene's unique properties such as outstanding stiffness (1.1 × 10³ GPa Young's Modulus) and superior electronic conductivity (106 S m−1) [7]. Si/Graphene nanocomposite anodes have been fabricated by various methods, including mixing [8], polymer assembly [9], and an electronic self-assemble method [10]. In battery electrodes, graphene is often obtained by the reduction of graphene oxide (GO), because of its low cost, high energy efficiency, and ready capacity to be functionalised for specific applications [11,12]. It is well established that graphene quality is highly dependent on the synthesis conditions when fabricated by reduction of GO. For example, the history of the thermal process in Hummers’ method heavily influenced the defect density in the production of graphene nanosheets [13,14]. In another study, a nitrogen/sulphur-impurity-free graphene was obtained by a thiophene template-assisted chemical reduction, with a thermal healing process [15]. Previous work by this group also demonstrated that the quality of synthesised graphene nanosheets is strongly dependent on processing conditions [16].
However, the effect of graphene quality on the performance of battery electrodes has yet to be investigated. In studies of applications including optical electronics, photovoltaic devices, and bioelectric sensors, it was discovered that flat, single, or mono-layer and defect-free structures over large areas were desirable [17–19]. Battery electrodes demand a different set of properties. A comprehensive literature study shows that there are a lot of variables in Si/Graphene nanocomposites, such as morphology and crystallinity of Si, synthesis methods of graphene nanosheets, and the assembly processes of the nanocomposite, which includes direct mixing, chemical bonding, or physical bonding [20]. Owing to the wide variation in synthesising conditions and a lack of complete information about specific techniques, a comparative study to identify desirable properties of graphene for Si/Graphene composite anodes, based solely on analysis of the literature, is not feasible. This study serves as an early attempt to investigate the influence of graphene quality on the performance of Si/Graphene nanocomposite anodes. Graphene nanosheets were fabricated by three different processes, with different surface morphology, zeta potential, defect density, and charge-transfer resistance. Si/Graphene nanocomposites were formed by static-electric assembly, followed by the in-situ reduction process. Battery performance of the samples were studied.
Experimental
The fabrication process for Si/Graphene nanocomposites is based on a recently published study [21]. The Si nanoparticles were purchased from Alfa Aesar (crystalline, APS = 100 nm, 99%, Plasma Synthesised). Si nanoparticles were pre-washed in a piranha solution then functionalised with –NH2 groups, to introduce positive surface charges. In the first types of samples, graphite flakes were oxidised by the modified Hummer's method, to obtain negatively charged GO precursors for the graphene nanosheets. The formation of the Si/GO nanocomposite, with negatively charged GO and positively charged Si nanoparticles, was enabled by static-electric self-assembly [22]. Then in-situ thermal or chemical reduction was performed to acquire the Si/G nanocomposites. The thermally reduced Si/G nanocomposites were named as Si/tRG, and the chemically reduced Si/G nanocomposites were named as Si/cRG. The third group of Si/G nanocomposites was prepared by an improved modified Hummer's method, followed with chemical reduction, which was named as Si/iRG. The fabrication process flow chart is provided in Figure 1, and the experimental details are given in the Supporting Information.
Process flow chart of fabricated Si/tRG, Si/cRG, and Si/iRG.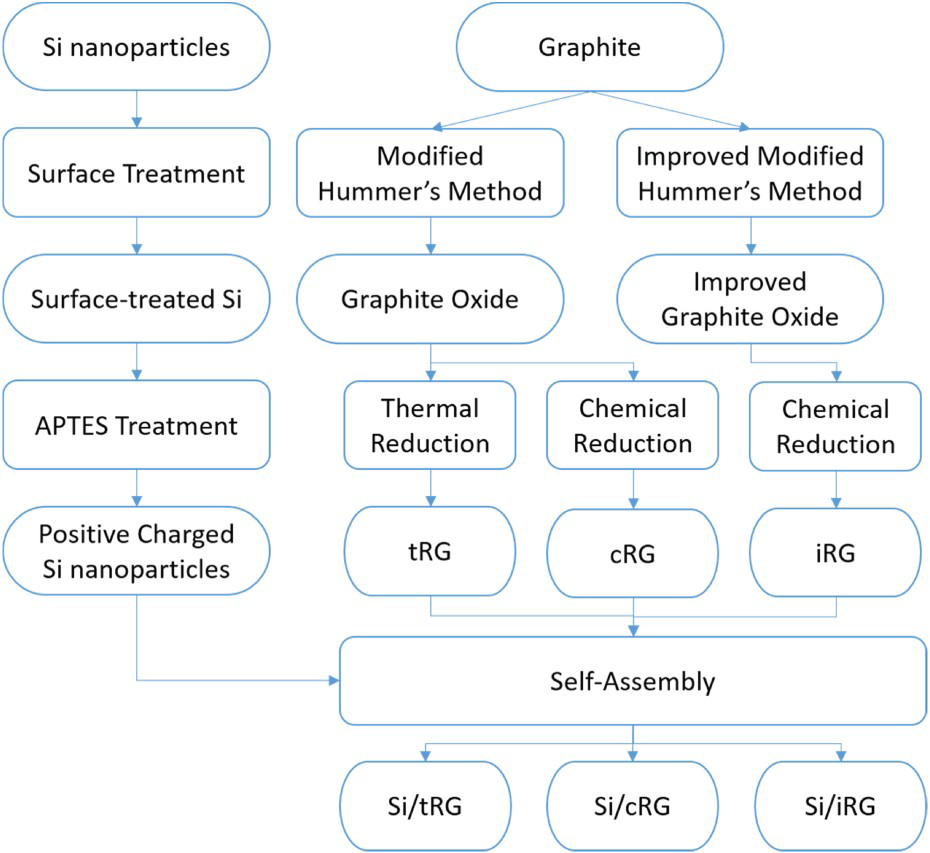
Results and discussion
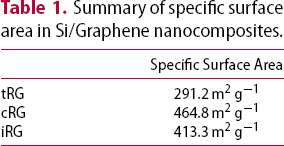
Figure 2 shows the SEM pictures of 100 nm Si particles and the synthesised graphene nanosheets of tRG, cRG, and iRG. Si nanoparticles with an average size of 100 nm are clearly seen in Figure 2(a). The inset in Figure 2(a) shows the distribution of particle size that was obtained by image analysis, using ImageJ. The layered morphology of graphene with irregularly stacked graphene sheets is observed in Figure 2(b–d). The specific surface area measurements indicate that the two chemically reduced graphene nanosheet samples are more crumpled. The chemically reduced sample (cRG) shows a large surface area of 464.8 m2 g−1, demonstrated in Table 1. The specific surface area of iRG is 413.3 m2 g−1, lower than that of cRG. This observation can be explained by the less-crumpled surface, which may be attributed to the low reaction temperature in the improved modified Hummer's method. Compared with the cRG method, the improved modified Hummer's method produces larger and flatter graphene nanosheets, due to better preservation of the carbon honeycomb framework. The morphology leads to a slightly smaller surface area in the iRG samples, which is in agreement with the literature [23]. The tRG sample exhibits the lowest specific surface area of 291.2 m2 g−1, which indicates incomplete exfoliation at high temperatures [24–26].
The SEM pictures of 100 nm Si particles, with size distribution graph inserted (a), graphene nanosheets synthesised by modified Hummer's method + Thermal reduction (tRG); (b), modified Hummer's method + Chemical reduction (cRG); (c) and improved modified Hummer's method + Chemical reduction (iRG) (d).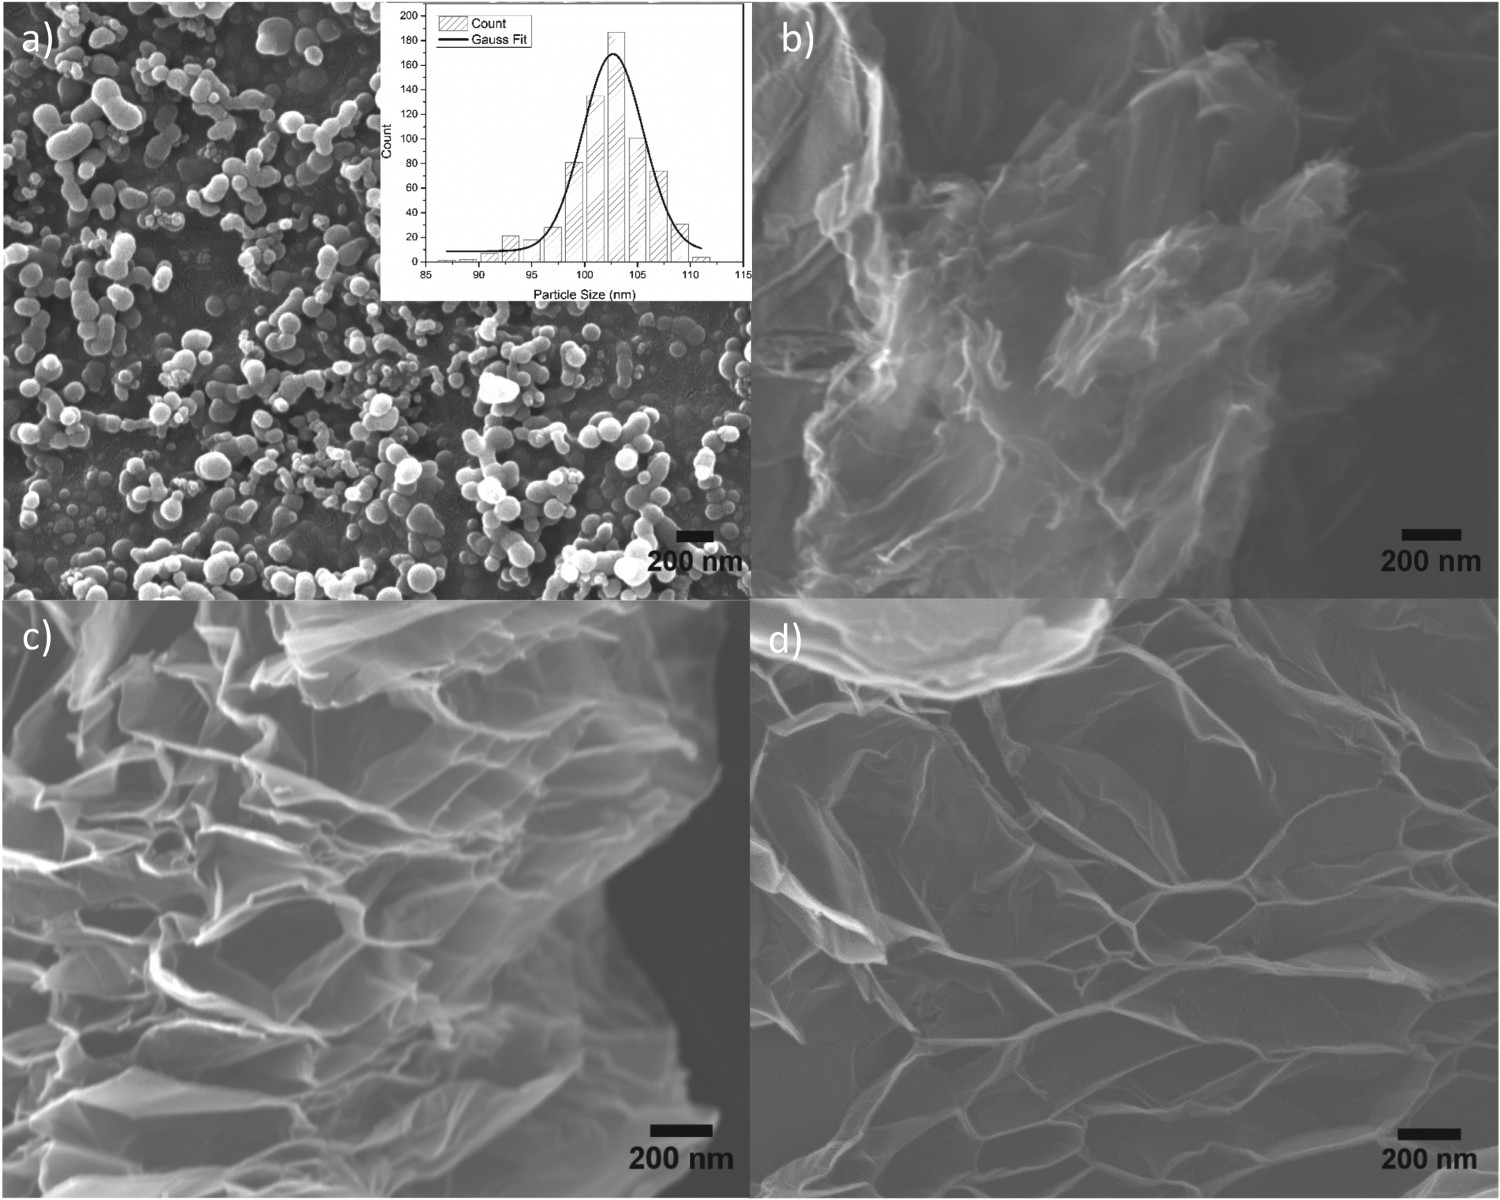
Summary of specific surface area in Si/Graphene nanocomposites.
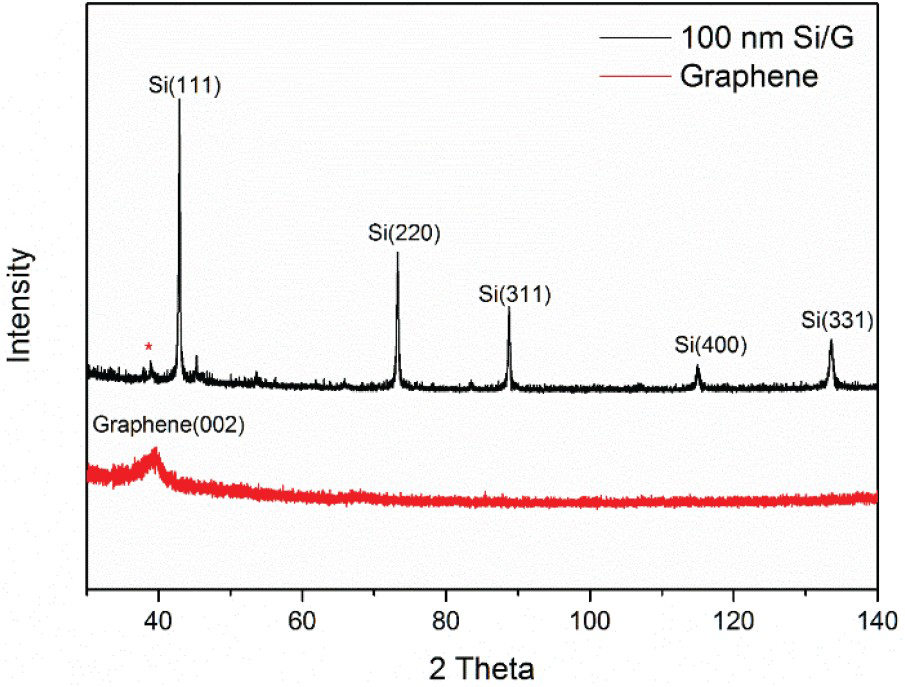
XRD of 100 nm Si/Graphene nanocomposites and graphene nanosheets.
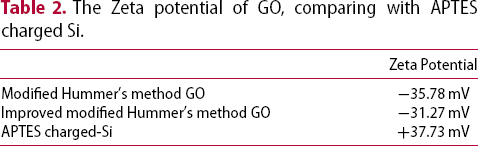
The zeta potential measurement is employed to determine the surface charge of samples, in the form of the potential difference between the dispersion medium and the stationary layer of dispersed particles. In Table 2, GO formed by the modified Hummer's method has a zeta potential of −35.78 mV. GO synthesised by the improved modified Hummer's method has a higher zeta potential of −31.27 mV. Surface-charged Si has a zeta potential of 37.73 mV, which indicates a positively charged surface and confirms the successful surface modification.
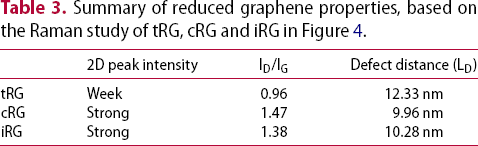
 has been established previously for point defects, where C(λ) is the function of liner laser wavelength [29–31]. The larger the ID/IG value is, the smaller the crystallite size and the smaller distances among the point defects are. The ID/IG of graphene samples are 0.96, 1.47, and 1.38 for tRG, cRG, and iRG, respectively. Thus, the LD could be calculated, based on the excitation energy of the Raman study (532 nm, 2.33 eV), as 12.33, 9.96, and 10.28 nm for tRG, cRG, and iRG, respectively. The tRG has the longest defect distance, which could be explained by the incomplete exfoliation during the thermal reduction process [24–26]. The iRG has a lower defect density than that of cRG, which could be attributed to the better-preserved honeycomb structure from the improved Hummer's method.
The Zeta potential of GO, comparing with APTES charged Si.
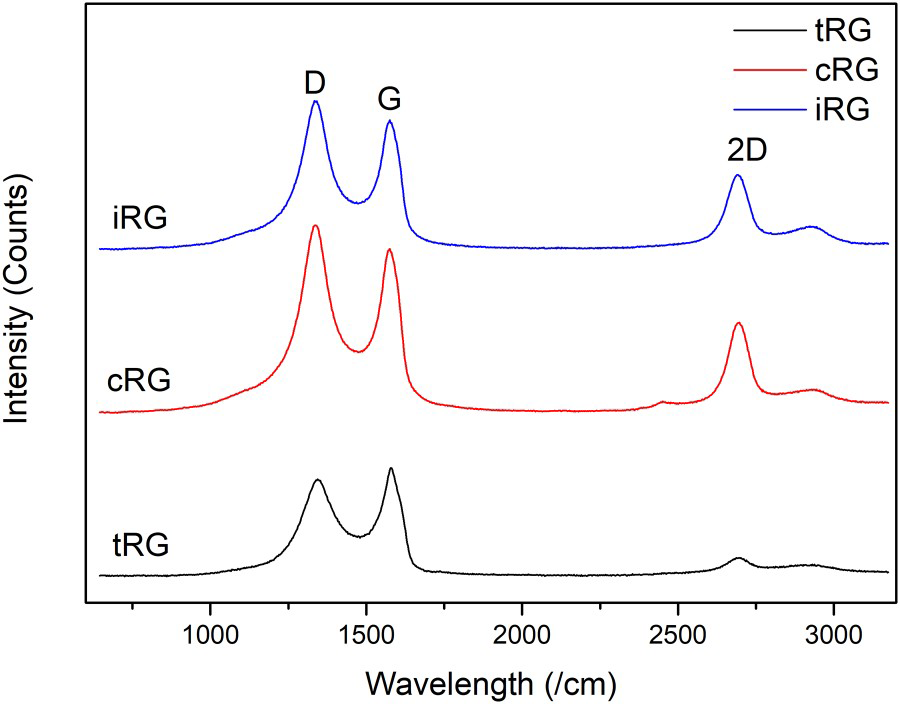
Raman Spectrum of thermally reduced graphene (Bottom), chemical reduced graphene (Middle) and improved modified Hummer's method with chemical reduction (Top) by the 532 nm green laser radiation; The D, G and 2D band peaks were labelled.
Summary of reduced graphene properties, based on the Raman study of tRG, cRG and iRG in Figure 4.
The electronic conductivities of three Si/Graphene samples were investigated by EIS (Electrochemical Impedance Spectroscopy). The fitted results, using Z-view software, are shown in Figure 5, with the equivalent circuit inserted. All three fitted EIS curves demonstrate typical Nyquist plots, which include one semicircle in the high-middle frequency region and a vertically inclined tail. The semicircle gives the internal resistance (RS) and charge-transfer resistance (Rct). The low-frequency region, called a Warburg tail, corresponds to lithium-ion diffusion in the electrodes. For Si/Graphene nanocomposites, Rct provides key insights into the electrode interface. Among the three samples, the Si/cRG anode gives the lowest charge-transfer resistance of 47.33 Ω, which indicates that the highest conductivity is at the interface. This may be attributed to the large specific surface area and the high defect density. Low charge-transfer resistance is beneficial for obtaining appropriate cycling performance in batteries.
EIS plots of Si/tRG in square, Si/cRG in circle, and Si/iRG in diamond, with the correlated Nyquist fitting at the scanning range of 200 kHz to 1 mHz.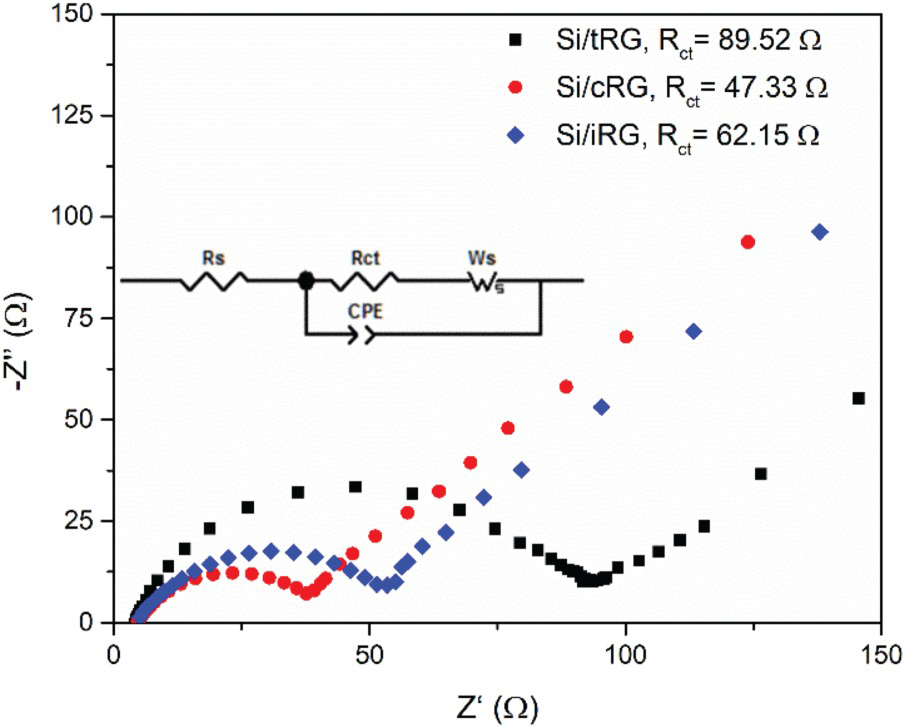
The long-term electrochemical performance of all three Si/Graphene nanocomposites is shown in Figure 6. All the coin cells were tested at a current rate of 0.5 C for 200 cycles, after two initial charging/discharging cycles, at a current rate of 0.1 C for activation purposes. Cycling performance of the Si nanoparticle electrode without graphene coating (bare Si) is also included for comparison. It is obvious that the bare Si without a graphene coating performed much worse than any of the Si/Graphene-coated samples. Among the Si/Graphene samples, Si/tRG nanocomposites demonstrate the most severe capacity decay, with only a 24.2% capacity retention, and a discharge capacity of 485 mAh g−1 at the 200th cycle. Si/iRG nanocomposites exhibit a discharging capacity of 837 mAh g−1 at the 200th cycle, i.e. a 41.3% capacity retention. Si/cRG demonstrates a discharge capacity of 1135 mAh g−1 at the 200th cycle, corresponding to a reversible capacity retention of 53.3%.
Long-term electrochemical performance of bare Si (triangle), Si/iRG (square), Si/cRG (circle), and Si/tRG (diamond) nanocomposite electrodes for 200 cycles at the current rate of 0.5 C.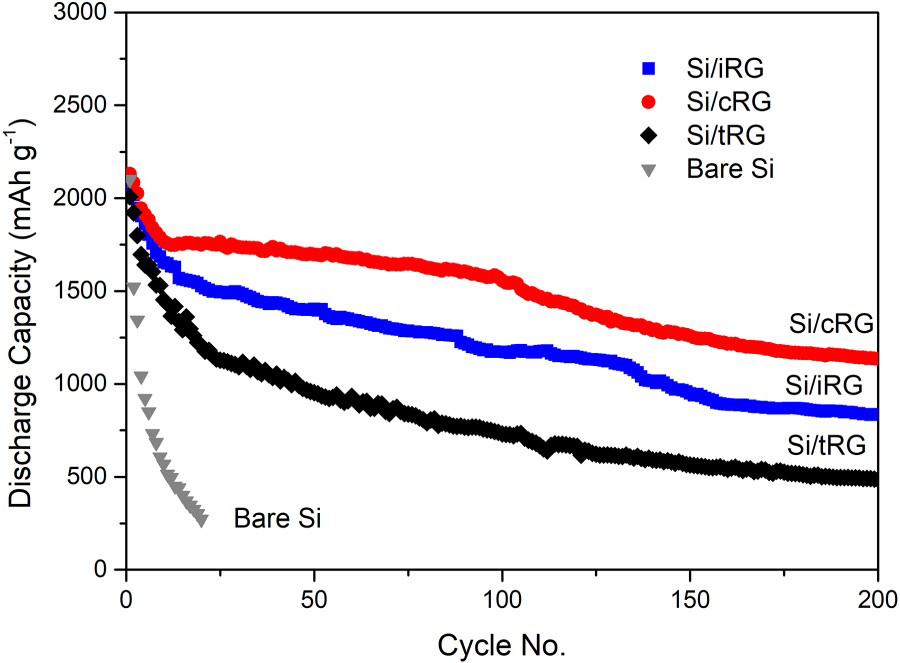
The rate performance tests were carried out at charge/discharge current densities of 0.1, 0.2, 0.5, and 1 C, for 10 cycles each, and concluded with a current density of 0.1 C for the final 20 cycles, as shown in Figure 7. The initial capacities at a current rate of 0.1 C are: 2601, 2692, and 2314 mAh g−1 for Si/iRG, Si/cRG, and Si/tRG, respectively. In all battery tests (Figures 6 and 7), it is observed that Si/cRG consistently shows the highest initial capacity. The Si/cRG nanocomposites show the best rate performance among the three samples. Si/cRG nanocomposites also have the highest capacity, around 1300 mAh g−1 at the 10th cycle, at a current rate of 1 C. After being cycled at 1 C, capacity is restored to around 1950 mAh g−1 after 20 cycles at 0.1 C. The Si/tRG nanocomposites demonstrate the lowest capacity, around 390 mAh g−1, at a current rate of 1 C.
Rate performance of Si/Graphene nanocomposite anode of Si/iRG (square), Si/cRG (circle), and Si/tRG (diamond), under the current densities of 0.1, 0.2, 0.5, and 1 C for each 10 cycles, then back to 0.1 C for the final 20 cycles,with Si specific discharge capacity.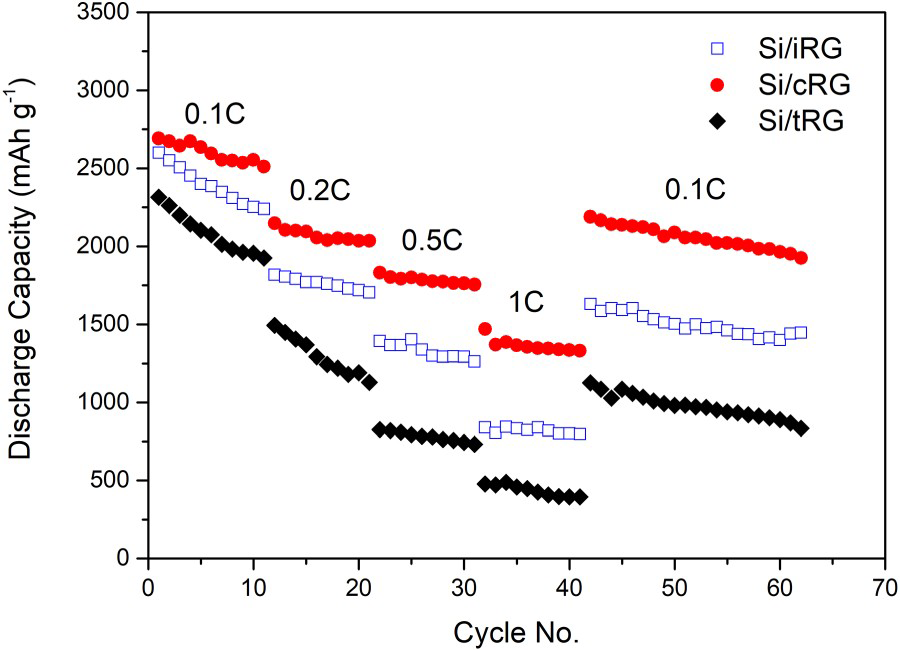
Conclusion
In conclusion, the electrochemical performance of the Si/Graphene nanocomposite anode is improved by using graphene nanosheets with a large surface area, a short defect distance, and a low charge-transfer resistance. In this study, the thermally reduced graphene nanosheets demonstrate a graphite-like structure, which resulted in the least desirable electrochemical performance. The graphene nanosheets synthesised by a modified Hummer's method followed by chemical reduction (cRG) has a high specific surface area of 464.8 m2 g−1, a short defect distance of 9.96 nm, and a low charge-transfer resistance of 47.33 Ω. The corresponding Si/cRG nanocomposites show promising battery performance. These have a high initial discharge capacity of 2692 mAh g−1, at a current rate of 0.1 C, good cycling performance of 1135 mAh g−1 at the 200th cycle, at a current rate of 0.5 C, and a high capacity of 1300 mAh g−1, at a current rate of 1 C. This work indicates that the quality of graphene nanosheets in a Si/Graphene nanocomposite anode has a significant impact on its electrochemical performance. The desirable properties of graphene nanosheets in electrodes are different from those for electronics applications. In electrodes, large surface area, short defect distance, and low charge-transfer resistance of graphene nanosheets were beneficial for improving battery performance. The outcome of this study provides insights that will aid in advancing the future selection of graphene nanosheets for different types of graphene nanocomposite electrodes, regardless of the graphene synthesis routine.