
Abstract
The addition of 3 wt-% Zn to the traditional Al–Mg alloy doubled its strength. To understand the strengthening mechanism, the enhancement in strength with the variation in Mg content was studied. The grain boundary and solid solution strengthening decrease with the reduction in the Mg content; however, their contributions to the yield strength are insignificant. The contribution of precipitation strengthening to the yield strength is more than 80%; however, due to the unchanged precipitate characteristics, the strengthening effect changes slightly with the variation in the Mg content. The reduction in strength is primarily due to Mg solid solution strengthening. The variation in the ductility of Al–Mg–Zn alloys was studied by fracture analysis.
Introduction
The yield strength of aluminium alloys is affected by their microstructural properties such as grain/phase boundaries, solutes/vacancies, precipitates/dispersoids and dislocations, resulting in grain boundary strengthening, solid solution strengthening, precipitation/ dispersion strengthening and strain hardening, respectively [1–3]. When a dislocation approaches the grain boundary, its migration to another grain boundary is blocked due to the difference between the orientation of slip planes and the directions in two neighbouring grains. Thus, the grain boundaries form barriers to the dislocation motion and result in the strengthening of polycrystalline metals, known as grain boundary strengthening. In aluminium alloys, the contribution of grain boundary strengthening to the yield strength, which depends on the grain size, is non-negligible. This contribution ranges from as low as several MPa in coarse-grained pure aluminium to as high as several hundred MPa [2,4–6] in ultrafine-grained Al–Mg alloys. Over the last decades, the solid solution strengthening mechanism has been studied thoroughly [7,8]. The hardening of solute atoms always results from the strain field around the atoms due to the difference between the size of the solute atoms and the matrix atoms. This strengthening mechanism can always be found in Al–Mn and Al–Mg alloys because they are non-heat-treatable alloys [9], and its contribution to the yield strength is significant. However, as reported by several studies [4,10,11], the precipitation/dispersion strengthening, resulting from the pinning of dislocation motion by the precipitates/dispersoids, was found to be more effective than the three strengthening mechanisms for heat-treatable aluminium alloys mentioned above.
Although β-Al3Mg2 precipitates can be found in the microstructure, few have an effective strengthening effect for traditional Al–Mg alloys. Thus, the application of 5××× series aluminium alloys is limited due to their poor strength compared with that of high-strength 7××× series aluminium alloys. The main reason is that the latter alloys are age-hardenable, while Al–Mg alloys are not. Lee et al. [12] and Huskins et al. [13] showed that the grain boundary strengthening, solid solution strengthening and strain hardening contributed to the yield strength of Al–Mg alloys, and the increase in strength due to the grain boundary strengthening, was always lower than those resulting from the other two strengthening mechanisms. To increase the strength of Al–Mg alloys, effective precipitates and dispersoids were introduced into the microstructure. Several researchers [2,4,14,15] studied the introduction of Sc/Zr into Al–Mg alloys. Thus, Al3Sc(Zr) precipitates, with effective precipitation/dispersion strengthening effect, were generated in the microstructures, and resulted in an increase in the yield strength. However, the commercial application has been limited owing to the heavy cost of the addition of Sc/Zr.
With Zn added to Al–Mg alloys, the spherical coherent T-Mg32(Al,Zn)49 phase precipitates after heat treatment, which is proven to have a significant precipitation strengthening effect [10,11]. The decomposition sequence of the T-Mg32(Al,Zn)49 phase during aging after solid solution treatment can be represented as [16,17]: sss(supersaturated solid solution)→T′(metastable)→T. In a previous study [11], when 3 wt-% Zn was added to the Al–Mg alloy, the spherical coherency T phases were dispersedly distributed in the matrix, resulting in a significant improvement (more than 200 MPa) in the yield strength. Although a significant improvement was observed, the strengthening mechanism was not clarified. The strength improvement after Zn addition results from the precipitation strengthening of the introduced T phase. However, apart from the introduced precipitation strengthening method, there are two other native strengthening mechanisms (grain boundary strengthening and solid solution strengthening) in Al–Mg–Zn alloys. Therefore, to understand the architecture of the yield strength and for the further optimisation of the mechanical property, the priority of each strengthening mechanism needs to be identified. In this study, the mechanical behaviour of Al–xMg–(3.0 wt-%)Zn alloys was studied, with their Mg content varied in the range of x = 3.5–5.6 wt-%. The contributions of each strengthening mechanism on the yield strength and the yield strength variation of the alloys with different Mg contents were determined, which will be useful for the optimisation of alloy compositions to control their tensile properties.
Experimental procedures
Material preparation
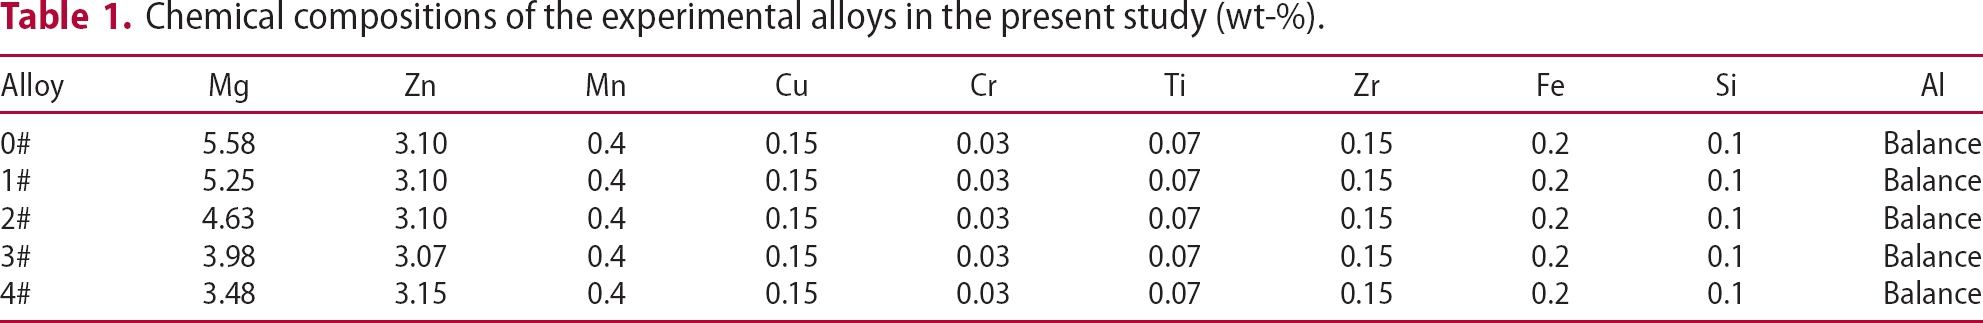
Chemical compositions of the experimental alloys in the present study (wt-%).
Tensile tests and microstructural observations
The tensile test specimens were taken in the rolling direction with a gauge length of 25 mm and width of 6 mm. The tensile tests were performed at room temperature with an initial strain rate of 6.7 × 10⁻⁴ s−1 using a universal testing machine. Each reported tensile testing value was the average of three individual tests. The fracture morphologies after tensile tests were observed using a Phenom XL scanning electron microscope (SEM) under secondary electrons model. To determine the chemical compositions of particles in the dimples, energy dispersive spectroscopy (EDS) was performed.
The grain size and crystallographic misorientation of the grains were analysed by electron back scatter diffraction (EBSD) using a Zeiss Ultra 55 SEM and software Channel 5. The EBSD samples sectioned in the normal direction–rolling direction plane were electro-polished with 5 vol.-% perchloric acid and 95 vol.-% ethanol at −30°C and a voltage of 30 V after mechanical polishing. These EBSD samples were mounted on a pre-tilted sample holder with a tilt angle of 70°. To obtain an average value, three random areas from the mid-thickness layer of the plates were examined with a step size of 1 µm.
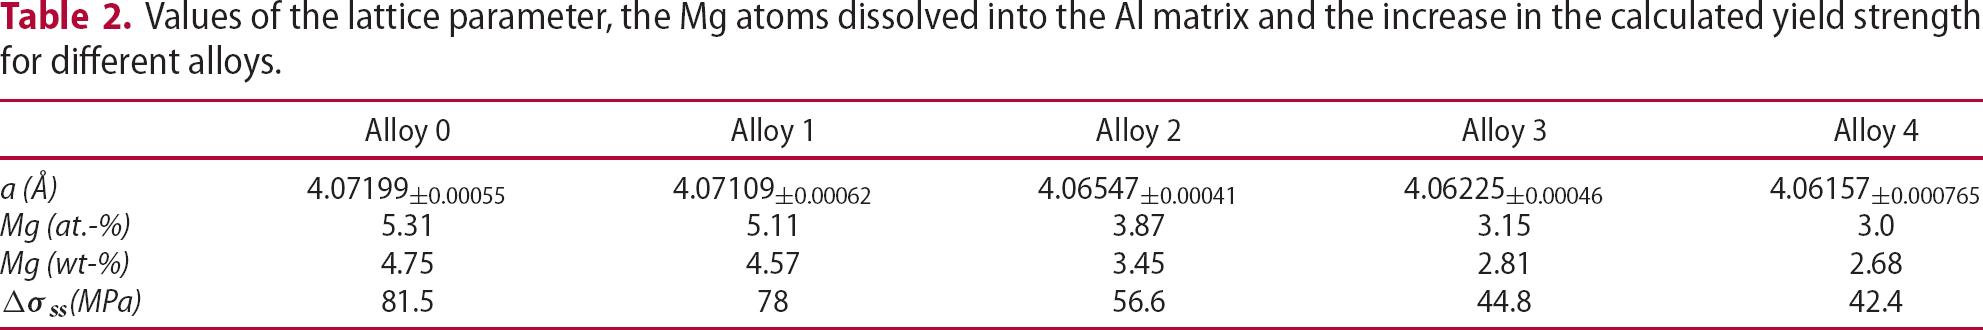
The contribution of solute atoms to the yield strength was estimated by determining the solid solubility of Mg dissolved in the α-Al matrix of the T6 treated alloys. The solubility of Mg atoms was calculated by measuring the lattice parameters of alloys by X-ray diffraction (XRD, Rigaku D/MAX 2500), and the proportion of T′ phase was also calculated by the XRD measurement. These tests were performed at a scanning rate of 2°/min using filtered Cu–Kα radiation from a source operating at 40 mA and 40 kV. Before the scanning process, the diffraction peaks were calibrated using standard Si powders, and the samples were scanned over the 2θ value in the range of 30–100°. The specimens (15 mm × 15 mm block) for the XRD measurements were ground and polished.
To observe the microstructures of these alloys, the samples for the transmission electron microscopy (TEM) observations were acquired from the middle of the T6 sheets. Thin foils of 3-mm discs were ground to ∼80 µm, and then thinned by double jet electro polishing in 25% nitric acid and 75% methanol solution at −35°C with an applied current of ∼60 mA. Conventional TEM and high resolution TEM (HRTEM) were performed using a FEI Tecnai F20 microscope. The average sizes of the matrix precipitates were measured by 100 particles of five different images.
Results
Mechanical properties
The aging hardening curves of the alloys with the two-step aging at 90°C during 24 h and 140°C during 1–100 h are shown in Figure 1. The similar variation in the hardness with the aging time is observed in these five alloys as follows: (1) at the aging times in the range of 1–25 h, the hardness of alloys gradually increases with the increasing aging time and reach the peak at 25 h; (2) at the aging times in the range of 25–100 h, the hardness tends to decrease with the prolonged aging time but not significantly. The difference among the alloys is that with the decrease in the Mg content, the hardness of the alloys decreases at the same aging time. The peak-aging time of all alloys at 140°C is 25 h, and those of the T6 process for the studied alloys are 24 h at 90°C and 25 h at 140°C.
Aging hardening curves of alloys 0–4.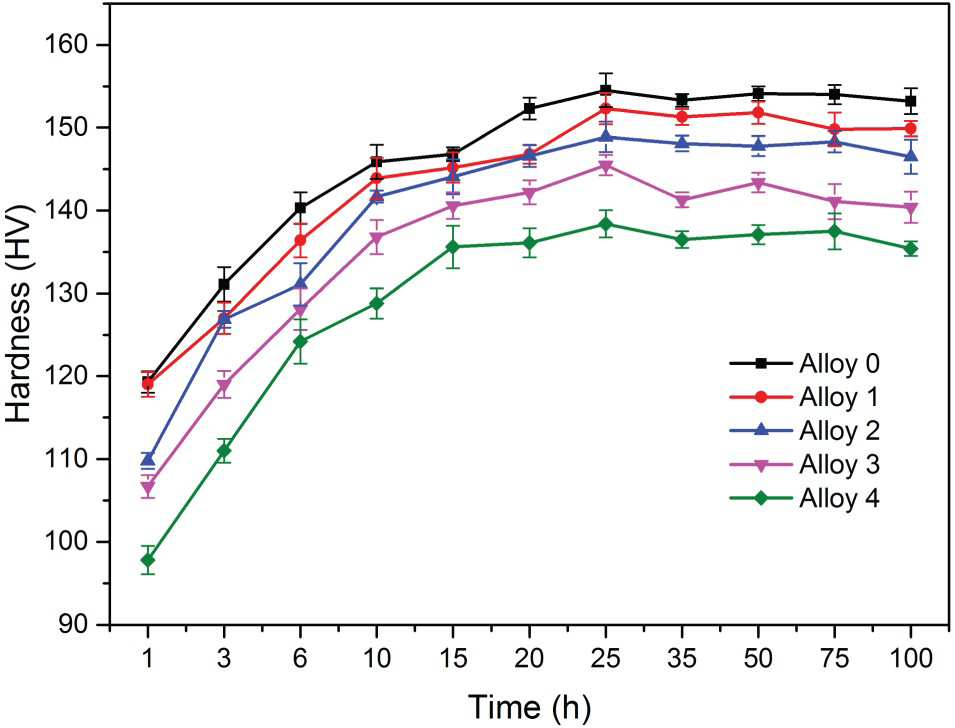
The engineering stress–strain curves and yield (σ0.2) and tensile strengths of the rolled, T6-treated Al–Mg–Zn alloys with different Mg content are shown in Figure 2(a,b), respectively. The results show that both the yield and tensile strengths decrease gradually with the reduction of the Mg content, while the ductility increased.
(a) Engineering stress–strain curves during the tensile test of different T6- treated alloys and (b) yield and tensile strengths of sheets with different Mg contents.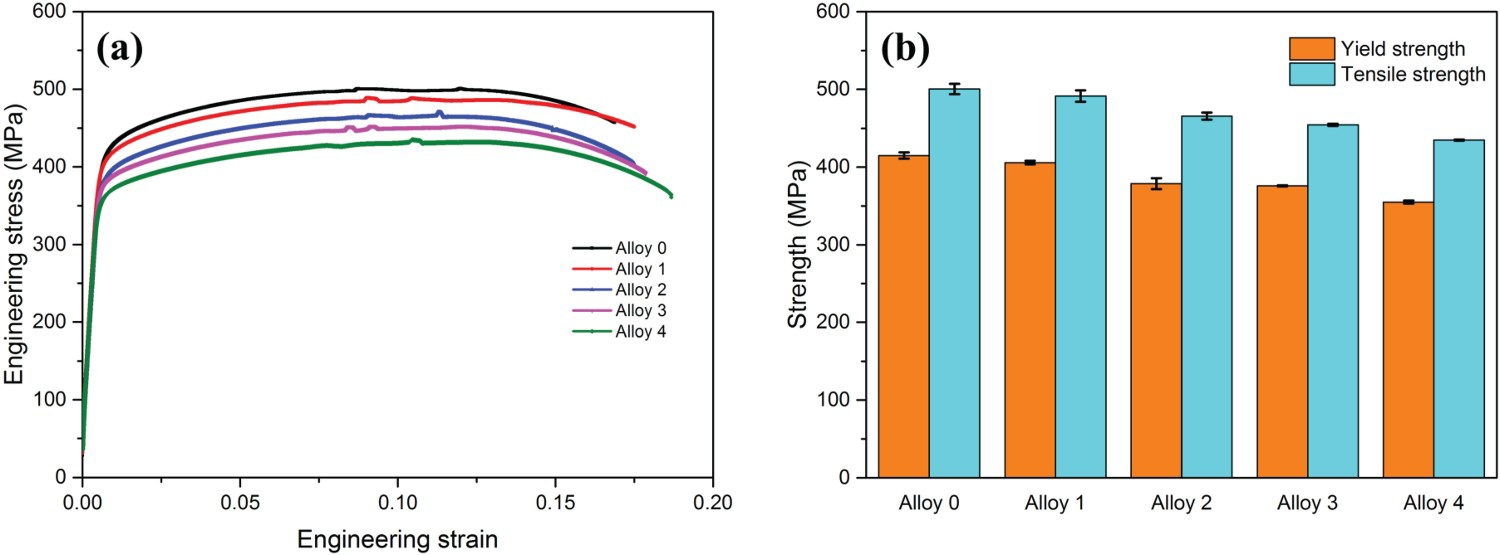
Tensile fracture analysis
To analyse the fracture characteristics of Al–Mg–Zn alloys, the tensile fractures of alloy 0, alloy 2 and alloy 4 were observed with SEM; the results are shown in Figure 3. Two kinds of fracture morphologies were observed on the fracture of all specimens: dimples and intergranular fracture. This indicates that all alloys exhibit the same fracture mechanism under tensile test. In addition, three kinds of brittle particles on the fractures were tested with EDS analysis, such as brittle oxide (point 1), brittle iron/manganese-rich phase (point 2) and brittle Mg2Si phase (point 3). The tensile fracture is due to these brittle particles.
SEM images of (a) alloy 0, (b) alloy 2 and (c) alloy 4, and EDS analysis of typical particles in the dimples.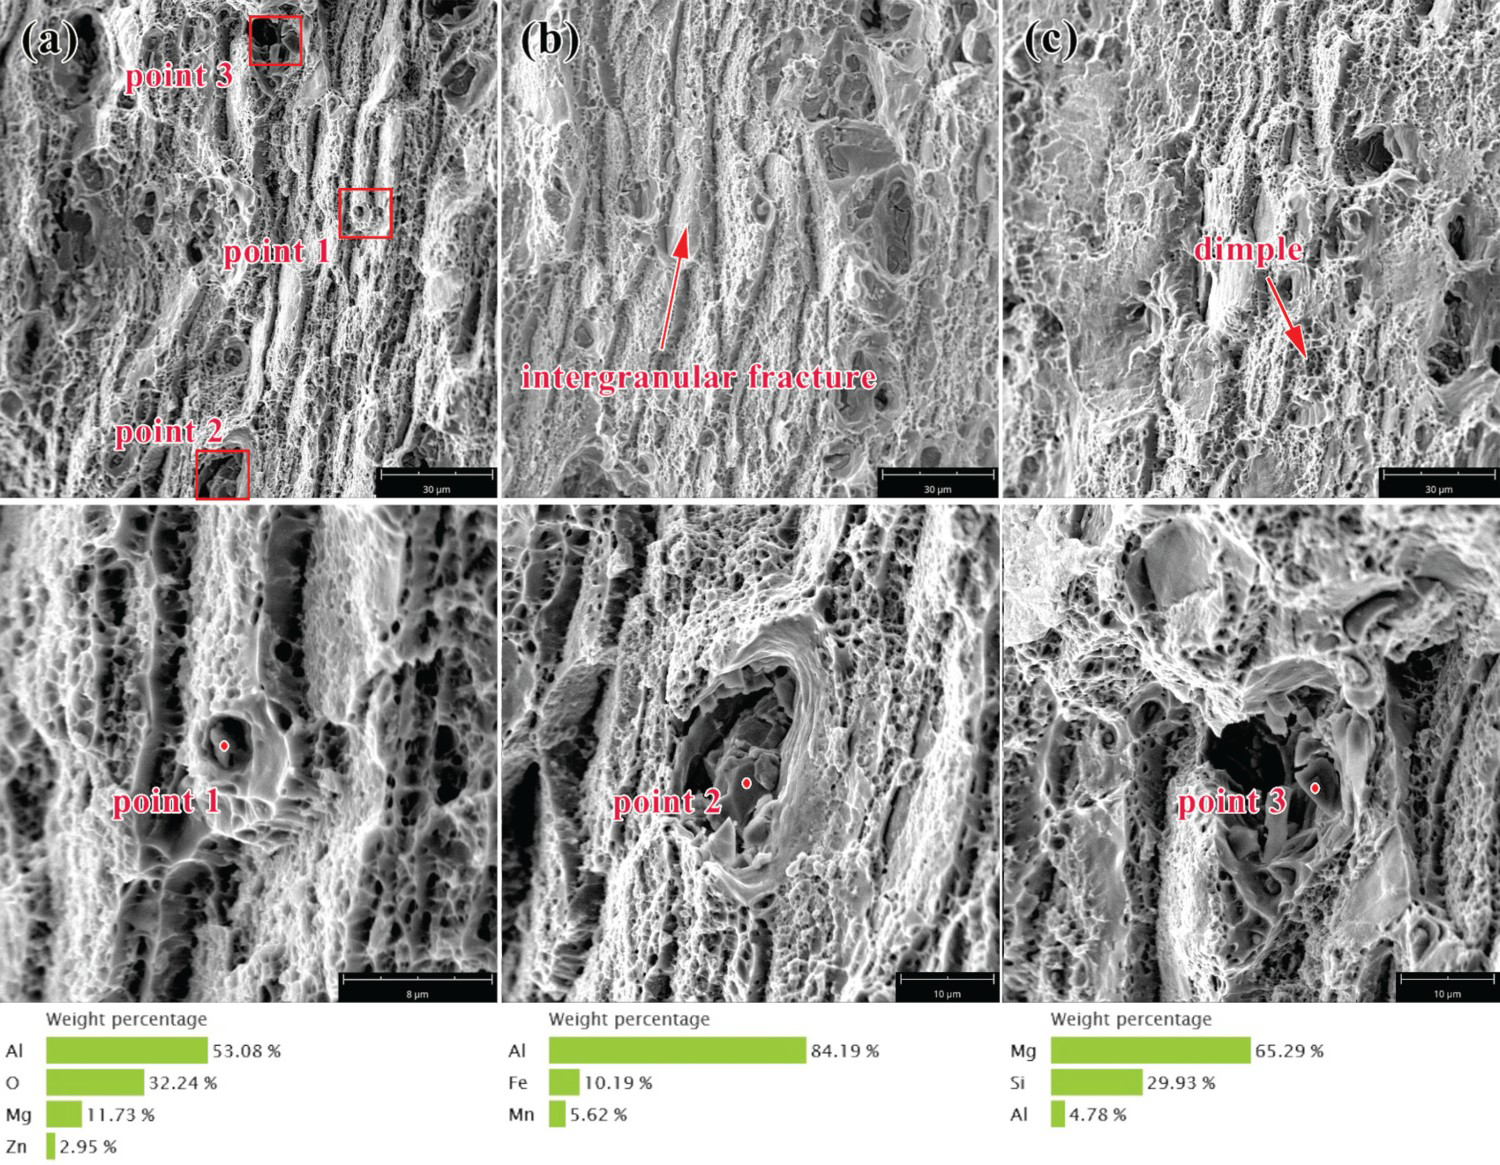
Grain size and distribution
The grain structures of the T6-treated Al–Mg–Zn alloys with different Mg contents are shown in Figure 4. The results show that although the specimens were solid solution treated at 495°C for a rather long time, apart from the equiaxed grains, a few elongated grains remained in the microstructures. This results from the inhomogeneous deformation during hot rolling. In addition, based on the EBSD data, the calculated average spaces between the boundaries of the T6 sheets from alloys 0, 1, 2, 3 and 4 are 14.5, 15.5, 16.0, 18.6 and 19.3 µm, respectively, as shown in Figure 4(f). Thus, the grain is refining with the increase in the Mg content. This variation was also observed by Lee et al. [12] in traditional Al–Mg alloys. That indicates that the Al–xMg–3.0Zn alloys still retain certain characteristics of the conventional Al–Mg alloys.
Grain structures of (a) alloy 1, (b) alloy 2, (c) alloy 3, (d) alloy 4, (e) alloy 5 and (f) average grain size distribution of different alloys.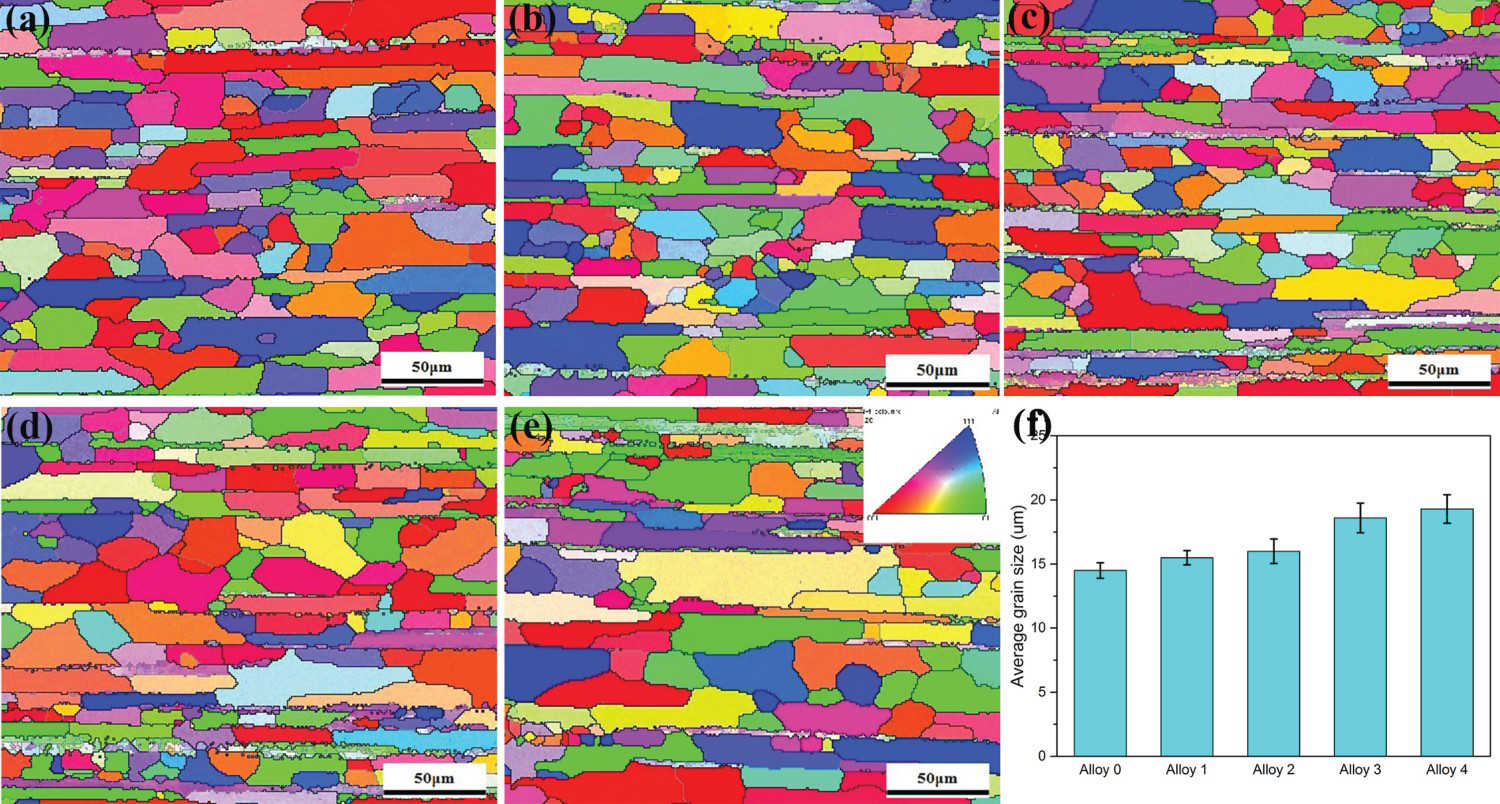
TEM observations of the precipitates
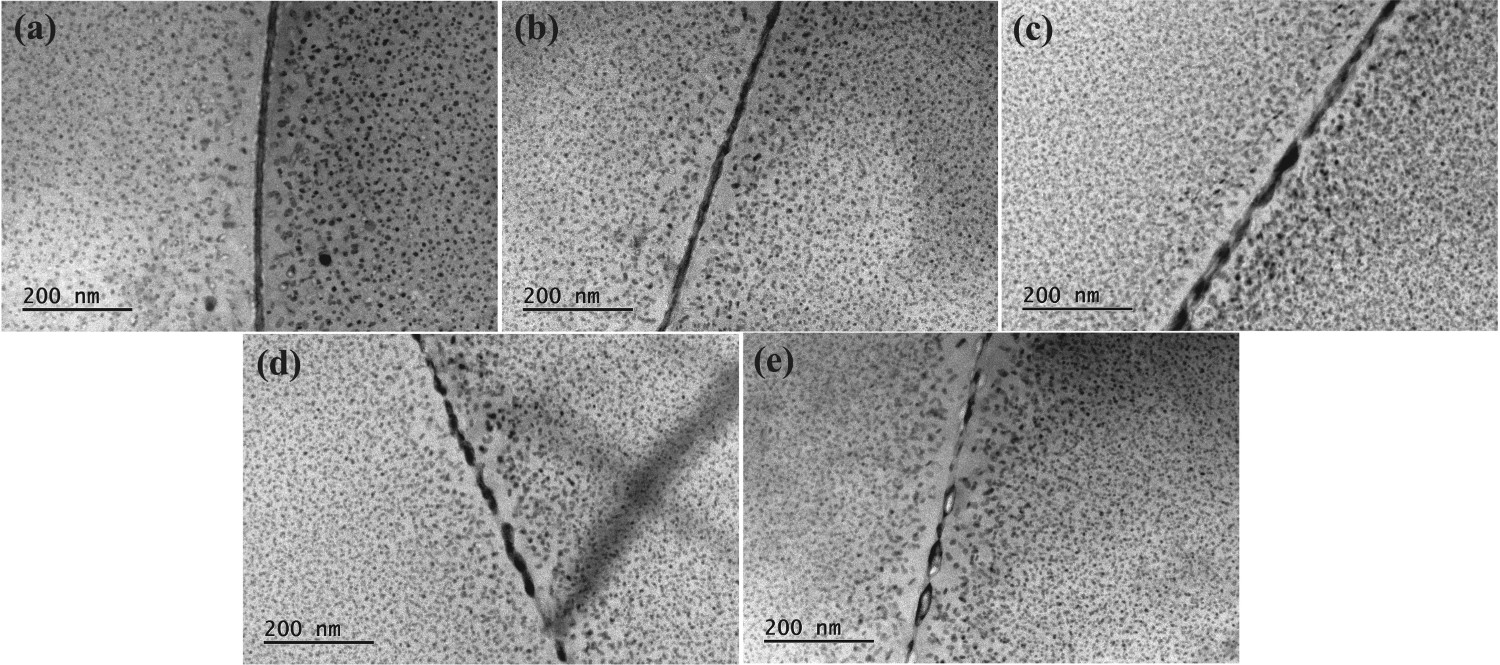
The characteristics of both matrix precipitates and grain boundary precipitates were observed by TEM, and the images are shown in Figures 5 and 6, respectively. The images shown in Figure 5 indicate that the spherically coherent T’ phases are homogeneously dispersed in the microstructures of the Al–Mg–Zn alloys, and only a few differences in the features of the matrix precipitates (shape, size and distribution) can be found among alloys 0–4. Although the characteristics of the matrix precipitates vary little with the decrease in the Mg content in the Al–Mg–Zn alloy, the distributions of grain boundary precipitates are different. As shown in Figure 6, with the reduction of Mg content, the continuity of the grain boundary precipitates decreases.
TEM images of matrix precipitates in different alloys: (a) alloy 0, (b) alloy 1, (c) alloy 2, (d) alloy 3, (e) alloy 4 and (f) HRTEM images after T6 treatment. TEM images of grain boundary precipitates in different alloys: (a) alloy 0, (b) alloy 1, (c) alloy 2, (d) alloy 3 and (e) alloy 4 after T6 treatment.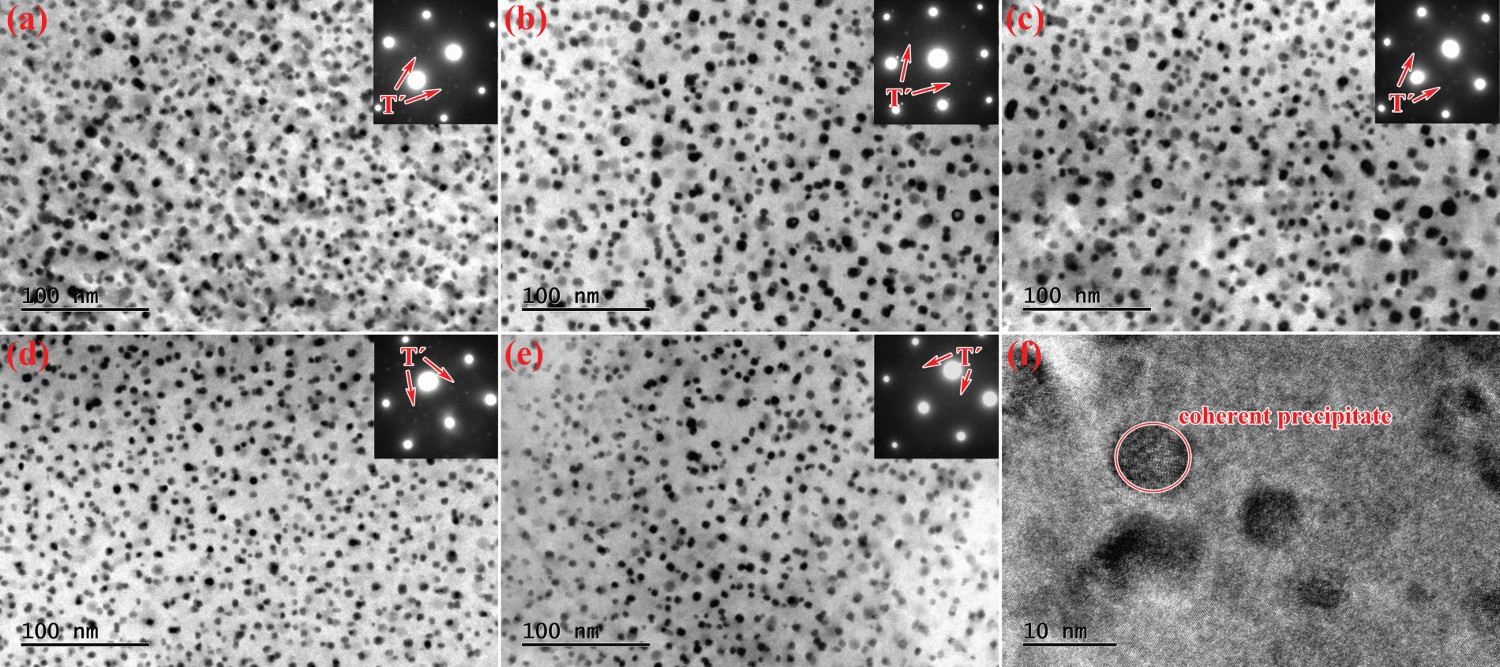
Strengthening mechanisms
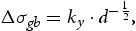
Grain boundary strengthening
The contribution of grain boundary hardening on the yield strength of metal materials can be described by the Hall–Petch equation as
Solid solution strengthening
In Al–Mg alloys, Mg atoms dissolve into the Al matrix and occupy the substitutional sites, which prevents the motion of dislocations. Thus, the strength increases; this increase can be defined as [8]

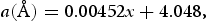
Values of the lattice parameter, the Mg atoms dissolved into the Al matrix and the increase in the calculated yield strength for different alloys.
Precipitation strengthening
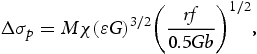
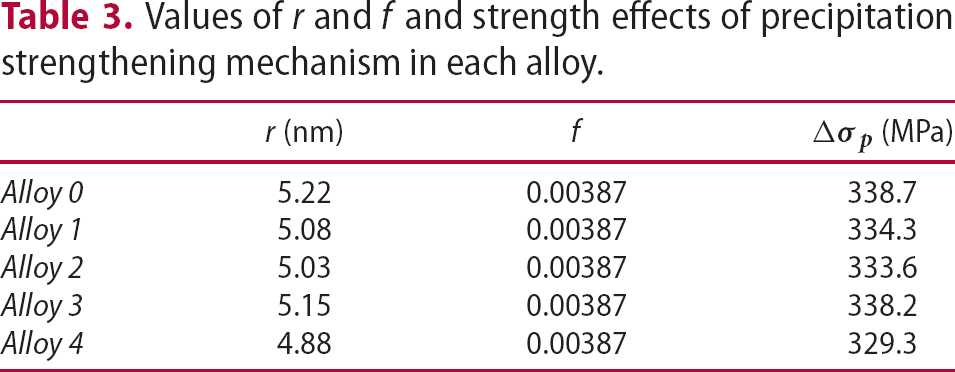
 is the increase in yield strength due to precipitation strengthening, M is the Taylor factor, with a value of 2.6 based on the Hutchinson model [25], χ is a constant varying in the range of 2–3, ε is the misfit parameter given as ∼1.4(Δa/a), Δa is the difference between the precipitates and the matrix and a is the lattice parameter of the matrix given in Table 2. The lattice parameter of the T′ phase is 14.35 Å [17]. The shear modulus G is determined as 26 GPa for Al alloy, r and f are the average size of particles and volume fraction of the T′ phase measured by XRD analysis, b is the Burgers vector and determined as 2.84 Å for aluminium alloy. Using these values, the strengthening effects of precipitation strengthening in different alloys were calculated and summarised in Table 3.
Values of r and f and strength effects of precipitation strengthening mechanism in each alloy.
 (MPa)
(MPa)Discussion
Effect of Mg content on microstructure
For an Al–Mg binary system, the maximum solubility of Mg atoms in α-Al is as high as 17.4%. In the Al–Mg–Zn alloys studied, the Mg content was in the range of 3.5–5.6%, which was far from the maximum value. Thus, the solid solubility of Mg in α-Al distinctly increases with the increase in the Mg content in the composition, which was proven, as shown in Table 2. Then, the grain refining with the increased Mg content can be attributed to two factors: (1) the increased Mg content refined the microstructure of the ingot [26] and (2) during recrystallisation, these solute atoms can pin the grain boundary and inhibit grain growth, form a nucleation core or both mechanisms arise simultaneously. All these mechanisms result in the grain refining in metal materials, and these effects are enhanced for higher solubility atoms. Therefore, in the alloys studied, the grain size increases with the decrease in the Mg content.
The precipitation of precipitates from the saturated solid solution is always affected by the compositions. In an Al–Mg–Zn alloy, the precipitates are T'-Mg32(Al,Zn)49 phases (shown in Figure 5), and the characteristics of the precipitate is mostly affected by the alloying elements Mg and Zn. Bigot et al. [17] measured the atomic ratio of Mg/Zn in the T’ phase using an atom probe tomography technique, and the ratio they obtained was ∼1.4. In the alloys studied, the atomic ratio of Mg/Zn was in the range of 3–5, thus Mg is highly abundant, which is supported by the results shown in Table 2. Therefore, the variation of the Mg content in the alloys studied has only a small effect on the precipitation of the T’ phase. However, as shown in Figures 5 and 6, although the characteristics of the matrix precipitates change only slightly with the variation in the Mg content, the distribution of grain boundary precipitates is different. This results from the increased proportion of low-angle grain boundaries with the decrease in the Mg content [27].
Strengthening mechanism of Al–Mg–Zn alloy
The superposition of different strengthening mechanisms has been studied in several systems [28–30] and the additive equation can be described as
Calculated yield strength and experimental data for different alloys.
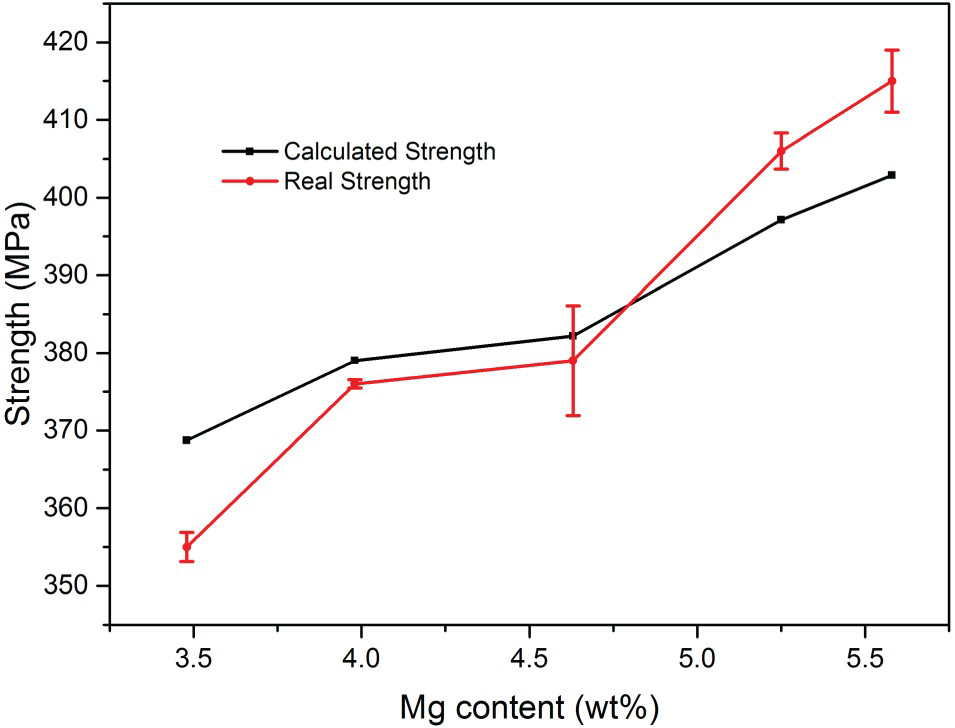
Comparing the contributions of different strengthening mechanisms and the tested yield strength of all alloys studied, the strengthening mechanism of Al–xMg–3Zn alloys becomes pronounced. As shown in Figure 8, the contribution of precipitation strengthening is more than 80% of the yield strength in all alloys. This considerable contribution is due to the characteristics of the T′ phase. As shown in Figure 5(f), the T′ phase is coherent to the Al matrix, but the difference in lattice parameters of the T′ phase and the Al matrix is rather high (more than three times); thus, a large lattice distortion is generated to maintain a coherent relationship between these two phases. This large lattice distortion intensifies the inhibition of the motion of dislocations by the precipitates, and increases the strength. However, although the contribution of precipitation strengthening is rather high, there are only a few differences in Δσp despite the Mg content differs among alloys 0–4, because the characteristics of the T′ phase changes only slightly with the variation in the Mg content. In brief, the yield strength is mostly contributed from the precipitation strengthening, while the decrease in yield strength with the decrease in the Mg content is independent from the precipitation strengthening mechanism.
Graphical representation of the contributions of the different strengthening mechanisms to the yield strength.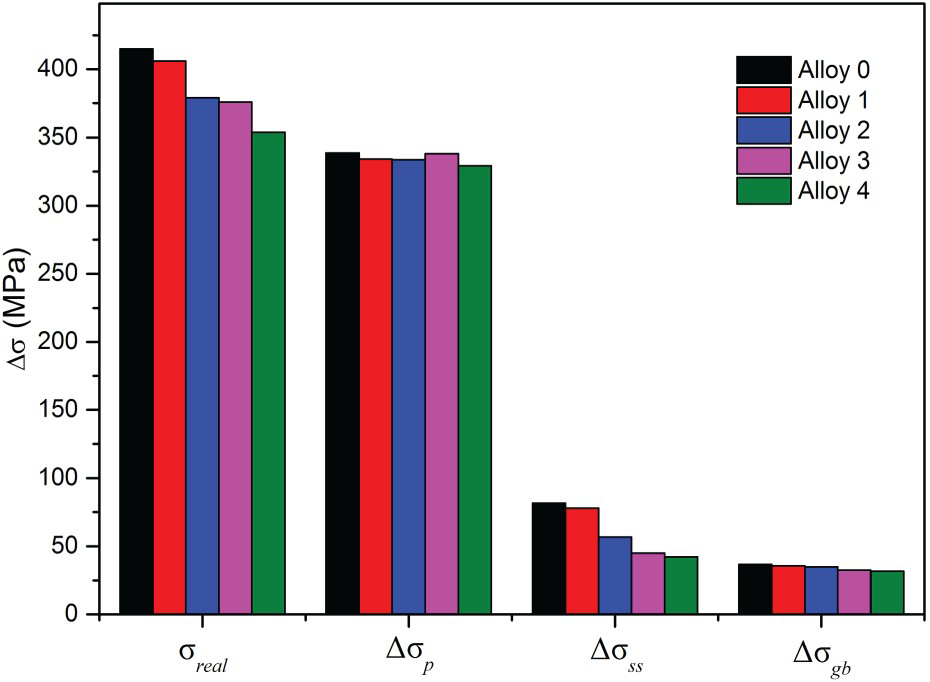
As discussed before, the grain size of Al–Mg–Zn alloys increases with the decrease in the Mg content. According to the Hall–Petch relationship, there is an inverse relationship between the effect of the grain boundary strengthening and the grain size. Thus, the contribution of the grain boundary strengthening decreases with the decrease in the Mg content. However, as shown in Figure 8, the proportion of  in the yield strength is rather low, and the variation in the strengthening effect is unnoticeable as well. Consequently, the limited contribution is result from the grain size is not sufficiently small; however, the value of ky needs to be considered as well. Early research on Al alloys has demonstrated that the contribution of the grain boundary hardening to the yield strength is not significant due to the small value of ky compared with that of ferrous alloys [32]. As the variation in yield strength is neither affected by the precipitation strengthening nor by the grain boundary strengthening, the solid solution strengthening mechanism needs to be considered. The result shown in Figure 8 also indicates that the main contribution to variation in yield strength is by
  . As shown in Table 2, the Mg content is high after the T6 treatment even in alloy 4, and the precipitation of the T′ phase changes only slightly with the variation in the Mg content. Thus, accordingly, the decrease in the Mg content lowered the solubility of the Mg atom in the Al matrix, resulting in the decrease in
  and σreal. Therefore, the following conclusions can be drawn for the strengthening mechanism of the alloy studied: (1) the yield strength mainly arises from the newly introduced precipitation strengthening; the native grain boundary strengthening and solid solution strengthening, which used to be typical strengthening methods for the traditional Al–Mg alloys, become complementally; and (2) the decrease in the Mg content has little effect on the precipitation strengthening and grain boundary strengthening; however, it significantly affects the solid solution strengthening, thereby decreasing the yield strength.
The ductility of Al–Mg–Zn alloy with different Mg contents
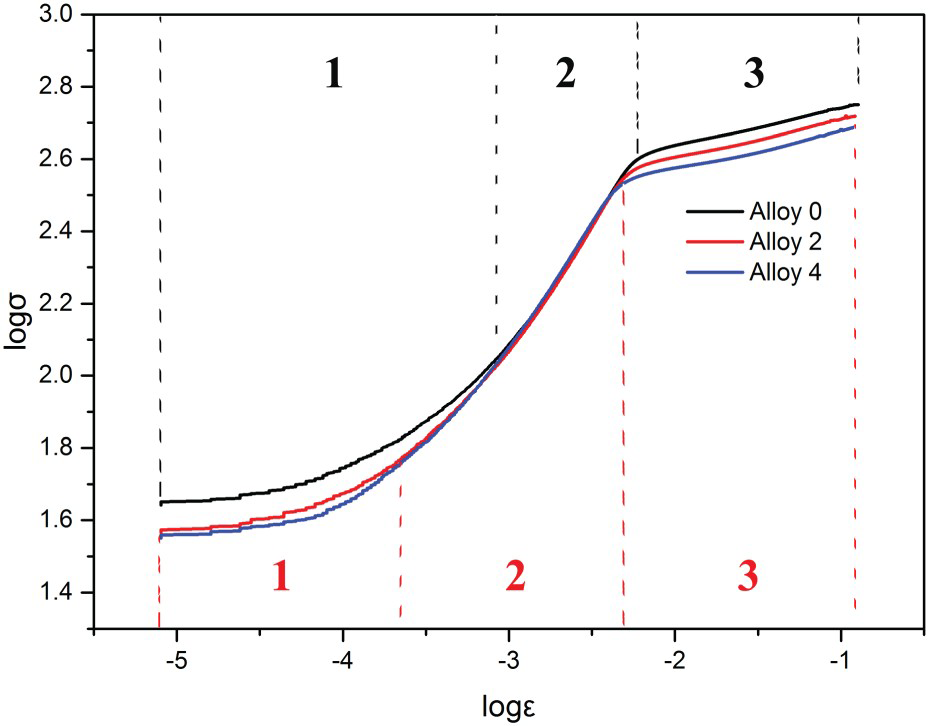
In aluminium alloys, the decrease in the stacking fault energy with the addition of Mg promotes the planar slip, inhibits the cross-slip and changes the strain-hardening rate (n) [33]. Thus, it is difficult to release the strain localisation during tensile tests, and it accelerates the fracture of samples. The value of n depends on the relationship of true stress (σ) and true strain (ε) under uniform deformation as

Figure 9 shows the log Evolution of strain-hardening rate for different alloys during tensile test. –log
–log  curves for different alloys: three stages of alloy 0 are partitioned by black dotted lines and those of alloy 2 and 4 by red dotted lines. As can be seen in Figure 9, the strain-hardening rate gradually increases to a certain high level, maintained at that level, and then suddenly drops to a certain value, where it remains until the fracture. Although the first stage of alloy 0 is longer than those of the others, the value of n is less sensitive to the variation of the Mg content. Thus, the effect of n on the plasticity among different alloys is negligible.
The tensile fracture shown in Figure 3 reveals two kinds of fracture microstructures and three kinds of brittle particles, in which the intergranular fracture and brittle particles deteriorate the ductility of alloys. The EDS test shows that the brittle particles are brittle oxides, with an iron/manganese-rich phase and brittle Mg2Si phase. However, as the chemical compositions of all alloys differ only in the Mg content, as shown in Table 1, it can be assumed that the amounts of iron/manganese-rich and brittle silicon-containing phases are nearly the same under the same treatment. Thus, the variation in the elongation of different alloys is independent of the brittle particles; therefore, the intergranular fracture needs to be considered. As can be seen in Figure 6, the continuity of grain boundary precipitates decreases with decreasing Mg content in Al–Mg–3.0Zn alloy, and this decrease in the grain boundary precipitate continuity enhances the interaction between two grains and then inhibits the intergranular fracture. Therefore, the increase in elongation of the Al–Mg–3.0Zn alloy with the decrease in the Mg content results from the decrease in the grain boundary precipitate continuity, which results in less intergranular fracture during the tensile tests.
Conclusions
In contrast with the inherent grain boundary and solid solution strengthening, the newly introduced precipitation strengthening based on the addition of Zn to traditional Al–Mg alloys works. The precipitation strengthening has the highest contribution to the yield strength, which result from the effective coherency strengthening of the coherency T’ phase. However, owing to the small variation in the characteristics of the matrix T’ phase with the variation in the Mg content, the precipitation strengthening effect has small changes among different alloys. The solid solution strengthening, which is directly related to the Mg content, weakens with the lower Mg content, which is the reason of the decrease in yield strength with the decrease in the Mg content. The brittle particles of oxide, iron/manganese-rich phase and Mg2Si in the microstructure decrease the ductility of alloys. However, the increase in ductility with the decrease in the Mg content results from the decrease in grain boundary precipitate continuity in the alloys, which decreases the intergranular fracture during tensile test.