
Abstract
This paper reports on the experimental investigation of an industrial Al–Mg–Si alloy, which was subjected to different cold rolling reductions and subsequently solution annealed. Based on large-scale electron backscatter detection (EBSD) measurements, it provides an analysis of the area fraction, size and number density of cube grains in the fully recrystallized microstructure. The area fraction and number density of recrystallized cube grains increase continuously with increasing strain, but the cube grain size equals the average grain size independent of prior strain. The recrystallization advantage of cube grains decreases rapidly with increasing misorientation from the ideal cube component. The technological relevance of this misorientation dependence and its possible micro-mechanical origins are discussed.
Introduction
Controlled modification of crystallographic texture throughout the production process can drastically improve the formability and surface quality of Al–Mg–Si sheets. In a recent review Hirsch and Al-Samman [1] highlight the role of so-called texture engineering of aluminium and magnesium alloys as a key to meeting the automotive industry's goals of developing lightweight materials. In the solution-annealed state, the texture of Al–Mg–Si sheets is dominated by the well-known cube component, which is the main concern of texture engineering of Al–Mg–Si sheets. A dominant cube component causes plastic anisotropy [2], which is generally not desirable in sheet forming processes. Moreover, surface appearance after anodisation has been found to correlate significantly with individual crystal orientations such as the cube component [3].
The fundamental behaviour of texture components during cold rolling and solution annealing has been studied extensively by Hirsch et al. [4] or Dons and Nes [5]. Vatne et al. [6] and Bolingbroke et al. [7] investigated recrystallisation after hot deformation of aluminium alloys for commercial purity aluminium, a pure Al–Mn and a pure Al–Mg alloy, respectively. According to the review by Doherty [8] the recrystallized cube is strengthened by increased strain, decreased prior grain size, a higher starting cube texture and, in the case of commercial purity alloys, a higher deformation temperature. More recent studies investigated the effect of second phase particles [9], heat treatment [10] and precipitation kinetics [11]. The microscopic mechanism behind the huge advantage of cube grains during recrystallization is still subject to debate, which is summarised in the textbook by Humphreys et al. [12]. Recent results from in situ or quasi in situ micro-texture measurements of recrystallization by Albou et al. [13] and Sukhopar and Gottstein [14] found cube nuclei at deformed cube bands and in the form of fragments inside differently oriented grains.
The purpose of the present work is to quantitatively investigate the recrystallized cube fraction after solution annealing dependent on prior cold rolling for an industrial Al–Mg–Si alloy. Emphasis is put on quantitatively assessing the dependence of the recrystallization advantage of near-cube orientations on their misorientation from the ideal cube component. To the authors’ knowledge, this aspect of texture evolution in Al–Mg–Si sheets has been largely neglected in the literature. The authors have found only one work on commercial purity aluminium of Samajdar and Doherty [15], and one work on a copper alloy by Necker et al. [16] who make a distinction between orientations lying within different misorientation tolerance angles of the ideal cube component.
Methods
Material and sample production
This study investigates a hot rolled Al–Mg–Si alloy. The alloy contains 0.12 wt-% Fe, 0.55 wt-% Mg and 0.44 wt-% Si. The content of other elements such as Cu, Mn or Cr does not exceed 0.01 wt-%. The production process of the alloy included direct-chill casting followed by homogenisation and hot rolling to a final thickness of 7.5 mm. The microstructure contains micron-sized primary Al–Fe–Si particles as well as a small amount of submicron-sized secondary Mg2Si precipitates. This hot rolled material, also called hot band, is the starting point for the present investigations and all the samples used in this work were cut from the same industrial coil.
A laboratory-scale rolling stand with a roll diameter of 249 mm was used to cold roll the hot band to the final thickness at room temperature with oil-based lubrication. Reductions to a final thickness of 3.4, 2.6, 1.9, 1.5 and 1.1 mm were applied. The von Mises equivalent strains, called rolling strains in the following, amount to 0.79, 1.06, 1.37, 1.61 and 1.92, respectively. The reductions of individual passes were chosen following the results by Mishin et al. [17] to achieve a homogeneous deformation. Friction in the roll gap affects the texture evolution only in a negligible sub surface layer [18]. In agreement with the typical industrial production of Al–Mg–Si sheets in a continuous heat treatment line, the samples were solution annealed at 520°C for 5 min to reach a fully recrystallized state, and then water quenched to room temperature. Annealing was carried out in a salt-bath, to achieve equal heating rates for all samples.
EBSD-analysis
Micro sections of the sample cross-sections were prepared with the section plane normal in parallel with the transverse direction. The micro texture of all the samples was measured by electron backscatter diffraction (EBSD). The EBSD measurements were carried out using a Zeiss Ultra 55 scanning electron microscope (SEM) equipped with a Thorlabs high-resolution CCD camera. The scans were performed on a square grid of 1000 × 1000 points with a step size of 1.0–1.5 µm at an accelerating voltage of 20 kV and a probe current of around 12 nA. Before evaluating the EBSD scans, a clean-up routine of the OIM analysis software was applied to the data sets to eliminate individual points whose orientation could not be determined properly. The routine automatically attributes the orientation of one of the surrounding points to the individual non-indexed point. No further clean-up or smoothing of the raw data was necessary. Three scans were performed on each sample to achieve a minimum total area of 2 mm² containing between 1000 and 1500 grains. For the samples with a thickness of 3.4, 2.6 and 1.9 mm, three positions were chosen across the thickness, namely at the centre, close to the surface and at a quarter of the thickness of the cross-section. For the samples with a thickness of 1.5 and 1.1 mm, the scans covered the total cross-section. Only average values are shown in this paper. Upon request, all EBSD maps will be made available by the corresponding author.
The cube fraction and cube grains contain all points or grains respectively, whose misorientation from the ideal cube is less than a specific tolerance angle of 7.5°, 10°, 15° or 20°. Whenever necessary, the tolerance angle will be explicitly added to the designation, for example, the cube20° fraction contains all points whose misorientation from the ideal cube component is less than 20°. The cube fractions which are analysed in this paper are of course area fractions. Because all samples exhibit homogeneous and equiaxed grains after solution annealing, we believe that the essential conclusions are valid for the corresponding volume fractions as well. A grain reconstruction algorithm was employed from the MTEX software [19]. The parameters of the grain reconstruction algorithm match the requirements of the ASTM standard [20] for determination of average grain size from EBSD scans. A minimum grain misorientation angle of 5° was prescribed. Small grains which contain less than one hundred points were discarded. The equivalent diameter was calculated from the mean grain area and was used as a measure for average grain diameter.
Following [15], two characteristic magnitudes were evaluated from the EBSD scans; the frequency advantage and size advantage of cube grains. The frequency advantage is the measured number density of cube grains divided by the number density of cube grains in a random texture. The size advantage is the ratio of average cube grain diameter to average grain diameter. For the sake of consistency with Samajdar and Doherty [15], the third power of this magnitude is evaluated.
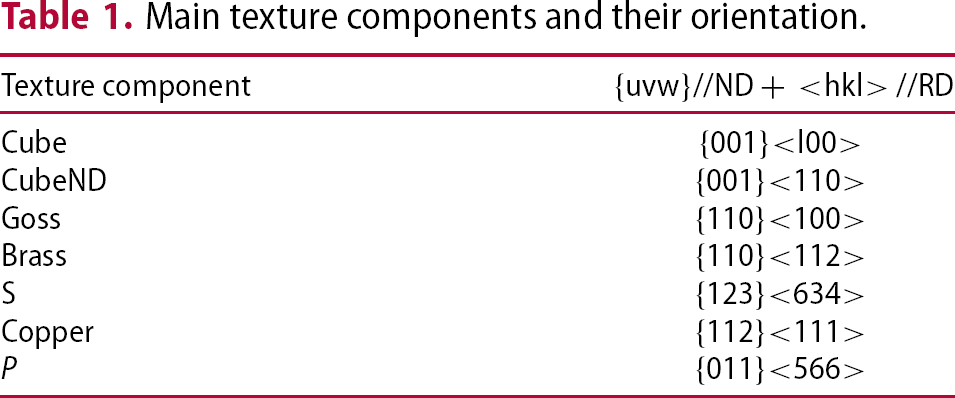
Results
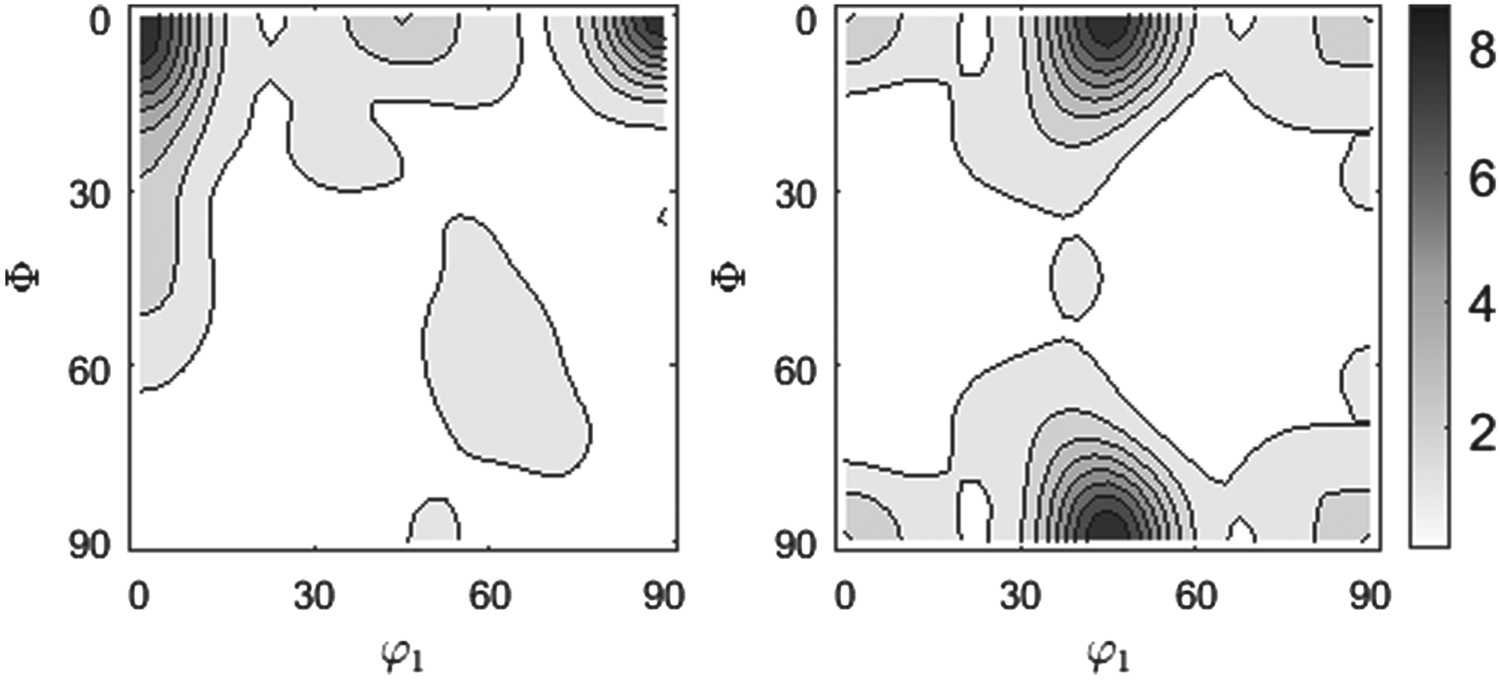
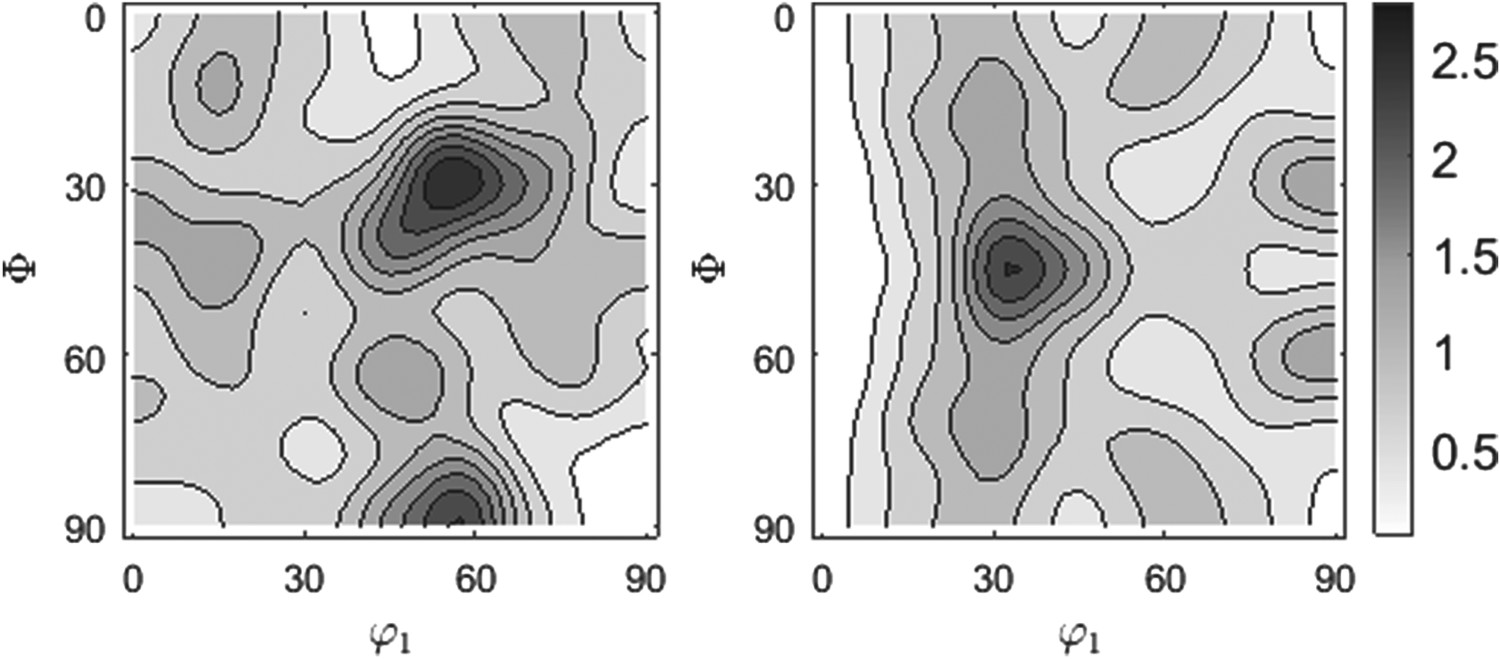
The crystallographic texture of the initial material from the industrial hot rolling process reveals very pronounced preferred orientations. Table 1 shows the most important texture components for Al–Mg–Si sheets. The centre is dominated by a strong cube component with a significant contribution of the Goss component (Figure 1). Outside the centre at a quarter of the thickness, the texture is dominated by the cubeND component (Figure 2). Close to the surface the texture is more balanced. Maximum intensities of the orientation distribution function are found at the Brass orientation and the P orientation (Figure 3). The inhomogeneous distribution of preferred orientations reflects the effect of shear deformation during hot rolling as studied by Choi et al. [21]. The shear deformation destabilises the cube component and promotes the cubeND component instead.
Hot band texture at the centre. Sections of the orientation distribution function at φ2 = 45° (left) and φ2 = 90° (right). The maxima are located at the ideal cube orientation. The Goss orientation is found as well, but to a far smaller extent. Hot band texture at a quarter of the thickness. Sections of the orientation distribution function at φ2 = 45° (left) and φ2 = 90° (right). The maxima are located at the ideal cubeND orientation. Hot band texture near the surface. Sections of the orientation distribution function at φ2 = 45° (left) and φ2 = 90° (right). The Brass orientation and the P orientation show a maximum. Main texture components and their orientation.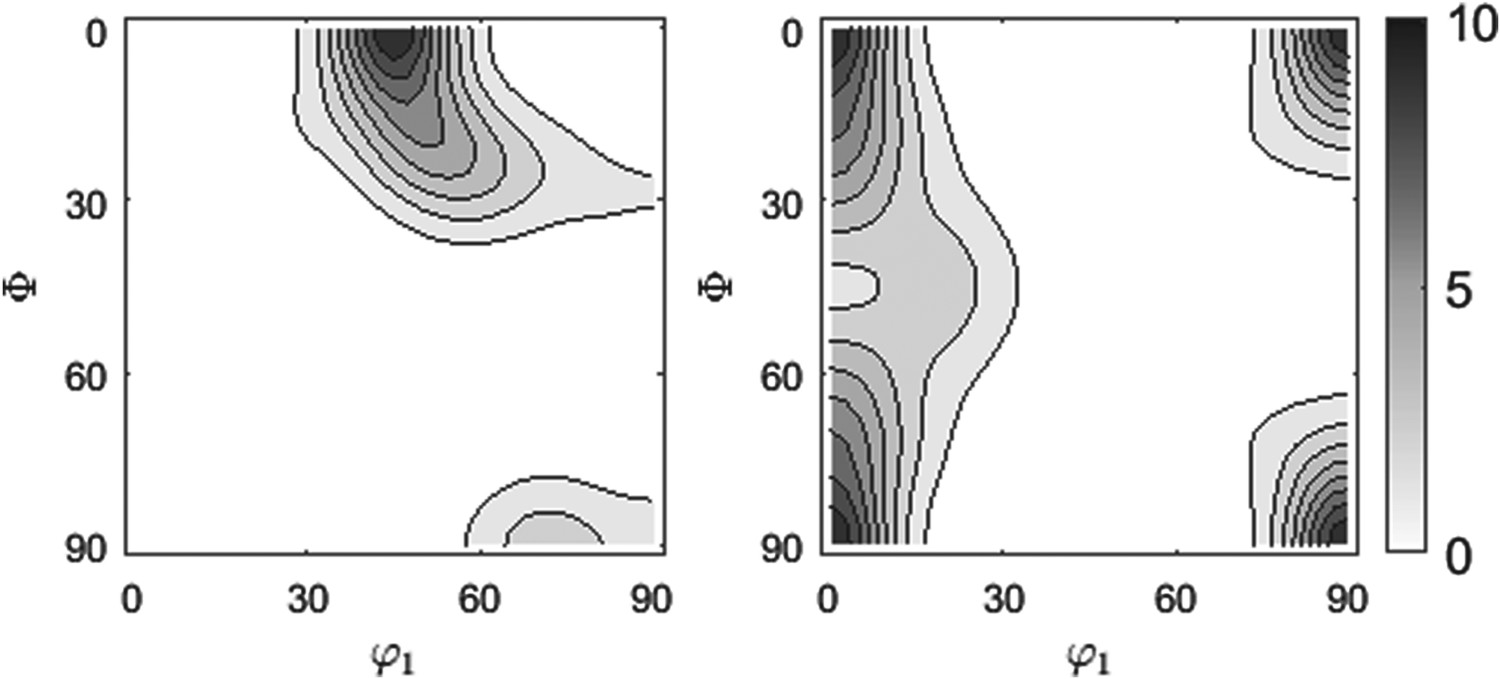
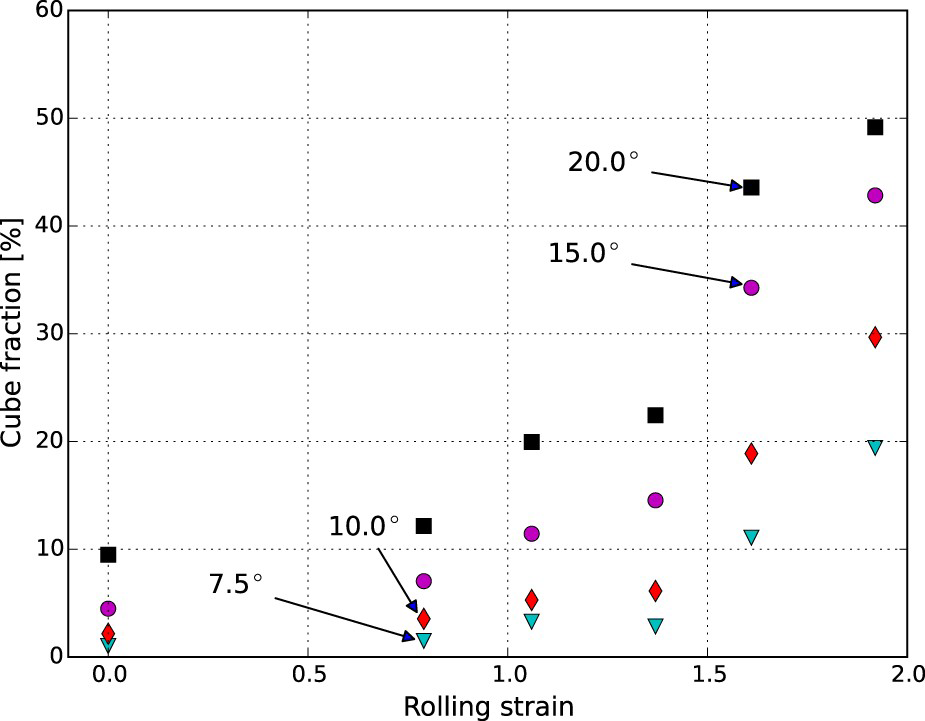
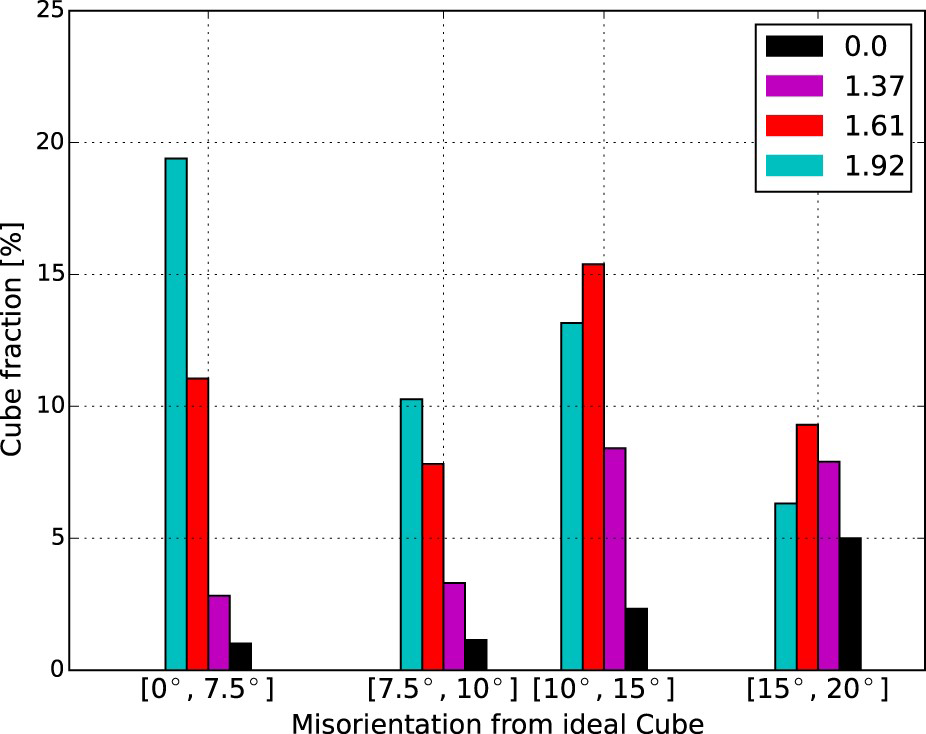
After cold rolling and subsequent annealing the microstructure is fully recrystallized. Figure 4 shows, by way of example, an orientation map of the microstructure at a rolling strain of 1.06 at the sheet centre. The amount of recrystallized cube fraction increases continuously with the applied rolling strain. Figure 5 shows the evolution of the absolute percentage of cube fraction for different misorientation tolerance angles. The fractions of individual misorientation intervals are shown in Figure 6. The cube7.5° grains, which make up just 1% of the initial texture, increase their share to almost 20% at a rolling strain of 1.92. The contribution of grains with a misorientation larger than 15° varies between 5 and 9%. A comparison of the cube component in the initial state and after the highest rolling reduction shows that its profile has changed dramatically. The misorientation profile in the initial state obeys the theoretical Mackenzie distribution [22] in terms of quality. The spread around the ideal cube is rapidly reduced with increased rolling strain.
Orientation map with colour coding according to the ND-inverse pole figure. Fully recrystallized microstructure after cold rolling and subsequent solution annealing. Cube fraction. The recrystallized cube fraction increases continuously with rolling strain at all misorientation tolerance angles. Misorientation profile dependent on rolling strain. The cube component sharpens rapidly at strains above 1.37.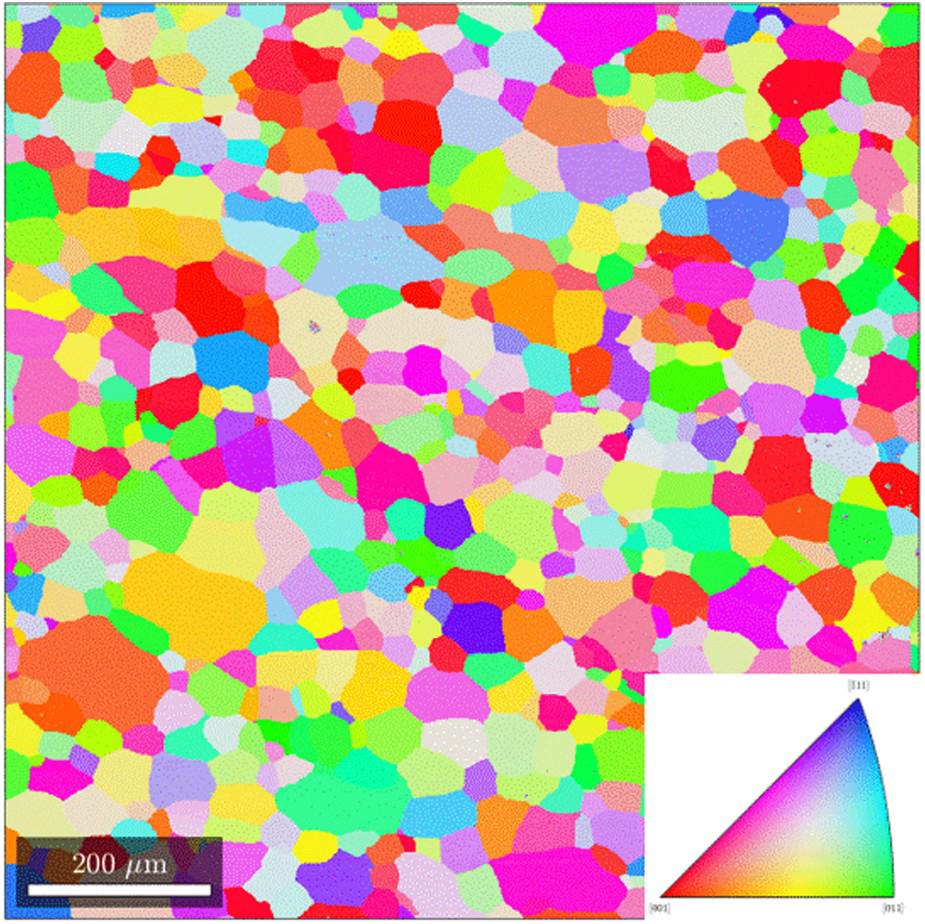
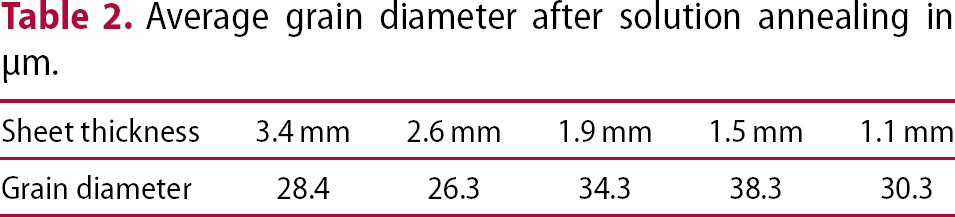
The average grain diameter in the solution annealed samples ranges between 26.3 and 38.3 µm (see Table 2). The size advantage of cube grains is shown in Figure 7. Neither in the initial nor in the rolled and annealed samples was a significant size advantage of cube grains found. The fact that all values of the annealed specimens are close to or higher than unity seems to indicate a small size advantage. It might, however, result from the fact that recrystallized cube grains frequently appear in the direct neighbourhood of a relative misorientation below 5° and are therefore counted as one by the grain reconstruction algorithm. The initial texture contains only a few cube grains and the respective average values should be interpreted with care.
Size advantage. The size advantage does not exceed values of 1.6 at all rolling strains. The experimental values do not indicate any dependence of size advantage on rolling strain. Average grain diameter after solution annealing in µm.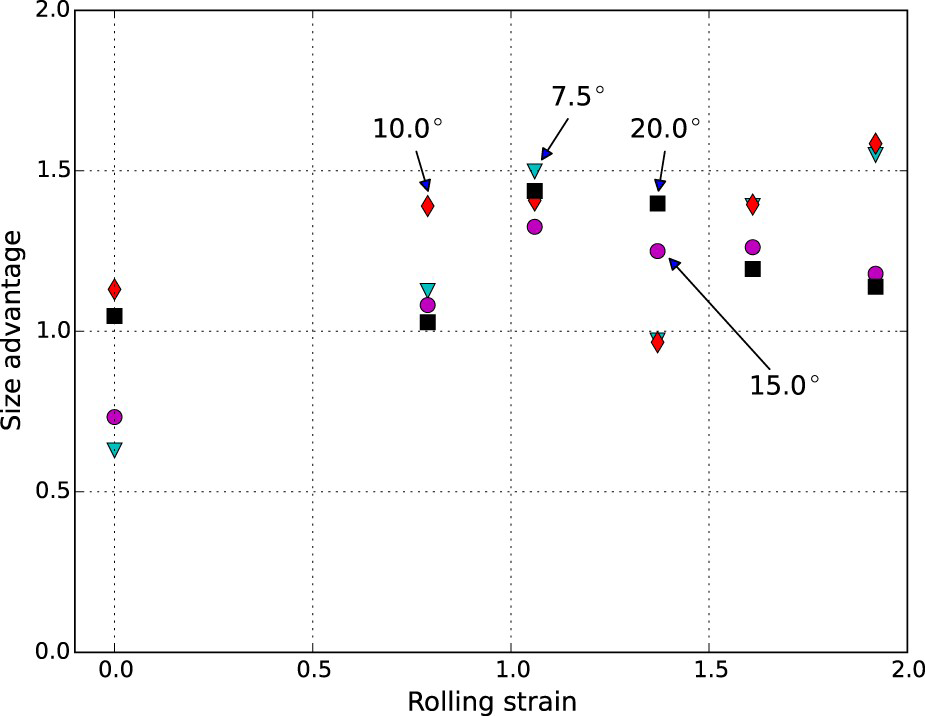
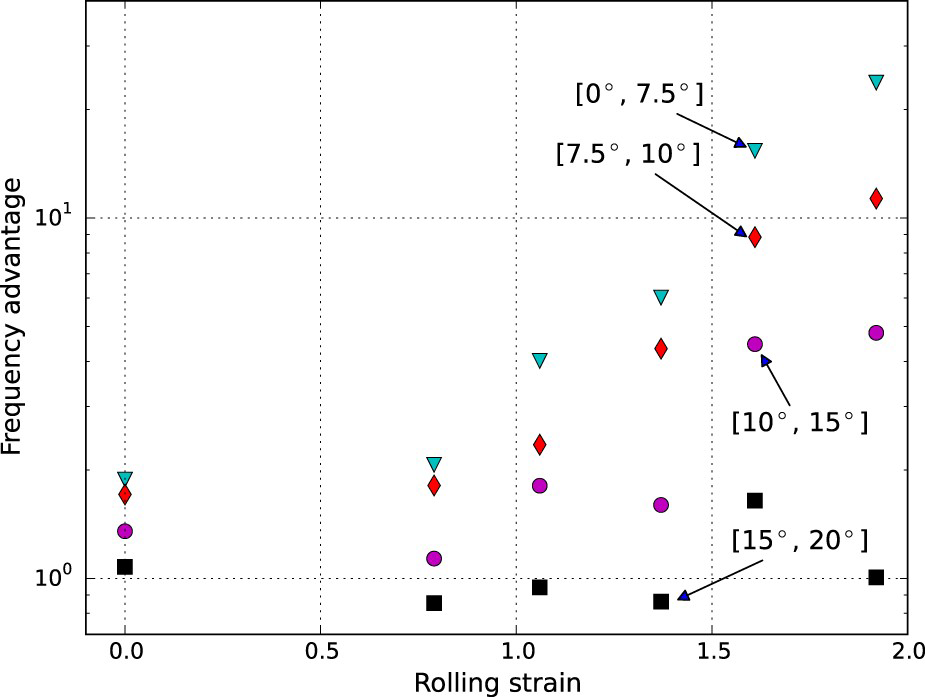
The evolution of the number density of cube grains is analysed in terms of the frequency advantage. Figure 8 shows the evolution of the frequency advantage with increasing rolling strain on a logarithmic scale. Qualitatively the evolution reflects the evolution of the cube fraction. For cube7.5° grains, the frequency advantage increases from 2 in the initial hot band to 24 after a strain of 1.9, whereas for cube20° the frequency advantage rises from 1 to 4, respectively. The relation between frequency advantage and misorientation in Figure 9 is strikingly clear. Cube grains with a misorientation angle larger than 15° do not exhibit any frequency advantage and their relative number density remains constant throughout cold rolling. The frequency advantage increases continuously with decreasing misorientation.
Frequency advantage. The frequency advantage increases continuously with increasing rolling strain. Frequency advantage and misorientation. Almost ideally oriented grains exhibit the maximum frequency advantage.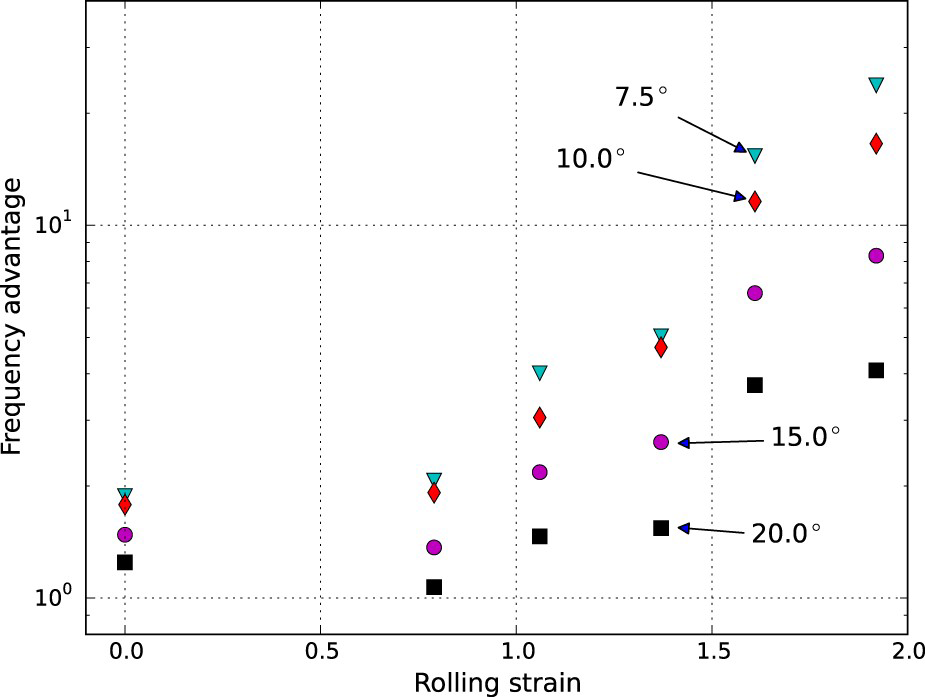
Discussion
Micro-mechanism
According to Samajdar and Doherty [15] the relative values of frequency advantage and size advantage indirectly provide information on the recrystallization mechanism. The high frequency advantage found in this paper strongly favours the hypothesis of oriented nucleation over oriented growth. Oriented nucleation means that orientation selection, i.e. the advantage of the cube component, already occurs during the nucleation stage of the recrystallization process. In contrast, the oriented growth concept suggests that cube grains benefit from highly mobile grain boundaries during the growth stage of recrystallization. The mechanism of oriented growth leads to a size advantage of recrystallized cube grains and the fact that no such size advantage was found discourages the idea of a significant contribution on the part of oriented growth. Conclusions on the micro-mechanism from the two quantities should be made with care however. Humphreys et al. [12, p. 454] state that the origin of the cube preference is found on a micrometre scale where ‘a distinction between “nucleation” and “the early stages of growth” is meaningless’.
Reliable conclusions on the nucleation mechanism are beyond the limited scope of the present study. It should be noted, however, that the misorientation dependence which was analysed here cannot be explained in terms of a simple cube-banding mechanism alone. The simple cube-banding mechanism, described by Doherty et al. [23] and Lee et al. [24], assumes that initial cube grains are deformed to band-like fragments, retaining their original cube orientation. On average, one or two new cube grains then nucleate from every band. Since this cube-band mechanism is not dependent on misorientation from ideal cube, it is unable to capture the declining spread around the ideal cube component, which was found in the present study. In contrast to the cube-band mechanism, the classical transition band mechanism originally proposed by Dillamore and Katoh [25] and further investigated by Akef and Driver [26] inherently contains a misorientation dependence. It suggests that some crystals approach the ideal cube orientation by rotation around the normal direction and subsequently diverge by rotation around the rolling direction. Small regions or islands of the crystal are stabilised near the ideal cube component and constitute a so-called transition band. Since the stability of transition bands decreases rapidly with increasing misorientation from the ideal cube orientation, only highly aligned islands survive during the deformation process. Therefore, the transition band mechanism provides a good explanation for the dramatic increase in almost ideally oriented cube grains.
Technological aspects
From a technological point of view, the results of this study emphasise the importance of cold rolling reduction for the optimisation of cube fraction in the final sheet product. Three aspects are explicitly addressed here. First, a general rule about the optimal rolling reduction does not exist. The study by Hu et al. [2] suggests that a certain amount of cube is beneficial for sheet drawability because it balances the retained rolling texture. The same study numerically predicts a strong relationship between the spread around the ideal cube component and the yield locus. The effect of the spread around the ideal cube component on sheet formability was numerically investigated by Yoshida et al. [27]. Interestingly, their calculations predict a severe decline in the forming limit curve for decreasing values of the spread around cube. Second, cold rolling reduction not only controls the recrystallized cube fraction but also affects the arrangement of recrystallized cube grains. Investigations by Jin [28] and Bennett et al. [29] of an automotive Al–Mg–Si alloy show that high rolling strains lead to a columnar arrangement of recrystallized cube grains, which cause unwanted roping behaviour on the sheet surface during the subsequent deep-drawing process. The spread around the ideal cube component very probably affects roping behaviour although a quantitative assessment of this effect does not exist. As a third aspect, it should be noted that, at very large rolling reductions, the recrystallization advantage of the cube component is reduced because initial cube grains are increasingly fragmented and re-oriented during cold rolling. Therefore, from a certain strain onwards, a decreasing number of potential cube nucleation sites exists in the cold rolled microstructure. Preliminary results for the present material suggest that the continuous increase of recrystallized cube breaks down at strains above 2.2.
Conclusions
The investigations in the present paper lead to the following conclusions:
A continuous increase in cube fraction proportional to the rolling strain was found up to strains of 1.92. The recrystallization advantage of cube grains depends heavily on their misorientation from the ideal cube orientation. Higher misorientation means less recrystallization advantage. Cube grains with misorientations above 15° neither increase their fraction nor their number density significantly. The dominance of recrystallized cube is attributed to a significant frequency advantage. The diameter of the recrystallized cube grains is only slightly larger than the average grain diameter and, compared with the frequency advantage, the size advantage of cube grains is negligible. The frequency advantage and misorientation dependence support the hypothesis of a dominant effect of orientation selection during the nucleation phase of recrystallization. A combination of both cube band formation and transition band formation is suggested as the underlying mechanism.
To improve our understanding of the origins of cube advantage, future investigations should focus on the details of cube band formation and the transition band mechanism. An extension of the studies on grain sub-division dependent on grain orientation made by Delannay et al. [30] and Raabe et al. [31] to industrial Al–Mg–Si alloys would be desirable. The authors believe that the above conclusions can be transferred to other aluminium alloys, if their content of second phase particles is low. As shown in the review by Huang et al. [32], second phase particles affect the texture evolution in a complex manner and can either reduce or strengthen the recrystalised cube fraction.
Footnotes
Disclosure statement
No potential conflict of interest was reported by the authors.