
Abstract
Grain boundary migration in different casting processes directly affects the grain size of the ingot, which affects the mechanical properties of the alloy. In this study, Cu–Cr–Zr–Ti rods are manufactured using upward continuous casting and casting-extrusion processes followed by drawing. It is found that the strength of the upward continuous casting rods is 621 MPa, greater than that of the casting-extrusion rods 571 MPa, which is a result of different microstructure evolution during solution treatment. Calculations of the driving force and resistance of grain boundary migration were performed to explain the observations.
Keywords
Introduction
Copper alloys are widely used in aerospace, lead frames, electric railway catenary wire, and other fields, owing to their high electrical and thermal conductivities, corrosion resistance, and high strength [1–4]. There has been rapid development of high-speed railway technology in China in recent years, currently, the high-performance contact lines primarily include Cu–Cr [5,6], Cu–Zr [7,8], and Cu–Cr–Zr [9,10] series alloys.
The continuous casting and rolling process is one of the most important manufacturing methods for Cu-based alloy rods. However, it is difficult to achieve large-scale production using continuous casting and rolling, and the capital investment required for the equipment is very large [11,12]. The horizontal continuous casting and drawing method is the most widely used method for Cu-based alloy rod manufacturing and its simple production process has the potential to produce various products. In addition, the semi-finished products made by horizontal continuous casting have better surface qualities, including smaller defects and cracks. Nevertheless, segregation of chemical composition often occurs in the alloy products during the horizontal continuous casting process, which leads to the deterioration of the mechanical properties [13–16]. The casting, extrusion, and drawing process is a traditional manufacturing method for Cu-based alloy rod production and it can produce Cu-based alloy rods with an equiaxed structure. However, the method has been gradually phased out of industrial-scale production of Cu-based alloy rods owing to its high energy consumption and low efficiency [17]. Continuous extrusion forming (CONFORM) is more efficient for continuous production than the casting, extrusion and drawing method. This process introduces high pressures and temperatures in the feedstock by repetitively feeding the metal through an extrusion die. The high level of plastic deformation during continuous extrusion forming results in the formation of fine equiaxed grains in the rods [18,19]. In practice, the upward continuous casting and drawing method is used for the mass production of Cu-based alloy rods, owing to its high production and energy efficiency. The process can prevent casting defects and reduce the extent of impurities, resulting in products that exhibit good mechanical properties. In addition, upward continuous casting provides a higher rate of cooling, which results in the formation of fine columnar grains arranged along the upwards casting direction. High-strength rods can be achieved after subsequent thermomechanical treatment [20–23].
Cu–Cr–Zr–Ti alloys have become a focus of current research owing to their comprehensive range of properties that stand out among high-performance copper alloys. The precipitation strengthening mechanism of Cu–Cr–Zr–Ti alloy was studied in our previous work [24]. In this work, Cu–Cr–Zr–Ti rods were manufactured using two different methods, and the strengthening behaviour and corresponding mechanism were studied.
Experimental
Pure copper (99.5 wt-%), pure titanium (99.9 wt-%), Cu–40 wt-% Zr alloy, and Cu–8 wt-% Cr alloy were used as raw materials. A medium frequency induction furnace (DS-7-003, Wuxi Doushan electric furnace) was used to smelt the alloy in air, sufficient dehydrated charcoal was added and the furnace was heated to 1150–1300°C. Cu–Cr–Zr–Ti alloy was prepared using two processes: (1) Ø = 13 mm alloy rods were prepared by upward continuous casting (UC); or (2) Alloys were cast as extruded ingots of Ø = 100 mm, and hot extrusion deformed (to Ø = 13 mm) after homogeneous treatment at 950°C for 60 min (HE). Both the casting/extruded alloy preparations were then subjected to cold drawing (to Ø = 7 mm), solution treatment (950°C for 60 min + water quenching), cold drawing (to Ø = 4.45 mm), and aging treatment (450°C/10, 20, 30, 60, 120, 180, and 240 min), and the alloy rod with optimum aging time was selected for multi-pass cold drawing up to Ø = 3 mm.
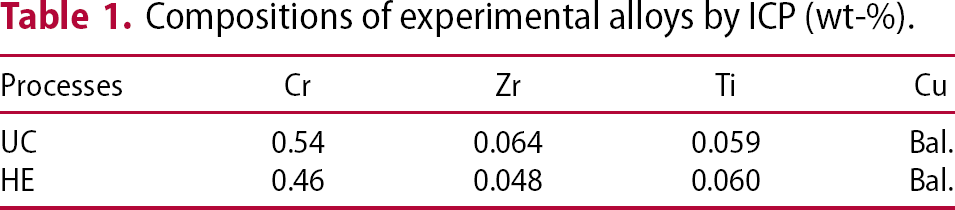
Compositions of experimental alloys by ICP (wt-%).
Results
Figure 1(a) shows the tensile strength of alloys processed using the two different methods. It can be seen that tensile strength of the HE processed alloy is slightly higher before the cold drawing deformation. After the first draw (Ø = 7 mm), the strength of the two alloys shows clear improvement. The UC processed alloy shows a larger increase in tensile strength, reaching 494 MPa, which is significantly higher than that of the HE processed alloy (402 MPa). After solution treatment (950°C/60 min + water quenching), the tensile strength of the two alloys decreased significantly, with the UC and HE processed alloys reduced to 253 and 227 MPa, respectively. After the second draw (Ø = 4.45 mm), the tensile strength of the UC and HE alloys increased to 385 and 366 MPa, respectively.
(a) Tensile strength of the samples after the following processes: as-cast (UC)/hot extruded (HE) (Ø = 13 mm), first draw (Ø = 7 mm), solution treatment (Ø = 7 mm), second draw (Ø = 4.45 mm); (b) tensile strength of the samples with aging and the third draw (Ø = 3 mm). The red line and black line represent the hot extrusion process and upward continuous casting process, respectively.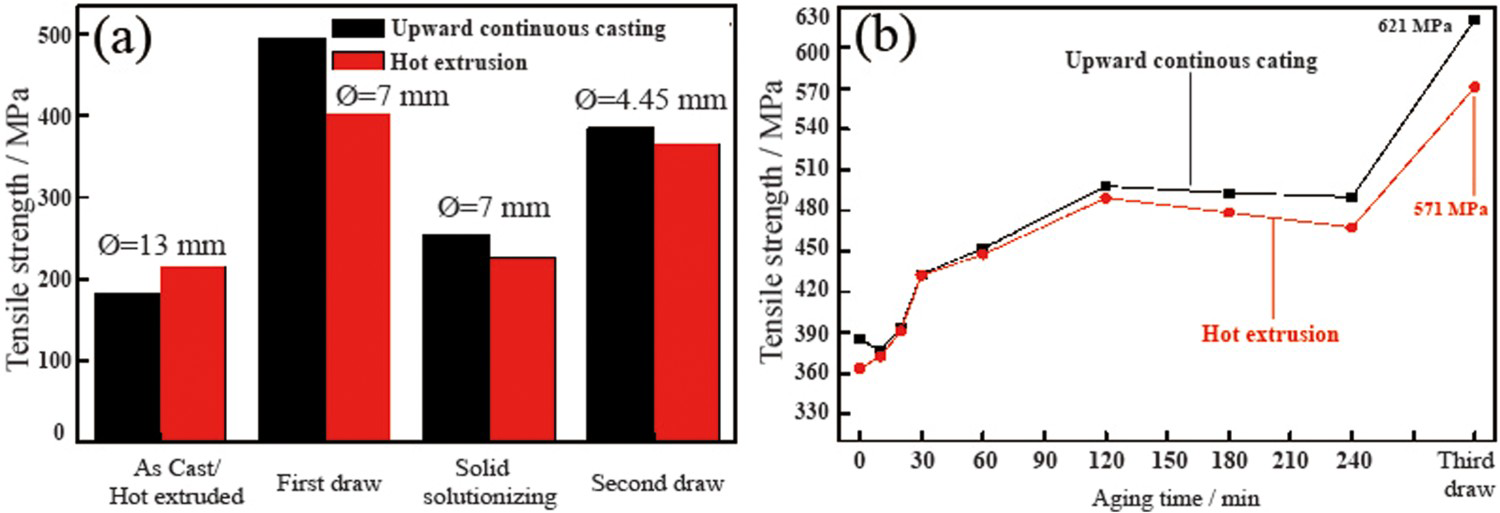
The tensile strength curve of the alloys as a function of aging at 450°C after the second draw and the third draw is shown in Figure 1(b). It can be seen that the strength of the HE process alloy increased rapidly at the beginning of aging, and the strength of the UC process alloy decreased slightly at 450°C/10 min. The two alloys reached peak aging at 120 min, at which point the tensile strengths of the UC and HE samples were 499 and 488 MPa, respectively, and the elongation was approximately equal, ∼15%. With further increases in aging time the tensile strength of the two alloys gradually decreased. The results show that the suitable aging time for alloys made using both processes is 120 min. After 450°C/120 min aging, the alloy rod was drawn again (from Ø = 4.45 mm to Ø = 3 mm), and the strength properties of both alloys improved. The tensile strengths of the UC and HE alloys were 621 and 571 MPa, respectively, and the elongation was ∼5%. The properties of the alloys following different process treatments show that the strength of the UC alloy after the final thermomechanical treatment is higher than that of the HE process alloy.
Figure 2(a,b) shows the microstructures of the as-cast cross-section and longitudinal section of the UC process alloy, respectively; Figure 2(c,d) shows the microstructures of the extrusion cross-section and the longitudinal section of the HE process alloy, respectively. It can be seen from Figure 2(a,b) that the as-cast grains of the UC process alloy are coarse and have clear dendrite segregation, and the crystal orientation of the alloy proceeds along the temperature drop gradient. Figure 2(c,d) shows that after hot extrusion, the as-cast grains of the HE process alloy are crushed into fine equiaxed grains, and the grain size is smaller than for the UC alloy, approximately 20–40 µm.
OM images of alloy microstructure following various treatment processes: (a) as-cast cross-section OM image of the UC process alloy; (b) as-cast longitudinal section OM image of the UC process alloy; (c) hot extrusion cross-section OM image of the HE process alloy; (d) hot extrusion longitudinal section OM image of the HE process alloy.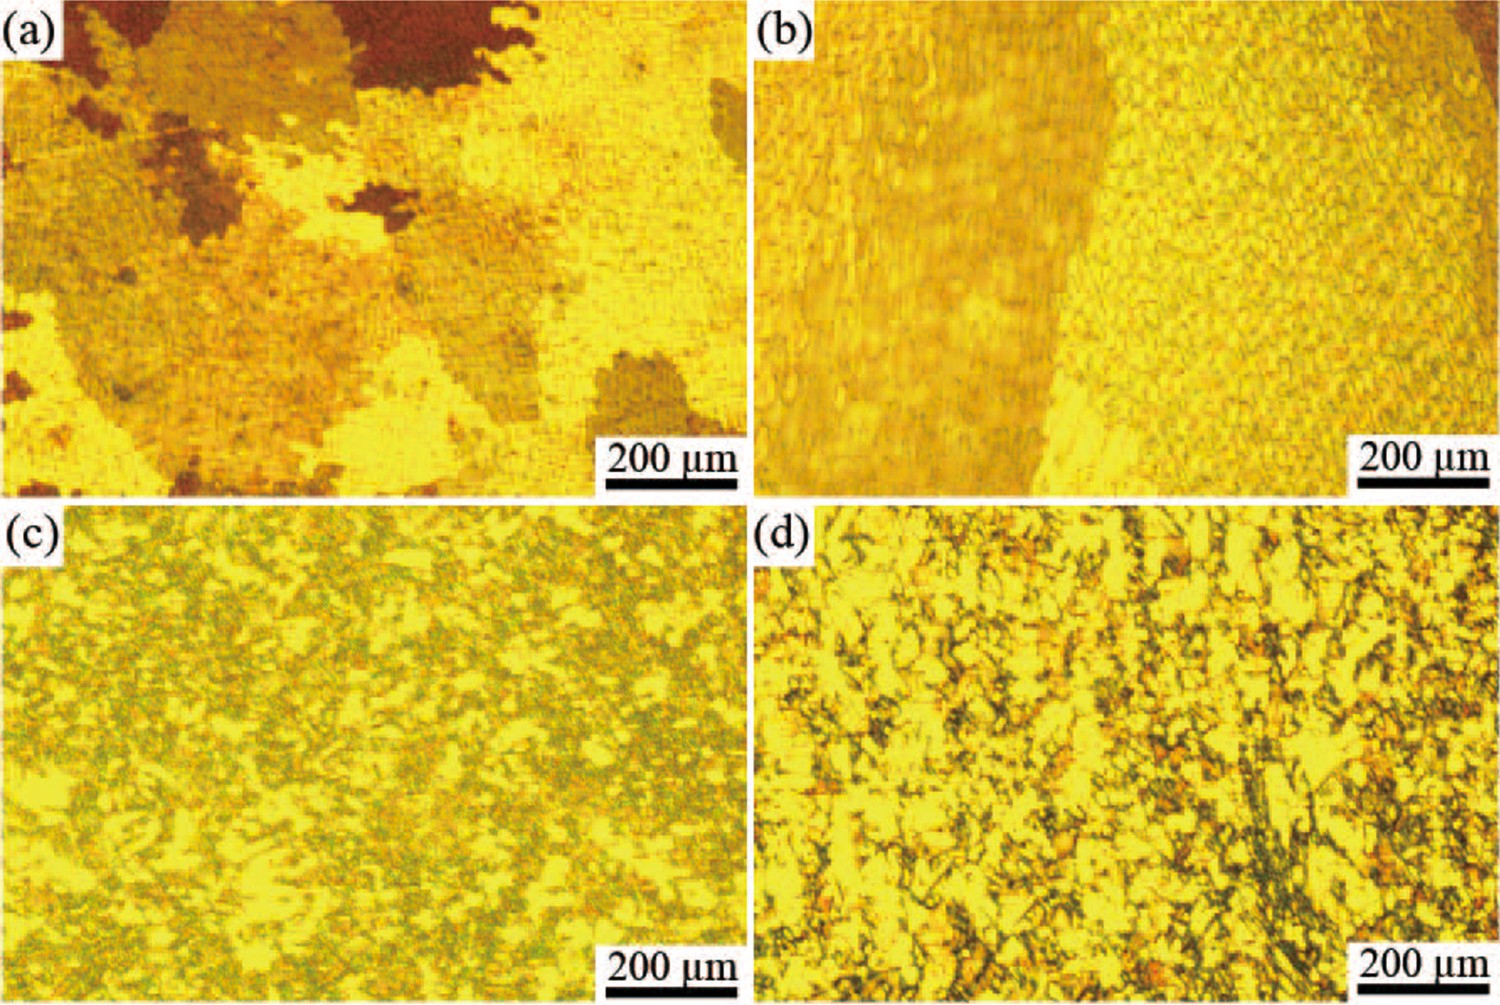
Figure 3(a,c,e) shows longitudinal OM images of the UC process alloy after the first draw, solution treatment (950°C/60 min), and second draw respectively; Figure 3(b,d,f) shows longitudinal OM images of the HE process alloy after the first draw, solution treatment (950°C/60 min), and second draw, respectively. From Figure 3(a,b), it can be seen that grains of the UC process alloy are elongated, similar fibrous structure. After the cold drawing deformation, the grains of the HE process alloy are elongated with a width of approximately 10–20 µm. After the solution treatment at 950°C/60 min, the UC alloy is essentially fully recrystallized, showing a fine and uniform recrystallized structure. The interior of the HE process alloy is essentially secondary recrystallized grains with a size of 400 µm or more. A large number of twins are formed, and the recrystallized grain growth is clear. The grain widths of the UC and HE process alloys are approximately 10 and 20–50 µm, respectively.
OM images of alloy microstructure following various treatment processes: longitudinal OM images of the UC process alloy following (a) first draw, (c) solution treatment (950°C/60 min), and (e) second draw; longitudinal OM images of the HE process alloy following (b) first draw, (d) solution treatment (950°C/60 min), and (f) second draw.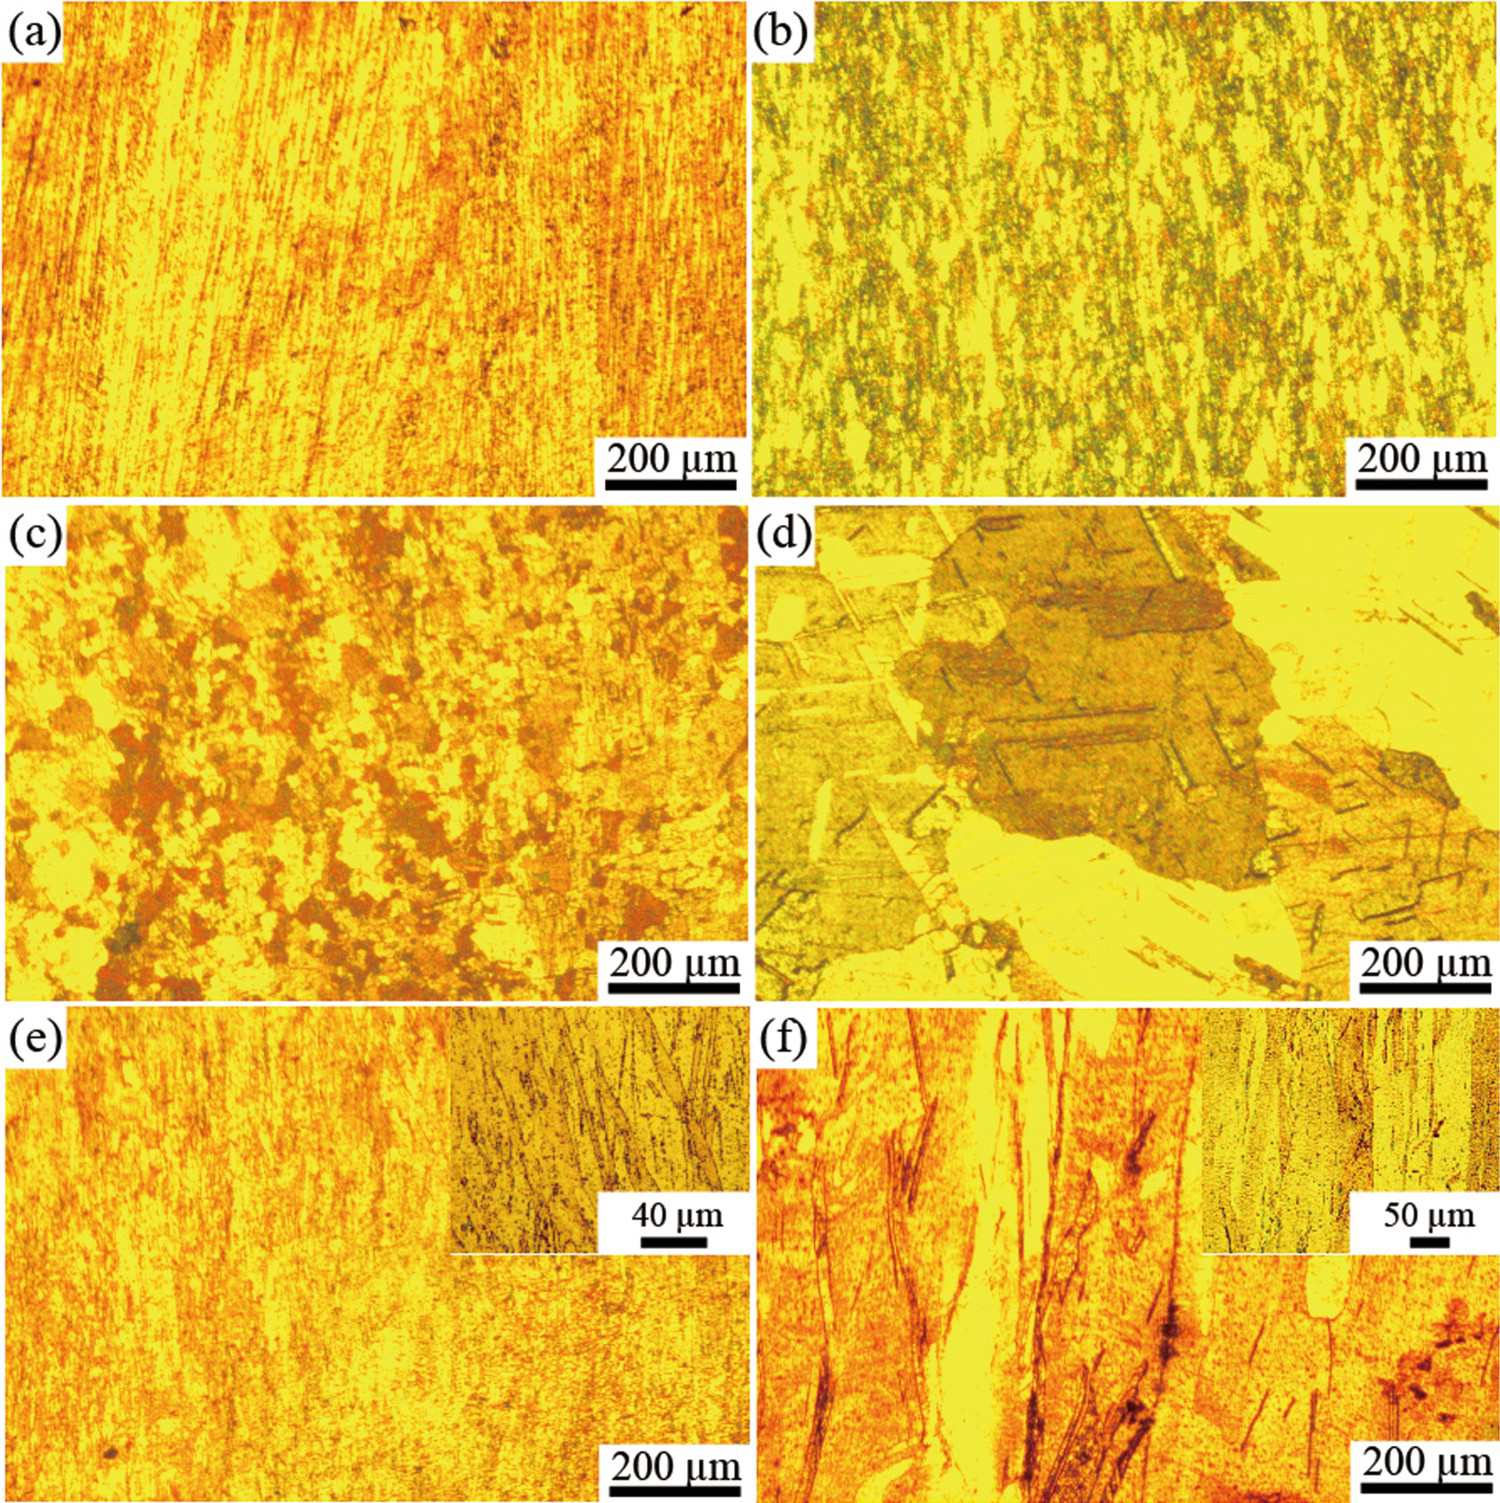
Figure 3 shows that the recrystallization grain size of the HE process alloy after solution treatment is very large, which has a negative effect on the properties of the alloy after cold drawing. To explore the growth rule of the recrystallization grains of the two alloys during solution treatment, we observed and analysed alloys subjected to solution treatment for different periods of time. Figure 4(a,c,e) shows the longitudinal section OM images of the alloy prepared by the UC process after 10, 20, and 40 min solution treatments at 950°C after the first draw, respectively. Figure 4(b,d,f) shows longitudinal section OM images of the HE process alloy following solution treatments at 950°C for 10, 20, and 40 min after the first draw, respectively. Figure 4 shows that after 950°C/10 min solution treatment of the UC alloy, the core of new distortion-free grains is first produced in the region with a large degree of distortion, and some recrystallized grains are formed as solution time is increased. The degree of recrystallization of the alloy further increased after solution treatment at 950°C/40 min, at which point the recrystallization of the alloy was almost complete, and the recrystallization structure was fine and uniform. After solution treatment at 950°C/10 min the HE process alloy showed some fine recrystallized grains, coarse grains with a size of 100 µm or more, and some coarse grains containing twins. As the solution time was extended, the recrystallized grains of the alloy continued to grow. After solution treatment at 950°C/40 min, the interior of the alloy was essentially secondary recrystallized grains with an average size of ∼400 µm and a large number of twins were observed.
OM images of alloy microstructure following various solution treatments: longitudinal OM images after the first draw of the UC process alloy after (a) solution treatment (950°C/10 min), (c) solution treatment (950°C/20 min), and (e) solution treatment (950°C/40 min); longitudinal OM images after the first draw of the HE process alloy after (b) solution treatment (950°C/10 min), (d) solution treatment (950°C/20 min), and (f) solution treatment (950°C/40 min).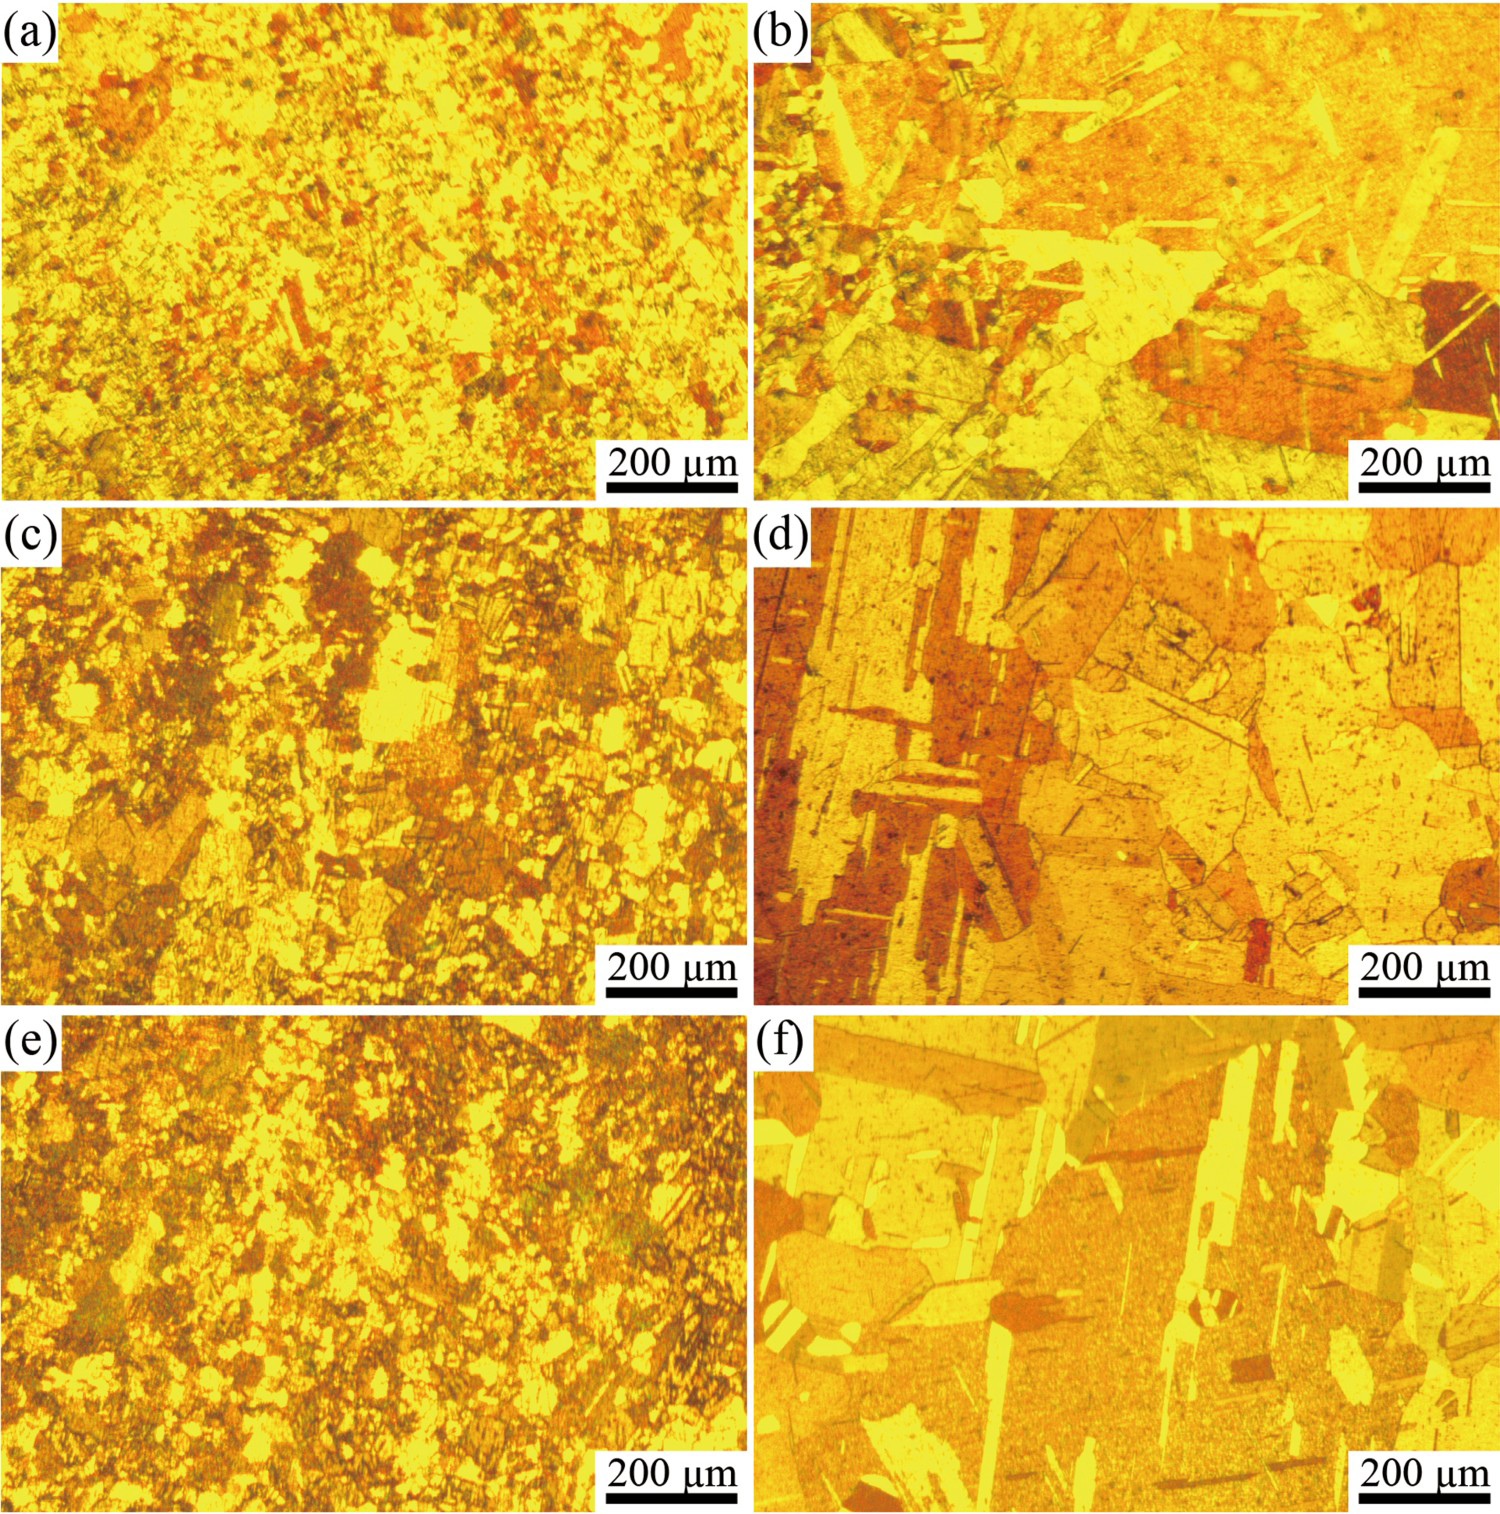
From Figures 3 and 4, it can be seen that the UC process alloy has no obvious growth of recrystallized grains as solution time is increased, while the HE process alloy grows abnormally. To further observe and analyse the reason for the abnormal crystal grain recrystallization caused by the process difference, we carried out SEM to visualise the microstructure following the various processes. Figure 5(a,c,e,g,i) shows longitudinal SEM images of the UC process alloy first draw following solution treatment for different periods of time (950°C/10, 20, 40, and 60 min), Figure 5(b,d,f,h,j) shows longitudinal SEM images of the HE process alloy first draw following solution treatment for different periods of time (950°C/10, 20, 40, and 60 min). It can be seen that after the first draw deformation, the second phase of the UC process alloy is distributed along the grain boundary as a long stripe. After solution treatment at 950°C/10 min, the second phase spheroids in the long stripe become granular. Because of the short solution time, the dissolution of the second phase is not obvious, a large number of granular second phases are retained at the grain boundaries, and the number of second phases at grain boundaries decreases with increasing solution time (950°C/20, 40, and 60 min). In addition, no abnormal grain growth is observed, and the grain size is approximately ∼20 µm. The structure of the HE process alloy is elongated after cold drawing, and the second phase is dispersed in the form of particles and distributed at the matrix and grain boundaries. As the solution time is extended (950°C/20, 40, and 60 min), the second phase at the alloy matrix and grain boundaries is significantly reduced, but the size of the second phase remains virtually unchanged.
SEM images of alloy microstructure following various treatments after the first draw. (a), (c), (e), (g), and (i) are longitudinal SM images of UC process alloys after solution treatment for different time periods (950°C/0, 10, 20, 40, and 60 min, respectively); (b), (d), (f), (h), and (j) are longitudinal SM images of HE process alloys after solution treatment for different time periods (950°C/0, 10, 20, 40, and 60 min, respectively).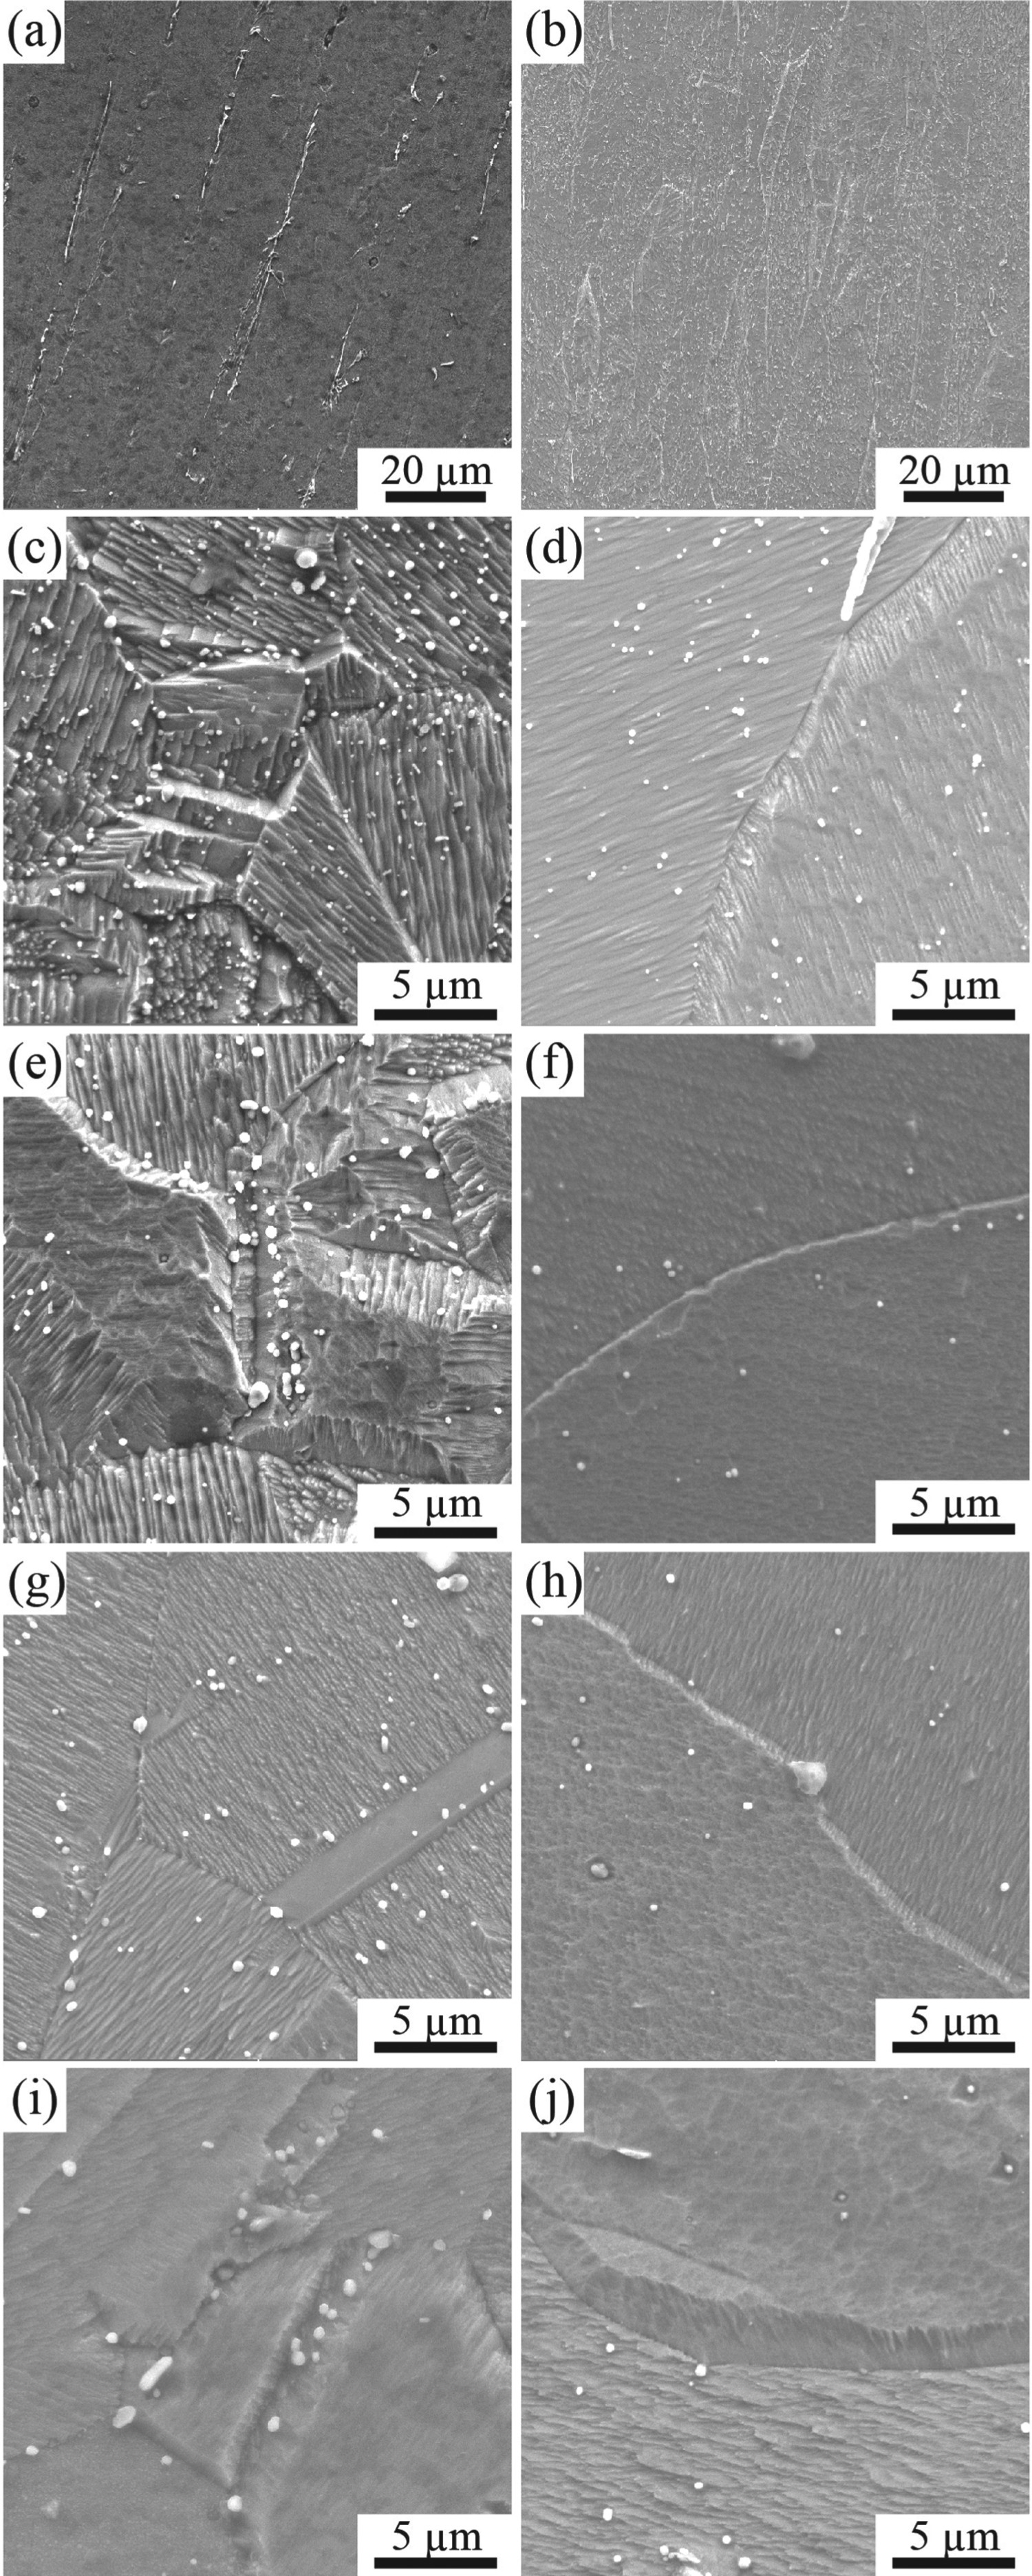
Figure 6(a,b) shows the TEM bright field image and the selected area electron diffraction spectrum of the UC process alloy after aging at 450°C/240 min; Figure 6(c,d) shows the TEM bright field image and the selected area electron diffraction spectrum of the HE process alloy after aging at 450°C/240 min. After aging at 450°C, the supersaturated solution treatment decomposes and the alloy elements dissociate in the form of atomic groups or precipitated phases [25], however, this is different to the second phase of the alloy before aging, at which point the precipitated phase is a nano-scale Cr phase. The second phase previously described is the remaining primary phase without complete solution. It can be seen from Figure 6(a,c) that the precipitation phase distribution and the amount of precipitates in the matrix of the two process alloys are essentially the same, there are a large number of fine dispersion distributions, the sizes of which are approximately 5–8 nm. In addition to the diffraction pattern of the fcc-Cu matrix, there is a second set of diffraction signals. After calibration, it was found that there is a bcc-Cr diffraction pattern in the [011]Cu crystal band axis after 450°C/240 min aging for both UC and HE process alloys.
Bright field images following 450°C/240 min aging and selected diffraction pattern of [011]Cu crystal axis. (a) Bright field image of UC process alloy; (b) Selected area diffraction pattern of a; (c) Bright field image of HE process alloy; (d) Selected area diffraction pattern of c.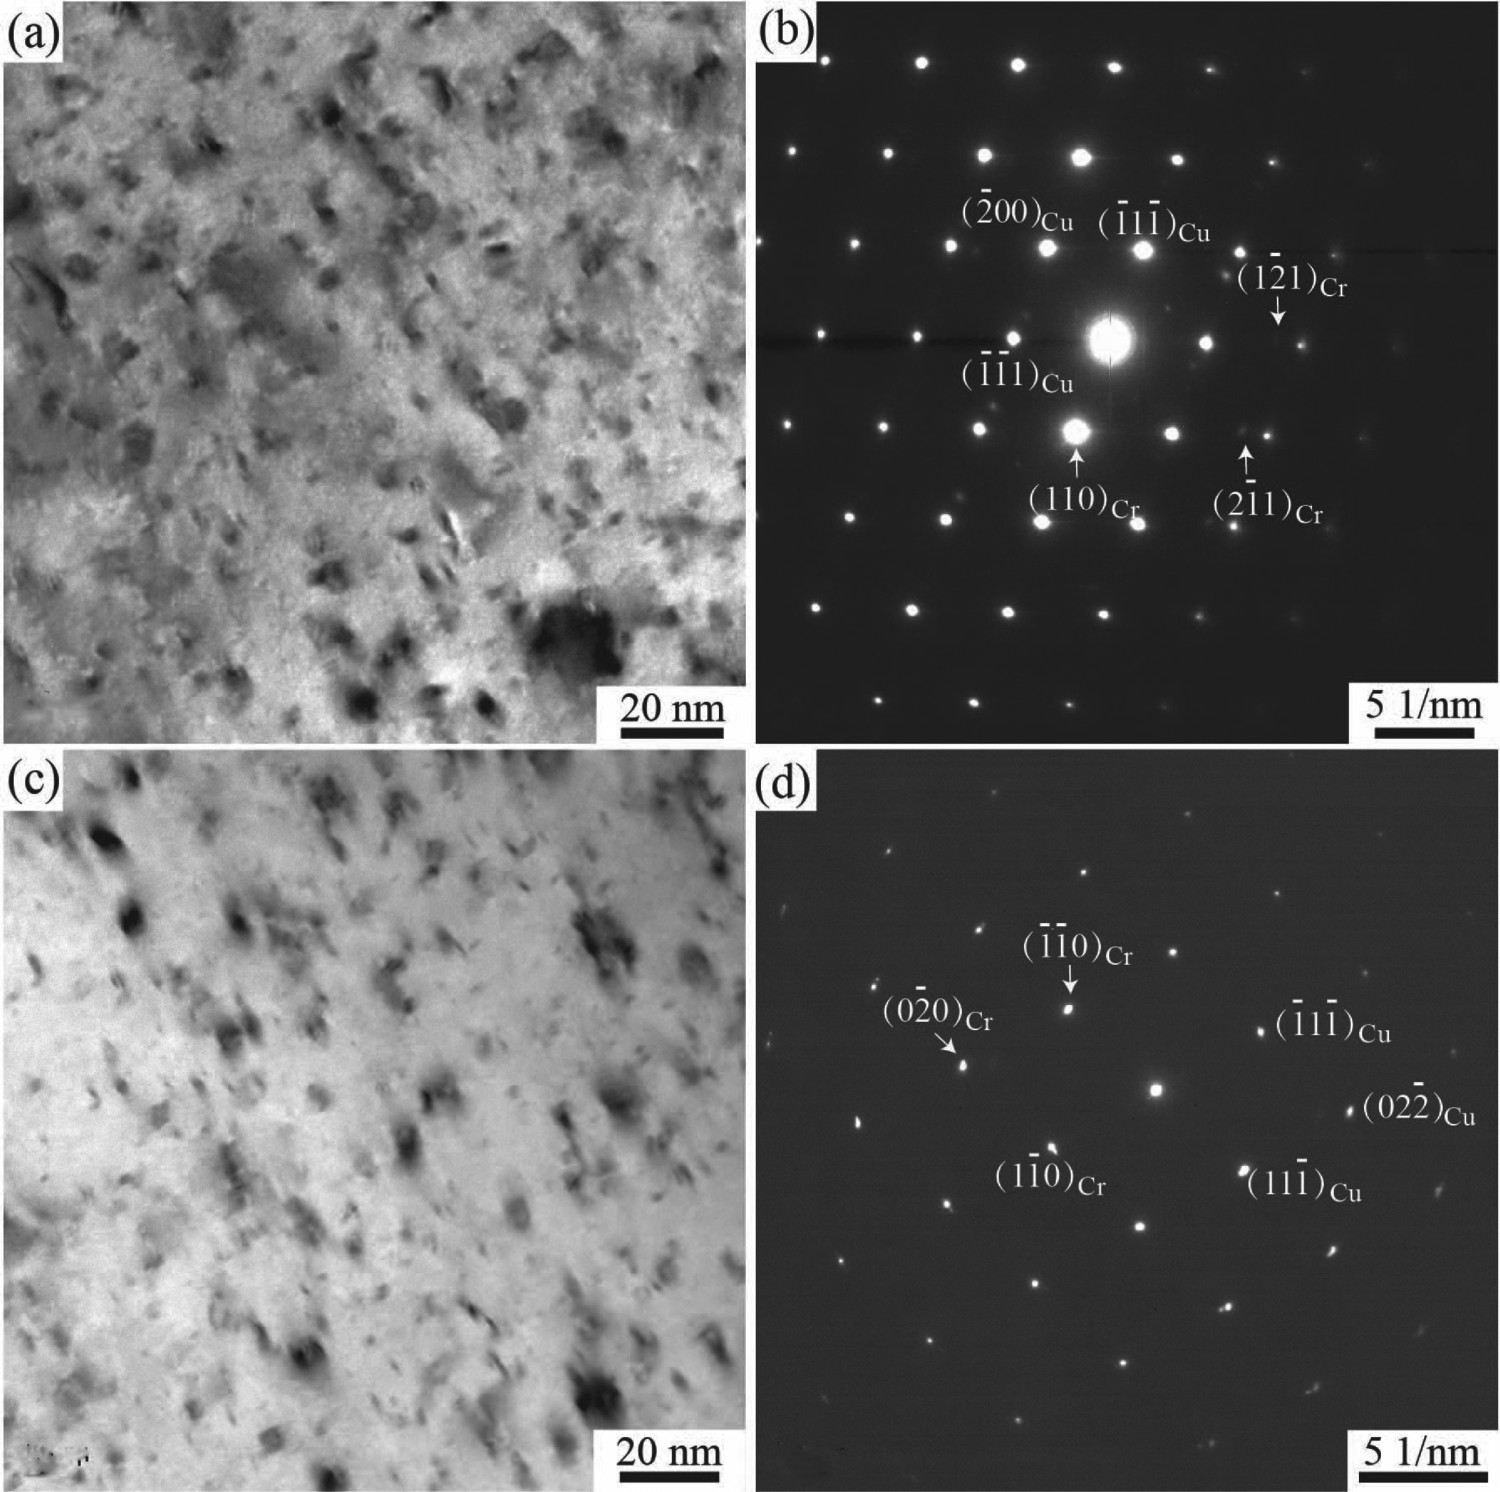
Discussion
In this study, Cu–Cr–Zr–Ti alloy was prepared using two different processes. The HE process included a hot extrusion deformation treatment that was not involved in the UC treatment. The subsequent cold deformation and heat treatments were the same for both alloys. Theoretically, the HE alloy should be stronger than the UC alloy, however, the test results revealed the opposite. The tensile strength of the UC process alloy after the final deformation heat treatment (∼621 MPa) was significantly higher than that of the HE process alloy (∼571 MPa), and the elongation of two process alloys was ∼5%. In response to this finding, we analysed the microstructure of the two process alloys in different states.
During the aging process, cold-deformed alloys exhibit aging strengthening and recovery softening, and the properties of the alloy are the result of the interaction between the two mechanisms. This led to the reduction of the strength of the UC alloy following 450°C/10 min aging in Figure 1(b). There is no clear difference in tensile strength between the two kinds of alloy after solution treatment, however, the grain size of the HE process alloy is unusually large, which means that the grain boundary migration is greater during the solution treatment. The results in Figures 3–5 show that the distribution and quantity of the second phase have a certain inhibitory effect on the migration of the grain boundaries. And the nanocrystalline precipitates of the two process alloys in Figure 6 are essentially the same in size and quantity, which means that there is no clear difference in the precipitation strengthening effect between the two processes. Based on the above analysis we believe that the quantity and distribution of the second phase are the important factors influencing the recrystallization grain growth.
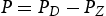
The net driving force of grain growth during recrystallization is the difference between the driving force of grain growth and the second relative grain boundary migration resistance:
The grain growth occurs after the initial recrystallization, which is a process of annexing large grains and small grains in a strain-free matrix, and the driving force is derived from the interfacial energy. The driving force of grain growth PD can be expressed as follows [26]:
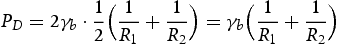
Think of the new recrystallized grain as a spherical grain of radius R, the recrystallized grains are almost equiaxed and can be approximated to R1 = R2 [27]:

The interfacial energy per unit area of γb is 0.6 J m−2 [28]. Equation (3) shows that PD increases with the increase of γb and decreases with the increase of curvature radius R of the grain boundary.
The alloy undergoes complete recrystallization after solution treatment, but whether the recrystallized grains grow is related to the existence of the second phase at the grain boundary. The second phase of the experimental alloy is located at the grain boundary and acts as a pinning effect on the grain boundary, which can be expressed by the formula [29]:

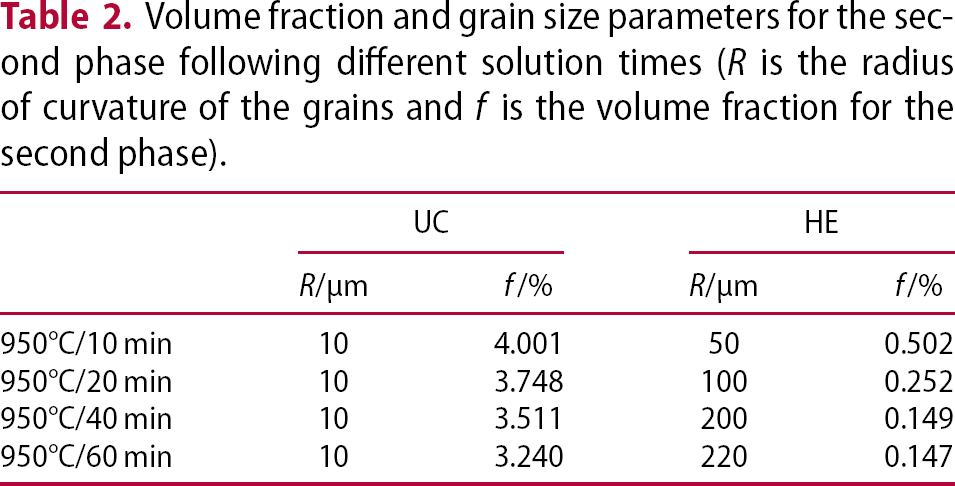
Volume fraction and grain size parameters for the second phase following different solution times (R is the radius of curvature of the grains and f is the volume fraction for the second phase).
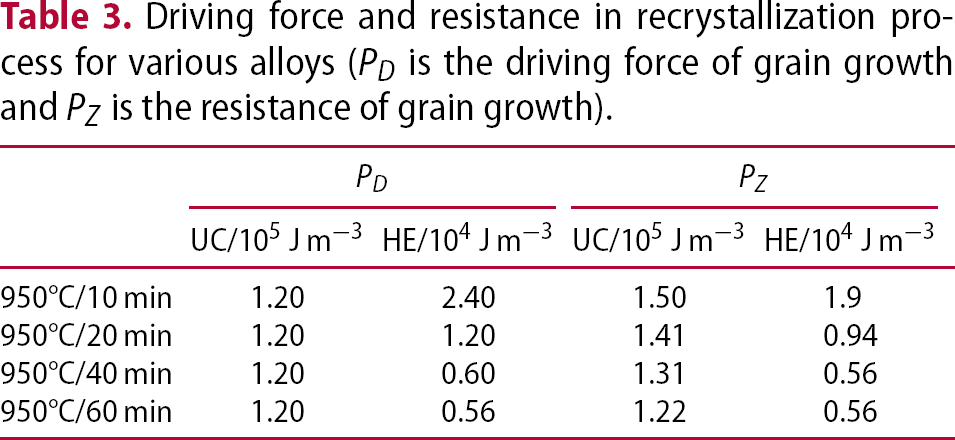
Driving force and resistance in recrystallization process for various alloys (PD is the driving force of grain growth and PZ is the resistance of grain growth).
The TEM images (Figure 6) show that there is no significant difference in the number and distribution of the precipitation of the alloys in the alloy peak aging, which means that the aging strengthening effects of the two processes are approximately the same. The UC process alloy exhibits fine equiaxed crystals after solution treatment, so the grain boundary strengthening effect is marked after the subsequent cold drawing, aging, cold drawing, and the strength is greater.
Conclusions
In this study Cu–Cr–Zr–Ti rods were prepared using two different casting methods. The tensile strengths of the rods prepared using the upward continuous casting process and casting-extrusion process were, 621 and 571 MPa, respectively. Less grain growth during solution treatment of the upward continuous casting rods was responsible for the finer microstructure, which led to higher tensile strength. For the upward continuous casting rods, the driving force was calculated to be ∼1.2 × 10⁵ J m−3, less than the resistance of grain boundary migration. However, the driving force was ∼2.4 × 10⁴ J m−3, greater than the resistance of 1.9 × 10⁴ J m−3, at the beginning of solution treatment for the casting-extrusion rods.